traffic AEE 250814 - hamilton.govt.nz · Ruakura Interchange – Assessment of Traffic Effects 4...
130
Waikato Expressway: Hamilton Section Ruakura Interchange Assessment of Traffic Effects
Transcript of traffic AEE 250814 - hamilton.govt.nz · Ruakura Interchange – Assessment of Traffic Effects 4...

Waikato Expressway: Hamilton Section
Ruakura Interchange Assessment of Traffic Effects


Ruakura Interchange – Assessment of Traffic Effects i
2-31695.00 | 25 August 2014 Opus International Consultants Ltd
Contents
1 Introduction ........................................................................................................1
1.1 Overview ................................................................................................................................. 1
1.2 Background ............................................................................................................................. 1
1.3 Context ................................................................................................................................... 3
1.4 Proposal ................................................................................................................................. 6
2 Existing Environment ........................................................................................ 8
2.1 Waikato Expressway ............................................................................................................. 8
2.2 Existing Ruakura Road South of ECMT Rail....................................................................... 8
2.3 Ruakura Landuse .................................................................................................................. 9
2.4 Existing Environment for Assessment of Traffic Effects .................................................... 9
3 General Approach to the Traffic Assessment ..................................................... 13
4 Traffic Flows on the Network ............................................................................14
5 Assessment of Intersections ............................................................................. 18
5.1 Ruakura Interchange On/Off ramp Terminals ................................................................. 18
5.2 Existing Ruakura Road/SH26 .............................................................................................19
5.3 Relocated Ruakura Road/Existing Ruakura Road (east) .................................................. 21
5.4 Relocated Ruakura Road/Silverdale Road/Port Access ................................................... 22
5.5 Relocated Ruakura Road/Existing Ruakura Road (west) ................................................ 24
5.6 Existing Ruakura Road/Vaile Road/Davison Road .......................................................... 26
5.7 Relocated Ruakura Road/Port Access East/Logistics ...................................................... 27
6 Effects on Existing Property Access .................................................................. 30
6.1 Ruakura Road and SH26 .................................................................................................... 30
6.2 Percival Road and Ryburn Road ........................................................................................ 30
7 Impact on Alternative Modes of Travel ............................................................. 33
7.1 Pedestrian and Cycle ........................................................................................................... 33
7.2 Passenger Transport Effects ............................................................................................... 34
8 Relocated Ruakura Road over or under Expressway ........................................ 34
9 Construction Traffic Effects ............................................................................. 35
10 Conclusion ....................................................................................................... 35
11 Proposed Designation Conditions .................................................................... 37
Appendix A: SIDRA Outputs (Intersection Performance Summary)

Ruakura Interchange – Assessment of Traffic Effects 1
2-31695.00 | 25 August 2014 Opus International Consultants Ltd
1 Introduction
1.1 Overview
The New Zealand Transport Agency (Transport Agency) proposes to alter the existing designation
for the Hamilton Section of the Waikato Expressway (Hamilton Section) and obtain additional
resource consents from Waikato Regional Council (WRC) in order to construct, operate and
maintain the Ruakura Interchange and connecting roads. The Ruakura Interchange was omitted
from the recent round of alterations to the designation, owing to a lack of certainty around future
growth plans for the area.
1.2 Background
1.2.1 Roads of National Significance
In July 2012, the Government Policy Statement on Land Transport Funding (GPS) was released,
which identified seven Roads of National Significance (RoNS), which are considered by the
Government to be New Zealand’s most important transport routes requiring significant development
to reduce congestion, improve safety and support economic growth. The Waikato Expressway (the
Expressway), which this alteration relates to, is one of the seven RoNS.
The purpose of listing particular roads as nationally significant was to ensure these priority roading
projects are fully taken into account in the development of the National Land Transport Programme.
The Government expects that planning for the future development of the land transport network
should reflect the importance of these roads from a national perspective and the need to advance
them quickly.
1.2.2 Waikato Expressway
The Expressway will extend from the Bombay Hills in the north to just south of Cambridge. The
Expressway has been divided into 12 sections. It is expected the Expressway will:
» Improve economic growth and productivity for Auckland, Waikato and Bay of Plenty through
more efficient movement of people and freight between Auckland, Hamilton, Tauranga and
Rotorua;
» Improve the reliability of the transport network by providing a more robust and safer road
network between Auckland, Hamilton, Tauranga and Rotorua;
» Reduce travel times between Waikato and Auckland; and
» Support the growth strategy for the central Waikato.
1.2.3 Hamilton Section
The Hamilton Section is located on the eastern side of the city of Hamilton and adjoins the
Ngaruawahia Section to the north (at the Hamilton Northern Interchange), and the Tamahere
Interchange to the south. It is approximately 22km in length. Figure 1-1 below shows the location of
the project.

Ruakura Interchange – Assessment of Traffic Effects 2
2-31695.00 | 25 August 2014 Opus International Consultants Ltd
Figure 1-1: Waikato Expressway Hamilton Section – Proposed Scope of Works

Ruakura Interchange – Assessment of Traffic Effects 3
2-31695.00 | 25 August 2014 Opus International Consultants Ltd
1.3 Context
1.3.1 Current designation and resource consents
The Hamilton Section was first designated in 2005, following an appeal before the Environment
Court in 2004. In October 2013, the Transport Agency lodged Notices of Requirement (NORs) to
alter the designation in a number of discrete locations. Applications for resource consent to
construct, operate and maintain the Hamilton Section were also lodged at that time. Both resource
consents and NORs were heard by independent Commissioners at a joint hearing in April/May
2014.
Of particular interest with respect to traffic, is:
• the inclusion of a new Resolution Drive Interchange to connect with the city’s future Resolution
Drive extension north of Borman Road. Whilst a full interchange has been designated (although
under appeal) the Transport Agency intends to initially construct the north facing ramps only,
• A realignment of the Greenhill link road between the Greenhill Interchange and the Wairere
Dr/Gordonton Rd roundabout,
• Inclusion of a grade separated interchange (Southern Interchange near Cherry Lane) to provide
access for southbound city traffic on Cambridge Road, and
• Inclusion of a new East/West connection between Cherry Lane/Bollard Rd area and Birchwood
Lane connecting the eastern and western sectors of the Tamahere community.
The Commissioners’ decision on the resource consents was notified on 1 July 2014. This granted all
consents applied for, subject to conditions. A recommendation from the Commissioners was
released on 30 June 2014 with respect to the notices of requirement. This was also granted subject
to a set of recommended conditions. The Transport Agency accepted the recommendation with
only minor modifications on 8 July 2014. Two appeals have been lodged, in relation to Alterations
U (Resolution Drive Interchange) and Z (Southern Interchange near Cherry Lane).
1.3.2 Ruakura Structure Plan (RSP)
Recent boundary changes between Hamilton City Council (HCC) and Waikato District Council
(WDC) have meant that a significant area of land at Ruakura is now within the jurisdiction of HCC.
The development of this land is identified in a number of high level documents including: the
Hamilton Urban Growth Strategy, the Access Hamilton Transport Strategy and the Waikato
Proposed Regional Policy Statement.
To enable the progressive development of this area, the Ruakura Structure Plan (RSP) was developed
and notified as part of the Hamilton City Proposed District Plan (PDP) in December 2012. The RSP
(as notified) includes an inland port, freight and logistics hub and other industrial land. The inland
port as proposed in the RSP has an intermodal facility so that freight can be transferred to and from
road and rail. The RSP also provides for research and innovation activities, and residential areas for
an eventual population of approximately 1,800 households, including the development of a
neighbourhood centre.
Submissions and further submissions have been received on the RSP, however hearings and a
decision have been deferred, pending the outcome the Ruakura Private Plan Change (PPC).

Ruakura Interchange – Assessment of Traffic Effects 4
2-31695.00 | 25 August 2014 Opus International Consultants Ltd
1.3.3 Ruakura Private Plan Change (PPC)
Tainui Group Holdings Limited (TGH) is the predominant landowner affected by the RSP. It was
identified that rules in the Hamilton District Plan: Waikato Section (as transferred over from the
WDC’s District Plan) prohibit any application being made for urban development within this area.
Given that the WDC rules are currently operative, they continue to apply until the PDP (including
the RSP) is made operative. Given the potential for lengthy delays, TGH have sought a PPC for
what is known as the Ruakura Development, through the Environmental Protection Authority
(EPA). The PPC affects some, but not all, of the land subject to the RSP.
The PPC does not re-zone any land, rather it proposes to adopt mechanisms providing an overlying
‘schedule’. This allows a range of activities to be undertaken in identified areas, as well as existing
rural activities.
The key aspects of the PPC are as follows:
• A new ‘Schedule 25H Ruakura’ inserted into Chapter 25: Rural of the PDP, which provides a
Ruakura Logistics Area (incorporating the Inland Port), Ruakura Industrial Park Area,
Knowledge Area, Residential Areas and Open Space Areas along with indicative roads.
• Amendments to the Prohibited Activity rules to enable the planning and development of the
land covered by Schedule 25H, including the future road network.
On 31 July 2013, a ministerial direction was released, referring the PPC request to a Board of
Inquiry (BOI). On 5 August 2014, the BOI issued its draft decision approving the PPC, subject to a
number of amendments to the proposed objectives, policies and rules, as they would apply to the
Ruakura Development. Comments on the draft decision close during the week commencing 1
September 2014, and a final decision is due on 11 September 2014.
The PPC will enable development to occur in the interim, but it is intended that the PPC will also be
incorporated into the framework of the PDP, once the PPC has been confirmed. Accordingly, the
RSP contained within the notified PDP is likely to be superseded by the Board’s decision on the
PPC.

Ruakura Interchange – Assessment of Traffic Effects 5
2-31695.00 | 25 August 2014 Opus International Consultants Ltd
Figure 1-2: Ruakura Schedule Area as approved by the BOI in its draft decision

Ruakura Interchange – Assessment of Traffic Effects 6
2-31695.00 | 25 August 2014 Opus International Consultants Ltd
1.4 Proposal
1.4.1 NOR – Alteration to Designation
The Transport Agency is now proposing to alter the designation for the Hamilton Section to include
a new interchange at Ruakura (in lieu of the half-diamond interchange previously designated at
SH26), which includes a relocated Ruakura Road. The scope of the designation sought is shown in
Figure 1-3 below.
Figure 1-3: Diagram of Proposed Alteration to Designation
The altered designation includes the following:
• Widening of the existing Expressway designation to accommodate the Ruakura Interchange
ramps, connecting roundabouts, and stormwater wetland;
• Closure of the existing Ruakura Road either side of the Expressway and consequently
shortening of the proposed bridge that spans over the East Coast Main Trunk (ECMT) rail line
and Ryburn Road;
• Retention of the existing Ruakura Road on both sides of the Expressway in order to provide
continued property access to residents on Ruakura Road, including access to Percival and
Ryburn Roads as is currently provided;
• Relocation of Ruakura Road between the Ruakura Road/Silverdale Road intersection and the
existing Ruakura Road near the Vaile Road intersection to connect with the proposed Ruakura
Interchange, including:
Percival Road
Relocated Ruakura Road
Ruakura Interchange

Ruakura Interchange – Assessment of Traffic Effects 7
2-31695.00 | 25 August 2014 Opus International Consultants Ltd
» Existing Ruakura Road/Silverdale Road intersection closed via a cul-de-sac (road retained
for access) and creation of a new relocated Ruakura Road/Silverdale Road signalised
intersection. This will include a stub road for access into the Inland Port area;
» New relocated Ruakura Road/Existing Ruakura Road (west) priority controlled Tee
intersection;
» New Relocated Ruakura Road/Inland Port cross road signalised intersection located
immediately west of the Ruakura Interchange;
» Provision of a tee intersection where the relocated Ruakura Road meets the existing
Ruakura Road (east);
» Upgrading the existing Ruakura Road, largely within its existing boundaries, between the
new intersection with the relocated Ruakura Road (east) and the Ruakura Road/SH26
intersection (this will include shape correction of the roadway, carriageway widening,
provision of a footpath and drainage improvements);
» Extension of the designation to cover the existing Ruakura Road (from the intersection with
the relocated Ruakura Road up to SH 26) so upgrading works can be undertaken;
» Provision for the relocated Ruakura Road to pass either over or under the Expressway; and
» Provision for stormwater detention, treatment and discharge (attenuation and disposal)
from the relocated Ruakura Road and Ruakura Interchange.
Detailed designation plans are provided in the NOR.
The relocated Ruakura Rd west of the Expressway will become a local road, whereas the section of
road to the east will become State Highway as will the section of existing Ruakura Road through to
State Highway 26.
1.4.2 Resource Consents
The Transport Agency is also seeking additional resource consents from the WRC to construct,
operate and maintain the connecting roads (being the relocated and existing Ruakura Road). The
Ruakura interchange ramps and associated earthworks are covered by the existing Hamilton Section
consents granted on 1 July 2014.
As the consents required for the Ruakura Interchange relate to Water Permits and discharge
permit, there are no traffic effects to consider.

Ruakura Interchange – Assessment of Traffic Effects 8
2-31695.00 | 25 August 2014 Opus International Consultants Ltd
2 Existing Environment
The Resource Management Act 1991 (RMA) requires an assessment of the actual and potential traffic
effects on the environment resulting from the proposed designation. In order to identify these
impacts the existing environment needs to be clearly articulated.
2.1 Waikato Expressway
The Expressway designation currently passes through the Ruakura area in a north-south direction
and enables the construction of a four-lane Expressway with north facing on/off ramps at SH26.
Further afield the designation includes:
• Resolution Drive Interchange with north facing ramps (currently under appeal by one
submitter). The interchange will connect to the HCC arterial road network via the proposed
extension of Resolution Drive from Borman Road to the expressway,
• A direct connection between the Greenhill Interchange and Wairere Drive via the Greenhill
Arterial (recent alteration to designation)
• Southern Interchange and East/West link (designation currently under appeal by one land
owner relating to property impacts).
For the purposes of this assessment, the Expressway in conjunction with the above designations is
considered part of the existing environment. Regardless of whether the Resolution Drive appeal is
successful or otherwise, it is not considered to affect the traffic assessment of the Ruakura
Interchange.
2.2 Existing Ruakura Road South of ECMT Rail
The land to the east of the Expressway is zoned Rural in the Waikato District Plan. The portion of
land between the ECMT and Davison Road is characterised by large open paddocks and scattered
buildings, including some dwellings. From Davison Road south, there is significantly more rural-
residential development. The Dairy NZ/LIC site is located on the corner of Ruakura Road and SH26.
Ruakura Road itself is identified as an Arterial Road in the Waikato District Plan (WDP). Arterial
roads have the following functions:
• Form a strategic network of regional importance,
• Provide for the collection and distribution of goods significant to the regional economy,
• Rural roads that typically provide for more than 2,500 vehicle movements per day,
• Include rest areas, and
• predominately cater for through traffic.
In year 2012 Ruakura Road carried 5,100vpd between Silverdale Road and Holland Road and
2,900vpd between Holland Road and SH26, based on existing WDC traffic count data. The existing
sealed carriageway width is between 7m to 8m consisting of two 3.5m traffic lanes and a narrow
shoulder, which in some locations is non-existent. The road has a deep drain on the eastern side
and virtually no drainage on the western side.

Ruakura Interchange – Assessment of Traffic Effects 9
2-31695.00 | 25 August 2014 Opus International Consultants Ltd
2.3 Ruakura Landuse
The land immediately west of the Expressway is currently zoned Rural in the Hamilton District Plan:
Waikato Section and is currently in pasture, with scattered dwellings and farm buildings. However
this area which is covered by the Ruakura Private Plan Change was the subject of a recent Board of
Inquiry. On the 5th August the Board issued its draft report in favour of the PPC.
On this basis, the land use will be extensively altered in the future and before the Hamilton Section
of the Waikato Expressway is operational. For instance the area bounded by the ECMT rail, Ruakura
Road and Silverdale Road is to be developed as an Inland Port and Logistics Centre as indicated in
Figure 1-2 above.
The PPC sets out a number of policies and staging rules relating to development within the PPC
area. Two that affect this traffic assessment, are:
• Stage 1, can occur prior to the Hamilton Section being operational. This allows up to 80ha of
development to occur without the need to relocate Ruakura Road. However intersection
upgrades of Ruakura Road/Silverdale Road and Ruakura Road/Knighton Road are expected to
occur prior to year 2021 as provided under the Stage 1 rules, and
• Stage 2, can only occur when the Hamilton Section is operational, inclusive of a Ruakura
Interchange and the Greenhill Arterial. At this point in time, Ruakura Road would be closed
(and replaced by a relocated Ruakura Road) in order to facilitate the railway spur needed for
the Inland Port.
Traffic evidence has been provided to the BOI in conjunction with all other environmental
specialists’ evidence covering the effects resulting from the PPC.
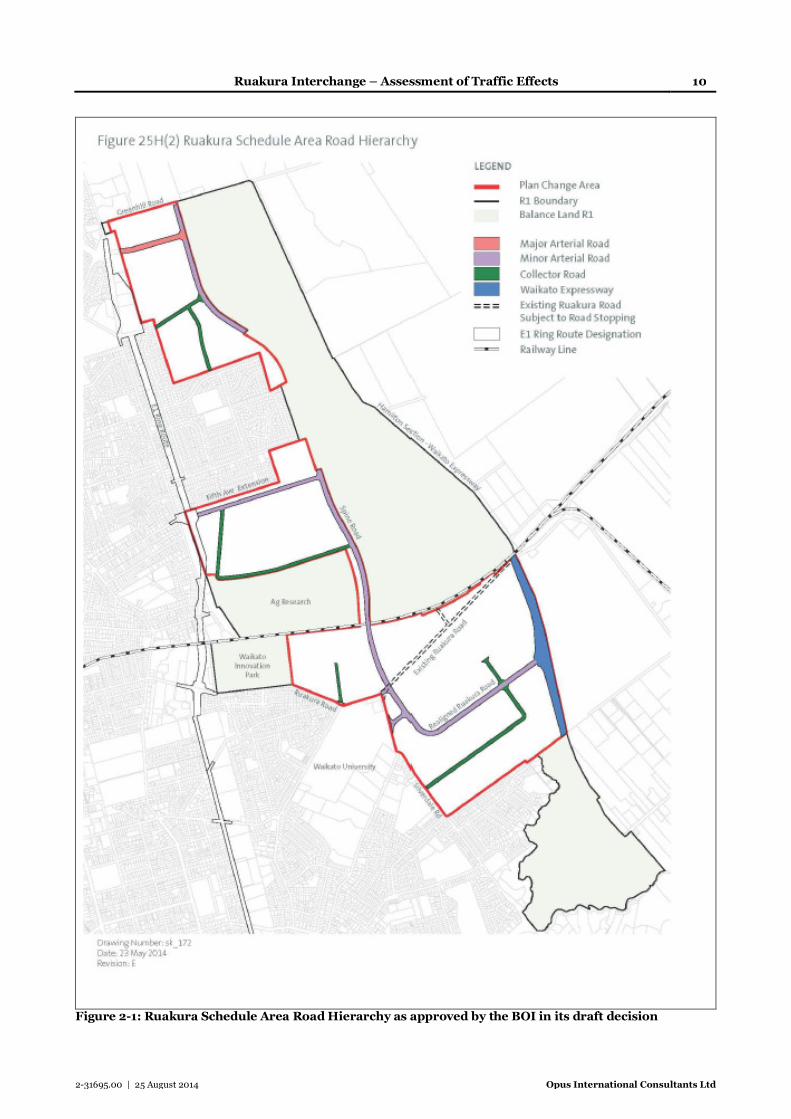
2.4 Existing Environment for Assessment of Traffic Effects
Although any activity within the PPC requires a Land Development Plan, it is considered
reasonable to assume that the existing environment for the purpose of assessing the effects of the
Ruakura Interchange NOR will consist of the landuse activities indicated on Figure 1-2 above and
road hierarchy shown on Figure 2-1 below. The Ruakura NOR traffic assessment therefore takes
into consideration the PPC when determining the 2021 and 2041 existing traffic baseline. On this
basis the traffic baseline is considered to be as follows;
• Landuse will reflect that shown on Figure 1-2 above with the associated traffic generation as
prescribed in the PPC and presented in evidence during the BOI,
• The baseline road network will reflect Figure 2-1 above which indicates the road hierarchy as
outlined and examined during the BOI. Although this indicates a realigned Ruakura Road
between Silverdale Road and the Expressway, the existing Ruakura Road can remain open
when the Inland Port and Logistics area is developed under the Stage 1 rules. Hence, in the
traffic baseline the Inland Port and Logistics area connect to the wider network (Holland Road
and SH26) via the western section of Relocated Ruakura Road and the existing Ruakura Road,
and
• Intersection upgrades at Knighton and Silverdale roads to traffic signals. These upgrades were
considered in detail during the BOI, and both lie within the PPC area on which the BOI has
made its draft decision.
Ruakura Interchange – Assessment of Traffic Effects 10
2-31695.00 | 25 August 2014 Opus International Consultants Ltd
Figure 2-1: Ruakura Schedule Area Road Hierarchy as approved by the BOI in its draft decision

Ruakura Interchange – Assessment of Traffic Effects 11
2-31695.00 | 25 August 2014 Opus International Consultants Ltd
The different road networks for the traffic baseline and NOR are shown below on Figure 2-2 to
Figure 2-5. Note the Spine Road north of the ECMT rail is expected to be constructed post year
2021 as the Ruakura Development progresses.
Figure 2-2: Year 2021 Baseline – SH26 north facing ramps to Expressway & Ruakura Rd open
Figure 2-3: Year 2021 NOR – Ruakura Interchange & Relocated Ruakura Road
N
N

Ruakura Interchange – Assessment of Traffic Effects 12
2-31695.00 | 25 August 2014 Opus International Consultants Ltd
Figure 2-4: Year 2041 Baseline – SH26 north facing ramps to Expressway & Relocated Ruakura Rd
Figure 2-5: Year 2041 NOR – Ruakura Interchange & Relocated Ruakura Rd
N
N

Ruakura Interchange – Assessment of Traffic Effects 13
2-31695.00 | 25 August 2014 Opus International Consultants Ltd
3 General Approach to the Traffic Assessment
The traffic flows have been determined using the Waikato Regional Transportation Model
(WRTM). This model has been developed by a consortium of road controlling authorities, known as
Local Authority Shared Services (LASS), which includes the majority of local authorities within the
Waikato Region and the NZTA.
The WRTM has a validated 2006 network and two forecast years being 2021 and 2041. The model
was peer reviewed as fit for purpose by Flow Transportation Specialists on behalf of the LASS.
Morning and afternoon peaks (as 2 hour periods) are modelled in conjunction with an interpeak
period (also 2 hours), which when compiled together provide an estimate of the average daily flow.
Traffic flows are available for all-vehicle types or just the heavy vehicle component. The latter has
been used to determine the percentage of Heavy Commercial Vehicles (HCV) for the intersection
analysis.
Traffic flows have been extracted from the project models referred to as Networks 35 and 36. Both
these networks adopt the PPC Landuse, and recent Alterations to Designation which have already
been confirmed by the Transport Agency. Network 35 reflects the road layout shown on Figure 2-2
and Figure 2-4 (north facing ramps at SH26), whilst Network 36 reflects Figure 2-3 and Figure 2-5
(Ruakura Interchange).
Key junctions within the Ruakura area have been subjected to a detailed assessment of the likely
operating level of service (LOS) resulting from the Notice of Requirement (NOR). The key
intersections are considered to be:
• Existing intersection of Ruakura Rd/SH26 (cross road), Vaile Rd/Ruakura Rd and Holland
Rd/Ruakura Rd,
• The new intersection of Relocated Ruakura Rd/Existing Ruakura Road (east), the Ruakura
Interchange ramp terminal junctions, the Relocated Ruakura Rd/Silverdale Rd intersection,
Relocated Ruakura Rd/Port Access Rd and
• The revised intersection layout at Ruakura Road/Silverdale Road (2021) when the Spine Road
is added in the year 2041 network.
Intersection capacity and LOS has been determined using the SIDRA modelling software based on
year 2021 and 2041 peak hour flows. Where zero flows were predicted by the WRTM, a nominal
number of vehicles has been used in the SIDRA assessment (generally 5 vehicles/hour/movement)
The SIDRA modelling parameters adopted for the assessment include:
• use of peak hour factors (0.95) with a 30min peak period,
• heavy vehicle content based on predictions from the project traffic models,
• lane capacity values based on the SIDRA software recommendations,
• Level of Service based on the Highway Capacity Manual intersection delays for the intersection
type being assessed. The assessment of the roundabout LOS adopts the same criteria as used
for traffic signals

Ruakura Interchange – Assessment of Traffic Effects 14
2-31695.00 | 25 August 2014 Opus International Consultants Ltd
4 Traffic Flows on the Network
Traffic flow diagrams have been created to illustrate the change in daily 2021 and 2041 traffic
volumes on key routes most likely to be affected by the Ruakura Interchange. The four figures
below represent daily flows on the Baseline and NOR networks.
On Figure 4-1 to 4-4:
• The Traffic Flows are shown as Total Daily Flows (vpd), and Daily Heavy Commercial Flows
(hcvpd). Black numbers represent the baseline, and red numbers the NOR, and
• The baseline road network is shown in Blue (Network 35), and the NOR change shown in red
(Network 36).
Figure 4-1: Predicted 2021 All Day Traffic Flows on Baseline and NOR
In general Figure 4-2 indicates the following traffic impacts as a result of the NOR:
• An increase in flow on Cambridge Road (+1300 cars/day) which is considered acceptable and
shouldn’t have more than minor effects as the percentage increase is small at +5.6%. There is
no increase in the number of heavy vehicles.

Ruakura Interchange – Assessment of Traffic Effects 15
2-31695.00 | 25 August 2014 Opus International Consultants Ltd
Figure 4-2: Predicted 2021 All Day Traffic Flow difference
• Some increased flow on Silverdale Road at its northern end (+800 vpd) although a reduction in
the number of heavy vehicles (-200hcvpd). At the southern end the flow decreases by -1100vpd
and -300hcvpd. This reduction is a positive impact as it reduces traffic past the school site
thereby improving safety. The changes in traffic flow on Silverdale Road are considered to be
due to local residents either side of Silverdale Road who switch directions to access the
expressway. Also of some significance is the reduction in the number of heavy vehicle
movements along the entire length of Silverdale Road (-200hcvpd to -300hcvpd). Overall, the
effects are considered slightly positive.
• Flows on Ruakura Road between the relocated Ruakura Road intersection and SH26, is
expected to increase by +2700vpd (of which +700 are heavy vehicles). It is worth noting that
although the predicted volume in year 2021 is 4,200vpd, this is only +1300vpd over the current
traffic volume (2,900vpd) on Ruakura Road. Whilst the increase will be noticeable by local
residents the daily flow is easily accommodated on a two lane rural arterial roadway. As the
road will be upgraded (wider carriageway, full sealed shoulder widths and shape corrected
pavement) the traffic impacts are not considered to be more than minor.
• Small reduction in traffic flows (including trucks) through the congested Morrinsville
Road/SH1 roundabout in Hillcrest.

Ruakura Interchange – Assessment of Traffic Effects 16
2-31695.00 | 25 August 2014 Opus International Consultants Ltd
Figure 4-3: Predicted 2041 All Day Traffic Flows on Baseline and NOR
Figure 4-4: Predicted 2041 All Day Traffic Flow difference

Ruakura Interchange – Assessment of Traffic Effects 17
2-31695.00 | 25 August 2014 Opus International Consultants Ltd
In general Figure 4-4 indicates the following traffic impacts in year 2041 due to the NOR:
• The Ruakura Interchange attracts an additional 4,700vpd (1,100 hycvpd) onto the southern
portion of the Hamilton Section of the expressway which is an increase of +32%. This is
considered a positive effect as it reduces traffic flows on Cambridge Road and at the western
end of SH26, thereby significantly reducing daily flows through the congested Morrinsville
Road/SH1 roundabout.
• Similarly, the interchange attracts an additional 1,500 hcvpd onto the section of expressway
immediately north of the Ruakura Interchange. This is a positive effect as it significantly
reduces the number of heavies on the Spine Road which would otherwise traverse through
residential areas in the northern part of the RSP.
• The Relocated Ruakura Road shows a significant increase in predicted traffic flows either side
of the expressway, because of its direct connection to the expressway. This is not considered
detrimental to the operation of the network as Relocated Ruakura Road is located within the
industrial area of the PPC and will be constructed at the outset to cope with the expected traffic
flows. The increase on Relocated Ruakura Rd is however offset by a positive reduction in traffic
flows on the Spine Road and the Greenhill Arterial connection.
• Ruakura Road between Vaile Road and SH26 is expected to increase by 1,800 vpd as traffic
from SH26 uses the existing Ruakura Road to access the Ruakura Interchange. The majority of
this increase consists of light vehicles (+1,600vpd). As discussed above, the daily flow in year
2041 will be easily accommodated by the proposed improvements to Ruakura Road.
• Relocated Ruakura Road between the interchange and the main entrance to the proposed Port
site will increase by approximately 8,400vpd. A significant portion of this consists of heavy
commercial vehicles (2,600hcvpd). This increase is due to the improved connectivity between
the Port and the expressway, and the corresponding reduction in traffic using the Spine Road
and the Greenhill Interchange.
It is concluded that the overall effects on the transport network from the change in traffic flows are
no more than minor. The NOR also encourages the “right traffic” onto the “right roads”. That is,
heavy vehicles have direct access from the Port to the expressway and therefore do not need to
traverse through city roads (such as Wairere Drive, Cambridge Road, or the Spine Road) to access
the Greenhill Interchange or Southern Interchange (near Cherry Lane in Tamahere).

Ruakura Interchange – Assessment of Traffic Effects 18
2-31695.00 | 25 August 2014 Opus International Consultants Ltd
5 Assessment of Intersections
Acceptable levels of service (LOS) at the intersections have been set by the Project objectives and
the recent Ruakura BOI. This can be summarised as follows:
• All expressway related intersections shall have LOS C or better at the design year (2041), and
• All intersections within the PPC shall have a LOS D or better 10years after opening.
The assessment below uses the SIDRA software to determine the overall LOS and individual
movements. Whilst both year 2021 and 2041 traffic flows have been assessed only the year 2041
results are included within this section of the report. However, intersection summary results are
included for all assessments in Appendix A of this report.
Although the SIDRA results have been tabulated as per the software output this in no way indicates
a high level of accuracy with the results. Intersection delays include the geometric delay component
associated with turning vehicles negotiating the intersection. The LOS for roundabouts is based on
the same criteria as that used for traffic signals as per the standard approach adopted by the
software.
5.1 Ruakura Interchange On/Off ramp Terminals
The NOR layout proposes two new roundabouts on Relocated Ruakura Road to serve the
expressway off and on-ramps. The roundabouts are expected to be about 35m in diameter to cater
for the large number of heavy vehicles that are expected to use the interchange. The speed limit on
Relocated Ruakura Road is likely to be 60km/h west of the eastern roundabout. Intersection sight
lines to and from the roundabouts will be in accordance with the relevant design standards.
Traffic Assessment
Using the SIDRA software, both the off-ramp and on-ramp configurations can adequately cope
with the excepted year 2021 and 2041 peak period flows, providing a likely level of service between
A and B (as shown in Table 5-1). The overall traffic effect is therefore less than minor.
Intersection Approach Movement Demand Flow (vph)
Average Delay
(seconds)
95%ile Queue (m)
LOS
AM PM AM PM AM PM AM PM
Eastern
Roundabout East Ruakura Road 342 251 8 10 15 2 A A
North – Off Ramp 349 301 11 15 15 2 B B
West Ruakura Road 215 682 6 7 0 0 A A
Western
Roundabout South – Off Ramp 38 143 10 9 3 1 A A
East Ruakura Road 552 379 4 5 0 0 A A
West Ruakura Road 349 955 4 4 2 7 A A
Table 5-1: Ruakura Interchange On and Off Ramp Predicted Intersection Delays at Year 2041

Ruakura Interchange – Assessment of Traffic Effects 19
2-31695.00 | 25 August 2014 Opus International Consultants Ltd
Intersection Safety
It is recognised that the addition of two new roundabouts on Relocated Ruakura Road will pose
some additional safety risk on previous users of the existing Ruakura Road due to the introduction
of new vehicle conflicts which do not exist in the base case. However, the NOR removes the need
for the two Tee intersections on SH26 that are part of the baseline (existing designation).
Accordingly, an assessment of the comparative safety effect has been conducted using available
crash prediction models. This indicates that although there is a potential for more injury crashes
with the NOR, the lower speed on Relocated Ruakura Road (60km/h) should result in an overall
lower social cost per injury crash (as injuries are less severe) as shown in Table 5-2 below. Hence,
there is a likely positive effect from the NOR with regards crashes at this junction.
Baseline (Tee-intersections in 80km/h )
NOR (RAB’s in 60km/h)
Predicted Injury crashes/year 0.587 0.837 Social Cost per Injury $427,000 $195,000
Total Cost/yr. $251,000 $163,000 Table 5-2: Comparison of predicted Accident Cost for Baseline and NOR.
5.2 Existing Ruakura Road/SH26
Traffic modelling shows that traffic movement flows will change at this intersection due to the
NOR. Although the existing intersection has been the site of a number of fatalities over the past
three years, there appears to be no capacity issues. The existing SH26/Ruakura Road/Lissette
Road intersection provides a fully dedicated right turn bay. Sight distance is also considered to be
more than adequate for the 80km/h speed environment.
Figure 5-1: Location Map of Ruakura Road/SH26/Lissette Road Intersection

Ruakura Interchange – Assessment of Traffic Effects 20
2-31695.00 | 25 August 2014 Opus International Consultants Ltd
Traffic Assessment
Traffic modelling indicates that in year 2021 the NOR is expected to increase the total intersection
flow by around +200vpd (+18%). Despite the increase the average vehicle delay is not expected to
increase by more than 1 or 2 seconds/vehicle. The worst movement has a LOS D (right turn out of
Ruakura Rd) which is the same for the Baseline and NOR.
In year 2041, during the peak periods, the overall intersection flows are expected to decrease
slightly although the “right turn into” and “left turn out of” Ruakura Road will increase as shown in
Table 5-3 and 5-4. The green highlighted cells indicate an improvement, whilst the red cells show a
disbenefit. The Baseline and NOR both perform equally with an overall intersection LOS A
although under the NOR, Ruakura Road movements are expected to operate at LOS E (36secs/veh)
which is a noticeable improvement over the Baseline LOS F (57secs/veh). Overall, the traffic effect
of the NOR on the intersection performance is expected to be positive.
Approach
Demand Flow (vph) Deg Sat
Average Delay (s/veh) 95% Queue (m)
Baseline NOR Baseline NOR Baseline NOR Baseline NOR
Lissette Rd
Left 5 5 0.07 0.06 23 21 2 1
Through 5 5 0.07 0.06 22 21 2 1
Right 5 5 0.07 0.06 22 21 2 1
Sh26 westbound
Left 5 5 0.24 0.21 7 7 0 0
Through 446 393 0.24 0.21 0 0 0 0
Right 119 159 0.14 0.16 9 8 4 5
Ruakura Rd
Left 34 74 0.05 0.09 12 12 1 3
Through 5 5 0.67 0.47 56 36 25 15
Right 89 81 0.67 0.47 56 36 25 15
Sh26 eastbound
Left 143 91 0.08 0.05 7 7 0 0
Through 271 239 0.15 0.13 3 2 10 8
Right 5 5 0.15 0.13 9 9 10 8
Overall 1134 1067 0.67 0.47 8 7 25 15
Table 5-3: Existing Ruakura Road/SH26/Lissette Road Intersection 2041 AM peak
Approach
Demand Flow (vph) Deg Sat
Average Delay (s/veh) 95% Queue (m)
Baseline NOR Baseline NOR Baseline NOR Baseline NOR
Lissette Rd
Left 5 5 0.07 0.06 23 21 2 1
Through 5 5 0.07 0.06 23 21 2 1
Right 5 5 0.07 0.06 23 21 2 1
Sh26 westbound
Left 5 5 0.18 0.16 7 7 0 0
Through 334 298 0.18 0.16 0 0 0 0
Right 49 91 0.07 0.11 9 9 2 3
Ruakura Rd
Left 148 160 0.25 0.23 14 12 8 7
Through 5 5 0.78 0.61 57 38 35 22
Right 127 117 0.78 0.61 57 38 35 2
Sh26 eastbound
Left 76 54 0.04 0.03 7 7 0 0
Through 435 394 0.23 0.21 2 2 15 12
Right 5 5 0.23 0.21 9 8 15 12
Overall 1201 1144 0.78 0.61 10 8 35 22
Table 5-4: Existing Ruakura Road/SH26/Lissette Road Intersection 2041 PM peak

Ruakura Interchange – Assessment of Traffic Effects 21
2-31695.00 | 25 August 2014 Opus International Consultants Ltd
Intersection Safety
Over the past 3 years, there have been two fatal crashes and a number of non-injury crashes at this
site. Although there is an expected increase in turning traffic volumes, a safety review using
appropriate accident prediction models, indicates that there is virtually no change in the predicted
number of injury crashes. This is because the combination of turning and opposing traffic flows are
virtually the same between the Baseline and NOR.
Overall Assessment
Based on the results of the year 2021 and 2041 traffic assessment the impact of the NOR proposal
is considered to be less than minor on the operational and safety performance of the
SH26/Ruakura Road Intersection, when compared with the Baseline (North facing ramps at
SH26).
5.3 Relocated Ruakura Road/Existing Ruakura Road (east)
This Relocated Ruakura Road/existing Ruakura Road Intersection is located east of the proposed
Ruakura Interchange and resembles a Tee junction layout on a horizontal curve. Relocated
Ruakura Road will be the major road with a speed limit of 80km/h on the east side of the
expressway. Holland Road traffic will access Hamilton City via a single lane on the side road.
Traffic Assessment
The modelling indicates that in year 2021 the intersection will operate with an overall LOS A, with
LOS B on the worst movement. Because there is no junction in this location as part of the Baseline,
no operational comparison can be made.
In year 2041, this junction exists in both the Baseline and NOR. The operational results are
presented in Table 5-5 and 5-6 below. The green highlighted cells indicate an improvement, whilst
the red cells show a disbenefit. In both the Baseline and NOR the overall intersection operates at
LOS A, with LOS B on the worst movement.
Overall, the effect of the NOR on the intersection performance is expected to be less than minor.
Approach
Demand Flow (vph) Deg Sat
Average Delay (s/veh) 95% Queue (m)
Baseline NOR Baseline NOR Baseline NOR Baseline NOR
Ruakura Rd Westbound
Through 171 259 0.09 0.14 0 0 0 0
Right 8 12 0.01 0.01 7 8 0 0 Holland Road Extension
Left 9 13 0.13 0.17 9 12 4 5
Right 86 84 0.13 0.17 9 12 4 5
Ruakura Rd Eastbound
Left 34 35 0.02 0.03 7 7 0 0
Through 81 214 0.05 0.12 0 0 0 0
Overall 389 616 0.13 0.17 3 2 4 5
Table 5-5: Relocated Ruakura Road/Existing Ruakura Road East of Expressway - Year 2041 AM

Ruakura Interchange – Assessment of Traffic Effects 22
2-31695.00 | 25 August 2014 Opus International Consultants Ltd
Approach
Demand Flow (vph) Deg Sat
Average Delay (s/veh) 95% Queue (m)
Baseline NOR Baseline NOR Baseline NOR Baseline NOR
Ruakura Rd Westbound
Through 95 200 0.05 0.11 0 0 0 0
Right 9 15 0.01 0.02 8 9 0 1
Holland Rd Extension
Left 11 4 0.08 0.11 10 13 2 3
Right 49 52 0.08 0.11 9 12 2 3
Ruakura Rd Eastbound
Left 105 96 0.06 0.05 7 7 0 0
Through 183 292 0.09 0.15 0 0 0 0
Overall 453 658 0.09 0.15 3 2 2 3
Table 5-6: Relocated Ruakura Road/Existing Ruakura Road East of Expressway - Year 2041 PM
Intersection Safety
As this intersection replaces the existing Ruakura Road/Holland Road intersection with the same
operating speeds, the difference in intersection safety is considered to be no more than minor, even
though there is an increase in the through flows on Relocated Ruakura Road. This is on the basis
that the junction will be designed to appropriate standards and includes a left turn deceleration
lane and right turn bay for turning movements from Relocated Ruakura Road. As the Project does
not generate traffic, only causes trip diversions, any increase in trips through this intersection
means a reduction through other intersections.
5.4 Relocated Ruakura Road/Silverdale Road/Port Access
The intersection of Relocated Ruakura Road and Silverdale Road is in a 60km/h area and will take
the form of a cross road junction with traffic signal control. The eastern side of the intersection will
provide access to the Inland Port. Although the junction will cater for a pedestrian phase the
number of users are not expected to be many, so the intersection has been modelled without this
phase (however any effect should be similar for both the Baseline and NOR).
Year 2021 Layout
Year 2041 Layout
Figure 5-2: Relocated Ruakura Road/Silverdale Road/Port Access West Intersection layout
Port Access Silverdale Rd
Ruakura Rd
Ruakura Rd

Ruakura Interchange – Assessment of Traffic Effects 23
2-31695.00 | 25 August 2014 Opus International Consultants Ltd
Traffic Assessment
In year 2021 the overall intersection performance for the Baseline is expected to be LOS C in both
peak periods. The worst movement is LOS D on the Silverdale Road right turn movement during
the PM Peak. Despite the much higher traffic flows through the junction under the NOR, the year
2021 performance is virtually the same as the Baseline, with the same LOS. Hence the effects are
considered to be less than minor.
By year 2041, the traffic flows increase and Relocated Ruakura Road is expected to be widened to
four lanes. The intersection also needs to be upgraded to the layout indicated in Figure 5-2 above in
order to meet the LOS D threshold set by the PPC for year 2031. Table 5-7 and 5-8 illustrate that
traffic flows through this intersection are likely to be similar between the Baseline and NOR in both
peak periods of year 2041. As the intersection performance of the NOR is also similar to the
Baseline, the effects are considered to be no more than minor.
Approach
Demand Flow (vph) Deg Sat
Average Delay (s/veh) 95% Queue (m)
Baseline NOR Baseline NOR Baseline NOR Baseline NOR
Relocated Ruakura Rd Northbound
Left 35 185 0.16 0.86 37 41 8 45
Through 314 373 0.81 0.86 39 36 51 48
Right 1 1 0.01 0.01 35 30 0 0
Port Access
Left 1 1 0.01 0.01 37 32 1 0
Through 1 1 0.01 0.01 33 27 1 0
Right 1 1 0.01 0.01 38 32 0 0
Relocated Ruakura Rd Southbound
Left 75 52 0.07 0.06 13 13 8 6
Through 318 268 0.13 0.10 3 3 13 9
Right 798 718 0.88 0.86 32 29 216 168
Silverdale Rd
Left 529 531 0.42 0.43 10 10 54 51
Through 31 31 0.18 0.16 34 28 7 6
Right 23 20 0.14 0.10 39 34 5 4
Overall 2126 2181 0.88 0.86 23 23 216 168
Table 5-7: Relocated Ruakura Road/Silverdale Road/Port Access intersection Year 2041 AM
Approach
Demand Flow (vph) Deg Sat
Average Delay (s/veh) 95% Queue (m)
Baseline NOR Baseline NOR Baseline NOR Baseline NOR
Relocated Ruakura Rd Northbound
Left 22 56 0.07 0.25 29 29 4 9
Through 458 305 0.78 0.67 31 26 59 29
Right 1 1 0.00 0.01 27 26 0 0
Port Access
Left 1 1 0.01 0.01 32 26 0 0
Through 1 1 0.01 0.01 27 22 0 0
Right 1 1 0.01 0.01 32 26 0 0
Relocated Ruakura Rd Southbound
Left 4 3 0.01 0.00 15 15 1 0
Through 375 484 0.16 0.20 3 4 15 18
Right 616 609 0.83 0.84 28 27 138 119
Silverdale Rd
Left 521 516 0.46 0.45 12 11 59 48
Through 2 2 0.01 0.01 27 22 0 0
Right 35 5 0.17 0.02 34 27 7 1
Overall 2037 1985 0.83 0.84 20 17 138 119
Table 5-8: Relocated Ruakura Road/Silverdale Road/Port Access intersection Year 2041 PM

Ruakura Interchange – Assessment of Traffic Effects 24
2-31695.00 | 25 August 2014 Opus International Consultants Ltd
Intersection Safety
The signalised intersection of this junction will be designed to the appropriate design standards to
ensure safety for all users. Although the traffic flows differ between the Baseline and NOR in year
2021, the intersection performance is similar, hence traffic safety should not be an issue. Beyond
year 2021, the traffic flows are similar hence the predicted number of traffic accidents should also
be similar. On this basis the NOR is not expected to have more than a minor effect on the
intersection safety.
5.5 Relocated Ruakura Road/Existing Ruakura Road (west)
This intersection of Relocated Ruakura Road and Existing Ruakura Road is located west of the
expressway and near the existing Silverdale Road intersection. Under the NOR it will initially take
the form of a simple Tee layout with priority given to Relocated Ruakura Road. The existing
Ruakura Road is to be retained to provide continuous access to Percival and Ryburn Road. Under
the PPC the long term solution for this intersection is a set of traffic signals when the Spine Road is
connected to Relocated Ruakura Road and Ruakura Road serving access to Percival Road is closed.
For this reason it has been necessary to assess both the year 2021 and 2041 junction performance.
Traffic Assessment
In year 2021 the orientation of the TEE intersection and priority movement changes between the
Baseline and NOR as shown in Figure 5-3 below. In the Baseline existing Ruakura Road has the
priority movement, whereas in the NOR, the priority movement is from Ruakura Road west to
Relocated Ruakura Road.
Year 2021: Baseline
Year 2021: NOR
Figure 5-3: Ruakura Road/Relocated Ruakura Road Tee Intersection Layout in Year 2021
Table 5-9 and 5-10 indicate that the intersection in year 2021 with the NOR operates better than
the Baseline in both peak periods, hence the effect is less than minor.
Ruakura Interchange – Assessment of Traffic Effects 25
2-31695.00 | 25 August 2014 Opus International Consultants Ltd
Approach
Demand Flow (vph) Deg Sat
Average Delay (s/veh) 95% Queue (m)
Baseline NOR Baseline NOR Baseline NOR Baseline NOR
Relocated Ruakura Rd
Left/thru 357 591 0.39 0.31 8 0 15 0
Right/R 14 2 0.05 0 16 7 1 0
Existing Ruakura Rd Southbound
Left/L 115 4 0.06 0 6 7 0 0
Thru/R 246 14 0.18 0.05 0 19 0 1
Existing Ruakura Rd Eastbound
Thru/L 128 8 0.07 0.23 0 6 0 0
Right/T 365 436 0.42 0.23 9 0 19 0
Overall 1321 1055 0.42 0.31 6 0 19 1
Table 5-9: Relocated Ruakura Road/Existing Ruakura Road Tee intersection Year 2021 AM
Approach
Demand Flow (vph) Deg Sat
Average Delay (s/veh) 95% Queue (m)
Baseline NOR Baseline NOR Baseline NOR Baseline NOR
Relocated Ruakura Rd
Through 197 317 0.17 0.17 6 0 5 0
Right 62 3 0.18 0 15 8 4 0
Existing Ruakura Rd Southbound
Left 24 3 0.11 0 6 8 0 0
Right 133 11 0.07 0.04 0 18 0 1
Existing Ruakura Rd Eastbound
Left 298 15 0.15 0.34 0 6 0 0
Through 359 647 0.30 0.34 6 0 11 0
Overall 1073 996 0.30 0.34 4 0 11 1
Table 5-10: Relocated Ruakura Road/Existing Ruakura Road Tee intersection Year 2021 PM
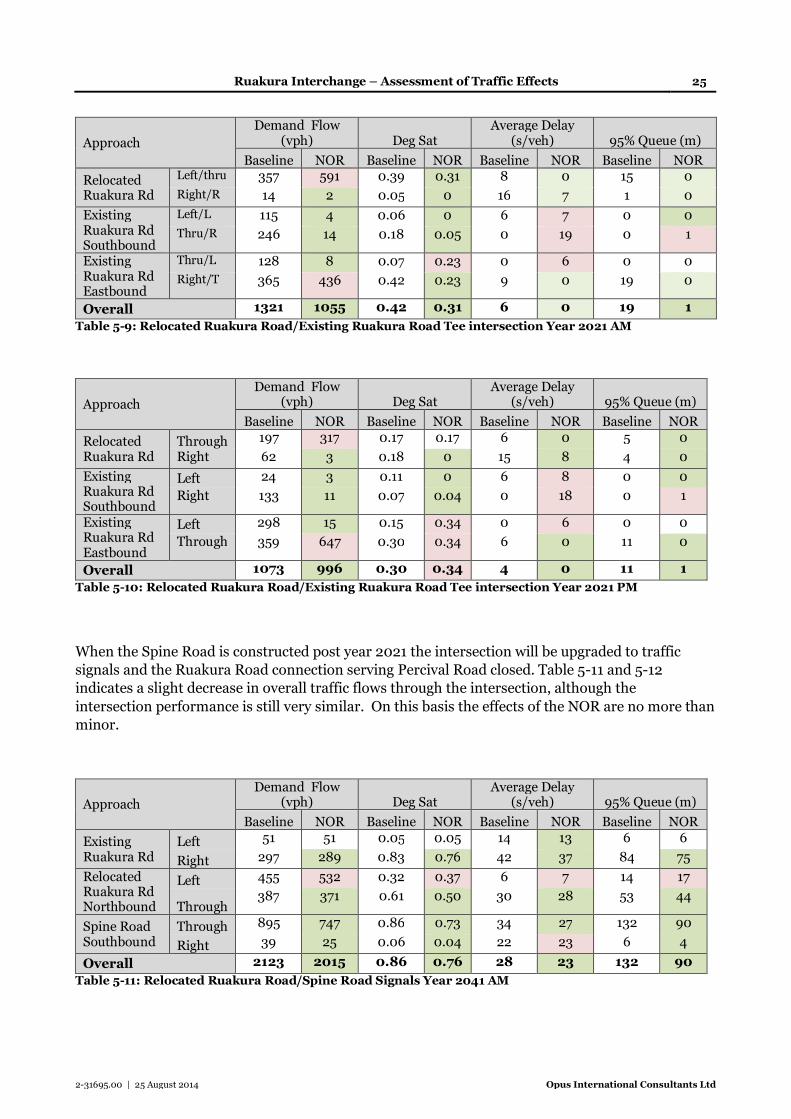
When the Spine Road is constructed post year 2021 the intersection will be upgraded to traffic
signals and the Ruakura Road connection serving Percival Road closed. Table 5-11 and 5-12
indicates a slight decrease in overall traffic flows through the intersection, although the
intersection performance is still very similar. On this basis the effects of the NOR are no more than
minor.
Approach
Demand Flow (vph) Deg Sat
Average Delay (s/veh) 95% Queue (m)
Baseline NOR Baseline NOR Baseline NOR Baseline NOR
Existing Ruakura Rd
Left 51 51 0.05 0.05 14 13 6 6
Right 297 289 0.83 0.76 42 37 84 75
Relocated Ruakura Rd Northbound
Left 455 532 0.32 0.37 6 7 14 17
Through 387 371 0.61 0.50 30 28 53 44
Spine Road Southbound
Through 895 747 0.86 0.73 34 27 132 90
Right 39 25 0.06 0.04 22 23 6 4
Overall 2123 2015 0.86 0.76 28 23 132 90
Table 5-11: Relocated Ruakura Road/Spine Road Signals Year 2041 AM

Ruakura Interchange – Assessment of Traffic Effects 26
2-31695.00 | 25 August 2014 Opus International Consultants Ltd
Approach
Demand Flow (vph) Deg Sat
Average Delay (s/veh) 95% Queue (m)
Baseline NOR Baseline NOR Baseline NOR Baseline NOR
Existing Ruakura Rd
Left 106 105 0.09 0.09 12 10 12 10
Through 476 579 0.81 0.85 37 37 136 172
Relocated Ruakura Rd Northbound
Through 333 327 0.23 0.22 7 7 12 12
Right 646 495 0.81 0.76 37 38 107 75
Spine Road Southbound
Left 518 518 0.66 0.79 32 39 78 80
Right 68 67 0.17 0.16 33 33 16 15
Overall 2147 2092 0.81 0.85 30 32 136 172
Table 5-12: Relocated Ruakura Road/Spine Road Signals Year 2041 PM
Intersection Safety
As the traffic flows through the intersection are similar for the Baseline and NOR in both year 2021
and 2041, the number and severity of crashes will also be similar based on crash prediction models,
hence the effects of the NOR are no more than minor.
5.6 Existing Ruakura Road/Vaile Road/Davison Road
The existing intersection is a cross road layout with priority control. Davison Road, a short no-exit
rural road of narrow width, provides access to a small number of rural residents. Vaile Road
connects between SH1B and Ruakura Road and is expected to cater for an increase in traffic flow as
a result of the NOR.
Traffic Assessment
Based on the results of Table 5-13 and 5-14, the intersection performance of the NOR in both peak
periods in year 2041 is very similar to the Baseline with an overall LOS A, despite the increase in
traffic flows. The year 2021 performance results are also similar. Hence, the effects of the NOR are
less than minor.
Approach
Demand Flow (vph) Deg Sat
Average Delay (s/veh) 95% Queue (m)
Baseline NOR Baseline NOR Baseline NOR Baseline NOR
Ruakura Rd Northbound
Left 5 5 0.10 0.12 8 9 4 6
Through 120 184 0.10 0.12 0 1 4 6
Right 45 27 0.10 0.12 8 8 4 6
Vaile Rd
Left 36 21 0.11 0.17 11 13 3 5
Through 5 5 0.11 0.17 10 12 3 5
Right 59 85 0.11 0.17 10 12 3 5
Ruakura Rd Southbound
Left 33 64 0.05 0.13 9 9 2 6
Through 58 163 0.05 0.13 0 1 2 6
Right 5 5 0.05 0.13 8 8 2 6
Davison Rd
Left 5 5 0.02 0.02 11 12 0 1
Through 5 5 0.02 0.02 10 11 0 1
Right 5 5 0.02 0.02 10 11 0 1
Overall 382 577 0.11 0.17 5 5 4 6
Table 5-13: Existing Ruakura Road/Vaile Road/Davison Road Intersection 2041 AM peak

Ruakura Interchange – Assessment of Traffic Effects 27
2-31695.00 | 25 August 2014 Opus International Consultants Ltd
Approach
Demand Flow (vph) Deg Sat
Average Delay (s/veh) 95% Queue (m)
Baseline NOR Baseline NOR Baseline NOR Baseline NOR
Ruakura Rd Northbound
Left 5 5 0.06 0.10 9 9 2 5
Through 72 160 0.06 0.10 0 0 0 0
Right 26 17 0.06 0.10 8 9 2 5
Vaile Rd
Left 26 18 0.07 0.12 11 13 2 3
Through 5 5 0.07 0.12 11 12 2 3
Right 32 54 0.07 0.12 11 12 2 3
Ruakura Rd Southbound
Left 58 81 0.12 0.17 8 9 5 8
Through 158 224 0.12 0.17 0 0 0 0
Right 5 5 0.12 0.17 8 8 5 8
Davison Rd
Left 5 5 0.02 0.02 11 12 0 1
Through 5 5 0.02 0.02 10 11 0 1
Right 5 5 0.02 0.02 10 11 0 1
Overall 403 585 0.12 0.17 4 4 5 8
Table 5-14: Existing Ruakura Road/Vaile Road/Davison Road Intersection 2041 PM peak
Intersection Safety
Although there is an increase in traffic flows through this intersection, the scope of works includes
significant upgrading of the junction, such as wider traffic lanes with a sealed shoulder on Ruakura
Road, sight distance improvements for traffic exiting Vaile and Davison Road, and the provision of
a right turn bay to serve both roads.
The overall safety effects of the NOR are therefore considered to be less than minor.
5.7 Relocated Ruakura Road/Port Access East/Logistics
In year 2021, under the NOR this junction is a signalised TEE layout serving access into the Inland
Port from Relocated Ruakura Road within a 60km/hr speed limit. In the Baseline there is no
intersection as the Inland Port has a direct connection with Relocated Ruakura Road, which stops
west of the expressway. Hence there is no comparative assessment.
Post year 2021, the intersection will be upgraded to a cross road layout to provide access into the
logistics area adjacent to the southern side of Relocated Ruakura Road. It will also be widened to
provide four lanes on Relocated Ruakura Road. This junction layout is applicable to both the
Baseline and NOR assessment.
Although the intersection will include a pedestrian phase it has not been included in the
assessment as volumes are expected to be low and unlikely to affect the results. Figure 5-4
illustrates the intersection layout for year 2021 (NOR only) and 2041 (Baseline and NOR) on which
the assessment is based.
Traffic Assessment
Table 5-15 to 5-18 summarise the intersection performance results. In year 2021, the new
intersection is expected to operate at LOS C or better on any movement with average delays of no
more than 24secs/vehicle.

Ruakura Interchange – Assessment of Traffic Effects 28
2-31695.00 | 25 August 2014 Opus International Consultants Ltd
Year 2021: Layout with NOR
Year 2041: Layout – Baseline and NOR
Figure 5-4: Relocated Ruakura Road/Port Access East Intersection Layout
Approach
Demand Flow (vph)
Deg Sat (v/c)
Average Delay (s/veh)
95% Queue (m)
NOR NOR NOR NOR Relocated Ruakura Rd Westbound
Left 387 48
0.36 0.22
6 24
31 9
Through
Port Access Through 20
4 0.04 0.02
12
22
3 1
Right
Spine Road Southbound
Left 3 146
0.01 0.31
19 14
1 18
Right
Overall 609 0.36 9 31
Table 5-15: Relocated Ruakura Road/Port Access Intersection 2021 AM peak
Approach
Demand Flow (vph)
Deg Sat (v/c)
Average Delay (s/veh)
95% Queue (m)
NOR NOR NOR NOR Relocated Ruakura Rd Westbound
Left 215 22
0.20 0.13
5 24
16 5
Through
Port Access Through 53
32 0.08 0.12
12
22
6 4
Right
Spine Road Southbound
Left 3 406
0.01 0.84
19 22
1 67
Right
Overall 731 0.84 16 67
Table 5-16: Relocated Ruakura Road/Port Access Intersection 2021 PM peak
Port Access
Logistics Access
Port Access

Ruakura Interchange – Assessment of Traffic Effects 29
2-31695.00 | 25 August 2014 Opus International Consultants Ltd
Approach
Demand Flow (vph) Deg Sat
Average Delay (s/veh) 95% Queue (m)
Baseline NOR Baseline NOR Baseline NOR Baseline NOR
Logistics Entrance
Left 5 5 0.01 0.09 18 20 1 1
Through 28 6 0.20 0.04 27 27 10 1
Right 12 176 0.06 0.61 30 30 2 5
Relocated Ruakura Rd Westbound
Left 34 214 0.04 0.28 15 16 4 33
Through 212 498 0.24 0.66 19 26 18 52
Right 13 83 0.08 0.65 32 39 3 29
Port Access
Left 6 52 0.01 0.16 18 23 1 15
Through 27 2 0.21 0.01 27 28 10 1
Right 29 5 0.24 0.02 32 27 10 1
1Relocated Ruakura Rd Eastbound
Left 33 8 0.06 0.01 16 14 6 1
Through 101 123 0.12 0.17 18 22 8 12
Right 1 1 0.05 0.01 30 33 0 0
Overall 501 1174 0.24 0.66 21 25 18 52
Table 5-17: Relocated Ruakura Road/Port Access Intersection 2041 AM peak
Approach
Demand Flow (vph) Deg Sat
Average Delay (s/veh) 95% Queue (m)
Baseline NOR Baseline NOR Baseline NOR Baseline NOR
Logistics Entrance
Left 5 5 0.01 0.01 15 25 1 1
Through 36 6 0.23 0.04 23 33 10 2
Right 41 452 0.19 0.77 27 30 7 124
Relocated Ruakura Rd Westbound
Left 20 175 0.03 0.18 16 13 2 23
Through 123 180 0.27 0.37 22 32 11 22
Right 6 61 0.03 0.65 27 46 1 30
Port Access
Left 34 139 0.06 0.38 16 29 5 39
Through 46 20 0.24 0.12 22 34 10 5
Right 96 45 0.50 0.07 28 21 20 7
Relocated Ruakura Rd Eastbound
Left 36 7 0.08 0.01 17 13 7 1
Through 238 365 0.50 0.76 23 36 21 50
Right 2 2 0.01 0.01 26 38 0 1
Overall 683 1458 0.50 0.77 23 30 21 124
Table 5-18: Relocated Ruakura Road/Port Access Intersection 2041 PM peak
Under the Baseline in year 2041 the overall intersection is expected to operate at LOS C, with the
worst movement also operating at LOS C.
Despite the significant traffic volume increase with the NOR (over two fold), the overall
intersection performance is still acceptable at LOS C, with the worst movement incurring LOS D
(Relocated Ruakura Road right turn into Logistics). A noticeable change is the volume of traffic
turning right out of the Logistic+s entrance which is heading for the Ruakura Interchange. This
traffic was previously using the Greenhill Interchange to go north or presumably Silverdale Road to
go south.
Based on this assessment the NOR flows are expected to have no more than a minor effect on the
intersection performance in year 2041.

Ruakura Interchange – Assessment of Traffic Effects 30
2-31695.00 | 25 August 2014 Opus International Consultants Ltd
Intersection Safety
The signalised junctions will be designed and constructed to the appropriate standards and HCC
requirements. With the significant increase in traffic flows the number of crashes is also likely to
increase as they are related to the number of vehicle conflicts. However, this will be offset by a
reduction in crashes at the intersections from where the traffic has diverted. Hence, the effects are
considered to be no more than minor.
6 Effects on Existing Property Access
6.1 Ruakura Road and SH26
The two roads most affected by the proposed change in network flows are SH26 and Ruakura
Road. The other roads are either new roads to be constructed or access controlled roads such as
Wairere Drive. The effect on property access for these two roads with the NOR is considered to be
less than minor for the following reasons.
• On SH26, the traffic volumes are expected to reduce significantly (-1,300 to -4,300vpd) with
the NOR, hence vehicle access to adjoining properties will be safer as the number of vehicle
conflicts is reduced,
• The existing Ruakura Road between Silverdale Road and Holland Road will be closed to
through traffic due to the Ruakura Road stoppage, hence the traffic flows on this section of road
also significantly reduce, resulting in improved safety for residents who gain access from this
stretch of road.
• On Ruakura Road between the new intersection of Relocated Ruakura Road and SH26, the
traffic volumes is expected to increase from a current volume of 2900vpd to 4,300vpd (yr
2041). The NOR includes road widening to provide a 1.5m sealed shoulder which can be used
by property owners to access their driveways without holding up the through traffic that may
arrive during the execution of the turn. The increase in traffic volume represents about one
extra vehicle on this section of Ruakura Road every 30 seconds during the day. Whilst any
increase in traffic volumes may be noticeable when operating at relatively low traffic volumes
this increase in flow on Ruakura Road is not expected to affect the ability of property owners to
safely select a gap in the traffic stream to make their turns, or create any noticeable additional
waiting time whilst exiting their driveways.
• Based on site observations there is a significant amount of turning traffic associated with the
LIC/Dairy NZ site. As mitigation the NOR includes construction of a central painted median on
Ruakura Road to safety accommodate right turn vehicles into the LIC/Dairy NZ site.
6.2 Percival Road and Ryburn Road
In order for Tainui Group Holdings to construct the rail siding for the Inland Port as outlined in the
PPC, Ruakura Road needs to be stopped either side of the Expressway at some future point in time.
Due to this requirement, the NZ Transport Agency has taken the opportunity to shorten the
expressway bridge over the ECMT railway as it will no longer need to span Ruakura Road. To
ensure it can construct the shorter bridge, the NOR has included the Ruakura Road Stoppage
immediately either side of the expressway (which requires a separate legal process). Although the
access to Percival Road and Ryburn Road is the same in both the traffic Baseline and NOR (hence

Ruakura Interchange – Assessment of Traffic Effects 31
2-31695.00 | 25 August 2014 Opus International Consultants Ltd
no effect), a traffic assessment has been undertaken to ensure all affected landowners are aware of
the implications of the closure. Note this does not consider the longer term effects of closing the
Ruakura Rd/Percival Road intersection which will be undertaken by either TGH or HCC.
As previously discussed in this report, under the NOR the section of Ruakura Road between the
expressway and Silverdale Road will remain open to provide continued access to the City and
western destinations. However access to the east and south is potentially affected depending on the
actual destination of the trip being made.
Figure 6-1 below indicates various destinations from Origins A (Percival and Ryburn Roads) and B
(existing Ruakura Road immediately east of the expressway) to various destinations C (SH26) and
D (Hamilton City).
Table 6-1 and 6-2 indicate the number of likely trips, extra travel time and distance needed to
complete the journey under the NOR layout when compared to the existing network as it is today.
Trips in the reverse direction are expected to encounter similar additional travel distance and
times.
Percival Road and Ryburn Road Movement to:
Node Point
Reference
Likely number of daily vehicles
affected
Extra Distance (km)
Extra Time Driving (seconds)
Extra Time Walking (mins)
West/Hamilton City
A to D No more than 300
0 0 0
East - SH26 A to C Less than 50 1.0 70 14 East – Holland Road
A to B Less than 50 2.7 145 38
Table 6-1 Predicted Traffic Effects for existing trips from Percival and Ryburn Roads
Note the traffic flows from Percival and Ryburn Roads are considered to be those created by the
existing rural lifestyle blocks. As the exact origin/destination of trips are not known, the vehicle
numbers in Table 6-2 are loosely based on the assumption that 80 % of trips are likely to have a
destination in the city or to the west.
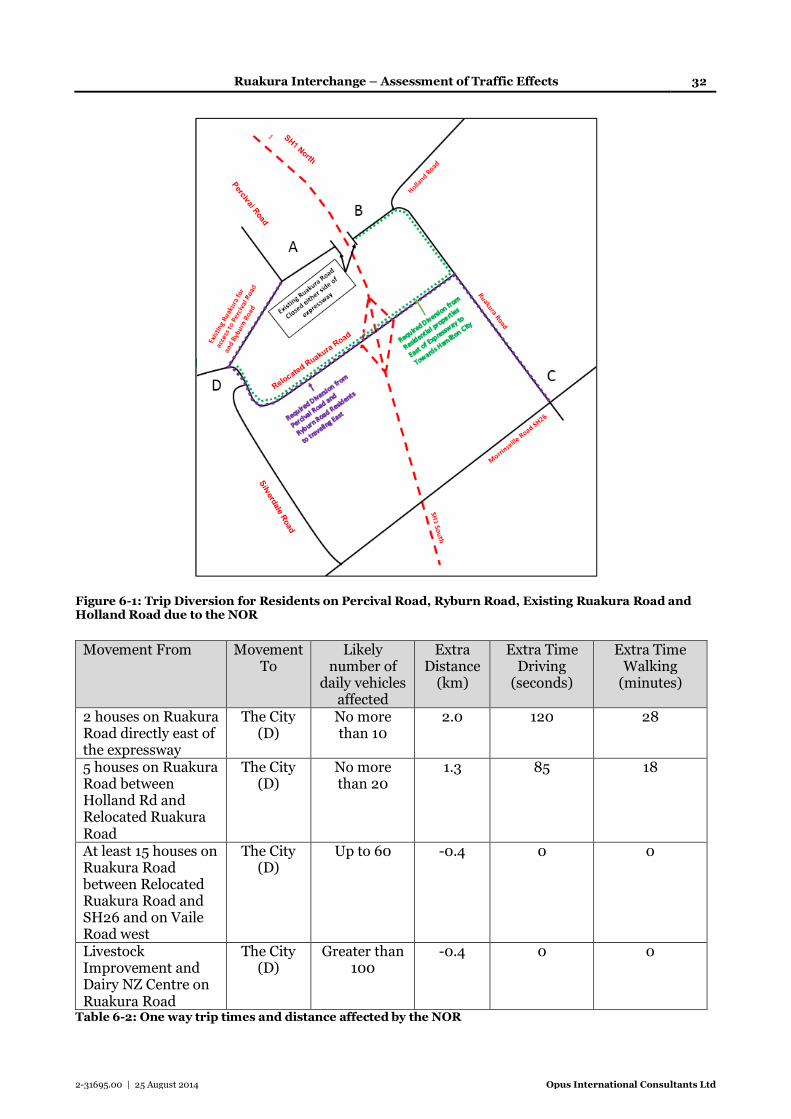
Other property trips likely to be affected by the NOR when compared with the existing road
network (not the Baseline) are included in Table 6-2.
Ruakura Interchange – Assessment of Traffic Effects 32
2-31695.00 | 25 August 2014 Opus International Consultants Ltd
Figure 6-1: Trip Diversion for Residents on Percival Road, Ryburn Road, Existing Ruakura Road and Holland Road due to the NOR
Movement From Movement To
Likely number of daily vehicles affected
Extra Distance (km)
Extra Time Driving (seconds)
Extra Time Walking (minutes)
2 houses on Ruakura Road directly east of the expressway
The City (D)
No more than 10
2.0 120 28
5 houses on Ruakura Road between Holland Rd and Relocated Ruakura Road
The City (D)
No more than 20
1.3 85 18
At least 15 houses on Ruakura Road between Relocated Ruakura Road and SH26 and on Vaile Road west
The City (D)
Up to 60 -0.4 0 0
Livestock Improvement and Dairy NZ Centre on Ruakura Road
The City (D)
Greater than 100
-0.4
0 0
Table 6-2: One way trip times and distance affected by the NOR

Ruakura Interchange – Assessment of Traffic Effects 33
2-31695.00 | 25 August 2014 Opus International Consultants Ltd
Although some trips may take slightly longer, some have no change, whilst some have a shorter
distance to travel. Those going north or south should find a significant reduction in travel time due
to the direct connection offered by the Ruakura Interchange and Waikato Expressway.
Overall, the impacts of stopping Ruakura Road either side of the expressway on residents of
Percival Road, Ryburn Road and Ruakura Road is considered to be no more than minor when all
trips are taken into consideration.
7 Impact on Alternative Modes of Travel
7.1 Pedestrian and Cycle
The existing environment provides no facilities for pedestrians or cyclists and hence these modes of
transport are not frequent. Ruakura Road has a narrow seal width, which is insufficient to safely
accommodate road cyclists.
The project team planning staff have advised that stakeholder consultation has identified;
• Groups of staff from Livestock Improvements walk along Ruakura Road for recreational
purposes between their site and Vaile Road due to a lack of any off road pathways in the
area, and
• Newstead School has a policy that all children are brought to school by car or bus.
The NOR will significantly improve both pedestrian and cycle safety in the area as the Project scope
of works will include:
• A 3m shared concrete pathway on Relocated Ruakura Road between Silverdale Road and
Vaile Road. It will most likely be located on the southern side of the road, although its final
location will be determined during the construction phase in consultation with HCC.
• At the proposed Silverdale and Port Access signalised intersections, a pedestrian phase will
be included to safely get pedestrians and cyclists across the intersecting roadways,
• At the proposed Relocated Ruakura Road roundabouts appropriately designed crossing
facilities will be included to HCC requirements. This will include kerb let-downs, and a
refuge area within the road splitter islands,
• Between Vaile Road and SH26 a 1.5m concrete pedestrian path will be developed on the
eastern side of Ruakura Road. Due to significant on site constrains (deep drains, and need
for guardrails) it is not feasible to provide a wider width, and
• A 1.5m wide sealed road shoulder to accommodate road cyclists along Ruakura Road. This
is the Transport Agencies standard cross section width for state highways operating with an
80km/h speed limit. Whilst it is at the minimum desirable width, off road facilities are also
being provided.
Overall the NOR will have a positive effect on safety and mobility for these modes of transport
compared to the Baseline, and may help to encourage more of these trip types.

Ruakura Interchange – Assessment of Traffic Effects 34
2-31695.00 | 25 August 2014 Opus International Consultants Ltd
7.2 Passenger Transport Effects
Bus routes are not considered to be adversely affected by the NOR as there are no known services
using Ruakura Road. In the event that buses do use the route in the future, the wider roadway
inclusive of safe turning facilities (right turn bays) at intersections, and appropriately designed
intersections along Relocated Ruakura Road should all minimise the potential for bus related
crashes.
8 Relocated Ruakura Road over or under
Expressway
The NOR does not specifically identify whether Relocated Ruakura Road goes over the Waikato
Expressway or whether the expressway should go over Relocated Ruakura Road. The NZ Transport
Agency needs to keep this option open until such time that it reaches agreement with HCC and
TGH. Hence, the assessment of effects needs to consider both layouts.
From a traffic operational and safety point of view, there is a difference as outlined below.
Option 1: Expressway over Relocated Ruakura Road
Under this arrangement Relocated Ruakura Road would be constructed close to existing ground
level and the expressway built over the local road providing a minimum of 6m clearance as
required by HCC. Hence the northbound on-ramp would be on an uphill gradient of around +3%.
This reduces the ability of heavy vehicles to achieve a safe merging speed when entering the
expressway traffic stream. To improve this situation requires widening of the ECMT railway bridge
by an extra 3.5m and construction of a long northbound merge lane. The southbound off-ramp to
Relocated Ruakura Road would be on a -3% downgrade, which also results in the need for a longer
off-ramp to ensure trucks have sufficient distance over which to slow down.
Option 2: Relocated Ruakura Road over expressway
With this layout, Relocated Ruakura Road would go over the expressway on an earth embankment
and bridge providing a minimum of 6.1m clearance above the expressway carriageway. Appropriate
sight lines can be provided to the roundabouts located at the ramp terminals for the 60km/ and
80km/h approach speeds.
This option offers a $2M cost saving over option 1, due to a better earthwork balance and reduced
overall bridge costs.
Because the vertical profile of the Relocated Ruakura Road ramp terminal is at a similar height to
the on-ramp merge area, the resulting northbound on-ramp gradient is relatively level, which does
not hinder the acceleration of trucks as occurs with Option 1. This therefore provides a higher
merge speed when entering the expressway, thereby removing the need to widen the ECMT rail
bridge.
Conclusion
Overall, from a traffic operational perspective, placing Relocated Ruakura Road over the
expressway is the preferred interchange arrangement.

Ruakura Interchange – Assessment of Traffic Effects 35
2-31695.00 | 25 August 2014 Opus International Consultants Ltd
9 Construction Traffic Effects
Construction of the Hamilton Section will involve the transport of earthworks material from
various sectors of the Project and the importation of drainage components, bridge elements,
pavements materials, and other materials needed to construct the Project.
Construction traffic was initially considered and addressed via conditions at the time of the original
Hamilton designation. Since then, further assessment has been undertaken in relation to
Alterations U, V, W and Z, for which a decision was issued in July 2014. Although two of the
alterations have been appealed, neither of these relate to construction traffic effects.
Traffic effects therefore only relate to the additional earthworks required to construct the NOR.
The NOR requires either the raising of the expressway south of the ECMT railway so that it can
proceed over the Relocated Ruakura Road, or raising Relocated Ruakura Road over the expressway.
Either way, there is a need for an additional 200,000m3 of fill material to construct the
embankment.
The source of this material could be from the Expressway corridor between the Ruakura Interchange
and the SH26 gully (which could be hauled within the site), or from the Tamahere cut where there is
good quality surplus material. If the contractor chooses to use the later site it would involve
approximately 2,000 truck and trailer movements over one earthwork season. The likely route would
involve Tauwhare Road, Hoeka Road, SH26 and maybe Ruakura Road in order to access the site.
The mitigation of any adverse traffic effects resulting from carting earthwork material by road will
need to be addressed by the contractor via development of their Construction Management Plan
(CMP). Under the current Hamilton Section designation conditions for Alteration U, V, W and Z
the CMP will be discussed and certified by the Waikato District Council and Hamilton City Council.
It is proposed that the same condition be placed on this NOR as detailed in Section 10 of this
report.
Although unlikely, Silverdale Road could be used to transport earthwork material to the site. It is
noted that Silverdale School gets direct access from this road, hence construction traffic during
peak times of the day could create a safety issue. To help prevent this occurrence a condition
similar to that imposed on the recent alterations is included in Section 10 of this report.
10 Conclusion
Overall, the Ruakura Road interchange NOR is considered to have no more than a minor effect on
the operational characteristics of the road network or road based on the assessment outlined in this
report. In particular,
• The NOR encourages traffic to use the expressway, which reduces traffic on local roads such as
Wairere Drive and the future Spine Road which travels through a residential area. It also
reduces traffic past the Silverdale School and removes about 300 daily trucks (yr 2041) from
Silverdale Road,
• All NOR intersections are expected to operate at least as well as the Baseline with little
difference in traffic performance. They also meet the Project and PPC Level of Service criteria
at opening through to year 2041 during all peak periods,

Ruakura Interchange – Assessment of Traffic Effects 36
2-31695.00 | 25 August 2014 Opus International Consultants Ltd
• Overall safety of the existing intersections on Relocated Ruakura Road and Ruakura Road is
expected to be no worse with the NOR than will occur under the Baseline. Any new crashes on
Relocated Ruakura Road as a result of the two roundabouts at the interchange ramp terminals
will most likely be offset by the removal of potential crashes on SH26 as a result of not
constructing the two Tee Intersections at the SH26 ramp terminals. There is also a significant
number of vehicles that are transferring from the local road network to the expressway which
should provide a safety benefit for the remaining traffic using the local road network,
• The extra traffic on Ruakura Road will be accommodated on a widened cross section that
provides two 3.5m lanes with 1.5m shoulder widths. A right turn bay for Vaile/Davison Road
intersection will provide a safer environment for turning vehicles than is offered by the existing
intersection,
• Effects on alternative modes of transport are expected to be positive due to the inclusion of
shared off road facilities along Relocated Ruakura Road, and a concrete pathway between Vaile
Road and SH26, neither of which exist at present,
• There are no expected effects on public transport,
• Development of a Construction Management Plan by the contractor as a condition to this NOR
will set-out the mitigation measures proposed by the contractor to deal with any adverse traffic
or safety effects arising from construction traffic based on his intended operation. Hence,
Waikato District Council and Hamilton City Council have full veto over this aspect to ensure
mitigation is adequately provided,
• There is not expected to be more than a minor effect on property access for residents on
Ruakura Road (south of Vaile Road) despite the increased traffic flows. Residents turning into,
or out of, their properties should not be adversely affected by the increased traffic as it
represents on average an extra vehicle every 30 seconds during the day. The inclusion of a
central painted median for right turn traffic into LIC/Dairy NZ site will ensure a much safer
environment than exists at present,
• Network effects for travel to the south and east for Percival and Ryburn Road residents is not
expected to be more than minor when the increased trip time (between 1 minute to 2.5minutes)
is compared with the overall trip time and given that the number of these trips is expected to be
less than 20% of their total daily trips (on average).
• The NOR provides a positive overall contribution to the network efficiency by providing a direct
connection between the PPC activities (particularly the Inland Port and Logistics area) and the
Waikato Expressway, thereby removing heavy commercial vehicles off city roads such as
Wairere Drive and Cambridge Road.
From an expressway operation and safety perspective, Ruakura Road over the Waikato Expressway
is the preferred layout arrangement as this reduces the speed differential between trucks merging
from the northbound on-ramp and vehicles using the outer lane of the expressway.

Ruakura Interchange – Assessment of Traffic Effects 37
2-31695.00 | 25 August 2014 Opus International Consultants Ltd
11 Proposed Designation Conditions
To ensure the Project includes appropriate mitigation measures, the following conditions should be
imposed on the NOR:
1. The Specimen Design and Principal’s Requirements for Relocated Ruakura Road and pedestrian and cycle facilities between Silverdale Road and the Expressway shall be
prepared in consultation with the Chief Executive of the Hamilton City Council or nominee.
2. The Requiring Authority shall provide a shared-use concrete pedestrian and cycle path of
3m width along Relocated Ruakura Road between Silverdale Road and Vaile Road. The
path shall be designed to be safe and accessible and enable pedestrians and cyclists to cross
the ramps associated with the Ruakura Interchange.
3. The Requiring Authority shall provide a 1.5m wide concrete pathway between Vaile Road
and SH26 located on the eastern side of Ruakura Road.
4. The Requiring Authority shall widen Ruakura Road to a minimum of 10m seal width between Vaile Road and SH26, and provide a painted median of 2.5m width to serve the
access driveways at 605 Ruakura Road (LIC and Dairy NZ site. In addition a right turn bay
of 2.5m minimum width shall be provided on Ruakura Road for Davison Road and Vaile
Road.
5. Include Condition 2.1, 2.3A and 2.3B of NOR 1 and NOR 2. (This is to cover the issue around construction traffic on WDC and HCC roads and the need to ensure each Council
has an opportunity for input).
6. The restriction of truck traffic in the vicinity of and past the Silverdale School particularly during normal school drop off and pick up times.

Ruakura Interchange – Assessment of Traffic Effects 38
2-31695.00 | 25 August 2014 Opus International Consultants Ltd
Appendix A : SIDRA Outputs (Intersection Performance Summary)

SITE LAYOUT
Site: 2021 AM Baseline
Relocated Ruakura Road/Existing Ruakura Road (west)Tee IntersectionNet 35 BASELINEGiveway / Yield (Two-Way)
Created: Thursday, 28 August 2014 09:32:48SIDRA INTERSECTION 6.0.22.4722
Copyright © 2000-2014 Akcelik and Associates Pty Ltdwww.sidrasolutions.com
Project: O:\ha_civ\231695 hamilton expressway\Secondary Investigation and SARA\Scheme Design\Transportation\AEE traffic\Ruakura Alteration- 2014\AEE report July14\assessment\Spine Rd Signals_mpm.sip68000051, OPUS INTERNATIONAL CONSULTANTS, NETWORK / Enterprise

MOVEMENT SUMMARY
Site: 2021 AM Baseline
Relocated Ruakura Road/Existing Ruakura Road (west)Tee IntersectionNet 35 BASELINEGiveway / Yield (Two-Way)
Movement Performance - Vehicles
Demand Flows 95% Back of QueueMov
ID
OD
Mov
Deg.
Satn
Average
Delay
Level of
Service
Prop.
Queued
Effective
Stop Rate
Average
Speed Total HV Vehicles Distanceveh/h % v/c sec veh m per veh km/h
South: Relocated Ruakura Road
1 L2 357 3.8 0.389 8.2 LOS A 2.1 15.0 0.50 0.76 51.5
3 R2 14 0.0 0.045 15.9 LOS C 0.2 1.1 0.73 0.89 46.3
Approach 371 3.7 0.389 8.5 LOS A 2.1 15.0 0.51 0.77 51.3
East: Existing Ruakura Rd
4 L2 115 0.0 0.062 5.5 LOS A 0.0 0.0 0.00 0.58 53.6
5 T1 342 0.6 0.176 0.0 LOS A 0.0 0.0 0.00 0.00 60.0
Approach 457 0.5 0.176 1.4 NA 0.0 0.0 0.00 0.14 58.2
West: Existing Ruakura Road
11 T1 128 1.6 0.067 0.0 LOS A 0.0 0.0 0.00 0.00 60.0
12 R2 365 4.0 0.422 9.4 LOS A 2.6 18.6 0.60 0.87 50.4
Approach 494 3.4 0.422 6.9 NA 2.6 18.6 0.44 0.64 52.6
All Vehicles 1321 2.5 0.422 5.5 NA 2.6 18.6 0.31 0.51 54.0
Level of Service (LOS) Method: Delay (HCM 2000).
Vehicle movement LOS values are based on average delay per movement
Minor Road Approach LOS values are based on average delay for all vehicle movements.
NA: Intersection LOS and Major Road Approach LOS values are Not Applicable for two-way sign control since the average delay is not a
good LOS measure due to zero delays associated with major road movements.
SIDRA Standard Delay Model is used. Control Delay includes Geometric Delay.
Gap-Acceptance Capacity: SIDRA Standard (Akçelik M3D).
HV (%) values are calculated for All Movement Classes of All Heavy Vehicle Model Designation.
Processed: Monday, 25 August 2014 15:45:01SIDRA INTERSECTION 6.0.22.4722
Copyright © 2000-2014 Akcelik and Associates Pty Ltdwww.sidrasolutions.com
Project: O:\ha_civ\231695 hamilton expressway\Secondary Investigation and SARA\Scheme Design\Transportation\AEE traffic\Ruakura Alteration- 2014\AEE report July14\assessment\Spine Rd Signals_mpm.sip68000051, OPUS INTERNATIONAL CONSULTANTS, NETWORK / Enterprise

MOVEMENT SUMMARY
Site: 2021 PM Baseline
Relocated Ruakura Road/Existing Ruakura Road (west)Tee IntersectionNet 35 BASELINEGiveway / Yield (Two-Way)
Movement Performance - Vehicles
Demand Flows 95% Back of QueueMov
ID
OD
Mov
Deg.
Satn
Average
Delay
Level of
Service
Prop.
Queued
Effective
Stop Rate
Average
Speed Total HV Vehicles Distanceveh/h % v/c sec veh m per veh km/h
South: Relocated Ruakura Road
1 L2 197 7.5 0.174 6.3 LOS A 0.7 5.2 0.26 0.57 52.5
3 R2 62 0.0 0.177 14.8 LOS B 0.6 4.4 0.72 0.88 47.0
Approach 259 5.7 0.177 8.3 LOS A 0.7 5.2 0.37 0.65 51.1
East: Existing Ruakura Rd
4 L2 24 0.0 0.013 5.5 LOS A 0.0 0.0 0.00 0.58 53.6
5 T1 133 1.6 0.069 0.0 LOS A 0.0 0.0 0.00 0.00 60.0
Approach 157 1.3 0.069 0.9 NA 0.0 0.0 0.00 0.09 58.9
West: Existing Ruakura Road
11 T1 298 0.7 0.153 0.0 LOS A 0.0 0.0 0.00 0.00 60.0
12 R2 359 4.4 0.297 6.4 LOS A 1.5 10.7 0.33 0.59 52.2
Approach 657 2.7 0.297 3.5 NA 1.5 10.7 0.18 0.32 55.5
All Vehicles 1073 3.2 0.297 4.3 NA 1.5 10.7 0.20 0.37 54.8
Level of Service (LOS) Method: Delay (HCM 2000).
Vehicle movement LOS values are based on average delay per movement
Minor Road Approach LOS values are based on average delay for all vehicle movements.
NA: Intersection LOS and Major Road Approach LOS values are Not Applicable for two-way sign control since the average delay is not a
good LOS measure due to zero delays associated with major road movements.
SIDRA Standard Delay Model is used. Control Delay includes Geometric Delay.
Gap-Acceptance Capacity: SIDRA Standard (Akçelik M3D).
HV (%) values are calculated for All Movement Classes of All Heavy Vehicle Model Designation.
Processed: Monday, 25 August 2014 15:45:02SIDRA INTERSECTION 6.0.22.4722
Copyright © 2000-2014 Akcelik and Associates Pty Ltdwww.sidrasolutions.com
Project: O:\ha_civ\231695 hamilton expressway\Secondary Investigation and SARA\Scheme Design\Transportation\AEE traffic\Ruakura Alteration- 2014\AEE report July14\assessment\Spine Rd Signals_mpm.sip68000051, OPUS INTERNATIONAL CONSULTANTS, NETWORK / Enterprise

SITE LAYOUT
Site: 2041 AM Baseline
Relocated Ruakura Road/Existing Ruakura Road (west)Signals2041 - WRTM AM - Net 35 BASELINESignals - Fixed Time
Created: Thursday, 28 August 2014 09:33:23SIDRA INTERSECTION 6.0.22.4722
Copyright © 2000-2014 Akcelik and Associates Pty Ltdwww.sidrasolutions.com
Project: O:\ha_civ\231695 hamilton expressway\Secondary Investigation and SARA\Scheme Design\Transportation\AEE traffic\Ruakura Alteration- 2014\AEE report July14\assessment\Spine Rd Signals_mpm.sip68000051, OPUS INTERNATIONAL CONSULTANTS, NETWORK / Enterprise

MOVEMENT SUMMARY
Site: 2041 AM Baseline
Relocated Ruakura Road/Existing Ruakura Road (west)Signals2041 - WRTM AM - Net 35 BASELINESignals - Fixed Time Cycle Time = 70 seconds (Practical Cycle Time)
Movement Performance - Vehicles
Demand Flows 95% Back of QueueMov
ID
OD
Mov
Deg.
Satn
Average
Delay
Level of
Service
Prop.
Queued
Effective
Stop Rate
Average
Speed Total HV Vehicles Distanceveh/h % v/c sec veh m per veh km/h
South: Exisitng Ruakura Road
1 L2 51 4.2 0.052 13.6 LOS B 0.8 5.8 0.49 0.67 47.8
3 R2 297 6.0 0.834 41.5 LOS D 11.4 83.8 1.00 0.97 35.1
Approach 347 5.8 0.834 37.5 LOS D 11.4 83.8 0.93 0.92 36.5
East: Relocated Ruakura Road
4 L2 455 3.9 0.323 6.4 LOS A 1.9 14.0 0.25 0.62 53.2
5 T1 387 21.7 0.610 29.8 LOS C 6.4 53.3 0.97 0.81 40.3
Approach 842 12.1 0.610 17.2 LOS B 6.4 53.3 0.58 0.71 46.4
West: Spine Road
11 T1 895 9.9 0.855 33.7 LOS C 17.3 131.6 1.00 1.04 38.6
12 R2 39 2.7 0.060 21.5 LOS C 0.9 6.3 0.68 0.70 43.4
Approach 934 9.6 0.855 33.2 LOS C 17.3 131.6 0.99 1.03 38.8
All Vehicles 2123 10.0 0.855 27.5 LOS C 17.3 131.6 0.82 0.88 41.0
Level of Service (LOS) Method: Delay (HCM 2000).
Vehicle movement LOS values are based on average delay per movement
Intersection and Approach LOS values are based on average delay for all vehicle movements.
SIDRA Standard Delay Model is used. Control Delay includes Geometric Delay.
Gap-Acceptance Capacity: SIDRA Standard (Akçelik M3D).
HV (%) values are calculated for All Movement Classes of All Heavy Vehicle Model Designation.
Movement Performance - Pedestrians
Average Back of QueueMovID Description
DemandFlow
AverageDelay
Level ofService
Prop. Queued
Effective Stop RatePedestrian Distance
ped/h sec ped m per ped
P1 South Full Crossing 53 29.3 LOS C 0.1 0.1 0.92 0.92
P2 East Full Crossing 53 29.3 LOS C 0.1 0.1 0.92 0.92
All Pedestrians 105 29.3 LOS C 0.92 0.92
Level of Service (LOS) Method: SIDRA Pedestrian LOS Method (Based on Average Delay)
Pedestrian movement LOS values are based on average delay per pedestrian movement.
Intersection LOS value for Pedestrians is based on average delay for all pedestrian movements.
Processed: Monday, 25 August 2014 15:45:03SIDRA INTERSECTION 6.0.22.4722
Copyright © 2000-2014 Akcelik and Associates Pty Ltdwww.sidrasolutions.com
Project: O:\ha_civ\231695 hamilton expressway\Secondary Investigation and SARA\Scheme Design\Transportation\AEE traffic\Ruakura Alteration- 2014\AEE report July14\assessment\Spine Rd Signals_mpm.sip68000051, OPUS INTERNATIONAL CONSULTANTS, NETWORK / Enterprise

MOVEMENT SUMMARY
Site: 2041 PM Baseline
Relocated Ruakura Road/Existing Ruakura Road (west)Signals2041 - WRTM PM - Net 35 BASELINESignals - Fixed Time Cycle Time = 80 seconds (Practical Cycle Time)
Movement Performance - Vehicles
Demand Flows 95% Back of QueueMov
ID
OD
Mov
Deg.
Satn
Average
Delay
Level of
Service
Prop.
Queued
Effective
Stop Rate
Average
Speed Total HV Vehicles Distanceveh/h % v/c sec veh m per veh km/h
South: Existing Ruakura Road
1 L2 106 1.0 0.092 11.9 LOS B 1.6 11.5 0.42 0.67 49.0
3 R2 476 3.1 0.806 36.8 LOS D 18.9 136.0 0.98 0.92 36.8
Approach 582 2.7 0.806 32.3 LOS C 18.9 136.0 0.88 0.88 38.5
East: Relocated Ruakura Road
4 L2 333 4.1 0.228 6.5 LOS A 1.7 12.3 0.23 0.62 53.3
5 T1 646 15.1 0.809 37.2 LOS D 13.5 106.6 1.00 0.97 37.2
Approach 979 11.4 0.809 26.8 LOS C 13.5 106.6 0.74 0.85 41.5
West: Spine Road
11 T1 518 18.9 0.663 31.9 LOS C 9.6 78.4 0.96 0.83 39.3
12 R2 68 1.5 0.166 32.9 LOS C 2.2 15.5 0.84 0.74 38.2
Approach 586 16.9 0.663 32.0 LOS C 9.6 78.4 0.95 0.82 39.2
All Vehicles 2147 10.5 0.809 29.7 LOS C 18.9 136.0 0.83 0.85 40.0
Level of Service (LOS) Method: Delay (HCM 2000).
Vehicle movement LOS values are based on average delay per movement
Intersection and Approach LOS values are based on average delay for all vehicle movements.
SIDRA Standard Delay Model is used. Control Delay includes Geometric Delay.
Gap-Acceptance Capacity: SIDRA Standard (Akçelik M3D).
HV (%) values are calculated for All Movement Classes of All Heavy Vehicle Model Designation.
Movement Performance - Pedestrians
Average Back of QueueMovID Description
DemandFlow
AverageDelay
Level ofService
Prop. Queued
Effective Stop RatePedestrian Distance
ped/h sec ped m per ped
P1 South Full Crossing 53 29.8 LOS C 0.1 0.1 0.86 0.86
P2 East Full Crossing 53 34.3 LOS D 0.1 0.1 0.93 0.93
All Pedestrians 105 32.1 LOS D 0.90 0.90
Level of Service (LOS) Method: SIDRA Pedestrian LOS Method (Based on Average Delay)
Pedestrian movement LOS values are based on average delay per pedestrian movement.
Intersection LOS value for Pedestrians is based on average delay for all pedestrian movements.
Processed: Monday, 25 August 2014 15:45:04SIDRA INTERSECTION 6.0.22.4722
Copyright © 2000-2014 Akcelik and Associates Pty Ltdwww.sidrasolutions.com
Project: O:\ha_civ\231695 hamilton expressway\Secondary Investigation and SARA\Scheme Design\Transportation\AEE traffic\Ruakura Alteration- 2014\AEE report July14\assessment\Spine Rd Signals_mpm.sip68000051, OPUS INTERNATIONAL CONSULTANTS, NETWORK / Enterprise

SITE LAYOUT
Site: 2021 AM Scheme
Relocated Ruakura Road/Existing Ruakura Road (west)Tee Intersection2021 - WRTM AM - Net 36 SCHEMEGiveway / Yield (Two-Way)
Created: Thursday, 28 August 2014 09:33:27SIDRA INTERSECTION 6.0.22.4722
Copyright © 2000-2014 Akcelik and Associates Pty Ltdwww.sidrasolutions.com
Project: O:\ha_civ\231695 hamilton expressway\Secondary Investigation and SARA\Scheme Design\Transportation\AEE traffic\Ruakura Alteration- 2014\AEE report July14\assessment\Spine Rd Signals_mpm.sip68000051, OPUS INTERNATIONAL CONSULTANTS, NETWORK / Enterprise

MOVEMENT SUMMARY
Site: 2021 AM Scheme
Relocated Ruakura Road/Existing Ruakura Road (west)Tee Intersection2021 - WRTM AM - Net 36 SCHEMEGiveway / Yield (Two-Way)
Movement Performance - Vehicles
Demand Flows 95% Back of QueueMov
ID
OD
Mov
Deg.
Satn
Average
Delay
Level of
Service
Prop.
Queued
Effective
Stop Rate
Average
Speed Total HV Vehicles Distanceveh/h % v/c sec veh m per veh km/h
East: Relocated Ruakura Road
5 T1 591 1.2 0.305 0.0 LOS A 0.0 0.0 0.00 0.00 59.9
6 R2 2 0.0 0.002 7.0 LOS A 0.0 0.1 0.46 0.55 52.0
Approach 593 1.2 0.305 0.1 NA 0.0 0.1 0.00 0.00 59.9
North: Existing Ruakura Road
7 L2 4 0.0 0.004 7.0 LOS A 0.0 0.1 0.43 0.57 52.3
9 R2 14 7.7 0.054 18.7 LOS C 0.2 1.3 0.79 0.92 44.3
Approach 18 5.9 0.054 16.0 LOS C 0.2 1.3 0.71 0.84 46.0
West: Existing Ruakura Road
10 L2 8 12.5 0.231 5.7 LOS A 0.0 0.0 0.00 0.01 57.6
11 T1 436 1.7 0.231 0.0 LOS A 0.0 0.0 0.00 0.01 59.9
Approach 444 1.9 0.231 0.1 NA 0.0 0.0 0.00 0.01 59.8
All Vehicles 1055 1.6 0.305 0.4 NA 0.2 1.3 0.01 0.02 59.6
Level of Service (LOS) Method: Delay (HCM 2000).
Vehicle movement LOS values are based on average delay per movement
Minor Road Approach LOS values are based on average delay for all vehicle movements.
NA: Intersection LOS and Major Road Approach LOS values are Not Applicable for two-way sign control since the average delay is not a
good LOS measure due to zero delays associated with major road movements.
SIDRA Standard Delay Model is used. Control Delay includes Geometric Delay.
Gap-Acceptance Capacity: SIDRA Standard (Akçelik M3D).
HV (%) values are calculated for All Movement Classes of All Heavy Vehicle Model Designation.
Processed: Monday, 25 August 2014 15:45:06SIDRA INTERSECTION 6.0.22.4722
Copyright © 2000-2014 Akcelik and Associates Pty Ltdwww.sidrasolutions.com
Project: O:\ha_civ\231695 hamilton expressway\Secondary Investigation and SARA\Scheme Design\Transportation\AEE traffic\Ruakura Alteration- 2014\AEE report July14\assessment\Spine Rd Signals_mpm.sip68000051, OPUS INTERNATIONAL CONSULTANTS, NETWORK / Enterprise

MOVEMENT SUMMARY
Site: 2021 PM Scheme
Relocated Ruakura Road/Existing Ruakura Road (west)Tee Intersection2021 - WRTM PM - Net 36 SCHEMEGiveway / Yield (Two-Way)
Movement Performance - Vehicles
Demand Flows 95% Back of QueueMov
ID
OD
Mov
Deg.
Satn
Average
Delay
Level of
Service
Prop.
Queued
Effective
Stop Rate
Average
Speed Total HV Vehicles Distanceveh/h % v/c sec veh m per veh km/h
East: Relocated Ruakura Road
5 T1 317 2.3 0.165 0.0 LOS A 0.0 0.0 0.00 0.00 60.0
6 R2 3 0.0 0.004 8.3 LOS A 0.0 0.1 0.56 0.63 51.3
Approach 320 2.3 0.165 0.1 NA 0.0 0.1 0.01 0.01 59.9
North: Existing Ruakura Road
7 L2 3 0.0 0.004 8.2 LOS A 0.0 0.1 0.53 0.63 51.6
9 R2 11 10.0 0.040 18.0 LOS C 0.1 1.0 0.78 0.91 44.6
Approach 14 7.7 0.040 15.7 LOS C 0.1 1.0 0.72 0.85 46.1
West: Existing Ruakura Road
10 L2 15 7.1 0.343 5.7 LOS A 0.0 0.0 0.00 0.01 57.8
11 T1 647 1.3 0.343 0.0 LOS A 0.0 0.0 0.00 0.01 59.8
Approach 662 1.4 0.343 0.2 NA 0.0 0.0 0.00 0.01 59.8
All Vehicles 996 1.8 0.343 0.4 NA 0.1 1.0 0.01 0.02 59.5
Level of Service (LOS) Method: Delay (HCM 2000).
Vehicle movement LOS values are based on average delay per movement
Minor Road Approach LOS values are based on average delay for all vehicle movements.
NA: Intersection LOS and Major Road Approach LOS values are Not Applicable for two-way sign control since the average delay is not a
good LOS measure due to zero delays associated with major road movements.
SIDRA Standard Delay Model is used. Control Delay includes Geometric Delay.
Gap-Acceptance Capacity: SIDRA Standard (Akçelik M3D).
HV (%) values are calculated for All Movement Classes of All Heavy Vehicle Model Designation.
Processed: Monday, 25 August 2014 15:45:07SIDRA INTERSECTION 6.0.22.4722
Copyright © 2000-2014 Akcelik and Associates Pty Ltdwww.sidrasolutions.com
Project: O:\ha_civ\231695 hamilton expressway\Secondary Investigation and SARA\Scheme Design\Transportation\AEE traffic\Ruakura Alteration- 2014\AEE report July14\assessment\Spine Rd Signals_mpm.sip68000051, OPUS INTERNATIONAL CONSULTANTS, NETWORK / Enterprise

SITE LAYOUT
Site: 2041 AM Scheme
Relocated Ruakura Road/Existing Ruakura Road (west)Signals2041 - WRTM AM - Net 36 SCHEMESignals - Fixed Time
Created: Thursday, 28 August 2014 09:33:33SIDRA INTERSECTION 6.0.22.4722
Copyright © 2000-2014 Akcelik and Associates Pty Ltdwww.sidrasolutions.com
Project: O:\ha_civ\231695 hamilton expressway\Secondary Investigation and SARA\Scheme Design\Transportation\AEE traffic\Ruakura Alteration- 2014\AEE report July14\assessment\Spine Rd Signals_mpm.sip68000051, OPUS INTERNATIONAL CONSULTANTS, NETWORK / Enterprise

MOVEMENT SUMMARY
Site: 2041 AM Scheme
Relocated Ruakura Road/Existing Ruakura Road (west)Signals2041 - WRTM AM - Net 36 SCHEMESignals - Fixed Time Cycle Time = 70 seconds (Practical Cycle Time)
Movement Performance - Vehicles
Demand Flows 95% Back of QueueMov
ID
OD
Mov
Deg.
Satn
Average
Delay
Level of
Service
Prop.
Queued
Effective
Stop Rate
Average
Speed Total HV Vehicles Distanceveh/h % v/c sec veh m per veh km/h
South: Exisitng Ruakura Road
1 L2 51 2.1 0.050 13.1 LOS B 0.8 5.5 0.48 0.67 48.2
3 R2 289 5.5 0.756 37.0 LOS D 10.2 74.9 0.99 0.90 36.7
Approach 340 5.0 0.756 33.4 LOS C 10.2 74.9 0.92 0.87 38.0
East: Relcoated Ruakura Road
4 L2 532 3.0 0.370 6.5 LOS A 2.4 17.3 0.27 0.63 53.2
5 T1 371 8.8 0.502 27.9 LOS C 5.8 44.0 0.94 0.76 41.1
Approach 902 5.4 0.502 15.2 LOS B 5.8 44.0 0.54 0.68 47.5
West: Spine Road
11 T1 747 4.4 0.726 27.0 LOS C 12.4 89.9 0.97 0.87 41.5
12 R2 25 4.2 0.043 22.8 LOS C 0.6 4.3 0.71 0.69 42.7
Approach 773 4.4 0.726 26.9 LOS C 12.4 89.9 0.96 0.87 41.6
All Vehicles 2015 4.9 0.756 22.8 LOS C 12.4 89.9 0.76 0.79 43.3
Level of Service (LOS) Method: Delay (HCM 2000).
Vehicle movement LOS values are based on average delay per movement
Intersection and Approach LOS values are based on average delay for all vehicle movements.
SIDRA Standard Delay Model is used. Control Delay includes Geometric Delay.
Gap-Acceptance Capacity: SIDRA Standard (Akçelik M3D).
HV (%) values are calculated for All Movement Classes of All Heavy Vehicle Model Designation.
Movement Performance - Pedestrians
Average Back of QueueMovID Description
DemandFlow
AverageDelay
Level ofService
Prop. Queued
Effective Stop RatePedestrian Distance
ped/h sec ped m per ped
P1 South Full Crossing 53 28.4 LOS C 0.1 0.1 0.90 0.90
P2 East Full Crossing 53 29.3 LOS C 0.1 0.1 0.92 0.92
All Pedestrians 105 28.9 LOS C 0.91 0.91
Level of Service (LOS) Method: SIDRA Pedestrian LOS Method (Based on Average Delay)
Pedestrian movement LOS values are based on average delay per pedestrian movement.
Intersection LOS value for Pedestrians is based on average delay for all pedestrian movements.
Processed: Monday, 25 August 2014 15:45:08SIDRA INTERSECTION 6.0.22.4722
Copyright © 2000-2014 Akcelik and Associates Pty Ltdwww.sidrasolutions.com
Project: O:\ha_civ\231695 hamilton expressway\Secondary Investigation and SARA\Scheme Design\Transportation\AEE traffic\Ruakura Alteration- 2014\AEE report July14\assessment\Spine Rd Signals_mpm.sip68000051, OPUS INTERNATIONAL CONSULTANTS, NETWORK / Enterprise

MOVEMENT SUMMARY
Site: 2041 PM Scheme
Relocated Ruakura Road/Existing Ruakura Road (west)Signals2041 - WRTM PM - Net 36 SCHEMESignals - Fixed Time Cycle Time = 80 seconds (Practical Cycle Time)
Movement Performance - Vehicles
Demand Flows 95% Back of QueueMov
ID
OD
Mov
Deg.
Satn
Average
Delay
Level of
Service
Prop.
Queued
Effective
Stop Rate
Average
Speed Total HV Vehicles Distanceveh/h % v/c sec veh m per veh km/h
South: Exisitng Ruakura Road
1 L2 105 1.0 0.085 10.3 LOS B 1.4 9.8 0.36 0.66 50.1
3 R2 579 2.4 0.845 37.3 LOS D 24.1 171.9 0.98 0.95 36.6
Approach 684 2.2 0.845 33.2 LOS C 24.1 171.9 0.89 0.91 38.2
East: Relocated Ruakura Road
4 L2 327 3.9 0.224 6.5 LOS A 1.7 12.0 0.23 0.62 53.3
5 T1 495 7.2 0.759 37.6 LOS D 10.0 74.7 1.00 0.91 37.1
Approach 822 5.9 0.759 25.2 LOS C 10.0 74.7 0.69 0.80 42.2
West: Spine Road
11 T1 518 6.9 0.793 39.0 LOS D 10.8 80.0 1.00 0.94 36.6
12 R2 67 0.0 0.161 32.8 LOS C 2.1 15.0 0.84 0.74 38.3
Approach 585 6.1 0.793 38.3 LOS D 10.8 80.0 0.98 0.92 36.8
All Vehicles 2092 4.7 0.845 31.5 LOS C 24.1 171.9 0.84 0.87 39.2
Level of Service (LOS) Method: Delay (HCM 2000).
Vehicle movement LOS values are based on average delay per movement
Intersection and Approach LOS values are based on average delay for all vehicle movements.
SIDRA Standard Delay Model is used. Control Delay includes Geometric Delay.
Gap-Acceptance Capacity: SIDRA Standard (Akçelik M3D).
HV (%) values are calculated for All Movement Classes of All Heavy Vehicle Model Designation.
Movement Performance - Pedestrians
Average Back of QueueMovID Description
DemandFlow
AverageDelay
Level ofService
Prop. Queued
Effective Stop RatePedestrian Distance
ped/h sec ped m per ped
P1 South Full Crossing 53 33.4 LOS D 0.1 0.1 0.91 0.91
P2 East Full Crossing 53 34.3 LOS D 0.1 0.1 0.93 0.93
All Pedestrians 105 33.8 LOS D 0.92 0.92
Level of Service (LOS) Method: SIDRA Pedestrian LOS Method (Based on Average Delay)
Pedestrian movement LOS values are based on average delay per pedestrian movement.
Intersection LOS value for Pedestrians is based on average delay for all pedestrian movements.
Processed: Monday, 25 August 2014 15:45:09SIDRA INTERSECTION 6.0.22.4722
Copyright © 2000-2014 Akcelik and Associates Pty Ltdwww.sidrasolutions.com
Project: O:\ha_civ\231695 hamilton expressway\Secondary Investigation and SARA\Scheme Design\Transportation\AEE traffic\Ruakura Alteration- 2014\AEE report July14\assessment\Spine Rd Signals_mpm.sip68000051, OPUS INTERNATIONAL CONSULTANTS, NETWORK / Enterprise

(This page has been intentionally left blank)

SITE LAYOUT
Site: 2021 AM BASELINE
Realigned Ruakura Road/Silverdale RoadNote: 1car/hr applied to all movements with 0 flow in WRTM model2021 - WRTM AM - Net 35 BASELINESignals - Fixed Time
Created: Thursday, 28 August 2014 09:26:22SIDRA INTERSECTION 6.0.22.4722
Copyright © 2000-2014 Akcelik and Associates Pty Ltdwww.sidrasolutions.com
Project: O:\ha_civ\231695 hamilton expressway\Secondary Investigation and SARA\Scheme Design\Transportation\AEE traffic\Ruakura Alteration- 2014\AEE report July14\assessment\Silverdale X Rd Signal_mpm.sip68000051, OPUS INTERNATIONAL CONSULTANTS, NETWORK / Enterprise

MOVEMENT SUMMARY
Site: 2021 AM BASELINE
Realigned Ruakura Road/Silverdale RoadNote: 1car/hr applied to all movements with 0 flow in WRTM model2021 - WRTM AM - Net 35 BASELINESignals - Fixed Time Cycle Time = 50 seconds (Practical Cycle Time)
Movement Performance - Vehicles
Demand Flows 95% Back of QueueMov
ID
OD
Mov
Deg.
Satn
Average
Delay
Level of
Service
Prop.
Queued
Effective
Stop Rate
Average
Speed Total HV Vehicles Distanceveh/h % v/c sec veh m per veh km/h
South: Ruakura Road
1 L2 11 90.0 0.078 29.7 LOS C 0.3 3.1 0.91 0.68 38.0
2 T1 13 83.3 0.083 23.0 LOS C 0.3 3.6 0.92 0.63 38.1
3 R2 1 0.0 0.004 25.9 LOS C 0.0 0.2 0.90 0.58 36.5
Approach 24 82.6 0.083 26.0 LOS C 0.3 3.6 0.91 0.65 38.0
East: Port Access (Cars only)
4 L2 1 0.0 0.009 26.1 LOS C 0.0 0.3 0.90 0.58 37.4
5 T1 1 0.0 0.009 21.6 LOS C 0.0 0.3 0.90 0.58 37.7
6 R2 1 0.0 0.007 29.4 LOS C 0.0 0.2 0.96 0.57 35.5
Approach 3 0.0 0.009 25.7 LOS C 0.0 0.3 0.92 0.57 36.8
North: Ruakura Road
7 L2 40 0.0 0.054 14.5 LOS B 0.6 4.2 0.64 0.67 41.4
8 T1 11 100.0 0.014 3.5 LOS A 0.1 1.2 0.38 0.27 47.7
9 R2 431 1.0 0.584 17.6 LOS B 8.5 59.7 0.83 0.81 40.2
Approach 481 3.1 0.584 17.0 LOS B 8.5 59.7 0.81 0.78 40.4
West: Silverdale Road
10 L2 358 0.9 0.303 8.9 LOS A 3.9 27.7 0.48 0.69 44.2
11 T1 20 0.0 0.085 22.3 LOS C 0.5 3.2 0.92 0.64 38.3
12 R2 9 100.0 0.053 28.6 LOS C 0.2 2.9 0.91 0.67 39.2
Approach 387 3.3 0.303 10.1 LOS B 3.9 27.7 0.51 0.68 43.7
All Vehicles 896 5.3 0.584 14.3 LOS B 8.5 59.7 0.68 0.74 41.7
Level of Service (LOS) Method: Delay (HCM 2000).
Vehicle movement LOS values are based on average delay per movement
Intersection and Approach LOS values are based on average delay for all vehicle movements.
SIDRA Standard Delay Model is used. Control Delay includes Geometric Delay.
Gap-Acceptance Capacity: SIDRA Standard (Akçelik M3D).
HV (%) values are calculated for All Movement Classes of All Heavy Vehicle Model Designation.
Processed: Monday, 25 August 2014 13:58:12SIDRA INTERSECTION 6.0.22.4722
Copyright © 2000-2014 Akcelik and Associates Pty Ltdwww.sidrasolutions.com
Project: O:\ha_civ\231695 hamilton expressway\Secondary Investigation and SARA\Scheme Design\Transportation\AEE traffic\Ruakura Alteration- 2014\AEE report July14\assessment\Silverdale X Rd Signal_mpm.sip68000051, OPUS INTERNATIONAL CONSULTANTS, NETWORK / Enterprise

MOVEMENT SUMMARY
Site: 2021 PM BASELINE
Realigned Ruakura Road/Silverdale RoadNote: 1car/hr applied to all movements with 0 flow in WRTM model2021 - WRTM PM - Net 35 BASELINESignals - Fixed Time Cycle Time = 40 seconds (Practical Cycle Time)
Movement Performance - Vehicles
Demand Flows 95% Back of QueueMov
ID
OD
Mov
Deg.
Satn
Average
Delay
Level of
Service
Prop.
Queued
Effective
Stop Rate
Average
Speed Total HV Vehicles Distanceveh/h % v/c sec veh m per veh km/h
South: Ruakura Road
1 L2 35 30.3 0.152 23.2 LOS C 0.6 5.7 0.90 0.71 41.9
2 T1 49 23.4 0.195 17.4 LOS B 0.9 7.7 0.91 0.68 40.4
3 R2 1 0.0 0.004 20.5 LOS C 0.0 0.1 0.87 0.58 38.6
Approach 85 25.9 0.195 19.8 LOS B 0.9 7.7 0.91 0.69 41.0
East: Port Access (Cars only)
4 L2 1 0.0 0.007 20.7 LOS C 0.0 0.3 0.87 0.57 39.7
5 T1 1 0.0 0.007 16.1 LOS B 0.0 0.3 0.87 0.57 40.0
6 R2 1 0.0 0.005 22.7 LOS C 0.0 0.1 0.92 0.57 37.9
Approach 3 0.0 0.007 19.8 LOS B 0.0 0.3 0.88 0.57 39.2
North: Ruakura Road
7 L2 2 0.0 0.005 16.8 LOS B 0.0 0.2 0.77 0.60 40.3
8 T1 12 100.0 0.018 4.5 LOS A 0.1 1.4 0.47 0.33 47.1
9 R2 368 1.1 0.800 24.3 LOS C 8.1 57.5 0.99 1.00 37.4
Approach 382 4.1 0.800 23.6 LOS C 8.1 57.5 0.98 0.98 37.7
West: Silverdale Road
10 L2 209 1.5 0.207 9.6 LOS A 2.1 15.0 0.54 0.69 43.8
11 T1 1 0.0 0.004 16.0 LOS B 0.0 0.1 0.87 0.51 41.1
12 R2 11 100.0 0.047 22.9 LOS C 0.2 2.5 0.88 0.67 41.7
Approach 221 6.2 0.207 10.3 LOS B 2.1 15.0 0.56 0.69 43.7
All Vehicles 692 7.5 0.800 18.9 LOS B 8.1 57.5 0.83 0.85 39.8
Level of Service (LOS) Method: Delay (HCM 2000).
Vehicle movement LOS values are based on average delay per movement
Intersection and Approach LOS values are based on average delay for all vehicle movements.
SIDRA Standard Delay Model is used. Control Delay includes Geometric Delay.
Gap-Acceptance Capacity: SIDRA Standard (Akçelik M3D).
HV (%) values are calculated for All Movement Classes of All Heavy Vehicle Model Designation.
Processed: Monday, 25 August 2014 13:58:14SIDRA INTERSECTION 6.0.22.4722
Copyright © 2000-2014 Akcelik and Associates Pty Ltdwww.sidrasolutions.com
Project: O:\ha_civ\231695 hamilton expressway\Secondary Investigation and SARA\Scheme Design\Transportation\AEE traffic\Ruakura Alteration- 2014\AEE report July14\assessment\Silverdale X Rd Signal_mpm.sip68000051, OPUS INTERNATIONAL CONSULTANTS, NETWORK / Enterprise

SITE LAYOUT
Site: 2041 AM BASELINE
Realigned Ruakura Road/Silverdale RoadNote: 1car/hr applied to all movements with 0 flow in WRTM model2041 - WRTM AM - Net 35 BASELINESignals - Fixed Time
Created: Thursday, 28 August 2014 09:26:40SIDRA INTERSECTION 6.0.22.4722
Copyright © 2000-2014 Akcelik and Associates Pty Ltdwww.sidrasolutions.com
Project: O:\ha_civ\231695 hamilton expressway\Secondary Investigation and SARA\Scheme Design\Transportation\AEE traffic\Ruakura Alteration- 2014\AEE report July14\assessment\Silverdale X Rd Signal_mpm.sip68000051, OPUS INTERNATIONAL CONSULTANTS, NETWORK / Enterprise

MOVEMENT SUMMARY
Site: 2041 AM BASELINE
Realigned Ruakura Road/Silverdale RoadNote: 1car/hr applied to all movements with 0 flow in WRTM model2041 - WRTM AM - Net 35 BASELINESignals - Fixed Time Cycle Time = 70 seconds (Practical Cycle Time)
Movement Performance - Vehicles
Demand Flows 95% Back of QueueMov
ID
OD
Mov
Deg.
Satn
Average
Delay
Level of
Service
Prop.
Queued
Effective
Stop Rate
Average
Speed Total HV Vehicles Distanceveh/h % v/c sec veh m per veh km/h
South: Ruakura Road South
1 L2 35 0.0 0.164 37.2 LOS D 1.1 7.9 0.94 0.72 36.6
2 T1 314 23.2 0.810 39.0 LOS D 6.1 50.8 1.00 0.96 36.6
3 R2 1 0.0 0.006 34.8 LOS C 0.0 0.2 0.90 0.59 33.6
Approach 349 20.8 0.810 38.8 LOS D 6.1 50.8 0.99 0.94 36.6
East: Port Access
4 L2 1 0.0 0.013 37.2 LOS D 0.1 0.5 0.93 0.59 33.7
5 T1 1 0.0 0.013 32.6 LOS C 0.1 0.5 0.93 0.59 33.9
6 R2 1 0.0 0.008 38.3 LOS D 0.0 0.2 0.95 0.58 32.8
Approach 3 0.0 0.013 36.0 LOS D 0.1 0.5 0.94 0.59 33.4
North: Ruakura Road North
7 L2 75 0.0 0.074 12.7 LOS B 1.2 8.4 0.50 0.66 42.3
8 T1 318 22.8 0.126 2.7 LOS A 1.5 12.7 0.30 0.25 57.4
9 R2 798 4.1 0.883 31.9 LOS C 29.7 215.5 0.88 0.97 38.8
Approach 1191 8.8 0.883 22.9 LOS C 29.7 215.5 0.70 0.76 42.7
West: Silverdale Road
10 L2 529 5.6 0.415 10.0 LOS A 7.3 53.6 0.44 0.71 50.2
11 T1 31 0.0 0.183 34.1 LOS C 1.0 7.2 0.96 0.69 34.2
12 R2 23 0.0 0.135 39.3 LOS D 0.8 5.4 0.95 0.70 36.1
Approach 583 5.1 0.415 12.4 LOS B 7.3 53.6 0.48 0.71 48.3
All Vehicles 2126 9.8 0.883 22.6 LOS C 29.7 215.5 0.69 0.78 42.9
Level of Service (LOS) Method: Delay (HCM 2000).
Vehicle movement LOS values are based on average delay per movement
Intersection and Approach LOS values are based on average delay for all vehicle movements.
SIDRA Standard Delay Model is used. Control Delay includes Geometric Delay.
Gap-Acceptance Capacity: SIDRA Standard (Akçelik M3D).
HV (%) values are calculated for All Movement Classes of All Heavy Vehicle Model Designation.
Processed: Monday, 25 August 2014 16:21:01SIDRA INTERSECTION 6.0.22.4722
Copyright © 2000-2014 Akcelik and Associates Pty Ltdwww.sidrasolutions.com
Project: O:\ha_civ\231695 hamilton expressway\Secondary Investigation and SARA\Scheme Design\Transportation\AEE traffic\Ruakura Alteration- 2014\AEE report July14\assessment\Silverdale X Rd Signal_mpm.sip68000051, OPUS INTERNATIONAL CONSULTANTS, NETWORK / Enterprise

MOVEMENT SUMMARY
Site: 2041 PM BASELINE
Realigned Ruakura Road/Silverdale RoadNote: 1car/hr applied to all movements with 0 flow in WRTM model2041 - WRTM PM - Net 35 BASELINESignals - Fixed Time Cycle Time = 60 seconds (Practical Cycle Time)
Movement Performance - Vehicles
Demand Flows 95% Back of QueueMov
ID
OD
Mov
Deg.
Satn
Average
Delay
Level of
Service
Prop.
Queued
Effective
Stop Rate
Average
Speed Total HV Vehicles Distanceveh/h % v/c sec veh m per veh km/h
South: Ruakura Road South
1 L2 22 0.0 0.071 29.0 LOS C 0.6 4.0 0.87 0.70 39.9
2 T1 458 17.0 0.782 30.6 LOS C 7.4 59.0 1.00 0.95 40.0
3 R2 1 0.0 0.004 27.4 LOS C 0.0 0.2 0.85 0.59 36.1
Approach 481 16.2 0.782 30.5 LOS C 7.4 59.0 0.99 0.94 40.0
East: Port Access
4 L2 1 0.0 0.011 31.7 LOS C 0.1 0.4 0.92 0.58 35.5
5 T1 1 0.0 0.011 27.1 LOS C 0.1 0.4 0.92 0.58 35.7
6 R2 1 0.0 0.006 31.6 LOS C 0.0 0.2 0.92 0.58 34.9
Approach 3 0.0 0.011 30.1 LOS C 0.1 0.4 0.92 0.58 35.3
North: Ruakura Road North
7 L2 4 0.0 0.005 14.8 LOS B 0.1 0.5 0.58 0.60 41.3
8 T1 375 21.6 0.157 3.3 LOS A 1.8 15.3 0.36 0.30 57.0
9 R2 616 5.3 0.830 27.8 LOS C 18.8 137.8 0.93 0.95 40.5
Approach 995 11.4 0.830 18.5 LOS B 18.8 137.8 0.71 0.70 45.4
West: Silverdale Road
10 L2 521 6.3 0.463 11.8 LOS B 8.0 58.6 0.56 0.75 49.0
11 T1 2 0.0 0.011 27.1 LOS C 0.1 0.4 0.92 0.56 36.6
12 R2 35 0.0 0.174 33.9 LOS C 1.0 6.9 0.95 0.71 38.1
Approach 558 5.8 0.463 13.2 LOS B 8.0 58.6 0.58 0.75 48.0
All Vehicles 2037 11.0 0.830 19.9 LOS B 18.8 137.8 0.74 0.77 44.6
Level of Service (LOS) Method: Delay (HCM 2000).
Vehicle movement LOS values are based on average delay per movement
Intersection and Approach LOS values are based on average delay for all vehicle movements.
SIDRA Standard Delay Model is used. Control Delay includes Geometric Delay.
Gap-Acceptance Capacity: SIDRA Standard (Akçelik M3D).
HV (%) values are calculated for All Movement Classes of All Heavy Vehicle Model Designation.
Processed: Monday, 25 August 2014 13:59:25SIDRA INTERSECTION 6.0.22.4722
Copyright © 2000-2014 Akcelik and Associates Pty Ltdwww.sidrasolutions.com
Project: O:\ha_civ\231695 hamilton expressway\Secondary Investigation and SARA\Scheme Design\Transportation\AEE traffic\Ruakura Alteration- 2014\AEE report July14\assessment\Silverdale X Rd Signal_mpm.sip68000051, OPUS INTERNATIONAL CONSULTANTS, NETWORK / Enterprise

SITE LAYOUT
Site: 2021 AM SCHEME
Realigned Ruakura Road/Silverdale RoadNote: 1car/hr applied to all movements with 0 flow in WRTM model2021 - WRTM AM - Net 36 SCHEMESignals - Fixed Time
Created: Thursday, 28 August 2014 09:26:44SIDRA INTERSECTION 6.0.22.4722
Copyright © 2000-2014 Akcelik and Associates Pty Ltdwww.sidrasolutions.com
Project: O:\ha_civ\231695 hamilton expressway\Secondary Investigation and SARA\Scheme Design\Transportation\AEE traffic\Ruakura Alteration- 2014\AEE report July14\assessment\Silverdale X Rd Signal_mpm.sip68000051, OPUS INTERNATIONAL CONSULTANTS, NETWORK / Enterprise

MOVEMENT SUMMARY
Site: 2021 AM SCHEME
Realigned Ruakura Road/Silverdale RoadNote: 1car/hr applied to all movements with 0 flow in WRTM model2021 - WRTM AM - Net 36 SCHEMESignals - Fixed Time Cycle Time = 40 seconds (Practical Cycle Time)
Movement Performance - Vehicles
Demand Flows 95% Back of QueueMov
ID
OD
Mov
Deg.
Satn
Average
Delay
Level of
Service
Prop.
Queued
Effective
Stop Rate
Average
Speed Total HV Vehicles Distanceveh/h % v/c sec veh m per veh km/h
South: Ruakura Road
1 L2 177 1.2 0.640 25.0 LOS C 3.7 25.8 0.99 0.85 41.7
2 T1 214 2.5 0.742 20.9 LOS C 4.6 33.1 1.00 0.94 38.9
3 R2 1 0.0 0.004 20.5 LOS C 0.0 0.1 0.87 0.58 38.6
Approach 392 1.9 0.742 22.7 LOS C 4.6 33.1 0.99 0.90 40.1
East: Port Access (Cars only)
4 L2 1 0.0 0.007 20.7 LOS C 0.0 0.3 0.87 0.57 39.7
5 T1 1 0.0 0.007 16.1 LOS B 0.0 0.3 0.87 0.57 40.0
6 R2 1 0.0 0.005 23.8 LOS C 0.0 0.1 0.94 0.57 37.5
Approach 3 0.0 0.007 20.2 LOS C 0.0 0.3 0.89 0.57 39.0
North: Ruakura Road
7 L2 11 0.0 0.023 17.1 LOS B 0.2 1.1 0.78 0.65 40.2
8 T1 104 5.1 0.100 4.7 LOS A 1.0 7.2 0.50 0.40 47.0
9 R2 326 1.0 0.708 21.6 LOS C 6.6 46.2 0.96 0.91 38.5
Approach 441 1.9 0.708 17.5 LOS B 6.6 46.2 0.85 0.78 40.2
West: Silverdale Road
10 L2 381 0.8 0.375 10.2 LOS B 4.3 30.4 0.60 0.73 43.5
11 T1 20 0.0 0.068 16.6 LOS B 0.4 2.5 0.89 0.62 40.8
12 R2 45 4.7 0.154 22.6 LOS C 0.8 6.0 0.90 0.72 42.8
Approach 446 1.2 0.375 11.7 LOS B 4.3 30.4 0.65 0.72 43.3
All Vehicles 1282 1.6 0.742 17.1 LOS B 6.6 46.2 0.82 0.79 41.2
Level of Service (LOS) Method: Delay (HCM 2000).
Vehicle movement LOS values are based on average delay per movement
Intersection and Approach LOS values are based on average delay for all vehicle movements.
SIDRA Standard Delay Model is used. Control Delay includes Geometric Delay.
Gap-Acceptance Capacity: SIDRA Standard (Akçelik M3D).
HV (%) values are calculated for All Movement Classes of All Heavy Vehicle Model Designation.
Processed: Monday, 25 August 2014 14:01:41SIDRA INTERSECTION 6.0.22.4722
Copyright © 2000-2014 Akcelik and Associates Pty Ltdwww.sidrasolutions.com
Project: O:\ha_civ\231695 hamilton expressway\Secondary Investigation and SARA\Scheme Design\Transportation\AEE traffic\Ruakura Alteration- 2014\AEE report July14\assessment\Silverdale X Rd Signal_mpm.sip68000051, OPUS INTERNATIONAL CONSULTANTS, NETWORK / Enterprise

MOVEMENT SUMMARY
Site: 2021 PM SCHEME
Realigned Ruakura Road/Silverdale RoadNote: 1car/hr applied to all movements with 0 flow in WRTM model2021 - WRTM PM - Net 36 SCHEMESignals - Fixed Time Cycle Time = 40 seconds (Practical Cycle Time)
Movement Performance - Vehicles
Demand Flows 95% Back of QueueMov
ID
OD
Mov
Deg.
Satn
Average
Delay
Level of
Service
Prop.
Queued
Effective
Stop Rate
Average
Speed Total HV Vehicles Distanceveh/h % v/c sec veh m per veh km/h
South: Ruakura Road
1 L2 91 2.3 0.330 23.4 LOS C 1.7 12.3 0.93 0.76 42.5
2 T1 156 3.4 0.544 18.6 LOS B 3.1 22.3 0.97 0.78 39.9
3 R2 1 0.0 0.004 20.6 LOS C 0.0 0.1 0.87 0.58 38.6
Approach 247 3.0 0.544 20.3 LOS C 3.1 22.3 0.96 0.77 40.8
East: Port Access (Cars only)
4 L2 1 0.0 0.007 20.7 LOS C 0.0 0.3 0.87 0.57 39.7
5 T1 1 0.0 0.007 16.1 LOS B 0.0 0.3 0.87 0.57 40.0
6 R2 1 0.0 0.004 21.7 LOS C 0.0 0.1 0.89 0.58 38.3
Approach 3 0.0 0.007 19.5 LOS B 0.0 0.3 0.88 0.57 39.3
North: Ruakura Road
7 L2 1 0.0 0.002 16.8 LOS B 0.0 0.1 0.76 0.58 40.4
8 T1 271 2.3 0.256 5.2 LOS A 2.8 20.1 0.56 0.47 46.7
9 R2 379 0.8 0.821 25.2 LOS C 8.6 60.7 1.00 1.04 37.1
Approach 651 1.5 0.821 16.9 LOS B 8.6 60.7 0.81 0.80 40.5
West: Silverdale Road
10 L2 164 1.9 0.163 9.4 LOS A 1.6 11.5 0.52 0.68 43.9
11 T1 1 0.0 0.004 16.0 LOS B 0.0 0.1 0.87 0.51 41.1
12 R2 138 1.5 0.462 23.7 LOS C 2.7 18.9 0.96 0.78 42.4
Approach 303 1.7 0.462 16.0 LOS B 2.7 18.9 0.72 0.72 43.2
All Vehicles 1204 1.8 0.821 17.4 LOS B 8.6 60.7 0.82 0.77 41.2
Level of Service (LOS) Method: Delay (HCM 2000).
Vehicle movement LOS values are based on average delay per movement
Intersection and Approach LOS values are based on average delay for all vehicle movements.
SIDRA Standard Delay Model is used. Control Delay includes Geometric Delay.
Gap-Acceptance Capacity: SIDRA Standard (Akçelik M3D).
HV (%) values are calculated for All Movement Classes of All Heavy Vehicle Model Designation.
Processed: Monday, 25 August 2014 14:03:21SIDRA INTERSECTION 6.0.22.4722
Copyright © 2000-2014 Akcelik and Associates Pty Ltdwww.sidrasolutions.com
Project: O:\ha_civ\231695 hamilton expressway\Secondary Investigation and SARA\Scheme Design\Transportation\AEE traffic\Ruakura Alteration- 2014\AEE report July14\assessment\Silverdale X Rd Signal_mpm.sip68000051, OPUS INTERNATIONAL CONSULTANTS, NETWORK / Enterprise

SITE LAYOUT
Site: 2041 AM SCHEME
Realigned Ruakura Road/Silverdale RoadNote: 1car/hr applied to all movements with 0 flow in WRTM model2041 - WRTM AM - Net 36 SCHEMESignals - Fixed Time
Created: Thursday, 28 August 2014 09:26:50SIDRA INTERSECTION 6.0.22.4722
Copyright © 2000-2014 Akcelik and Associates Pty Ltdwww.sidrasolutions.com
Project: O:\ha_civ\231695 hamilton expressway\Secondary Investigation and SARA\Scheme Design\Transportation\AEE traffic\Ruakura Alteration- 2014\AEE report July14\assessment\Silverdale X Rd Signal_mpm.sip68000051, OPUS INTERNATIONAL CONSULTANTS, NETWORK / Enterprise

MOVEMENT SUMMARY
Site: 2041 AM SCHEME
Realigned Ruakura Road/Silverdale RoadNote: 1car/hr applied to all movements with 0 flow in WRTM model2041 - WRTM AM - Net 36 SCHEMESignals - Fixed Time Cycle Time = 60 seconds (Practical Cycle Time)
Movement Performance - Vehicles
Demand Flows 95% Back of QueueMov
ID
OD
Mov
Deg.
Satn
Average
Delay
Level of
Service
Prop.
Queued
Effective
Stop Rate
Average
Speed Total HV Vehicles Distanceveh/h % v/c sec veh m per veh km/h
South: Ruakura Road South
1 L2 185 0.0 0.855 41.2 LOS D 6.4 44.8 1.00 1.01 35.2
2 T1 373 7.1 0.857 35.8 LOS D 6.4 47.9 1.00 1.01 37.8
3 R2 1 0.0 0.005 30.4 LOS C 0.0 0.2 0.90 0.58 35.1
Approach 559 4.7 0.857 37.6 LOS D 6.4 47.9 1.00 1.01 36.9
East: Port Access
4 L2 1 0.0 0.011 31.7 LOS C 0.1 0.4 0.92 0.58 35.5
5 T1 1 0.0 0.011 27.1 LOS C 0.1 0.4 0.92 0.58 35.7
6 R2 1 0.0 0.007 31.7 LOS C 0.0 0.2 0.92 0.58 34.8
Approach 3 0.0 0.011 30.2 LOS C 0.1 0.4 0.92 0.58 35.3
North: Ruakura Road North
7 L2 52 0.0 0.057 13.4 LOS B 0.8 5.6 0.56 0.66 41.9
8 T1 268 5.9 0.102 3.1 LOS A 1.3 9.2 0.34 0.28 57.1
9 R2 718 4.5 0.860 28.9 LOS C 23.1 168.2 0.93 0.98 40.0
Approach 1038 4.7 0.860 21.4 LOS C 23.1 168.2 0.76 0.78 43.5
West: Silverdale Road
10 L2 531 4.4 0.431 10.2 LOS B 7.0 50.7 0.48 0.73 50.1
11 T1 31 0.0 0.157 28.3 LOS C 0.9 6.1 0.95 0.68 36.1
12 R2 20 0.0 0.100 33.5 LOS C 0.6 3.9 0.94 0.69 38.3
Approach 581 4.0 0.431 11.9 LOS B 7.0 50.7 0.52 0.72 48.6
All Vehicles 2181 4.5 0.860 23.1 LOS C 23.1 168.2 0.76 0.82 42.7
Level of Service (LOS) Method: Delay (HCM 2000).
Vehicle movement LOS values are based on average delay per movement
Intersection and Approach LOS values are based on average delay for all vehicle movements.
SIDRA Standard Delay Model is used. Control Delay includes Geometric Delay.
Gap-Acceptance Capacity: SIDRA Standard (Akçelik M3D).
HV (%) values are calculated for All Movement Classes of All Heavy Vehicle Model Designation.
Processed: Monday, 25 August 2014 14:06:18SIDRA INTERSECTION 6.0.22.4722
Copyright © 2000-2014 Akcelik and Associates Pty Ltdwww.sidrasolutions.com
Project: O:\ha_civ\231695 hamilton expressway\Secondary Investigation and SARA\Scheme Design\Transportation\AEE traffic\Ruakura Alteration- 2014\AEE report July14\assessment\Silverdale X Rd Signal_mpm.sip68000051, OPUS INTERNATIONAL CONSULTANTS, NETWORK / Enterprise
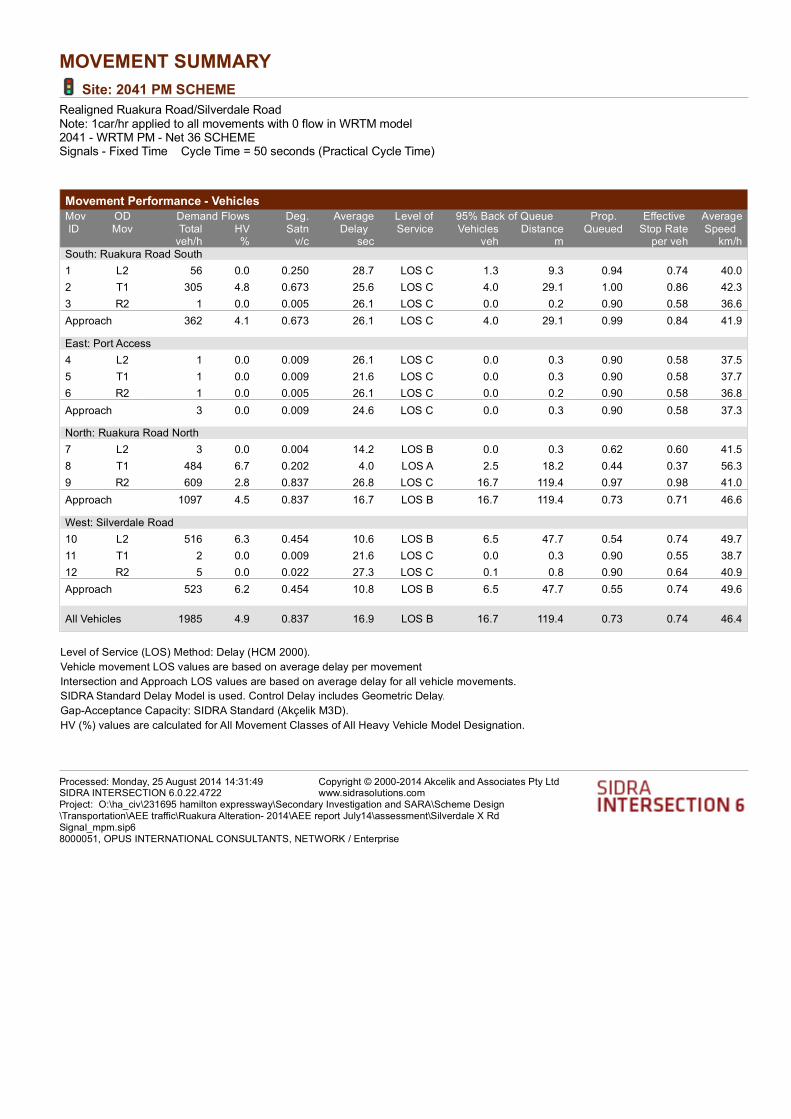
MOVEMENT SUMMARY
Site: 2041 PM SCHEME
Realigned Ruakura Road/Silverdale RoadNote: 1car/hr applied to all movements with 0 flow in WRTM model2041 - WRTM PM - Net 36 SCHEMESignals - Fixed Time Cycle Time = 50 seconds (Practical Cycle Time)
Movement Performance - Vehicles
Demand Flows 95% Back of QueueMov
ID
OD
Mov
Deg.
Satn
Average
Delay
Level of
Service
Prop.
Queued
Effective
Stop Rate
Average
Speed Total HV Vehicles Distanceveh/h % v/c sec veh m per veh km/h
South: Ruakura Road South
1 L2 56 0.0 0.250 28.7 LOS C 1.3 9.3 0.94 0.74 40.0
2 T1 305 4.8 0.673 25.6 LOS C 4.0 29.1 1.00 0.86 42.3
3 R2 1 0.0 0.005 26.1 LOS C 0.0 0.2 0.90 0.58 36.6
Approach 362 4.1 0.673 26.1 LOS C 4.0 29.1 0.99 0.84 41.9
East: Port Access
4 L2 1 0.0 0.009 26.1 LOS C 0.0 0.3 0.90 0.58 37.5
5 T1 1 0.0 0.009 21.6 LOS C 0.0 0.3 0.90 0.58 37.7
6 R2 1 0.0 0.005 26.1 LOS C 0.0 0.2 0.90 0.58 36.8
Approach 3 0.0 0.009 24.6 LOS C 0.0 0.3 0.90 0.58 37.3
North: Ruakura Road North
7 L2 3 0.0 0.004 14.2 LOS B 0.0 0.3 0.62 0.60 41.5
8 T1 484 6.7 0.202 4.0 LOS A 2.5 18.2 0.44 0.37 56.3
9 R2 609 2.8 0.837 26.8 LOS C 16.7 119.4 0.97 0.98 41.0
Approach 1097 4.5 0.837 16.7 LOS B 16.7 119.4 0.73 0.71 46.6
West: Silverdale Road
10 L2 516 6.3 0.454 10.6 LOS B 6.5 47.7 0.54 0.74 49.7
11 T1 2 0.0 0.009 21.6 LOS C 0.0 0.3 0.90 0.55 38.7
12 R2 5 0.0 0.022 27.3 LOS C 0.1 0.8 0.90 0.64 40.9
Approach 523 6.2 0.454 10.8 LOS B 6.5 47.7 0.55 0.74 49.6
All Vehicles 1985 4.9 0.837 16.9 LOS B 16.7 119.4 0.73 0.74 46.4
Level of Service (LOS) Method: Delay (HCM 2000).
Vehicle movement LOS values are based on average delay per movement
Intersection and Approach LOS values are based on average delay for all vehicle movements.
SIDRA Standard Delay Model is used. Control Delay includes Geometric Delay.
Gap-Acceptance Capacity: SIDRA Standard (Akçelik M3D).
HV (%) values are calculated for All Movement Classes of All Heavy Vehicle Model Designation.
Processed: Monday, 25 August 2014 14:31:49SIDRA INTERSECTION 6.0.22.4722
Copyright © 2000-2014 Akcelik and Associates Pty Ltdwww.sidrasolutions.com
Project: O:\ha_civ\231695 hamilton expressway\Secondary Investigation and SARA\Scheme Design\Transportation\AEE traffic\Ruakura Alteration- 2014\AEE report July14\assessment\Silverdale X Rd Signal_mpm.sip68000051, OPUS INTERNATIONAL CONSULTANTS, NETWORK / Enterprise

(This page has been intentionally left blank)

SITE LAYOUT
Site: 2021 AM BASELINE T
Intersection west of Expressway providing access to portBASELINE: SH26 north facing rampsNet 35 BASELINESignals - Fixed Time
Created: Thursday, 28 August 2014 09:16:38SIDRA INTERSECTION 6.0.22.4722
Copyright © 2000-2014 Akcelik and Associates Pty Ltdwww.sidrasolutions.com
Project: O:\ha_civ\231695 hamilton expressway\Secondary Investigation and SARA\Scheme Design\Transportation\AEE traffic\Ruakura Alteration- 2014\AEE report July14\assessment\Ruakura Rd to PortSignals_mpm.sip68000051, OPUS INTERNATIONAL CONSULTANTS, NETWORK / Enterprise

MOVEMENT SUMMARY
Site: 2021 AM BASELINE T
Intersection west of Expressway providing access to portBASELINE: SH26 north facing rampsNet 35 BASELINESignals - Fixed Time Cycle Time = 36 seconds (Optimum Cycle Time - Minimum Delay)
Movement Performance - Vehicles
Demand Flows 95% Back of QueueMov
ID
OD
Mov
Deg.
Satn
Average
Delay
Level of
Service
Prop.
Queued
Effective
Stop Rate
Average
Speed Total HV Vehicles Distanceveh/h % v/c sec veh m per veh km/h
East: Relocated Ruakura Road
5 T1 1 0.0 0.001 4.8 LOS A 0.0 0.1 0.51 0.31 55.6
6 R2 1 0.0 0.003 19.4 LOS B 0.0 0.1 0.85 0.59 41.8
Approach 2 0.0 0.003 12.1 LOS B 0.0 0.1 0.68 0.45 47.8
North: Port Access
7 L2 1 0.0 0.001 9.3 LOS A 0.0 0.1 0.51 0.57 46.8
9 R2 23 86.4 0.121 20.6 LOS C 0.4 4.7 0.88 0.70 38.9
Approach 24 82.6 0.121 20.1 LOS C 0.4 4.7 0.86 0.69 39.2
West: Relocated Ruakura Road
10 L2 21 95.0 0.114 21.9 LOS C 0.3 4.4 0.88 0.70 40.3
11 T1 1 0.0 0.003 13.8 LOS B 0.0 0.1 0.85 0.50 48.9
Approach 22 90.5 0.114 21.5 LOS C 0.3 4.4 0.88 0.69 40.6
All Vehicles 48 82.6 0.121 20.4 LOS C 0.4 4.7 0.86 0.68 40.2
Level of Service (LOS) Method: Delay (HCM 2000).
Vehicle movement LOS values are based on average delay per movement
Intersection and Approach LOS values are based on average delay for all vehicle movements.
SIDRA Standard Delay Model is used. Control Delay includes Geometric Delay.
Gap-Acceptance Capacity: SIDRA Standard (Akçelik M3D).
HV (%) values are calculated for All Movement Classes of All Heavy Vehicle Model Designation.
Processed: Monday, 25 August 2014 13:19:04SIDRA INTERSECTION 6.0.22.4722
Copyright © 2000-2014 Akcelik and Associates Pty Ltdwww.sidrasolutions.com
Project: O:\ha_civ\231695 hamilton expressway\Secondary Investigation and SARA\Scheme Design\Transportation\AEE traffic\Ruakura Alteration- 2014\AEE report July14\assessment\Ruakura Rd to PortSignals_mpm.sip68000051, OPUS INTERNATIONAL CONSULTANTS, NETWORK / Enterprise

MOVEMENT SUMMARY
Site: 2021 PM BASELINE T
Intersection west of Expressway providing access to portBASELINE: SH26 north facing rampsNet 35 BASELINESignals - Fixed Time Cycle Time = 45 seconds (Optimum Cycle Time - Minimum Delay)
Movement Performance - Vehicles
Demand Flows 95% Back of QueueMov
ID
OD
Mov
Deg.
Satn
Average
Delay
Level of
Service
Prop.
Queued
Effective
Stop Rate
Average
Speed Total HV Vehicles Distanceveh/h % v/c sec veh m per veh km/h
East: Relocated Ruakura Road
5 T1 1 0.0 0.001 8.0 LOS A 0.0 0.1 0.59 0.35 53.1
6 R2 1 0.0 0.004 24.2 LOS C 0.0 0.1 0.88 0.59 39.6
Approach 2 0.0 0.004 16.1 LOS B 0.0 0.1 0.74 0.47 45.4
North: Port Access
7 L2 1 0.0 0.001 8.8 LOS A 0.0 0.1 0.43 0.56 47.1
9 R2 67 32.8 0.144 17.4 LOS B 1.1 10.0 0.75 0.72 41.5
Approach 68 32.3 0.144 17.3 LOS B 1.1 10.0 0.75 0.71 41.6
West: Relocated Ruakura Road
10 L2 23 95.5 0.135 26.1 LOS C 0.5 6.1 0.89 0.71 38.5
11 T1 1 0.0 0.003 17.6 LOS B 0.0 0.1 0.86 0.51 46.5
Approach 24 91.3 0.135 25.7 LOS C 0.5 6.1 0.89 0.70 38.8
All Vehicles 95 46.7 0.144 19.4 LOS B 1.1 10.0 0.78 0.70 40.9
Level of Service (LOS) Method: Delay (HCM 2000).
Vehicle movement LOS values are based on average delay per movement
Intersection and Approach LOS values are based on average delay for all vehicle movements.
SIDRA Standard Delay Model is used. Control Delay includes Geometric Delay.
Gap-Acceptance Capacity: SIDRA Standard (Akçelik M3D).
HV (%) values are calculated for All Movement Classes of All Heavy Vehicle Model Designation.
Processed: Monday, 25 August 2014 13:19:06SIDRA INTERSECTION 6.0.22.4722
Copyright © 2000-2014 Akcelik and Associates Pty Ltdwww.sidrasolutions.com
Project: O:\ha_civ\231695 hamilton expressway\Secondary Investigation and SARA\Scheme Design\Transportation\AEE traffic\Ruakura Alteration- 2014\AEE report July14\assessment\Ruakura Rd to PortSignals_mpm.sip68000051, OPUS INTERNATIONAL CONSULTANTS, NETWORK / Enterprise

SITE LAYOUT
Site: 2041 AM BASELINE X
Intersection west of Expressway providing access to portBASELINE: SH26 north facing rampsNet 35 BASELINESignals - Fixed Time
Created: Thursday, 28 August 2014 09:16:44SIDRA INTERSECTION 6.0.22.4722
Copyright © 2000-2014 Akcelik and Associates Pty Ltdwww.sidrasolutions.com
Project: O:\ha_civ\231695 hamilton expressway\Secondary Investigation and SARA\Scheme Design\Transportation\AEE traffic\Ruakura Alteration- 2014\AEE report July14\assessment\Ruakura Rd to PortSignals_mpm.sip68000051, OPUS INTERNATIONAL CONSULTANTS, NETWORK / Enterprise

MOVEMENT SUMMARY
Site: 2041 AM BASELINE X
Intersection west of Expressway providing access to portBASELINE: SH26 north facing rampsNet 35 BASELINESignals - Fixed Time Cycle Time = 55 seconds (Optimum Cycle Time - Minimum Delay)
Movement Performance - Vehicles
Demand Flows 95% Back of QueueMov
ID
OD
Mov
Deg.
Satn
Average
Delay
Level of
Service
Prop.
Queued
Effective
Stop Rate
Average
Speed Total HV Vehicles Distanceveh/h % v/c sec veh m per veh km/h
South: Logistics
1 L2 5 0.0 0.009 18.0 LOS B 0.1 0.7 0.69 0.62 42.1
2 T1 28 81.5 0.204 26.5 LOS C 0.8 9.1 0.94 0.69 36.8
3 R2 12 9.1 0.061 29.7 LOS C 0.3 2.2 0.92 0.67 37.2
Approach 45 53.5 0.204 26.3 LOS C 0.8 9.1 0.91 0.67 37.4
East: Relocated Ruakura Road
4 L2 34 3.1 0.041 14.5 LOS B 0.5 3.6 0.58 0.67 44.5
5 T1 212 6.0 0.238 19.0 LOS B 2.4 17.5 0.85 0.67 45.8
6 R2 13 41.7 0.081 31.6 LOS C 0.3 3.1 0.93 0.68 36.8
Approach 258 7.3 0.238 19.0 LOS B 2.4 17.5 0.82 0.67 45.1
North: From Port
7 L2 6 16.7 0.012 18.2 LOS B 0.1 0.9 0.69 0.63 41.6
8 T1 27 96.2 0.209 26.7 LOS C 0.7 9.5 0.94 0.69 36.7
9 R2 29 89.3 0.238 32.2 LOS C 0.8 10.0 0.95 0.72 35.0
Approach 63 85.0 0.238 28.4 LOS C 0.8 10.0 0.92 0.70 36.3
West: Relocated Ruakura Road
10 L2 33 83.9 0.062 15.8 LOS B 0.5 6.0 0.58 0.68 43.3
11 T1 101 11.5 0.118 18.3 LOS B 1.1 8.4 0.82 0.62 46.2
12 R2 1 0.0 0.005 29.8 LOS C 0.0 0.2 0.91 0.59 37.7
Approach 135 28.9 0.118 17.8 LOS B 1.1 8.4 0.76 0.63 45.3
All Vehicles 501 27.1 0.238 20.5 LOS C 2.4 17.5 0.82 0.66 43.0
Level of Service (LOS) Method: Delay (HCM 2000).
Vehicle movement LOS values are based on average delay per movement
Intersection and Approach LOS values are based on average delay for all vehicle movements.
SIDRA Standard Delay Model is used. Control Delay includes Geometric Delay.
Gap-Acceptance Capacity: SIDRA Standard (Akçelik M3D).
HV (%) values are calculated for All Movement Classes of All Heavy Vehicle Model Designation.
Processed: Monday, 25 August 2014 13:19:09SIDRA INTERSECTION 6.0.22.4722
Copyright © 2000-2014 Akcelik and Associates Pty Ltdwww.sidrasolutions.com
Project: O:\ha_civ\231695 hamilton expressway\Secondary Investigation and SARA\Scheme Design\Transportation\AEE traffic\Ruakura Alteration- 2014\AEE report July14\assessment\Ruakura Rd to PortSignals_mpm.sip68000051, OPUS INTERNATIONAL CONSULTANTS, NETWORK / Enterprise

MOVEMENT SUMMARY
Site: 2041 PM BASELINE X
Intersection west of Expressway providing access to portBASELINE: SH26 north facing rampsNet 35 BASELINESignals - Fixed Time Cycle Time = 48 seconds (Optimum Cycle Time - Minimum Delay)
Movement Performance - Vehicles
Demand Flows 95% Back of QueueMov
ID
OD
Mov
Deg.
Satn
Average
Delay
Level of
Service
Prop.
Queued
Effective
Stop Rate
Average
Speed Total HV Vehicles Distanceveh/h % v/c sec veh m per veh km/h
South: Logistics
1 L2 5 0.0 0.008 14.7 LOS B 0.1 0.5 0.64 0.61 43.8
2 T1 36 85.3 0.228 22.6 LOS C 0.8 10.1 0.93 0.69 38.3
3 R2 41 10.3 0.190 26.5 LOS C 0.9 7.1 0.93 0.72 38.4
Approach 82 42.3 0.228 24.0 LOS C 0.9 10.1 0.91 0.70 38.6
East: Relocated Ruakura Road
4 L2 20 5.3 0.030 15.9 LOS B 0.3 2.2 0.65 0.67 43.7
5 T1 123 7.7 0.265 22.1 LOS C 1.4 10.5 0.94 0.71 44.1
6 R2 6 16.7 0.030 26.7 LOS C 0.1 1.1 0.90 0.65 38.8
Approach 149 7.7 0.265 21.4 LOS C 1.4 10.5 0.90 0.70 43.8
North: From Port
7 L2 34 40.6 0.062 15.5 LOS B 0.5 4.9 0.67 0.67 42.4
8 T1 46 36.4 0.235 22.2 LOS C 1.1 9.8 0.94 0.69 38.4
9 R2 96 29.7 0.500 28.1 LOS C 2.3 20.4 0.97 0.78 37.4
Approach 176 33.5 0.500 24.2 LOS C 2.3 20.4 0.91 0.73 38.5
West: Relocated Ruakura Road
10 L2 36 85.3 0.083 17.3 LOS B 0.6 6.8 0.67 0.69 42.5
11 T1 238 4.0 0.501 22.9 LOS C 2.8 20.5 0.98 0.76 43.6
12 R2 2 0.0 0.009 26.1 LOS C 0.0 0.3 0.89 0.61 39.2
Approach 276 14.5 0.501 22.2 LOS C 2.8 20.5 0.94 0.75 43.4
All Vehicles 683 21.3 0.501 22.8 LOS C 2.8 20.5 0.92 0.73 41.5
Level of Service (LOS) Method: Delay (HCM 2000).
Vehicle movement LOS values are based on average delay per movement
Intersection and Approach LOS values are based on average delay for all vehicle movements.
SIDRA Standard Delay Model is used. Control Delay includes Geometric Delay.
Gap-Acceptance Capacity: SIDRA Standard (Akçelik M3D).
HV (%) values are calculated for All Movement Classes of All Heavy Vehicle Model Designation.
Processed: Monday, 25 August 2014 13:19:11SIDRA INTERSECTION 6.0.22.4722
Copyright © 2000-2014 Akcelik and Associates Pty Ltdwww.sidrasolutions.com
Project: O:\ha_civ\231695 hamilton expressway\Secondary Investigation and SARA\Scheme Design\Transportation\AEE traffic\Ruakura Alteration- 2014\AEE report July14\assessment\Ruakura Rd to PortSignals_mpm.sip68000051, OPUS INTERNATIONAL CONSULTANTS, NETWORK / Enterprise

SITE LAYOUT
Site: 2021 AM SCHEME T
Intersection west of Expressway providing access to portSCHEME: Ruakura Diamond interchangeNet 36 SCHEMESignals - Fixed Time
Created: Thursday, 28 August 2014 09:16:50SIDRA INTERSECTION 6.0.22.4722
Copyright © 2000-2014 Akcelik and Associates Pty Ltdwww.sidrasolutions.com
Project: O:\ha_civ\231695 hamilton expressway\Secondary Investigation and SARA\Scheme Design\Transportation\AEE traffic\Ruakura Alteration- 2014\AEE report July14\assessment\Ruakura Rd to PortSignals_mpm.sip68000051, OPUS INTERNATIONAL CONSULTANTS, NETWORK / Enterprise

MOVEMENT SUMMARY
Site: 2021 AM SCHEME T
Intersection west of Expressway providing access to portSCHEME: Ruakura Diamond interchangeNet 36 SCHEMESignals - Fixed Time Cycle Time = 40 seconds (Practical Cycle Time)
Movement Performance - Vehicles
Demand Flows 95% Back of QueueMov
ID
OD
Mov
Deg.
Satn
Average
Delay
Level of
Service
Prop.
Queued
Effective
Stop Rate
Average
Speed Total HV Vehicles Distanceveh/h % v/c sec veh m per veh km/h
East: Relocated Ruakura Road
5 T1 387 1.4 0.364 5.6 LOS A 4.3 30.8 0.60 0.51 55.0
6 R2 48 39.1 0.222 23.6 LOS C 0.9 8.5 0.91 0.73 39.6
Approach 436 5.6 0.364 7.6 LOS A 4.3 30.8 0.63 0.54 52.7
North: Port Access
7 L2 20 94.7 0.040 12.3 LOS B 0.2 2.9 0.58 0.64 42.8
9 R2 4 50.0 0.021 21.7 LOS C 0.1 0.7 0.87 0.63 39.2
Approach 24 87.0 0.040 13.9 LOS B 0.2 2.9 0.63 0.64 42.1
West: Relocated Ruakura Road
10 L2 3 66.7 0.010 18.9 LOS B 0.0 0.5 0.77 0.63 41.8
11 T1 146 3.6 0.307 13.8 LOS B 2.4 17.6 0.85 0.68 48.9
Approach 149 4.9 0.307 13.9 LOS B 2.4 17.6 0.85 0.68 48.7
All Vehicles 609 8.6 0.364 9.4 LOS A 4.3 30.8 0.69 0.58 51.2
Level of Service (LOS) Method: Delay (HCM 2000).
Vehicle movement LOS values are based on average delay per movement
Intersection and Approach LOS values are based on average delay for all vehicle movements.
SIDRA Standard Delay Model is used. Control Delay includes Geometric Delay.
Gap-Acceptance Capacity: SIDRA Standard (Akçelik M3D).
HV (%) values are calculated for All Movement Classes of All Heavy Vehicle Model Designation.
Processed: Monday, 25 August 2014 13:19:13SIDRA INTERSECTION 6.0.22.4722
Copyright © 2000-2014 Akcelik and Associates Pty Ltdwww.sidrasolutions.com
Project: O:\ha_civ\231695 hamilton expressway\Secondary Investigation and SARA\Scheme Design\Transportation\AEE traffic\Ruakura Alteration- 2014\AEE report July14\assessment\Ruakura Rd to PortSignals_mpm.sip68000051, OPUS INTERNATIONAL CONSULTANTS, NETWORK / Enterprise

MOVEMENT SUMMARY
Site: 2021 PM SCHEME T
Intersection west of Expressway providing access to portSCHEME: Ruakura Diamond interchangeNet 36 SCHEMESignals - Fixed Time Cycle Time = 40 seconds (Practical Cycle Time)
Movement Performance - Vehicles
Demand Flows 95% Back of QueueMov
ID
OD
Mov
Deg.
Satn
Average
Delay
Level of
Service
Prop.
Queued
Effective
Stop Rate
Average
Speed Total HV Vehicles Distanceveh/h % v/c sec veh m per veh km/h
East: Relocated Ruakura Road
5 T1 215 2.9 0.204 5.0 LOS A 2.2 15.5 0.54 0.44 55.4
6 R2 22 90.5 0.131 24.2 LOS C 0.4 5.2 0.90 0.71 39.1
Approach 237 11.1 0.204 6.8 LOS A 2.2 15.5 0.57 0.47 53.4
North: Port Access
7 L2 53 38.0 0.080 11.8 LOS B 0.6 5.6 0.60 0.67 44.4
9 R2 32 6.7 0.119 21.6 LOS C 0.6 4.2 0.90 0.70 40.1
Approach 84 26.3 0.119 15.5 LOS B 0.6 5.6 0.71 0.68 42.7
West: Relocated Ruakura Road
10 L2 3 66.7 0.010 18.9 LOS B 0.0 0.5 0.77 0.63 41.8
11 T1 406 1.6 0.842 21.6 LOS C 9.5 67.3 1.00 1.05 44.3
Approach 409 2.1 0.842 21.6 LOS C 9.5 67.3 1.00 1.05 44.3
All Vehicles 731 7.8 0.842 16.1 LOS B 9.5 67.3 0.83 0.82 46.6
Level of Service (LOS) Method: Delay (HCM 2000).
Vehicle movement LOS values are based on average delay per movement
Intersection and Approach LOS values are based on average delay for all vehicle movements.
SIDRA Standard Delay Model is used. Control Delay includes Geometric Delay.
Gap-Acceptance Capacity: SIDRA Standard (Akçelik M3D).
HV (%) values are calculated for All Movement Classes of All Heavy Vehicle Model Designation.
Processed: Monday, 25 August 2014 13:19:14SIDRA INTERSECTION 6.0.22.4722
Copyright © 2000-2014 Akcelik and Associates Pty Ltdwww.sidrasolutions.com
Project: O:\ha_civ\231695 hamilton expressway\Secondary Investigation and SARA\Scheme Design\Transportation\AEE traffic\Ruakura Alteration- 2014\AEE report July14\assessment\Ruakura Rd to PortSignals_mpm.sip68000051, OPUS INTERNATIONAL CONSULTANTS, NETWORK / Enterprise

SITE LAYOUT
Site: 2041 AM SCHEME X
Intersection west of Expressway providing access to portSCHEME: Ruakura Diamond interchangeNet 36 SCHEMESignals - Fixed Time
Created: Thursday, 28 August 2014 09:16:55SIDRA INTERSECTION 6.0.22.4722
Copyright © 2000-2014 Akcelik and Associates Pty Ltdwww.sidrasolutions.com
Project: O:\ha_civ\231695 hamilton expressway\Secondary Investigation and SARA\Scheme Design\Transportation\AEE traffic\Ruakura Alteration- 2014\AEE report July14\assessment\Ruakura Rd to PortSignals_mpm.sip68000051, OPUS INTERNATIONAL CONSULTANTS, NETWORK / Enterprise

MOVEMENT SUMMARY
Site: 2041 AM SCHEME X
Intersection west of Expressway providing access to portSCHEME: Ruakura Diamond interchangeNet 36 SCHEMESignals - Fixed Time Cycle Time = 60 seconds (Practical Cycle Time)
Movement Performance - Vehicles
Demand Flows 95% Back of QueueMov
ID
OD
Mov
Deg.
Satn
Average
Delay
Level of
Service
Prop.
Queued
Effective
Stop Rate
Average
Speed Total HV Vehicles Distanceveh/h % v/c sec veh m per veh km/h
South: Logistics
1 L2 5 0.0 0.009 20.4 LOS C 0.1 0.8 0.72 0.62 41.0
2 T1 6 16.7 0.036 27.6 LOS C 0.2 1.4 0.93 0.61 36.4
3 R2 176 39.5 0.607 30.3 LOS C 5.1 47.4 0.96 0.83 36.4
Approach 187 37.6 0.607 30.0 LOS C 5.1 47.4 0.95 0.82 36.6
East: Relocated Ruakura Road
4 L2 214 32.5 0.283 15.5 LOS B 3.7 33.1 0.62 0.74 43.8
5 T1 498 4.0 0.655 25.6 LOS C 7.2 52.0 0.97 0.84 42.3
6 R2 83 63.3 0.650 38.6 LOS D 2.7 29.1 1.00 0.85 34.3
Approach 795 17.9 0.655 24.2 LOS C 7.2 52.0 0.88 0.81 41.6
North: From Port
7 L2 52 95.9 0.156 22.8 LOS C 1.2 14.8 0.77 0.71 38.1
8 T1 2 50.0 0.014 27.6 LOS C 0.1 0.6 0.92 0.57 36.4
9 R2 5 60.0 0.020 26.5 LOS C 0.1 1.4 0.82 0.64 37.6
Approach 59 91.1 0.156 23.3 LOS C 1.2 14.8 0.78 0.70 38.0
West: Relocated Ruakura Road
10 L2 8 37.5 0.011 14.0 LOS B 0.1 1.1 0.52 0.63 44.5
11 T1 123 8.5 0.167 22.1 LOS C 1.5 11.6 0.86 0.66 44.0
12 R2 1 0.0 0.006 32.5 LOS C 0.0 0.2 0.92 0.59 36.7
Approach 133 10.3 0.167 21.7 LOS C 1.5 11.6 0.84 0.65 44.0
All Vehicles 1174 23.9 0.655 24.8 LOS C 7.2 52.0 0.88 0.79 40.8
Level of Service (LOS) Method: Delay (HCM 2000).
Vehicle movement LOS values are based on average delay per movement
Intersection and Approach LOS values are based on average delay for all vehicle movements.
SIDRA Standard Delay Model is used. Control Delay includes Geometric Delay.
Gap-Acceptance Capacity: SIDRA Standard (Akçelik M3D).
HV (%) values are calculated for All Movement Classes of All Heavy Vehicle Model Designation.
Processed: Monday, 25 August 2014 13:19:15SIDRA INTERSECTION 6.0.22.4722
Copyright © 2000-2014 Akcelik and Associates Pty Ltdwww.sidrasolutions.com
Project: O:\ha_civ\231695 hamilton expressway\Secondary Investigation and SARA\Scheme Design\Transportation\AEE traffic\Ruakura Alteration- 2014\AEE report July14\assessment\Ruakura Rd to PortSignals_mpm.sip68000051, OPUS INTERNATIONAL CONSULTANTS, NETWORK / Enterprise

MOVEMENT SUMMARY
Site: 2041 PM SCHEME X
Intersection west of Expressway providing access to portSCHEME: Ruakura Diamond interchangeNet 36 SCHEMESignals - Fixed Time Cycle Time = 70 seconds (Practical Cycle Time)
Movement Performance - Vehicles
Demand Flows 95% Back of QueueMov
ID
OD
Mov
Deg.
Satn
Average
Delay
Level of
Service
Prop.
Queued
Effective
Stop Rate
Average
Speed Total HV Vehicles Distanceveh/h % v/c sec veh m per veh km/h
South: Logistics
1 L2 5 0.0 0.011 25.3 LOS C 0.1 0.9 0.77 0.63 38.8
2 T1 6 16.7 0.042 33.3 LOS C 0.2 1.7 0.94 0.62 34.4
3 R2 452 19.1 0.774 29.9 LOS C 15.2 124.1 0.95 0.92 36.9
Approach 463 18.9 0.774 29.9 LOS C 15.2 124.1 0.95 0.91 36.9
East: Relocated Ruakura Road
4 L2 175 15.1 0.182 13.4 LOS B 2.8 22.5 0.51 0.71 45.0
5 T1 180 5.3 0.371 31.7 LOS C 3.0 21.7 0.96 0.74 39.5
6 R2 61 96.6 0.648 45.5 LOS D 2.3 29.9 1.00 0.85 32.1
Approach 416 22.8 0.648 26.0 LOS C 3.0 29.9 0.77 0.74 40.2
North: From Port
7 L2 139 40.9 0.376 28.8 LOS C 4.1 38.3 0.87 0.77 36.7
8 T1 20 5.3 0.124 33.8 LOS C 0.7 4.9 0.95 0.67 34.3
9 R2 45 4.7 0.071 20.6 LOS C 1.0 7.4 0.69 0.68 41.0
Approach 204 29.4 0.376 27.5 LOS C 4.1 38.3 0.84 0.74 37.3
West: Relocated Ruakura Road
10 L2 7 28.6 0.008 12.7 LOS B 0.1 0.9 0.44 0.62 45.3
11 T1 365 7.5 0.764 36.2 LOS D 6.7 50.3 1.00 0.91 37.7
12 R2 2 0.0 0.013 38.2 LOS D 0.1 0.5 0.93 0.61 34.7
Approach 375 7.9 0.764 35.7 LOS D 6.7 50.3 0.99 0.91 37.8
All Vehicles 1458 18.6 0.774 30.0 LOS C 15.2 124.1 0.89 0.84 38.1
Level of Service (LOS) Method: Delay (HCM 2000).
Vehicle movement LOS values are based on average delay per movement
Intersection and Approach LOS values are based on average delay for all vehicle movements.
SIDRA Standard Delay Model is used. Control Delay includes Geometric Delay.
Gap-Acceptance Capacity: SIDRA Standard (Akçelik M3D).
HV (%) values are calculated for All Movement Classes of All Heavy Vehicle Model Designation.
Processed: Monday, 25 August 2014 13:19:16SIDRA INTERSECTION 6.0.22.4722
Copyright © 2000-2014 Akcelik and Associates Pty Ltdwww.sidrasolutions.com
Project: O:\ha_civ\231695 hamilton expressway\Secondary Investigation and SARA\Scheme Design\Transportation\AEE traffic\Ruakura Alteration- 2014\AEE report July14\assessment\Ruakura Rd to PortSignals_mpm.sip68000051, OPUS INTERNATIONAL CONSULTANTS, NETWORK / Enterprise

(This page has been intentionally left blank)

SITE LAYOUT
Site: 2021AM SCHEME
Ruakura Interchange On/Off Ramps - Western RoundaboutOn and Off Ramp Predicted Intersection Delays at Ruakura Interchange2021- WRTM AM - Net 36 SCHEMERoundabout
Created: Thursday, 28 August 2014 09:14:07SIDRA INTERSECTION 6.0.22.4722
Copyright © 2000-2014 Akcelik and Associates Pty Ltdwww.sidrasolutions.com
Project: O:\ha_civ\231695 hamilton expressway\Secondary Investigation and SARA\Scheme Design\Transportation\AEE traffic\Ruakura Alteration- 2014\AEE report July14\assessment\Ruakura IC West RAB_mpm.sip68000051, OPUS INTERNATIONAL CONSULTANTS, NETWORK / Enterprise

MOVEMENT SUMMARY
Site: 2021AM SCHEME
Ruakura Interchange On/Off Ramps - Western RoundaboutOn and Off Ramp Predicted Intersection Delays at Ruakura Interchange2021- WRTM AM - Net 36 SCHEMERoundabout
Movement Performance - Vehicles
Demand Flows 95% Back of QueueMov
ID
OD
Mov
Deg.
Satn
Average
Delay
Level of
Service
Prop.
Queued
Effective
Stop Rate
Average
Speed Total HV Vehicles Distanceveh/h % v/c sec veh m per veh km/h
South: Off-Ramp (south)
1 L2 79 12.0 0.091 7.7 LOS A 0.5 3.6 0.54 0.65 59.2
2 T1 1 0.0 0.091 8.0 LOS A 0.5 3.6 0.54 0.65 67.9
3 R2 11 10.0 0.091 14.6 LOS B 0.5 3.6 0.54 0.65 61.9
Approach 91 11.6 0.091 8.5 LOS A 0.5 3.6 0.54 0.65 59.6
East: Ruakura Road
5 T1 355 4.2 0.279 3.1 LOS A 0.0 0.0 0.00 0.43 57.9
6 R2 131 18.5 0.279 9.5 LOS A 0.0 0.0 0.00 0.43 58.3
Approach 485 8.0 0.279 4.8 LOS A 0.0 0.0 0.00 0.43 58.0
West: Ruakura Road
10 L2 75 14.1 0.132 4.0 LOS A 0.7 5.2 0.31 0.41 57.6
11 T1 91 14.0 0.132 3.9 LOS A 0.7 5.2 0.31 0.41 57.3
Approach 165 14.0 0.132 4.0 LOS A 0.7 5.2 0.31 0.41 57.5
All Vehicles 741 9.8 0.279 5.1 LOS A 0.7 5.2 0.14 0.45 58.0
Level of Service (LOS) Method: Delay (HCM 2000).
Roundabout LOS Method: Same as Signalised Intersections.
Vehicle movement LOS values are based on average delay per movement
Intersection and Approach LOS values are based on average delay for all vehicle movements.
Roundabout Capacity Model: SIDRA Standard.
SIDRA Standard Delay Model is used. Control Delay includes Geometric Delay.
Gap-Acceptance Capacity: SIDRA Standard (Akçelik M3D).
HV (%) values are calculated for All Movement Classes of All Heavy Vehicle Model Designation.
Processed: Tuesday, 12 August 2014 11:07:51SIDRA INTERSECTION 6.0.22.4722
Copyright © 2000-2014 Akcelik and Associates Pty Ltdwww.sidrasolutions.com
Project: O:\ha_civ\231695 hamilton expressway\Secondary Investigation and SARA\Scheme Design\Transportation\AEE traffic\Ruakura Alteration- 2014\AEE report July14\assessment\Ruakura IC West RAB_mpm.sip68000051, OPUS INTERNATIONAL CONSULTANTS, NETWORK / Enterprise

MOVEMENT SUMMARY
Site: 2021PM SCHEME
Ruakura Interchange On/Off Ramps - Western RoundaboutOn and Off Ramp Predicted Intersection Delays at Ruakura Interchange2021- WRTM PM - Net 36 SCHEMERoundabout
Movement Performance - Vehicles
Demand Flows 95% Back of QueueMov
ID
OD
Mov
Deg.
Satn
Average
Delay
Level of
Service
Prop.
Queued
Effective
Stop Rate
Average
Speed Total HV Vehicles Distanceveh/h % v/c sec veh m per veh km/h
South: Off-Ramp (South)
1 L2 13 75.0 0.022 8.2 LOS A 0.1 1.0 0.47 0.60 55.6
2 T1 1 0.0 0.022 7.6 LOS A 0.1 1.0 0.47 0.60 64.7
3 R2 6 0.0 0.022 14.0 LOS B 0.1 1.0 0.47 0.60 59.9
Approach 20 47.4 0.022 10.0 LOS A 0.1 1.0 0.47 0.60 57.3
East: Ruakura Road
5 T1 224 7.0 0.202 3.1 LOS A 0.0 0.0 0.00 0.46 57.4
6 R2 121 18.3 0.202 9.5 LOS A 0.0 0.0 0.00 0.46 57.9
Approach 345 11.0 0.202 5.3 LOS A 0.0 0.0 0.00 0.46 57.5
West: Ruakura Road
10 L2 137 8.5 0.333 4.0 LOS A 2.0 14.9 0.34 0.41 58.7
11 T1 322 4.6 0.333 3.8 LOS A 2.0 14.9 0.34 0.41 57.2
Approach 459 5.7 0.333 3.9 LOS A 2.0 14.9 0.34 0.41 57.6
All Vehicles 824 8.9 0.333 4.6 LOS A 2.0 14.9 0.20 0.43 57.6
Level of Service (LOS) Method: Delay (HCM 2000).
Roundabout LOS Method: Same as Signalised Intersections.
Vehicle movement LOS values are based on average delay per movement
Intersection and Approach LOS values are based on average delay for all vehicle movements.
Roundabout Capacity Model: SIDRA Standard.
SIDRA Standard Delay Model is used. Control Delay includes Geometric Delay.
Gap-Acceptance Capacity: SIDRA Standard (Akçelik M3D).
HV (%) values are calculated for All Movement Classes of All Heavy Vehicle Model Designation.
Processed: Tuesday, 12 August 2014 11:07:52SIDRA INTERSECTION 6.0.22.4722
Copyright © 2000-2014 Akcelik and Associates Pty Ltdwww.sidrasolutions.com
Project: O:\ha_civ\231695 hamilton expressway\Secondary Investigation and SARA\Scheme Design\Transportation\AEE traffic\Ruakura Alteration- 2014\AEE report July14\assessment\Ruakura IC West RAB_mpm.sip68000051, OPUS INTERNATIONAL CONSULTANTS, NETWORK / Enterprise
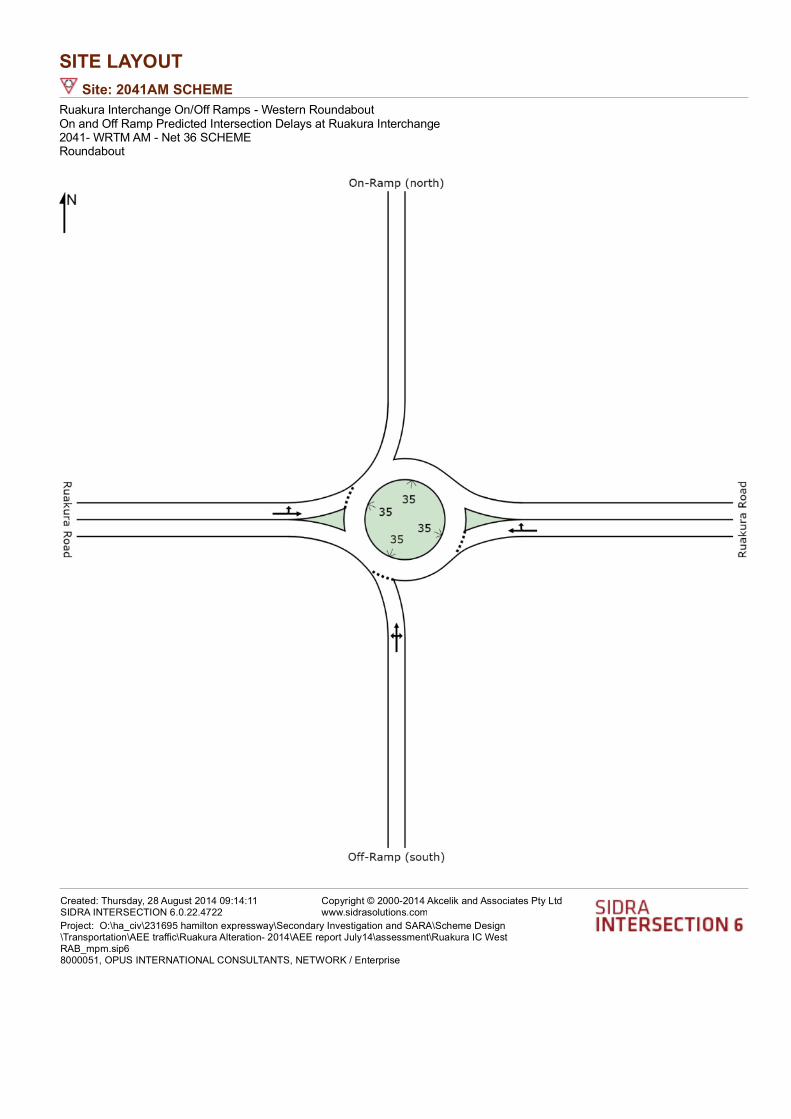
SITE LAYOUT
Site: 2041AM SCHEME
Ruakura Interchange On/Off Ramps - Western RoundaboutOn and Off Ramp Predicted Intersection Delays at Ruakura Interchange2041- WRTM AM - Net 36 SCHEMERoundabout
Created: Thursday, 28 August 2014 09:14:11SIDRA INTERSECTION 6.0.22.4722
Copyright © 2000-2014 Akcelik and Associates Pty Ltdwww.sidrasolutions.com
Project: O:\ha_civ\231695 hamilton expressway\Secondary Investigation and SARA\Scheme Design\Transportation\AEE traffic\Ruakura Alteration- 2014\AEE report July14\assessment\Ruakura IC West RAB_mpm.sip68000051, OPUS INTERNATIONAL CONSULTANTS, NETWORK / Enterprise
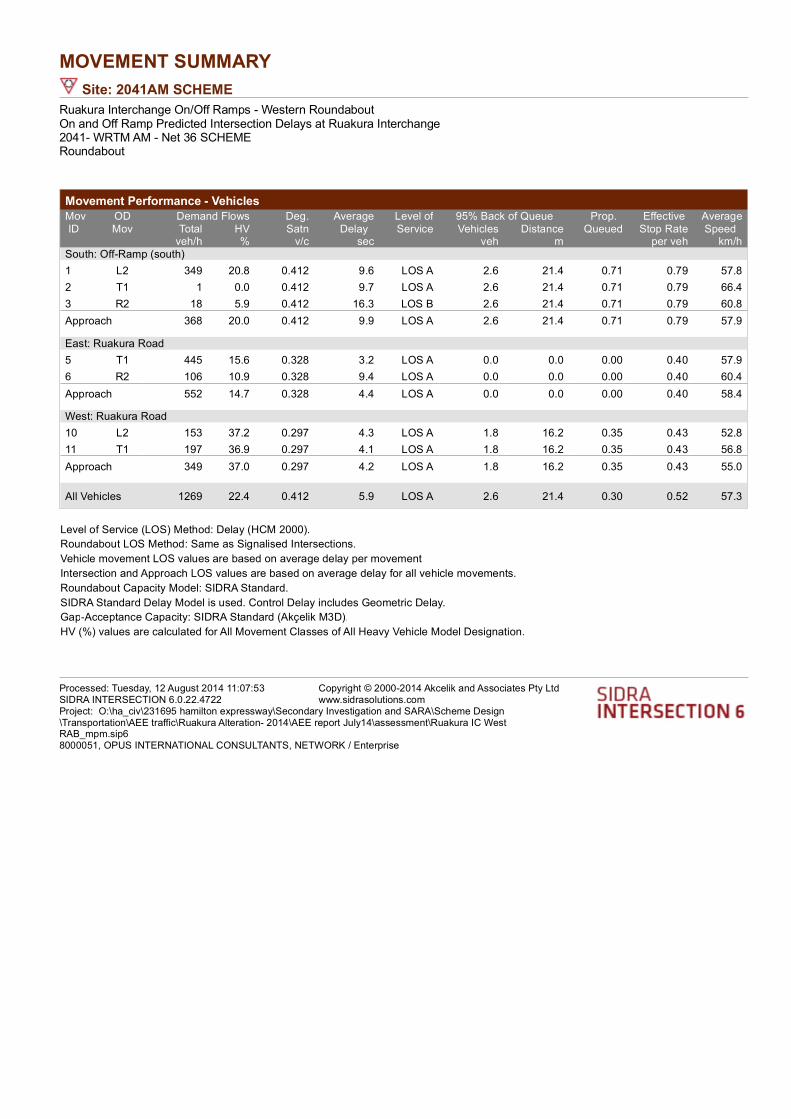
MOVEMENT SUMMARY
Site: 2041AM SCHEME
Ruakura Interchange On/Off Ramps - Western RoundaboutOn and Off Ramp Predicted Intersection Delays at Ruakura Interchange2041- WRTM AM - Net 36 SCHEMERoundabout
Movement Performance - Vehicles
Demand Flows 95% Back of QueueMov
ID
OD
Mov
Deg.
Satn
Average
Delay
Level of
Service
Prop.
Queued
Effective
Stop Rate
Average
Speed Total HV Vehicles Distanceveh/h % v/c sec veh m per veh km/h
South: Off-Ramp (south)
1 L2 349 20.8 0.412 9.6 LOS A 2.6 21.4 0.71 0.79 57.8
2 T1 1 0.0 0.412 9.7 LOS A 2.6 21.4 0.71 0.79 66.4
3 R2 18 5.9 0.412 16.3 LOS B 2.6 21.4 0.71 0.79 60.8
Approach 368 20.0 0.412 9.9 LOS A 2.6 21.4 0.71 0.79 57.9
East: Ruakura Road
5 T1 445 15.6 0.328 3.2 LOS A 0.0 0.0 0.00 0.40 57.9
6 R2 106 10.9 0.328 9.4 LOS A 0.0 0.0 0.00 0.40 60.4
Approach 552 14.7 0.328 4.4 LOS A 0.0 0.0 0.00 0.40 58.4
West: Ruakura Road
10 L2 153 37.2 0.297 4.3 LOS A 1.8 16.2 0.35 0.43 52.8
11 T1 197 36.9 0.297 4.1 LOS A 1.8 16.2 0.35 0.43 56.8
Approach 349 37.0 0.297 4.2 LOS A 1.8 16.2 0.35 0.43 55.0
All Vehicles 1269 22.4 0.412 5.9 LOS A 2.6 21.4 0.30 0.52 57.3
Level of Service (LOS) Method: Delay (HCM 2000).
Roundabout LOS Method: Same as Signalised Intersections.
Vehicle movement LOS values are based on average delay per movement
Intersection and Approach LOS values are based on average delay for all vehicle movements.
Roundabout Capacity Model: SIDRA Standard.
SIDRA Standard Delay Model is used. Control Delay includes Geometric Delay.
Gap-Acceptance Capacity: SIDRA Standard (Akçelik M3D).
HV (%) values are calculated for All Movement Classes of All Heavy Vehicle Model Designation.
Processed: Tuesday, 12 August 2014 11:07:53SIDRA INTERSECTION 6.0.22.4722
Copyright © 2000-2014 Akcelik and Associates Pty Ltdwww.sidrasolutions.com
Project: O:\ha_civ\231695 hamilton expressway\Secondary Investigation and SARA\Scheme Design\Transportation\AEE traffic\Ruakura Alteration- 2014\AEE report July14\assessment\Ruakura IC West RAB_mpm.sip68000051, OPUS INTERNATIONAL CONSULTANTS, NETWORK / Enterprise

MOVEMENT SUMMARY
Site: 2041PM SCHEME
Ruakura Interchange On/Off Ramps - Western RoundaboutOn and Off Ramp Predicted Intersection Delays at Ruakura Interchange2041- WRTM PM - Net 36 SCHEMERoundabout
Movement Performance - Vehicles
Demand Flows 95% Back of QueueMov
ID
OD
Mov
Deg.
Satn
Average
Delay
Level of
Service
Prop.
Queued
Effective
Stop Rate
Average
Speed Total HV Vehicles Distanceveh/h % v/c sec veh m per veh km/h
South: Off-Ramp (south)
1 L2 134 58.3 0.174 8.8 LOS A 0.9 9.1 0.55 0.68 57.7
2 T1 1 0.0 0.174 8.5 LOS A 0.9 9.1 0.55 0.68 67.4
3 R2 8 12.5 0.174 15.1 LOS B 0.9 9.1 0.55 0.68 61.4
Approach 143 55.1 0.174 9.2 LOS A 0.9 9.1 0.55 0.68 57.9
East: Ruakura Road
5 T1 282 27.2 0.234 3.2 LOS A 0.0 0.0 0.00 0.42 57.2
6 R2 97 10.9 0.234 9.4 LOS A 0.0 0.0 0.00 0.42 59.9
Approach 379 23.1 0.234 4.8 LOS A 0.0 0.0 0.00 0.42 57.9
West: Ruakura Road
10 L2 280 24.1 0.693 4.6 LOS A 7.3 58.7 0.52 0.45 54.5
11 T1 675 15.1 0.693 4.3 LOS A 7.3 58.7 0.52 0.45 56.1
Approach 955 17.8 0.693 4.4 LOS A 7.3 58.7 0.52 0.45 55.6
All Vehicles 1477 22.7 0.693 5.0 LOS A 7.3 58.7 0.39 0.46 56.4
Level of Service (LOS) Method: Delay (HCM 2000).
Roundabout LOS Method: Same as Signalised Intersections.
Vehicle movement LOS values are based on average delay per movement
Intersection and Approach LOS values are based on average delay for all vehicle movements.
Roundabout Capacity Model: SIDRA Standard.
SIDRA Standard Delay Model is used. Control Delay includes Geometric Delay.
Gap-Acceptance Capacity: SIDRA Standard (Akçelik M3D).
HV (%) values are calculated for All Movement Classes of All Heavy Vehicle Model Designation.
Processed: Tuesday, 12 August 2014 11:07:54SIDRA INTERSECTION 6.0.22.4722
Copyright © 2000-2014 Akcelik and Associates Pty Ltdwww.sidrasolutions.com
Project: O:\ha_civ\231695 hamilton expressway\Secondary Investigation and SARA\Scheme Design\Transportation\AEE traffic\Ruakura Alteration- 2014\AEE report July14\assessment\Ruakura IC West RAB_mpm.sip68000051, OPUS INTERNATIONAL CONSULTANTS, NETWORK / Enterprise

(This page has been intentionally left blank)

SITE LAYOUT
Site: 2021AM SCHEME
Ruakura Interchange On/Off Ramps - Eastern RoundaboutOn and off ramp Predicted Intersection Delays at Ruakura Interchange2021 - WRTM AM - Net 36 SCHEMERoundabout
Created: Thursday, 28 August 2014 09:11:03SIDRA INTERSECTION 6.0.22.4722
Copyright © 2000-2014 Akcelik and Associates Pty Ltdwww.sidrasolutions.com
Project: O:\ha_civ\231695 hamilton expressway\Secondary Investigation and SARA\Scheme Design\Transportation\AEE traffic\Ruakura Alteration- 2014\AEE report July14\assessment\Ruakura IC East RAB_mpm.sip68000051, OPUS INTERNATIONAL CONSULTANTS, NETWORK / Enterprise

MOVEMENT SUMMARY
Site: 2021AM SCHEME
Ruakura Interchange On/Off Ramps - Eastern RoundaboutOn and off ramp Predicted Intersection Delays at Ruakura Interchange2021 - WRTM AM - Net 36 SCHEMERoundabout
Movement Performance - Vehicles
Demand Flows 95% Back of QueueMov
ID
OD
Mov
Deg.
Satn
Average
Delay
Level of
Service
Prop.
Queued
Effective
Stop Rate
Average
Speed Total HV Vehicles Distanceveh/h % v/c sec veh m per veh km/h
East: Ruakura Road
4 L2 12 9.1 0.265 6.2 LOS A 1.6 12.0 0.39 0.51 63.8
5 T1 326 8.7 0.265 6.6 LOS A 1.6 12.0 0.39 0.51 62.2
Approach 338 8.7 0.265 6.5 LOS A 1.6 12.0 0.39 0.51 62.2
North: Off-Ramp (north)
7 L2 126 20.8 0.212 5.9 LOS A 1.1 8.8 0.27 0.60 58.8
8 T1 1 0.0 0.212 6.1 LOS A 1.1 8.8 0.27 0.60 66.0
9 R2 159 6.6 0.212 12.6 LOS B 1.1 8.8 0.27 0.60 60.6
Approach 286 12.9 0.212 9.7 LOS A 1.1 8.8 0.27 0.60 59.8
West: Ruakura Road
11 T1 92 5.7 0.060 3.1 LOS A 0.0 0.0 0.00 0.35 63.3
12 R2 9 88.9 0.060 10.2 LOS B 0.0 0.0 0.00 0.35 45.8
Approach 101 13.5 0.060 3.8 LOS A 0.0 0.0 0.00 0.35 61.1
All Vehicles 725 11.0 0.265 7.4 LOS A 1.6 12.0 0.29 0.52 61.1
Level of Service (LOS) Method: Delay (HCM 2000).
Roundabout LOS Method: Same as Signalised Intersections.
Vehicle movement LOS values are based on average delay per movement
Intersection and Approach LOS values are based on average delay for all vehicle movements.
Roundabout Capacity Model: SIDRA Standard.
SIDRA Standard Delay Model is used. Control Delay includes Geometric Delay.
Gap-Acceptance Capacity: SIDRA Standard (Akçelik M3D).
HV (%) values are calculated for All Movement Classes of All Heavy Vehicle Model Designation.
Processed: Tuesday, 12 August 2014 10:46:29SIDRA INTERSECTION 6.0.22.4722
Copyright © 2000-2014 Akcelik and Associates Pty Ltdwww.sidrasolutions.com
Project: O:\ha_civ\231695 hamilton expressway\Secondary Investigation and SARA\Scheme Design\Transportation\AEE traffic\Ruakura Alteration- 2014\AEE report July14\assessment\Ruakura IC East RAB_mpm.sip68000051, OPUS INTERNATIONAL CONSULTANTS, NETWORK / Enterprise

MOVEMENT SUMMARY
Site: 2021PM SCHEME
Ruakura Interchange On/Off Ramps - Eastern RoundaboutOn and off ramp Predicted Intersection Delays at Ruakura Interchange2021 - WRTM PM - Net 36 SCHEMERoundabout
Movement Performance - Vehicles
Demand Flows 95% Back of QueueMov
ID
OD
Mov
Deg.
Satn
Average
Delay
Level of
Service
Prop.
Queued
Effective
Stop Rate
Average
Speed Total HV Vehicles Distanceveh/h % v/c sec veh m per veh km/h
East: Ruakura Road
4 L2 16 6.7 0.214 6.4 LOS A 1.2 9.3 0.42 0.53 64.2
5 T1 240 10.5 0.214 6.8 LOS A 1.2 9.3 0.42 0.53 62.0
Approach 256 10.3 0.214 6.8 LOS A 1.2 9.3 0.42 0.53 62.1
North: Off-Ramp (north)
7 L2 145 15.2 0.228 7.1 LOS A 1.3 9.8 0.49 0.67 60.1
8 T1 1 0.0 0.228 7.3 LOS A 1.3 9.8 0.49 0.67 66.1
9 R2 106 10.9 0.228 13.9 LOS B 1.3 9.8 0.49 0.67 60.5
Approach 253 13.3 0.228 10.0 LOS A 1.3 9.8 0.49 0.67 60.3
West: Ruakura Road
11 T1 219 1.9 0.185 3.1 LOS A 0.0 0.0 0.00 0.46 62.3
12 R2 108 9.7 0.185 9.4 LOS A 0.0 0.0 0.00 0.46 60.1
Approach 327 4.5 0.185 5.2 LOS A 0.0 0.0 0.00 0.46 61.5
All Vehicles 836 8.9 0.228 7.1 LOS A 1.3 9.8 0.28 0.55 61.3
Level of Service (LOS) Method: Delay (HCM 2000).
Roundabout LOS Method: Same as Signalised Intersections.
Vehicle movement LOS values are based on average delay per movement
Intersection and Approach LOS values are based on average delay for all vehicle movements.
Roundabout Capacity Model: SIDRA Standard.
SIDRA Standard Delay Model is used. Control Delay includes Geometric Delay.
Gap-Acceptance Capacity: SIDRA Standard (Akçelik M3D).
HV (%) values are calculated for All Movement Classes of All Heavy Vehicle Model Designation.
Processed: Tuesday, 12 August 2014 10:46:30SIDRA INTERSECTION 6.0.22.4722
Copyright © 2000-2014 Akcelik and Associates Pty Ltdwww.sidrasolutions.com
Project: O:\ha_civ\231695 hamilton expressway\Secondary Investigation and SARA\Scheme Design\Transportation\AEE traffic\Ruakura Alteration- 2014\AEE report July14\assessment\Ruakura IC East RAB_mpm.sip68000051, OPUS INTERNATIONAL CONSULTANTS, NETWORK / Enterprise

SITE LAYOUT
Site: 2041AM SCHEME
Ruakura Interchange On/Off Ramps - Eastern RoundaboutOn and off ramp Predicted Intersection Delays at Ruakura Interchange2041 - WRTM AM - Net 36 SCHEMERoundabout
Created: Thursday, 28 August 2014 09:11:32SIDRA INTERSECTION 6.0.22.4722
Copyright © 2000-2014 Akcelik and Associates Pty Ltdwww.sidrasolutions.com
Project: O:\ha_civ\231695 hamilton expressway\Secondary Investigation and SARA\Scheme Design\Transportation\AEE traffic\Ruakura Alteration- 2014\AEE report July14\assessment\Ruakura IC East RAB_mpm.sip68000051, OPUS INTERNATIONAL CONSULTANTS, NETWORK / Enterprise

MOVEMENT SUMMARY
Site: 2041AM SCHEME
Ruakura Interchange On/Off Ramps - Eastern RoundaboutOn and off ramp Predicted Intersection Delays at Ruakura Interchange2041 - WRTM AM - Net 36 SCHEMERoundabout
Movement Performance - Vehicles
Demand Flows 95% Back of QueueMov
ID
OD
Mov
Deg.
Satn
Average
Delay
Level of
Service
Prop.
Queued
Effective
Stop Rate
Average
Speed Total HV Vehicles Distanceveh/h % v/c sec veh m per veh km/h
East: Ruakura Road
4 L2 13 8.3 0.316 7.3 LOS A 2.0 14.9 0.58 0.62 62.6
5 T1 329 7.3 0.316 7.7 LOS A 2.0 14.9 0.58 0.62 60.9
Approach 342 7.4 0.316 7.7 LOS A 2.0 14.9 0.58 0.62 61.0
North: Off-Ramp (north)
7 L2 126 10.8 0.307 6.8 LOS A 1.8 14.7 0.46 0.67 60.3
8 T1 1 0.0 0.307 7.1 LOS A 1.8 14.7 0.46 0.67 65.0
9 R2 222 25.6 0.307 13.9 LOS B 1.8 14.7 0.46 0.67 59.0
Approach 349 20.2 0.307 11.3 LOS B 1.8 14.7 0.46 0.67 59.5
West: Ruakura Road
11 T1 122 10.3 0.139 3.1 LOS A 0.0 0.0 0.00 0.46 60.9
12 R2 93 65.9 0.139 9.9 LOS A 0.0 0.0 0.00 0.46 48.8
Approach 215 34.3 0.139 6.1 LOS A 0.0 0.0 0.00 0.46 55.0
All Vehicles 906 18.7 0.316 8.7 LOS A 2.0 14.9 0.40 0.60 58.9
Level of Service (LOS) Method: Delay (HCM 2000).
Roundabout LOS Method: Same as Signalised Intersections.
Vehicle movement LOS values are based on average delay per movement
Intersection and Approach LOS values are based on average delay for all vehicle movements.
Roundabout Capacity Model: SIDRA Standard.
SIDRA Standard Delay Model is used. Control Delay includes Geometric Delay.
Gap-Acceptance Capacity: SIDRA Standard (Akçelik M3D).
HV (%) values are calculated for All Movement Classes of All Heavy Vehicle Model Designation.
Processed: Tuesday, 12 August 2014 10:46:32SIDRA INTERSECTION 6.0.22.4722
Copyright © 2000-2014 Akcelik and Associates Pty Ltdwww.sidrasolutions.com
Project: O:\ha_civ\231695 hamilton expressway\Secondary Investigation and SARA\Scheme Design\Transportation\AEE traffic\Ruakura Alteration- 2014\AEE report July14\assessment\Ruakura IC East RAB_mpm.sip68000051, OPUS INTERNATIONAL CONSULTANTS, NETWORK / Enterprise

MOVEMENT SUMMARY
Site: 2041PM SCHEME
Ruakura Interchange On/Off Ramps - Eastern RoundaboutOn and off ramp Predicted Intersection Delays at Ruakura Interchange2041 - WRTM PM - Net 36 SCHEMERoundabout
Movement Performance - Vehicles
Demand Flows 95% Back of QueueMov
ID
OD
Mov
Deg.
Satn
Average
Delay
Level of
Service
Prop.
Queued
Effective
Stop Rate
Average
Speed Total HV Vehicles Distanceveh/h % v/c sec veh m per veh km/h
East: Ruakura Road
4 L2 22 4.8 0.287 9.3 LOS A 1.8 13.7 0.72 0.76 62.6
5 T1 228 8.3 0.287 9.8 LOS A 1.8 13.7 0.72 0.76 60.0
Approach 251 8.0 0.287 9.7 LOS A 1.8 13.7 0.72 0.76 60.2
North: Off-Ramp (north)
7 L2 151 7.7 0.389 10.9 LOS B 2.4 21.0 0.76 0.86 58.9
8 T1 1 0.0 0.389 11.2 LOS B 2.4 21.0 0.76 0.86 62.6
9 R2 149 45.8 0.389 18.4 LOS B 2.4 21.0 0.76 0.86 56.2
Approach 301 26.6 0.389 14.6 LOS B 2.4 21.0 0.76 0.86 57.5
West: Ruakura Road
11 T1 236 4.0 0.406 3.1 LOS A 0.0 0.0 0.00 0.56 60.0
12 R2 446 20.8 0.406 9.5 LOS A 0.0 0.0 0.00 0.56 55.8
Approach 682 15.0 0.406 7.3 LOS A 0.0 0.0 0.00 0.56 57.2
All Vehicles 1234 16.4 0.406 9.6 LOS A 2.4 21.0 0.33 0.67 57.9
Level of Service (LOS) Method: Delay (HCM 2000).
Roundabout LOS Method: Same as Signalised Intersections.
Vehicle movement LOS values are based on average delay per movement
Intersection and Approach LOS values are based on average delay for all vehicle movements.
Roundabout Capacity Model: SIDRA Standard.
SIDRA Standard Delay Model is used. Control Delay includes Geometric Delay.
Gap-Acceptance Capacity: SIDRA Standard (Akçelik M3D).
HV (%) values are calculated for All Movement Classes of All Heavy Vehicle Model Designation.
Processed: Tuesday, 12 August 2014 10:46:33SIDRA INTERSECTION 6.0.22.4722
Copyright © 2000-2014 Akcelik and Associates Pty Ltdwww.sidrasolutions.com
Project: O:\ha_civ\231695 hamilton expressway\Secondary Investigation and SARA\Scheme Design\Transportation\AEE traffic\Ruakura Alteration- 2014\AEE report July14\assessment\Ruakura IC East RAB_mpm.sip68000051, OPUS INTERNATIONAL CONSULTANTS, NETWORK / Enterprise

(This page has been intentionally left blank)

SITE LAYOUT
Site: 2021 AM BASELINE
Existing Ruakura Road/SH26/Lissette Road IntersectionBASELINE: SH26 North facing ramps2021 - WRTM AM - Net 35 BASELINEStop (Two-Way)
Created: Thursday, 28 August 2014 09:21:06SIDRA INTERSECTION 6.0.22.4722
Copyright © 2000-2014 Akcelik and Associates Pty Ltdwww.sidrasolutions.com
Project: O:\ha_civ\231695 hamilton expressway\Secondary Investigation and SARA\Scheme Design\Transportation\AEE traffic\Ruakura Alteration- 2014\AEE report July14\assessment\Ruakura-SH26-Lisette Rd XRd_mpm.sip68000051, OPUS INTERNATIONAL CONSULTANTS, NETWORK / Enterprise

MOVEMENT SUMMARY
Site: 2021 AM BASELINE
Existing Ruakura Road/SH26/Lissette Road IntersectionBASELINE: SH26 North facing ramps2021 - WRTM AM - Net 35 BASELINEStop (Two-Way)
Movement Performance - Vehicles
Demand Flows 95% Back of QueueMov
ID
OD
Mov
Deg.
Satn
Average
Delay
Level of
Service
Prop.
Queued
Effective
Stop Rate
Average
Speed Total HV Vehicles Distanceveh/h % v/c sec veh m per veh km/h
South: Lissette Road
1 L2 5 0.0 0.045 17.4 LOS C 0.2 1.1 0.63 0.95 56.3
2 T1 5 0.0 0.045 17.1 LOS C 0.2 1.1 0.63 0.95 56.2
3 R2 5 0.0 0.045 17.1 LOS C 0.2 1.1 0.63 0.95 56.2
Approach 16 0.0 0.045 17.2 LOS C 0.2 1.1 0.63 0.95 56.2
East: SH26 -WB
4 L2 5 0.0 0.205 7.0 LOS A 0.0 0.0 0.00 0.01 74.4
5 T1 356 16.3 0.205 0.0 LOS A 0.0 0.0 0.00 0.01 79.7
6 R2 56 3.8 0.057 8.4 LOS A 0.2 1.6 0.41 0.66 62.3
Approach 417 14.4 0.205 1.2 NA 0.2 1.6 0.06 0.10 76.8
North: Ruakura Rd
7 L2 18 11.8 0.022 11.1 LOS B 0.1 0.6 0.38 0.88 58.8
8 T1 5 0.0 0.355 29.0 LOS D 1.5 11.4 0.82 1.05 47.7
9 R2 69 15.2 0.355 29.8 LOS D 1.5 11.4 0.82 1.05 45.0
Approach 93 13.6 0.355 26.2 LOS D 1.5 11.4 0.74 1.02 47.3
West: SH26 -EB
10 L2 95 11.1 0.055 7.2 LOS A 0.0 0.0 0.00 0.63 61.8
11 T1 221 26.7 0.138 2.1 LOS A 1.0 8.5 0.48 0.02 75.7
12 R2 5 0.0 0.138 8.7 LOS A 1.0 8.5 0.48 0.02 70.3
Approach 321 21.6 0.138 3.7 NA 1.0 8.5 0.34 0.20 70.9
All Vehicles 846 16.8 0.355 5.2 NA 1.5 11.4 0.25 0.25 69.4
Level of Service (LOS) Method: Delay (HCM 2000).
Vehicle movement LOS values are based on average delay per movement
Minor Road Approach LOS values are based on average delay for all vehicle movements.
NA: Intersection LOS and Major Road Approach LOS values are Not Applicable for two-way sign control since the average delay is not a
good LOS measure due to zero delays associated with major road movements.
SIDRA Standard Delay Model is used. Control Delay includes Geometric Delay.
Gap-Acceptance Capacity: SIDRA Standard (Akçelik M3D).
HV (%) values are calculated for All Movement Classes of All Heavy Vehicle Model Designation.
Processed: Friday, 22 August 2014 15:27:14SIDRA INTERSECTION 6.0.22.4722
Copyright © 2000-2014 Akcelik and Associates Pty Ltdwww.sidrasolutions.com
Project: O:\ha_civ\231695 hamilton expressway\Secondary Investigation and SARA\Scheme Design\Transportation\AEE traffic\Ruakura Alteration- 2014\AEE report July14\assessment\Ruakura-SH26-Lisette Rd XRd_mpm.sip68000051, OPUS INTERNATIONAL CONSULTANTS, NETWORK / Enterprise

MOVEMENT SUMMARY
Site: 2021 PM BASELINE
Existing Ruakura Road/SH26/Lissette Road IntersectionBASELINE: SH26 North facing ramps2021 - WRTM PM - Net 35 BASELINEStop (Two-Way)
Movement Performance - Vehicles
Demand Flows 95% Back of QueueMov
ID
OD
Mov
Deg.
Satn
Average
Delay
Level of
Service
Prop.
Queued
Effective
Stop Rate
Average
Speed Total HV Vehicles Distanceveh/h % v/c sec veh m per veh km/h
South: Lissette Road
1 L2 5 0.0 0.050 18.4 LOS C 0.2 1.2 0.63 0.94 55.4
2 T1 5 0.0 0.050 18.1 LOS C 0.2 1.2 0.63 0.94 55.3
3 R2 5 0.0 0.050 18.2 LOS C 0.2 1.2 0.63 0.94 55.3
Approach 16 0.0 0.050 18.2 LOS C 0.2 1.2 0.63 0.94 55.4
East: SH26 -WB
4 L2 5 0.0 0.161 7.0 LOS A 0.0 0.0 0.00 0.01 74.4
5 T1 279 16.6 0.161 0.0 LOS A 0.0 0.0 0.00 0.01 79.7
6 R2 26 8.0 0.032 9.4 LOS A 0.1 0.9 0.49 0.70 60.1
Approach 311 15.6 0.161 0.9 NA 0.1 0.9 0.04 0.07 77.4
North: Ruakura Rd
7 L2 60 1.8 0.085 11.8 LOS B 0.3 2.1 0.48 0.93 60.8
8 T1 5 0.0 0.431 31.5 LOS D 1.9 14.1 0.85 1.07 46.2
9 R2 83 10.1 0.431 32.1 LOS D 1.9 14.1 0.85 1.07 44.5
Approach 148 6.4 0.431 23.9 LOS C 1.9 14.1 0.70 1.01 50.0
West: SH26 -EB
10 L2 61 13.8 0.036 7.2 LOS A 0.0 0.0 0.00 0.63 61.0
11 T1 388 12.7 0.221 1.7 LOS A 1.7 13.3 0.46 0.01 76.0
12 R2 5 0.0 0.221 8.3 LOS A 1.7 13.3 0.46 0.01 70.6
Approach 455 12.7 0.221 2.5 NA 1.7 13.3 0.40 0.09 73.5
All Vehicles 929 12.5 0.431 5.7 NA 1.9 14.1 0.33 0.25 69.1
Level of Service (LOS) Method: Delay (HCM 2000).
Vehicle movement LOS values are based on average delay per movement
Minor Road Approach LOS values are based on average delay for all vehicle movements.
NA: Intersection LOS and Major Road Approach LOS values are Not Applicable for two-way sign control since the average delay is not a
good LOS measure due to zero delays associated with major road movements.
SIDRA Standard Delay Model is used. Control Delay includes Geometric Delay.
Gap-Acceptance Capacity: SIDRA Standard (Akçelik M3D).
HV (%) values are calculated for All Movement Classes of All Heavy Vehicle Model Designation.
Processed: Friday, 22 August 2014 15:27:16SIDRA INTERSECTION 6.0.22.4722
Copyright © 2000-2014 Akcelik and Associates Pty Ltdwww.sidrasolutions.com
Project: O:\ha_civ\231695 hamilton expressway\Secondary Investigation and SARA\Scheme Design\Transportation\AEE traffic\Ruakura Alteration- 2014\AEE report July14\assessment\Ruakura-SH26-Lisette Rd XRd_mpm.sip68000051, OPUS INTERNATIONAL CONSULTANTS, NETWORK / Enterprise

MOVEMENT SUMMARY
Site: 2041 AM BASELINE
Existing Ruakura Road/SH26/Lissette Road IntersectionBASELINE: SH26 North facing ramps2041 - WRTM AM - Net 35 BASELINEStop (Two-Way)
Movement Performance - Vehicles
Demand Flows 95% Back of QueueMov
ID
OD
Mov
Deg.
Satn
Average
Delay
Level of
Service
Prop.
Queued
Effective
Stop Rate
Average
Speed Total HV Vehicles Distanceveh/h % v/c sec veh m per veh km/h
South: Lissette Road
1 L2 5 0.0 0.066 22.7 LOS C 0.2 1.5 0.74 0.96 52.2
2 T1 5 0.0 0.066 22.4 LOS C 0.2 1.5 0.74 0.96 52.1
3 R2 5 0.0 0.066 22.4 LOS C 0.2 1.5 0.74 0.96 52.1
Approach 16 0.0 0.066 22.5 LOS C 0.2 1.5 0.74 0.96 52.2
East: SH26 -WB
4 L2 5 0.0 0.239 7.0 LOS A 0.0 0.0 0.00 0.01 74.5
5 T1 446 5.2 0.239 0.0 LOS A 0.0 0.0 0.00 0.01 79.8
6 R2 119 9.7 0.138 9.3 LOS A 0.6 4.2 0.49 0.73 59.7
Approach 571 6.1 0.239 2.0 NA 0.6 4.2 0.10 0.16 74.5
North: Ruakura Rd
7 L2 34 18.8 0.047 12.1 LOS B 0.2 1.3 0.43 0.91 56.4
8 T1 5 0.0 0.674 55.5 LOS F 3.2 24.7 0.94 1.15 35.5
9 R2 89 11.8 0.674 56.1 LOS F 3.2 24.7 0.94 1.15 34.3
Approach 128 13.1 0.674 44.5 LOS E 3.2 24.7 0.81 1.08 38.3
West: SH26 -EB
10 L2 143 7.4 0.081 7.1 LOS A 0.0 0.0 0.00 0.63 62.9
11 T1 271 8.6 0.153 2.7 LOS A 1.3 10.0 0.53 0.02 75.3
12 R2 5 0.0 0.153 9.3 LOS A 1.3 10.0 0.53 0.02 70.0
Approach 419 8.0 0.153 4.3 NA 1.3 10.0 0.35 0.23 70.5
All Vehicles 1134 7.5 0.674 8.0 NA 3.2 24.7 0.28 0.30 65.7
Level of Service (LOS) Method: Delay (HCM 2000).
Vehicle movement LOS values are based on average delay per movement
Minor Road Approach LOS values are based on average delay for all vehicle movements.
NA: Intersection LOS and Major Road Approach LOS values are Not Applicable for two-way sign control since the average delay is not a
good LOS measure due to zero delays associated with major road movements.
SIDRA Standard Delay Model is used. Control Delay includes Geometric Delay.
Gap-Acceptance Capacity: SIDRA Standard (Akçelik M3D).
HV (%) values are calculated for All Movement Classes of All Heavy Vehicle Model Designation.
Processed: Friday, 22 August 2014 15:27:17SIDRA INTERSECTION 6.0.22.4722
Copyright © 2000-2014 Akcelik and Associates Pty Ltdwww.sidrasolutions.com
Project: O:\ha_civ\231695 hamilton expressway\Secondary Investigation and SARA\Scheme Design\Transportation\AEE traffic\Ruakura Alteration- 2014\AEE report July14\assessment\Ruakura-SH26-Lisette Rd XRd_mpm.sip68000051, OPUS INTERNATIONAL CONSULTANTS, NETWORK / Enterprise

MOVEMENT SUMMARY
Site: 2041 PM BASELINE
Existing Ruakura Road/SH26/Lissette Road IntersectionBASELINE: SH26 North facing ramps2041 - WRTM PM - Net 35 BASELINEStop (Two-Way)
Movement Performance - Vehicles
Demand Flows 95% Back of QueueMov
ID
OD
Mov
Deg.
Satn
Average
Delay
Level of
Service
Prop.
Queued
Effective
Stop Rate
Average
Speed Total HV Vehicles Distanceveh/h % v/c sec veh m per veh km/h
South: Lissette Road
1 L2 5 0.0 0.066 22.7 LOS C 0.2 1.5 0.72 0.94 52.2
2 T1 5 0.0 0.066 22.3 LOS C 0.2 1.5 0.72 0.94 52.1
3 R2 5 0.0 0.066 22.4 LOS C 0.2 1.5 0.72 0.94 52.1
Approach 16 0.0 0.066 22.5 LOS C 0.2 1.5 0.72 0.94 52.2
East: SH26 -WB
4 L2 5 0.0 0.180 7.0 LOS A 0.0 0.0 0.00 0.01 74.4
5 T1 334 5.7 0.180 0.0 LOS A 0.0 0.0 0.00 0.01 79.7
6 R2 49 12.8 0.067 10.1 LOS B 0.3 1.9 0.52 0.75 58.1
Approach 388 6.5 0.180 1.4 NA 0.3 1.9 0.07 0.10 76.1
North: Ruakura Rd
7 L2 148 14.9 0.245 13.8 LOS B 1.0 7.6 0.56 1.02 56.0
8 T1 5 0.0 0.781 56.7 LOS F 4.7 34.7 0.95 1.24 35.1
9 R2 127 6.6 0.781 57.1 LOS F 4.7 34.7 0.95 1.24 34.4
Approach 281 10.9 0.781 34.2 LOS D 4.7 34.7 0.74 1.12 43.3
West: SH26 -EB
10 L2 76 11.1 0.044 7.2 LOS A 0.0 0.0 0.00 0.63 61.8
11 T1 435 4.1 0.234 2.1 LOS A 2.0 14.7 0.50 0.01 75.7
12 R2 5 0.0 0.234 8.7 LOS A 2.0 14.7 0.50 0.01 70.4
Approach 516 5.1 0.234 2.9 NA 2.0 14.7 0.42 0.10 73.2
All Vehicles 1201 6.8 0.781 10.0 NA 4.7 34.7 0.39 0.35 63.4
Level of Service (LOS) Method: Delay (HCM 2000).
Vehicle movement LOS values are based on average delay per movement
Minor Road Approach LOS values are based on average delay for all vehicle movements.
NA: Intersection LOS and Major Road Approach LOS values are Not Applicable for two-way sign control since the average delay is not a
good LOS measure due to zero delays associated with major road movements.
SIDRA Standard Delay Model is used. Control Delay includes Geometric Delay.
Gap-Acceptance Capacity: SIDRA Standard (Akçelik M3D).
HV (%) values are calculated for All Movement Classes of All Heavy Vehicle Model Designation.
Processed: Friday, 22 August 2014 15:27:18SIDRA INTERSECTION 6.0.22.4722
Copyright © 2000-2014 Akcelik and Associates Pty Ltdwww.sidrasolutions.com
Project: O:\ha_civ\231695 hamilton expressway\Secondary Investigation and SARA\Scheme Design\Transportation\AEE traffic\Ruakura Alteration- 2014\AEE report July14\assessment\Ruakura-SH26-Lisette Rd XRd_mpm.sip68000051, OPUS INTERNATIONAL CONSULTANTS, NETWORK / Enterprise

SITE LAYOUT
Site: 2021 AM SCHEME
Existing Ruakura Road/SH26/Lissette Road IntersectionSCHEME: Ruakura diamond Interchange2021 - WRTM AM - Net 36 SCHEMEStop (Two-Way)
Created: Thursday, 28 August 2014 09:21:22SIDRA INTERSECTION 6.0.22.4722
Copyright © 2000-2014 Akcelik and Associates Pty Ltdwww.sidrasolutions.com
Project: O:\ha_civ\231695 hamilton expressway\Secondary Investigation and SARA\Scheme Design\Transportation\AEE traffic\Ruakura Alteration- 2014\AEE report July14\assessment\Ruakura-SH26-Lisette Rd XRd_mpm.sip68000051, OPUS INTERNATIONAL CONSULTANTS, NETWORK / Enterprise

MOVEMENT SUMMARY
Site: 2021 AM SCHEME
Existing Ruakura Road/SH26/Lissette Road IntersectionSCHEME: Ruakura diamond Interchange2021 - WRTM AM - Net 36 SCHEMEStop (Two-Way)
Movement Performance - Vehicles
Demand Flows 95% Back of QueueMov
ID
OD
Mov
Deg.
Satn
Average
Delay
Level of
Service
Prop.
Queued
Effective
Stop Rate
Average
Speed Total HV Vehicles Distanceveh/h % v/c sec veh m per veh km/h
South: Lissette Road
1 L2 5 0.0 0.057 20.3 LOS C 0.2 1.3 0.70 0.95 54.1
2 T1 5 0.0 0.057 19.9 LOS C 0.2 1.3 0.70 0.95 54.0
3 R2 5 0.0 0.057 20.0 LOS C 0.2 1.3 0.70 0.95 53.9
Approach 16 0.0 0.057 20.1 LOS C 0.2 1.3 0.70 0.95 54.0
East: SH26 -WB
4 L2 5 0.0 0.217 7.0 LOS A 0.0 0.0 0.00 0.01 74.4
5 T1 395 9.1 0.217 0.0 LOS A 0.0 0.0 0.00 0.01 79.7
6 R2 151 14.7 0.154 8.7 LOS A 0.6 5.1 0.42 0.68 59.0
Approach 551 10.5 0.217 2.5 NA 0.6 5.1 0.11 0.19 72.7
North: Ruakura Rd
7 L2 76 30.6 0.100 12.3 LOS B 0.4 3.3 0.39 0.92 53.9
8 T1 5 0.0 0.403 33.4 LOS D 1.6 12.5 0.86 1.06 45.2
9 R2 69 10.6 0.403 34.0 LOS D 1.6 12.5 0.86 1.06 43.5
Approach 151 20.3 0.403 23.0 LOS C 1.6 12.5 0.62 0.99 48.2
West: SH26 -EB
10 L2 76 8.3 0.043 7.1 LOS A 0.0 0.0 0.00 0.63 62.6
11 T1 200 17.9 0.120 2.2 LOS A 0.9 7.3 0.49 0.02 75.6
12 R2 5 0.0 0.120 8.9 LOS A 0.9 7.3 0.49 0.02 70.2
Approach 281 15.0 0.120 3.7 NA 0.9 7.3 0.36 0.19 71.5
All Vehicles 998 13.1 0.403 6.2 NA 1.6 12.5 0.27 0.32 66.9
Level of Service (LOS) Method: Delay (HCM 2000).
Vehicle movement LOS values are based on average delay per movement
Minor Road Approach LOS values are based on average delay for all vehicle movements.
NA: Intersection LOS and Major Road Approach LOS values are Not Applicable for two-way sign control since the average delay is not a
good LOS measure due to zero delays associated with major road movements.
SIDRA Standard Delay Model is used. Control Delay includes Geometric Delay.
Gap-Acceptance Capacity: SIDRA Standard (Akçelik M3D).
HV (%) values are calculated for All Movement Classes of All Heavy Vehicle Model Designation.
Processed: Friday, 22 August 2014 15:27:20SIDRA INTERSECTION 6.0.22.4722
Copyright © 2000-2014 Akcelik and Associates Pty Ltdwww.sidrasolutions.com
Project: O:\ha_civ\231695 hamilton expressway\Secondary Investigation and SARA\Scheme Design\Transportation\AEE traffic\Ruakura Alteration- 2014\AEE report July14\assessment\Ruakura-SH26-Lisette Rd XRd_mpm.sip68000051, OPUS INTERNATIONAL CONSULTANTS, NETWORK / Enterprise
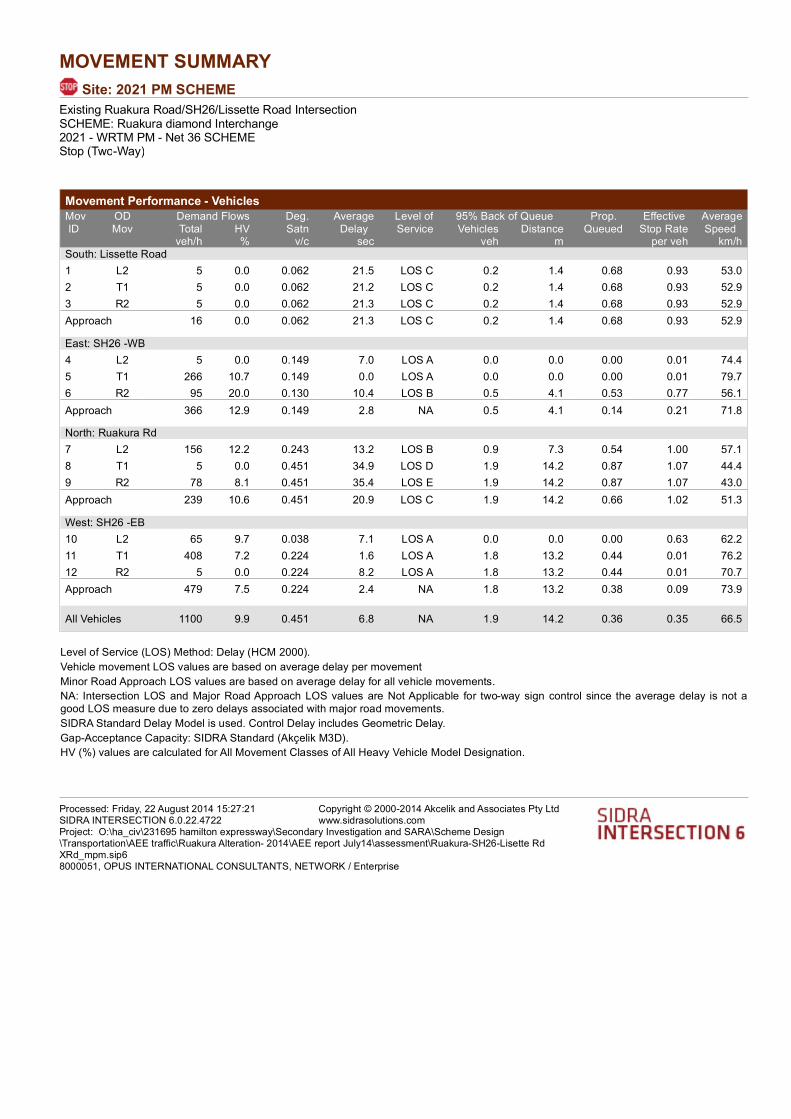
MOVEMENT SUMMARY
Site: 2021 PM SCHEME
Existing Ruakura Road/SH26/Lissette Road IntersectionSCHEME: Ruakura diamond Interchange2021 - WRTM PM - Net 36 SCHEMEStop (Two-Way)
Movement Performance - Vehicles
Demand Flows 95% Back of QueueMov
ID
OD
Mov
Deg.
Satn
Average
Delay
Level of
Service
Prop.
Queued
Effective
Stop Rate
Average
Speed Total HV Vehicles Distanceveh/h % v/c sec veh m per veh km/h
South: Lissette Road
1 L2 5 0.0 0.062 21.5 LOS C 0.2 1.4 0.68 0.93 53.0
2 T1 5 0.0 0.062 21.2 LOS C 0.2 1.4 0.68 0.93 52.9
3 R2 5 0.0 0.062 21.3 LOS C 0.2 1.4 0.68 0.93 52.9
Approach 16 0.0 0.062 21.3 LOS C 0.2 1.4 0.68 0.93 52.9
East: SH26 -WB
4 L2 5 0.0 0.149 7.0 LOS A 0.0 0.0 0.00 0.01 74.4
5 T1 266 10.7 0.149 0.0 LOS A 0.0 0.0 0.00 0.01 79.7
6 R2 95 20.0 0.130 10.4 LOS B 0.5 4.1 0.53 0.77 56.1
Approach 366 12.9 0.149 2.8 NA 0.5 4.1 0.14 0.21 71.8
North: Ruakura Rd
7 L2 156 12.2 0.243 13.2 LOS B 0.9 7.3 0.54 1.00 57.1
8 T1 5 0.0 0.451 34.9 LOS D 1.9 14.2 0.87 1.07 44.4
9 R2 78 8.1 0.451 35.4 LOS E 1.9 14.2 0.87 1.07 43.0
Approach 239 10.6 0.451 20.9 LOS C 1.9 14.2 0.66 1.02 51.3
West: SH26 -EB
10 L2 65 9.7 0.038 7.1 LOS A 0.0 0.0 0.00 0.63 62.2
11 T1 408 7.2 0.224 1.6 LOS A 1.8 13.2 0.44 0.01 76.2
12 R2 5 0.0 0.224 8.2 LOS A 1.8 13.2 0.44 0.01 70.7
Approach 479 7.5 0.224 2.4 NA 1.8 13.2 0.38 0.09 73.9
All Vehicles 1100 9.9 0.451 6.8 NA 1.9 14.2 0.36 0.35 66.5
Level of Service (LOS) Method: Delay (HCM 2000).
Vehicle movement LOS values are based on average delay per movement
Minor Road Approach LOS values are based on average delay for all vehicle movements.
NA: Intersection LOS and Major Road Approach LOS values are Not Applicable for two-way sign control since the average delay is not a
good LOS measure due to zero delays associated with major road movements.
SIDRA Standard Delay Model is used. Control Delay includes Geometric Delay.
Gap-Acceptance Capacity: SIDRA Standard (Akçelik M3D).
HV (%) values are calculated for All Movement Classes of All Heavy Vehicle Model Designation.
Processed: Friday, 22 August 2014 15:27:21SIDRA INTERSECTION 6.0.22.4722
Copyright © 2000-2014 Akcelik and Associates Pty Ltdwww.sidrasolutions.com
Project: O:\ha_civ\231695 hamilton expressway\Secondary Investigation and SARA\Scheme Design\Transportation\AEE traffic\Ruakura Alteration- 2014\AEE report July14\assessment\Ruakura-SH26-Lisette Rd XRd_mpm.sip68000051, OPUS INTERNATIONAL CONSULTANTS, NETWORK / Enterprise

MOVEMENT SUMMARY
Site: 2041AM SCHEME
Existing Ruakura Road/SH26/Lissette Road IntersectionSCHEME: Ruakura diamond Interchange2041 - WRTM AM - Net 36 SCHEMEStop (Two-Way)
Movement Performance - Vehicles
Demand Flows 95% Back of QueueMov
ID
OD
Mov
Deg.
Satn
Average
Delay
Level of
Service
Prop.
Queued
Effective
Stop Rate
Average
Speed Total HV Vehicles Distanceveh/h % v/c sec veh m per veh km/h
South: Lissette Road
1 L2 5 0.0 0.059 20.8 LOS C 0.2 1.4 0.70 0.95 53.6
2 T1 5 0.0 0.059 20.5 LOS C 0.2 1.4 0.70 0.95 53.5
3 R2 5 0.0 0.059 20.5 LOS C 0.2 1.4 0.70 0.95 53.5
Approach 16 0.0 0.059 20.6 LOS C 0.2 1.4 0.70 0.95 53.6
East: SH26 -WB
4 L2 5 0.0 0.210 7.0 LOS A 0.0 0.0 0.00 0.01 74.5
5 T1 393 4.8 0.210 0.0 LOS A 0.0 0.0 0.00 0.01 79.8
6 R2 159 7.9 0.164 8.7 LOS A 0.7 5.1 0.44 0.70 60.8
Approach 557 5.7 0.210 2.6 NA 0.7 5.1 0.13 0.21 73.2
North: Ruakura Rd
7 L2 74 17.1 0.094 11.6 LOS B 0.3 2.8 0.40 0.92 57.2
8 T1 5 5.0 0.472 36.1 LOS E 2.0 14.9 0.88 1.08 43.1
9 R2 81 6.5 0.472 36.2 LOS E 2.0 14.9 0.88 1.08 42.8
Approach 160 11.3 0.472 24.9 LOS C 2.0 14.9 0.66 1.00 48.4
West: SH26 -EB
10 L2 91 5.8 0.051 7.1 LOS A 0.0 0.0 0.00 0.63 63.4
11 T1 239 7.9 0.135 2.2 LOS A 1.1 8.1 0.49 0.02 75.7
12 R2 5 0.0 0.135 8.8 LOS A 1.1 8.1 0.49 0.02 70.3
Approach 335 7.2 0.135 3.6 NA 1.1 8.1 0.36 0.18 71.8
All Vehicles 1067 6.9 0.472 6.5 NA 2.0 14.9 0.29 0.33 67.3
Level of Service (LOS) Method: Delay (HCM 2000).
Vehicle movement LOS values are based on average delay per movement
Minor Road Approach LOS values are based on average delay for all vehicle movements.
NA: Intersection LOS and Major Road Approach LOS values are Not Applicable for two-way sign control since the average delay is not a
good LOS measure due to zero delays associated with major road movements.
SIDRA Standard Delay Model is used. Control Delay includes Geometric Delay.
Gap-Acceptance Capacity: SIDRA Standard (Akçelik M3D).
HV (%) values are calculated for All Movement Classes of All Heavy Vehicle Model Designation.
Processed: Friday, 22 August 2014 15:27:22SIDRA INTERSECTION 6.0.22.4722
Copyright © 2000-2014 Akcelik and Associates Pty Ltdwww.sidrasolutions.com
Project: O:\ha_civ\231695 hamilton expressway\Secondary Investigation and SARA\Scheme Design\Transportation\AEE traffic\Ruakura Alteration- 2014\AEE report July14\assessment\Ruakura-SH26-Lisette Rd XRd_mpm.sip68000051, OPUS INTERNATIONAL CONSULTANTS, NETWORK / Enterprise

MOVEMENT SUMMARY
Site: 2041 PM SCHEME
Existing Ruakura Road/SH26/Lissette Road IntersectionSCHEME: Ruakura diamond Interchange2041 - WRTM PM - Net 36 SCHEMEStop (Two-Way)
Movement Performance - Vehicles
Demand Flows 95% Back of QueueMov
ID
OD
Mov
Deg.
Satn
Average
Delay
Level of
Service
Prop.
Queued
Effective
Stop Rate
Average
Speed Total HV Vehicles Distanceveh/h % v/c sec veh m per veh km/h
South: Lissette Road
1 L2 5 0.0 0.060 21.1 LOS C 0.2 1.4 0.68 0.94 53.3
2 T1 5 0.0 0.060 20.8 LOS C 0.2 1.4 0.68 0.94 53.2
3 R2 5 0.0 0.060 20.9 LOS C 0.2 1.4 0.68 0.94 53.2
Approach 16 0.0 0.060 20.9 LOS C 0.2 1.4 0.68 0.94 53.3
East: SH26 -WB
4 L2 5 0.0 0.161 7.0 LOS A 0.0 0.0 0.00 0.01 74.4
5 T1 298 4.9 0.161 0.0 LOS A 0.0 0.0 0.00 0.01 79.7
6 R2 91 10.5 0.110 9.6 LOS A 0.4 3.3 0.50 0.74 59.3
Approach 394 6.1 0.161 2.3 NA 0.4 3.3 0.11 0.18 73.8
North: Ruakura Rd
7 L2 160 6.6 0.229 12.4 LOS B 0.9 6.5 0.52 0.97 59.1
8 T1 5 0.0 0.608 38.1 LOS E 3.1 22.0 0.90 1.13 42.7
9 R2 117 3.6 0.608 38.4 LOS E 3.1 22.0 0.90 1.13 42.2
Approach 282 5.2 0.608 23.6 LOS C 3.1 22.0 0.68 1.04 50.4
West: SH26 -EB
10 L2 54 7.8 0.031 7.1 LOS A 0.0 0.0 0.00 0.63 62.8
11 T1 394 3.5 0.212 1.7 LOS A 1.7 12.4 0.45 0.01 76.1
12 R2 5 0.0 0.212 8.3 LOS A 1.7 12.4 0.45 0.01 70.6
Approach 453 4.0 0.212 2.4 NA 1.7 12.4 0.40 0.08 74.1
All Vehicles 1144 5.0 0.608 7.9 NA 3.1 22.0 0.38 0.36 66.0
Level of Service (LOS) Method: Delay (HCM 2000).
Vehicle movement LOS values are based on average delay per movement
Minor Road Approach LOS values are based on average delay for all vehicle movements.
NA: Intersection LOS and Major Road Approach LOS values are Not Applicable for two-way sign control since the average delay is not a
good LOS measure due to zero delays associated with major road movements.
SIDRA Standard Delay Model is used. Control Delay includes Geometric Delay.
Gap-Acceptance Capacity: SIDRA Standard (Akçelik M3D).
HV (%) values are calculated for All Movement Classes of All Heavy Vehicle Model Designation.
Processed: Friday, 22 August 2014 15:27:24SIDRA INTERSECTION 6.0.22.4722
Copyright © 2000-2014 Akcelik and Associates Pty Ltdwww.sidrasolutions.com
Project: O:\ha_civ\231695 hamilton expressway\Secondary Investigation and SARA\Scheme Design\Transportation\AEE traffic\Ruakura Alteration- 2014\AEE report July14\assessment\Ruakura-SH26-Lisette Rd XRd_mpm.sip68000051, OPUS INTERNATIONAL CONSULTANTS, NETWORK / Enterprise

(This page has been intentionally left blank)

SITE LAYOUT
Site: 2021 AM BASELINE
Vaile Road _ Davison Road _ Ruakura RoadBASELINE: SH26 North facing ramps2021 - WRTM - AM Net 35 BASELINEStop (Two-Way)
Created: Thursday, 28 August 2014 10:54:03SIDRA INTERSECTION 6.0.22.4722
Copyright © 2000-2014 Akcelik and Associates Pty Ltdwww.sidrasolutions.com
Project: O:\ha_civ\231695 hamilton expressway\Secondary Investigation and SARA\Scheme Design\Transportation\AEE traffic\Ruakura Alteration- 2014\AEE report July14\assessment\Vaile Ruakura XRd_mpm.sip68000051, OPUS INTERNATIONAL CONSULTANTS, NETWORK / Enterprise

MOVEMENT SUMMARY
Site: 2021 AM BASELINE
Vaile Road _ Davison Road _ Ruakura RoadBASELINE: SH26 North facing ramps2021 - WRTM - AM Net 35 BASELINEStop (Two-Way)
Movement Performance - Vehicles
Demand Flows 95% Back of QueueMov
ID
OD
Mov
Deg.
Satn
Average
Delay
Level of
Service
Prop.
Queued
Effective
Stop Rate
Average
Speed Total HV Vehicles Distanceveh/h % v/c sec veh m per veh km/h
South: Ruakura Road
1 L2 5 0.0 0.055 8.0 LOS A 0.3 2.0 0.15 0.27 81.0
2 T1 55 1.9 0.055 0.2 LOS A 0.3 2.0 0.15 0.27 90.4
3 R2 38 8.3 0.055 7.8 LOS A 0.3 2.0 0.15 0.27 76.8
Approach 98 4.3 0.055 3.5 NA 0.3 2.0 0.15 0.27 84.1
East: Vaile Road
4 L2 33 9.7 0.084 10.7 LOS B 0.3 2.2 0.13 0.94 68.8
5 T1 5 0.0 0.084 9.6 LOS A 0.3 2.2 0.13 0.94 71.8
6 R2 47 0.0 0.084 9.4 LOS A 0.3 2.2 0.13 0.94 71.8
Approach 85 3.7 0.084 9.9 LOS A 0.3 2.2 0.13 0.94 70.6
North: Ruakura Road
7 L2 24 0.0 0.033 8.0 LOS A 0.2 1.2 0.15 0.28 79.9
8 T1 32 3.3 0.033 0.2 LOS A 0.2 1.2 0.15 0.28 89.0
9 R2 5 0.0 0.033 7.6 LOS A 0.2 1.2 0.15 0.28 79.5
Approach 61 1.7 0.033 3.9 NA 0.2 1.2 0.15 0.28 84.3
West: Davison Road
10 L2 5 0.0 0.015 10.1 LOS B 0.1 0.4 0.18 0.92 72.9
11 T1 5 0.0 0.015 9.6 LOS A 0.1 0.4 0.18 0.92 72.6
12 R2 5 0.0 0.015 9.4 LOS A 0.1 0.4 0.18 0.92 72.5
Approach 16 0.0 0.015 9.7 LOS A 0.1 0.4 0.18 0.92 72.7
All Vehicles 260 3.2 0.084 6.1 NA 0.3 2.2 0.15 0.53 78.5
Level of Service (LOS) Method: Delay (HCM 2000).
Vehicle movement LOS values are based on average delay per movement
Minor Road Approach LOS values are based on average delay for all vehicle movements.
NA: Intersection LOS and Major Road Approach LOS values are Not Applicable for two-way sign control since the average delay is not a
good LOS measure due to zero delays associated with major road movements.
SIDRA Standard Delay Model is used. Control Delay includes Geometric Delay.
Gap-Acceptance Capacity: SIDRA Standard (Akçelik M3D).
HV (%) values are calculated for All Movement Classes of All Heavy Vehicle Model Designation.
Processed: Wednesday, 13 August 2014 09:11:37SIDRA INTERSECTION 6.0.22.4722
Copyright © 2000-2014 Akcelik and Associates Pty Ltdwww.sidrasolutions.com
Project: O:\ha_civ\231695 hamilton expressway\Secondary Investigation and SARA\Scheme Design\Transportation\AEE traffic\Ruakura Alteration- 2014\AEE report July14\assessment\Vaile Ruakura XRd_mpm.sip68000051, OPUS INTERNATIONAL CONSULTANTS, NETWORK / Enterprise

MOVEMENT SUMMARY
Site: 2021 PM BASELINE
Vaile Road _ Davison Road _ Ruakura RoadBASELINE: SH26 North facing ramps2021 - WRTM - PM Net 35 BASELINEStop (Two-Way)
Movement Performance - Vehicles
Demand Flows 95% Back of QueueMov
ID
OD
Mov
Deg.
Satn
Average
Delay
Level of
Service
Prop.
Queued
Effective
Stop Rate
Average
Speed Total HV Vehicles Distanceveh/h % v/c sec veh m per veh km/h
South: Ruakura Road
1 L2 5 0.0 0.041 8.2 LOS A 0.2 1.5 0.22 0.25 80.7
2 T1 41 2.6 0.041 0.4 LOS A 0.2 1.5 0.22 0.25 90.1
3 R2 24 13.0 0.041 8.1 LOS A 0.2 1.5 0.22 0.25 74.6
Approach 71 6.0 0.041 3.6 NA 0.2 1.5 0.22 0.25 83.4
East: Vaile Road
4 L2 23 13.6 0.053 10.9 LOS B 0.2 1.4 0.19 0.92 67.6
5 T1 5 0.0 0.053 9.7 LOS A 0.2 1.4 0.19 0.92 71.9
6 R2 25 0.0 0.053 9.5 LOS A 0.2 1.4 0.19 0.92 71.8
Approach 54 5.9 0.053 10.1 LOS B 0.2 1.4 0.19 0.92 69.9
North: Ruakura Road
7 L2 47 0.0 0.061 8.0 LOS A 0.3 2.2 0.13 0.27 80.5
8 T1 63 1.7 0.061 0.1 LOS A 0.3 2.2 0.13 0.27 89.7
9 R2 5 0.0 0.061 7.5 LOS A 0.3 2.2 0.13 0.27 80.1
Approach 116 0.9 0.061 3.7 NA 0.3 2.2 0.13 0.27 85.2
West: Davison Road
10 L2 5 0.0 0.015 10.2 LOS B 0.1 0.4 0.16 0.93 72.8
11 T1 5 0.0 0.015 9.7 LOS A 0.1 0.4 0.16 0.93 72.5
12 R2 5 0.0 0.015 9.5 LOS A 0.1 0.4 0.16 0.93 72.4
Approach 16 0.0 0.015 9.8 LOS A 0.1 0.4 0.16 0.93 72.6
All Vehicles 256 3.3 0.061 5.4 NA 0.3 2.2 0.17 0.44 80.2
Level of Service (LOS) Method: Delay (HCM 2000).
Vehicle movement LOS values are based on average delay per movement
Minor Road Approach LOS values are based on average delay for all vehicle movements.
NA: Intersection LOS and Major Road Approach LOS values are Not Applicable for two-way sign control since the average delay is not a
good LOS measure due to zero delays associated with major road movements.
SIDRA Standard Delay Model is used. Control Delay includes Geometric Delay.
Gap-Acceptance Capacity: SIDRA Standard (Akçelik M3D).
HV (%) values are calculated for All Movement Classes of All Heavy Vehicle Model Designation.
Processed: Wednesday, 13 August 2014 09:11:38SIDRA INTERSECTION 6.0.22.4722
Copyright © 2000-2014 Akcelik and Associates Pty Ltdwww.sidrasolutions.com
Project: O:\ha_civ\231695 hamilton expressway\Secondary Investigation and SARA\Scheme Design\Transportation\AEE traffic\Ruakura Alteration- 2014\AEE report July14\assessment\Vaile Ruakura XRd_mpm.sip68000051, OPUS INTERNATIONAL CONSULTANTS, NETWORK / Enterprise
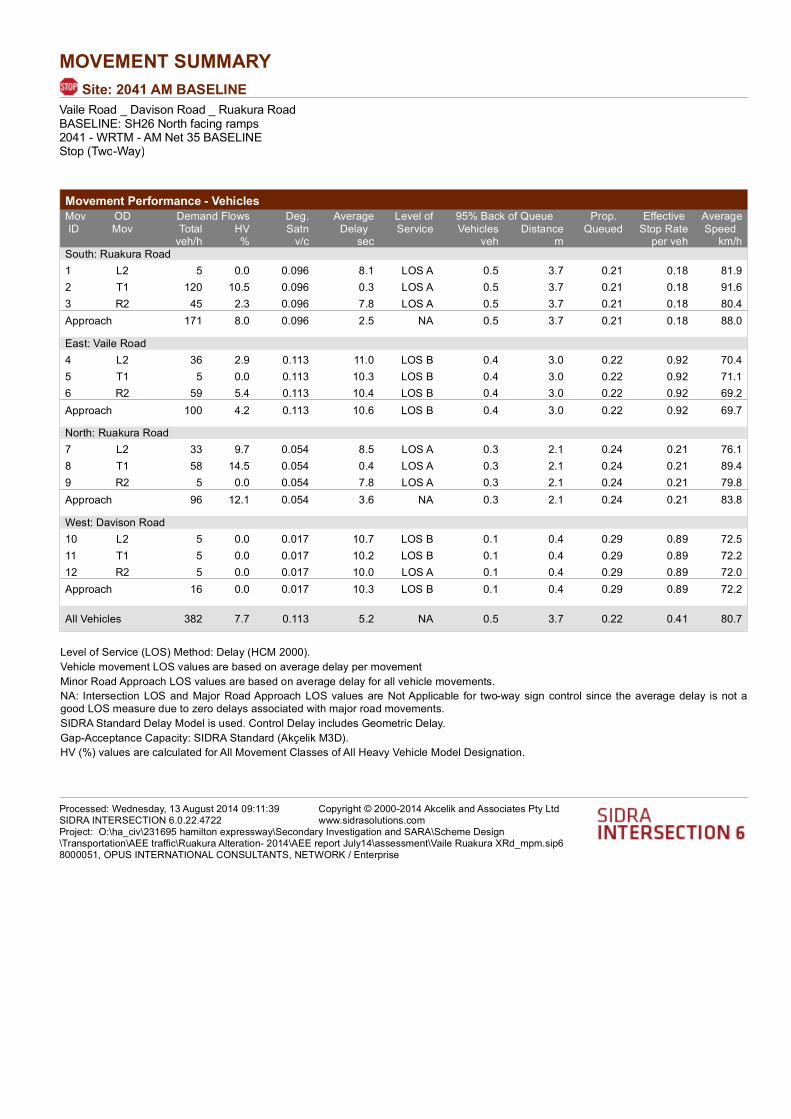
MOVEMENT SUMMARY
Site: 2041 AM BASELINE
Vaile Road _ Davison Road _ Ruakura RoadBASELINE: SH26 North facing ramps2041 - WRTM - AM Net 35 BASELINEStop (Two-Way)
Movement Performance - Vehicles
Demand Flows 95% Back of QueueMov
ID
OD
Mov
Deg.
Satn
Average
Delay
Level of
Service
Prop.
Queued
Effective
Stop Rate
Average
Speed Total HV Vehicles Distanceveh/h % v/c sec veh m per veh km/h
South: Ruakura Road
1 L2 5 0.0 0.096 8.1 LOS A 0.5 3.7 0.21 0.18 81.9
2 T1 120 10.5 0.096 0.3 LOS A 0.5 3.7 0.21 0.18 91.6
3 R2 45 2.3 0.096 7.8 LOS A 0.5 3.7 0.21 0.18 80.4
Approach 171 8.0 0.096 2.5 NA 0.5 3.7 0.21 0.18 88.0
East: Vaile Road
4 L2 36 2.9 0.113 11.0 LOS B 0.4 3.0 0.22 0.92 70.4
5 T1 5 0.0 0.113 10.3 LOS B 0.4 3.0 0.22 0.92 71.1
6 R2 59 5.4 0.113 10.4 LOS B 0.4 3.0 0.22 0.92 69.2
Approach 100 4.2 0.113 10.6 LOS B 0.4 3.0 0.22 0.92 69.7
North: Ruakura Road
7 L2 33 9.7 0.054 8.5 LOS A 0.3 2.1 0.24 0.21 76.1
8 T1 58 14.5 0.054 0.4 LOS A 0.3 2.1 0.24 0.21 89.4
9 R2 5 0.0 0.054 7.8 LOS A 0.3 2.1 0.24 0.21 79.8
Approach 96 12.1 0.054 3.6 NA 0.3 2.1 0.24 0.21 83.8
West: Davison Road
10 L2 5 0.0 0.017 10.7 LOS B 0.1 0.4 0.29 0.89 72.5
11 T1 5 0.0 0.017 10.2 LOS B 0.1 0.4 0.29 0.89 72.2
12 R2 5 0.0 0.017 10.0 LOS A 0.1 0.4 0.29 0.89 72.0
Approach 16 0.0 0.017 10.3 LOS B 0.1 0.4 0.29 0.89 72.2
All Vehicles 382 7.7 0.113 5.2 NA 0.5 3.7 0.22 0.41 80.7
Level of Service (LOS) Method: Delay (HCM 2000).
Vehicle movement LOS values are based on average delay per movement
Minor Road Approach LOS values are based on average delay for all vehicle movements.
NA: Intersection LOS and Major Road Approach LOS values are Not Applicable for two-way sign control since the average delay is not a
good LOS measure due to zero delays associated with major road movements.
SIDRA Standard Delay Model is used. Control Delay includes Geometric Delay.
Gap-Acceptance Capacity: SIDRA Standard (Akçelik M3D).
HV (%) values are calculated for All Movement Classes of All Heavy Vehicle Model Designation.
Processed: Wednesday, 13 August 2014 09:11:39SIDRA INTERSECTION 6.0.22.4722
Copyright © 2000-2014 Akcelik and Associates Pty Ltdwww.sidrasolutions.com
Project: O:\ha_civ\231695 hamilton expressway\Secondary Investigation and SARA\Scheme Design\Transportation\AEE traffic\Ruakura Alteration- 2014\AEE report July14\assessment\Vaile Ruakura XRd_mpm.sip68000051, OPUS INTERNATIONAL CONSULTANTS, NETWORK / Enterprise

MOVEMENT SUMMARY
Site: 2041 PM BASELINE
Vaile Road _ Davison Road _ Ruakura RoadBASELINE: SH26 North facing ramps2041 - WRTM - PM Net 35 BASELINEStop (Two-Way)
Movement Performance - Vehicles
Demand Flows 95% Back of QueueMov
ID
OD
Mov
Deg.
Satn
Average
Delay
Level of
Service
Prop.
Queued
Effective
Stop Rate
Average
Speed Total HV Vehicles Distanceveh/h % v/c sec veh m per veh km/h
South: Ruakura Road
1 L2 5 0.0 0.060 8.6 LOS A 0.3 2.4 0.34 0.19 80.8
2 T1 72 8.8 0.060 0.8 LOS A 0.3 2.4 0.34 0.19 90.1
3 R2 26 4.0 0.060 8.3 LOS A 0.3 2.4 0.34 0.19 78.5
Approach 103 7.1 0.060 3.1 NA 0.3 2.4 0.34 0.19 86.4
East: Vaile Road
4 L2 26 4.0 0.074 11.3 LOS B 0.3 1.9 0.34 0.90 69.9
5 T1 5 0.0 0.074 10.6 LOS B 0.3 1.9 0.34 0.90 71.0
6 R2 32 6.7 0.074 10.7 LOS B 0.3 1.9 0.34 0.90 68.6
Approach 63 5.0 0.074 11.0 LOS B 0.3 1.9 0.34 0.90 69.3
North: Ruakura Road
7 L2 58 3.6 0.124 8.2 LOS A 0.6 5.0 0.19 0.16 80.3
8 T1 158 14.7 0.124 0.3 LOS A 0.6 5.0 0.19 0.16 91.6
9 R2 5 0.0 0.124 7.7 LOS A 0.6 5.0 0.19 0.16 81.5
Approach 221 11.4 0.124 2.5 NA 0.6 5.0 0.19 0.16 88.1
West: Davison Road
10 L2 5 0.0 0.018 10.8 LOS B 0.1 0.4 0.23 0.91 72.1
11 T1 5 0.0 0.018 10.3 LOS B 0.1 0.4 0.23 0.91 71.8
12 R2 5 0.0 0.018 10.1 LOS B 0.1 0.4 0.23 0.91 71.7
Approach 16 0.0 0.018 10.4 LOS B 0.1 0.4 0.23 0.91 71.9
All Vehicles 403 8.9 0.124 4.3 NA 0.6 5.0 0.25 0.31 83.4
Level of Service (LOS) Method: Delay (HCM 2000).
Vehicle movement LOS values are based on average delay per movement
Minor Road Approach LOS values are based on average delay for all vehicle movements.
NA: Intersection LOS and Major Road Approach LOS values are Not Applicable for two-way sign control since the average delay is not a
good LOS measure due to zero delays associated with major road movements.
SIDRA Standard Delay Model is used. Control Delay includes Geometric Delay.
Gap-Acceptance Capacity: SIDRA Standard (Akçelik M3D).
HV (%) values are calculated for All Movement Classes of All Heavy Vehicle Model Designation.
Processed: Wednesday, 13 August 2014 09:11:41SIDRA INTERSECTION 6.0.22.4722
Copyright © 2000-2014 Akcelik and Associates Pty Ltdwww.sidrasolutions.com
Project: O:\ha_civ\231695 hamilton expressway\Secondary Investigation and SARA\Scheme Design\Transportation\AEE traffic\Ruakura Alteration- 2014\AEE report July14\assessment\Vaile Ruakura XRd_mpm.sip68000051, OPUS INTERNATIONAL CONSULTANTS, NETWORK / Enterprise
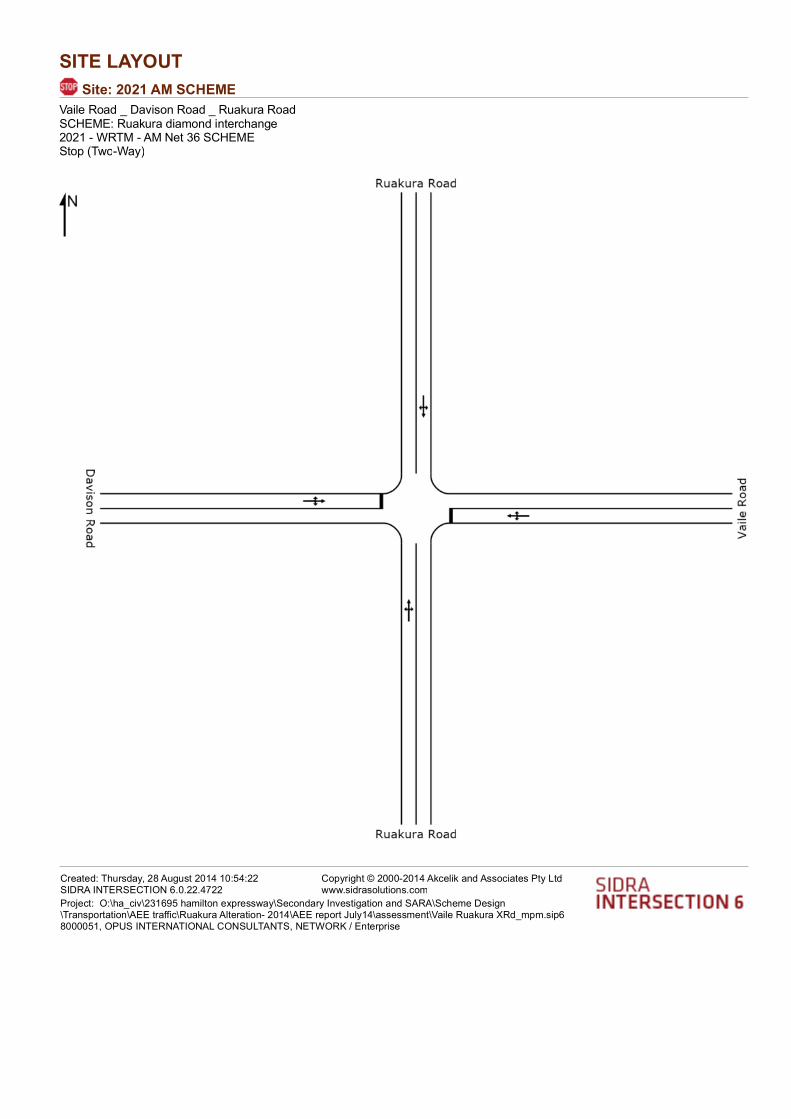
SITE LAYOUT
Site: 2021 AM SCHEME
Vaile Road _ Davison Road _ Ruakura RoadSCHEME: Ruakura diamond interchange2021 - WRTM - AM Net 36 SCHEMEStop (Two-Way)
Created: Thursday, 28 August 2014 10:54:22SIDRA INTERSECTION 6.0.22.4722
Copyright © 2000-2014 Akcelik and Associates Pty Ltdwww.sidrasolutions.com
Project: O:\ha_civ\231695 hamilton expressway\Secondary Investigation and SARA\Scheme Design\Transportation\AEE traffic\Ruakura Alteration- 2014\AEE report July14\assessment\Vaile Ruakura XRd_mpm.sip68000051, OPUS INTERNATIONAL CONSULTANTS, NETWORK / Enterprise

MOVEMENT SUMMARY
Site: 2021 AM SCHEME
Vaile Road _ Davison Road _ Ruakura RoadSCHEME: Ruakura diamond interchange2021 - WRTM - AM Net 36 SCHEMEStop (Two-Way)
Movement Performance - Vehicles
Demand Flows 95% Back of QueueMov
ID
OD
Mov
Deg.
Satn
Average
Delay
Level of
Service
Prop.
Queued
Effective
Stop Rate
Average
Speed Total HV Vehicles Distanceveh/h % v/c sec veh m per veh km/h
South: Ruakura Road
1 L2 5 0.0 0.122 8.7 LOS A 0.7 5.7 0.35 0.07 83.1
2 T1 187 12.9 0.122 0.8 LOS A 0.7 5.7 0.35 0.07 93.0
3 R2 20 10.5 0.122 8.5 LOS A 0.7 5.7 0.35 0.07 77.7
Approach 213 12.4 0.122 1.8 NA 0.7 5.7 0.35 0.07 91.0
East: Vaile Road
4 L2 17 6.3 0.149 12.7 LOS B 0.5 3.9 0.43 0.94 67.9
5 T1 5 0.0 0.149 11.9 LOS B 0.5 3.9 0.43 0.94 69.6
6 R2 78 4.1 0.149 11.9 LOS B 0.5 3.9 0.43 0.94 68.2
Approach 100 4.2 0.149 12.0 LOS B 0.5 3.9 0.43 0.94 68.2
North: Ruakura Road
7 L2 56 5.7 0.118 8.7 LOS A 0.7 5.2 0.33 0.14 78.0
8 T1 144 19.0 0.118 0.7 LOS A 0.7 5.2 0.33 0.14 89.7
9 R2 5 0.0 0.118 8.1 LOS A 0.7 5.2 0.33 0.14 80.1
Approach 205 14.9 0.118 3.1 NA 0.7 5.2 0.33 0.14 86.0
West: Davison Road
10 L2 5 0.0 0.020 11.5 LOS B 0.1 0.5 0.38 0.89 71.6
11 T1 5 0.0 0.020 11.0 LOS B 0.1 0.5 0.38 0.89 71.3
12 R2 5 0.0 0.020 10.8 LOS B 0.1 0.5 0.38 0.89 71.2
Approach 16 0.0 0.020 11.1 LOS B 0.1 0.5 0.38 0.89 71.4
All Vehicles 534 11.4 0.149 4.5 NA 0.7 5.7 0.36 0.29 83.2
Level of Service (LOS) Method: Delay (HCM 2000).
Vehicle movement LOS values are based on average delay per movement
Minor Road Approach LOS values are based on average delay for all vehicle movements.
NA: Intersection LOS and Major Road Approach LOS values are Not Applicable for two-way sign control since the average delay is not a
good LOS measure due to zero delays associated with major road movements.
SIDRA Standard Delay Model is used. Control Delay includes Geometric Delay.
Gap-Acceptance Capacity: SIDRA Standard (Akçelik M3D).
HV (%) values are calculated for All Movement Classes of All Heavy Vehicle Model Designation.
Processed: Wednesday, 13 August 2014 09:11:42SIDRA INTERSECTION 6.0.22.4722
Copyright © 2000-2014 Akcelik and Associates Pty Ltdwww.sidrasolutions.com
Project: O:\ha_civ\231695 hamilton expressway\Secondary Investigation and SARA\Scheme Design\Transportation\AEE traffic\Ruakura Alteration- 2014\AEE report July14\assessment\Vaile Ruakura XRd_mpm.sip68000051, OPUS INTERNATIONAL CONSULTANTS, NETWORK / Enterprise

MOVEMENT SUMMARY
Site: 2021 PM SCHEME
Vaile Road _ Davison Road _ Ruakura RoadSCHEME: Ruakura diamond interchange2021 - WRTM - PM Net 36 SCHEMEStop (Two-Way)
Movement Performance - Vehicles
Demand Flows 95% Back of QueueMov
ID
OD
Mov
Deg.
Satn
Average
Delay
Level of
Service
Prop.
Queued
Effective
Stop Rate
Average
Speed Total HV Vehicles Distanceveh/h % v/c sec veh m per veh km/h
South: Ruakura Road
1 L2 5 0.0 0.108 9.1 LOS A 0.7 5.5 0.42 0.06 82.7
2 T1 171 13.0 0.108 1.3 LOS A 0.7 5.5 0.42 0.06 92.6
3 R2 13 16.7 0.108 9.2 LOS A 0.7 5.5 0.42 0.06 74.8
Approach 188 12.8 0.108 2.0 NA 0.7 5.5 0.42 0.06 90.8
East: Vaile Road
4 L2 11 10.0 0.106 13.4 LOS B 0.4 2.7 0.46 0.95 66.3
5 T1 5 0.0 0.106 12.3 LOS B 0.4 2.7 0.46 0.95 69.2
6 R2 49 6.4 0.106 12.5 LOS B 0.4 2.7 0.46 0.95 67.0
Approach 65 6.5 0.106 12.6 LOS B 0.4 2.7 0.46 0.95 67.0
North: Ruakura Road
7 L2 74 4.3 0.160 8.6 LOS A 1.0 7.2 0.33 0.13 79.2
8 T1 211 11.0 0.160 0.7 LOS A 1.0 7.2 0.33 0.13 90.5
9 R2 5 0.0 0.160 8.1 LOS A 1.0 7.2 0.33 0.13 80.7
Approach 289 9.1 0.160 2.8 NA 1.0 7.2 0.33 0.13 87.1
West: Davison Road
10 L2 5 0.0 0.021 11.7 LOS B 0.1 0.5 0.38 0.89 71.3
11 T1 5 0.0 0.021 11.2 LOS B 0.1 0.5 0.38 0.89 71.0
12 R2 5 0.0 0.021 11.0 LOS B 0.1 0.5 0.38 0.89 70.8
Approach 16 0.0 0.021 11.3 LOS B 0.1 0.5 0.38 0.89 71.1
All Vehicles 559 9.8 0.160 3.9 NA 1.0 7.2 0.38 0.22 84.8
Level of Service (LOS) Method: Delay (HCM 2000).
Vehicle movement LOS values are based on average delay per movement
Minor Road Approach LOS values are based on average delay for all vehicle movements.
NA: Intersection LOS and Major Road Approach LOS values are Not Applicable for two-way sign control since the average delay is not a
good LOS measure due to zero delays associated with major road movements.
SIDRA Standard Delay Model is used. Control Delay includes Geometric Delay.
Gap-Acceptance Capacity: SIDRA Standard (Akçelik M3D).
HV (%) values are calculated for All Movement Classes of All Heavy Vehicle Model Designation.
Processed: Wednesday, 13 August 2014 09:11:43SIDRA INTERSECTION 6.0.22.4722
Copyright © 2000-2014 Akcelik and Associates Pty Ltdwww.sidrasolutions.com
Project: O:\ha_civ\231695 hamilton expressway\Secondary Investigation and SARA\Scheme Design\Transportation\AEE traffic\Ruakura Alteration- 2014\AEE report July14\assessment\Vaile Ruakura XRd_mpm.sip68000051, OPUS INTERNATIONAL CONSULTANTS, NETWORK / Enterprise

MOVEMENT SUMMARY
Site: 2041 AM SCHEME
Vaile Road _ Davison Road _ Ruakura RoadSCHEME: Ruakura diamond interchange2041 - WRTM - AM Net 36 SCHEMEStop (Two-Way)
Movement Performance - Vehicles
Demand Flows 95% Back of QueueMov
ID
OD
Mov
Deg.
Satn
Average
Delay
Level of
Service
Prop.
Queued
Effective
Stop Rate
Average
Speed Total HV Vehicles Distanceveh/h % v/c sec veh m per veh km/h
South: Ruakura Road
1 L2 5 0.0 0.123 8.7 LOS A 0.7 5.5 0.37 0.10 82.5
2 T1 184 9.7 0.123 0.9 LOS A 0.7 5.5 0.37 0.10 92.3
3 R2 27 3.8 0.123 8.4 LOS A 0.7 5.5 0.37 0.10 80.2
Approach 217 8.7 0.123 2.0 NA 0.7 5.5 0.37 0.10 90.3
East: Vaile Road
4 L2 21 5.0 0.170 12.9 LOS B 0.6 4.5 0.44 0.95 68.0
5 T1 5 0.0 0.170 12.1 LOS B 0.6 4.5 0.44 0.95 69.4
6 R2 85 4.9 0.170 12.2 LOS B 0.6 4.5 0.44 0.95 67.7
Approach 112 4.7 0.170 12.3 LOS B 0.6 4.5 0.44 0.95 67.8
North: Ruakura Road
7 L2 64 8.2 0.130 8.7 LOS A 0.7 5.7 0.33 0.14 77.3
8 T1 163 11.6 0.130 0.7 LOS A 0.7 5.7 0.33 0.14 90.1
9 R2 5 0.0 0.130 8.1 LOS A 0.7 5.7 0.33 0.14 80.4
Approach 233 10.4 0.130 3.1 NA 0.7 5.7 0.33 0.14 85.9
West: Davison Road
10 L2 5 0.0 0.020 11.6 LOS B 0.1 0.5 0.38 0.89 71.5
11 T1 5 0.0 0.020 11.1 LOS B 0.1 0.5 0.38 0.89 71.2
12 R2 5 0.0 0.020 10.9 LOS B 0.1 0.5 0.38 0.89 71.0
Approach 16 0.0 0.020 11.2 LOS B 0.1 0.5 0.38 0.89 71.2
All Vehicles 577 8.4 0.170 4.7 NA 0.7 5.7 0.37 0.30 82.7
Level of Service (LOS) Method: Delay (HCM 2000).
Vehicle movement LOS values are based on average delay per movement
Minor Road Approach LOS values are based on average delay for all vehicle movements.
NA: Intersection LOS and Major Road Approach LOS values are Not Applicable for two-way sign control since the average delay is not a
good LOS measure due to zero delays associated with major road movements.
SIDRA Standard Delay Model is used. Control Delay includes Geometric Delay.
Gap-Acceptance Capacity: SIDRA Standard (Akçelik M3D).
HV (%) values are calculated for All Movement Classes of All Heavy Vehicle Model Designation.
Processed: Wednesday, 13 August 2014 09:11:44SIDRA INTERSECTION 6.0.22.4722
Copyright © 2000-2014 Akcelik and Associates Pty Ltdwww.sidrasolutions.com
Project: O:\ha_civ\231695 hamilton expressway\Secondary Investigation and SARA\Scheme Design\Transportation\AEE traffic\Ruakura Alteration- 2014\AEE report July14\assessment\Vaile Ruakura XRd_mpm.sip68000051, OPUS INTERNATIONAL CONSULTANTS, NETWORK / Enterprise

MOVEMENT SUMMARY
Site: 2041 PM SCHEME
Vaile Road _ Davison Road _ Ruakura RoadSCHEME: Ruakura diamond interchange2041 - WRTM - PM Net 36 SCHEMEStop (Two-Way)
Movement Performance - Vehicles
Demand Flows 95% Back of QueueMov
ID
OD
Mov
Deg.
Satn
Average
Delay
Level of
Service
Prop.
Queued
Effective
Stop Rate
Average
Speed Total HV Vehicles Distanceveh/h % v/c sec veh m per veh km/h
South: Ruakura Road
1 L2 5 0.0 0.103 9.1 LOS A 0.7 4.9 0.42 0.08 82.4
2 T1 160 9.2 0.103 1.2 LOS A 0.7 4.9 0.42 0.08 92.1
3 R2 17 6.3 0.103 8.8 LOS A 0.7 4.9 0.42 0.08 79.0
Approach 182 8.7 0.103 2.2 NA 0.7 4.9 0.42 0.08 90.4
East: Vaile Road
4 L2 18 5.9 0.120 13.0 LOS B 0.4 3.1 0.46 0.95 67.6
5 T1 5 0.0 0.120 12.2 LOS B 0.4 3.1 0.46 0.95 69.3
6 R2 54 5.9 0.120 12.3 LOS B 0.4 3.1 0.46 0.95 67.2
Approach 77 5.5 0.120 12.5 LOS B 0.4 3.1 0.46 0.95 67.5
North: Ruakura Road
7 L2 81 3.9 0.168 8.6 LOS A 1.0 7.5 0.31 0.13 79.5
8 T1 224 6.6 0.168 0.6 LOS A 1.0 7.5 0.31 0.13 90.7
9 R2 5 0.0 0.168 8.0 LOS A 1.0 7.5 0.31 0.13 80.8
Approach 311 5.8 0.168 2.8 NA 1.0 7.5 0.31 0.13 87.3
West: Davison Road
10 L2 5 0.0 0.021 11.7 LOS B 0.1 0.5 0.37 0.89 71.2
11 T1 5 0.0 0.021 11.2 LOS B 0.1 0.5 0.37 0.89 70.9
12 R2 5 0.0 0.021 11.0 LOS B 0.1 0.5 0.37 0.89 70.8
Approach 16 0.0 0.021 11.3 LOS B 0.1 0.5 0.37 0.89 71.0
All Vehicles 585 6.5 0.168 4.1 NA 1.0 7.5 0.37 0.24 84.4
Level of Service (LOS) Method: Delay (HCM 2000).
Vehicle movement LOS values are based on average delay per movement
Minor Road Approach LOS values are based on average delay for all vehicle movements.
NA: Intersection LOS and Major Road Approach LOS values are Not Applicable for two-way sign control since the average delay is not a
good LOS measure due to zero delays associated with major road movements.
SIDRA Standard Delay Model is used. Control Delay includes Geometric Delay.
Gap-Acceptance Capacity: SIDRA Standard (Akçelik M3D).
HV (%) values are calculated for All Movement Classes of All Heavy Vehicle Model Designation.
Processed: Wednesday, 13 August 2014 09:11:45SIDRA INTERSECTION 6.0.22.4722
Copyright © 2000-2014 Akcelik and Associates Pty Ltdwww.sidrasolutions.com
Project: O:\ha_civ\231695 hamilton expressway\Secondary Investigation and SARA\Scheme Design\Transportation\AEE traffic\Ruakura Alteration- 2014\AEE report July14\assessment\Vaile Ruakura XRd_mpm.sip68000051, OPUS INTERNATIONAL CONSULTANTS, NETWORK / Enterprise

(This page has been intentionally left blank)
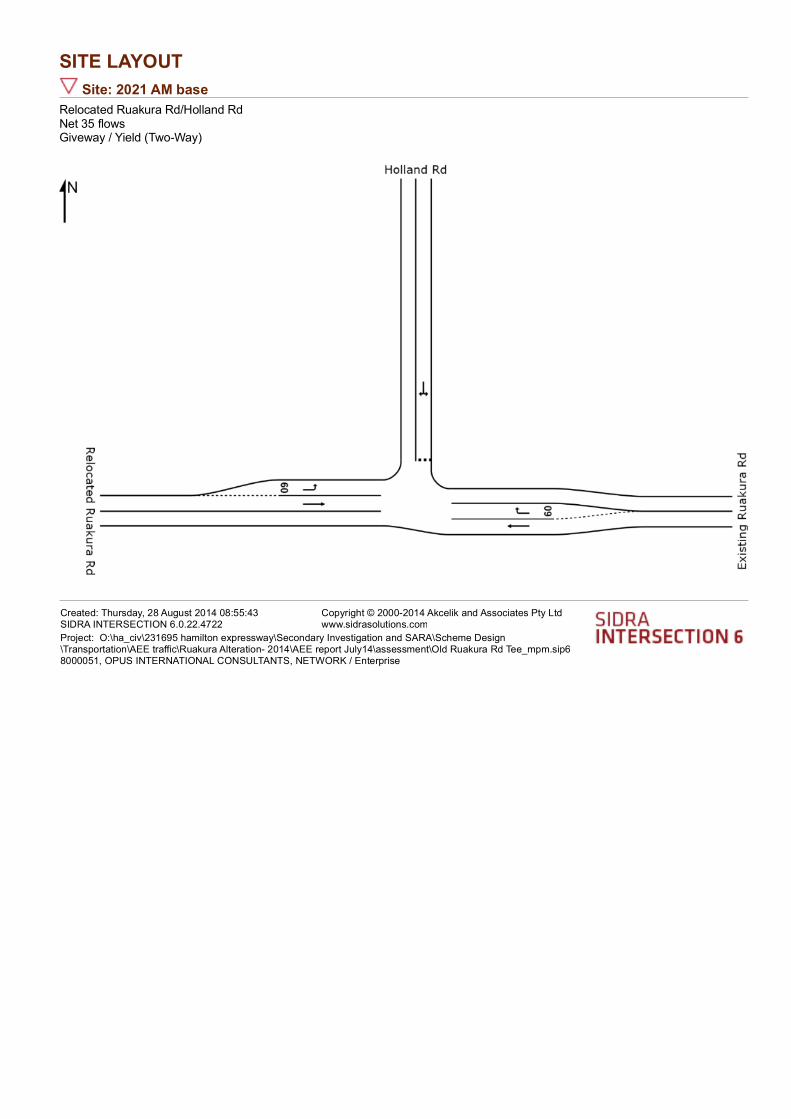
SITE LAYOUT
Site: 2021 AM base
Relocated Ruakura Rd/Holland RdNet 35 flowsGiveway / Yield (Two-Way)
Created: Thursday, 28 August 2014 08:55:43SIDRA INTERSECTION 6.0.22.4722
Copyright © 2000-2014 Akcelik and Associates Pty Ltdwww.sidrasolutions.com
Project: O:\ha_civ\231695 hamilton expressway\Secondary Investigation and SARA\Scheme Design\Transportation\AEE traffic\Ruakura Alteration- 2014\AEE report July14\assessment\Old Ruakura Rd Tee_mpm.sip68000051, OPUS INTERNATIONAL CONSULTANTS, NETWORK / Enterprise
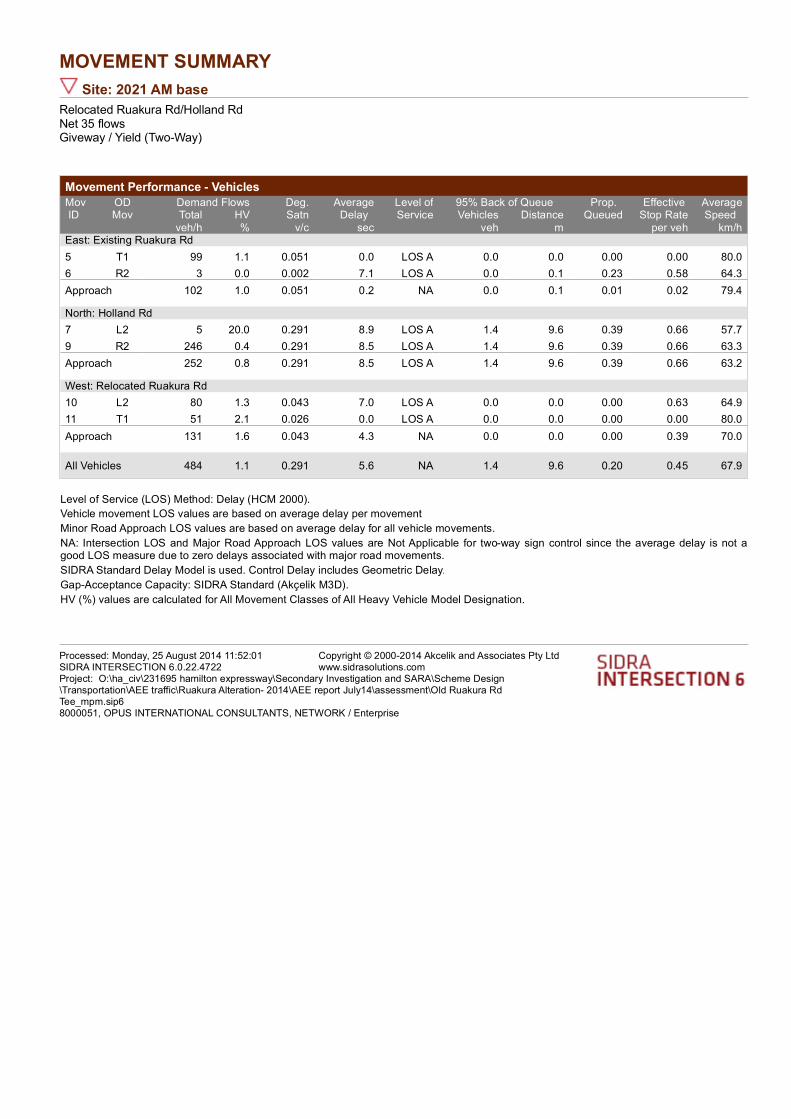
MOVEMENT SUMMARY
Site: 2021 AM base
Relocated Ruakura Rd/Holland RdNet 35 flowsGiveway / Yield (Two-Way)
Movement Performance - Vehicles
Demand Flows 95% Back of QueueMovID
ODMov
Deg.Satn
AverageDelay
Level ofService
Prop. Queued
Effective Stop Rate
AverageSpeed Total HV Vehicles Distance
veh/h % v/c sec veh m per veh km/hEast: Existing Ruakura Rd
5 T1 99 1.1 0.051 0.0 LOS A 0.0 0.0 0.00 0.00 80.0
6 R2 3 0.0 0.002 7.1 LOS A 0.0 0.1 0.23 0.58 64.3
Approach 102 1.0 0.051 0.2 NA 0.0 0.1 0.01 0.02 79.4
North: Holland Rd
7 L2 5 20.0 0.291 8.9 LOS A 1.4 9.6 0.39 0.66 57.7
9 R2 246 0.4 0.291 8.5 LOS A 1.4 9.6 0.39 0.66 63.3
Approach 252 0.8 0.291 8.5 LOS A 1.4 9.6 0.39 0.66 63.2
West: Relocated Ruakura Rd
10 L2 80 1.3 0.043 7.0 LOS A 0.0 0.0 0.00 0.63 64.9
11 T1 51 2.1 0.026 0.0 LOS A 0.0 0.0 0.00 0.00 80.0
Approach 131 1.6 0.043 4.3 NA 0.0 0.0 0.00 0.39 70.0
All Vehicles 484 1.1 0.291 5.6 NA 1.4 9.6 0.20 0.45 67.9
Level of Service (LOS) Method: Delay (HCM 2000).
Vehicle movement LOS values are based on average delay per movement
Minor Road Approach LOS values are based on average delay for all vehicle movements.
NA: Intersection LOS and Major Road Approach LOS values are Not Applicable for two-way sign control since the average delay is not a good LOS measure due to zero delays associated with major road movements.
SIDRA Standard Delay Model is used. Control Delay includes Geometric Delay.
Gap-Acceptance Capacity: SIDRA Standard (Akçelik M3D).
HV (%) values are calculated for All Movement Classes of All Heavy Vehicle Model Designation.
Processed: Monday, 25 August 2014 11:52:01SIDRA INTERSECTION 6.0.22.4722
Copyright © 2000-2014 Akcelik and Associates Pty Ltdwww.sidrasolutions.com
Project: O:\ha_civ\231695 hamilton expressway\Secondary Investigation and SARA\Scheme Design\Transportation\AEE traffic\Ruakura Alteration- 2014\AEE report July14\assessment\Old Ruakura Rd Tee_mpm.sip68000051, OPUS INTERNATIONAL CONSULTANTS, NETWORK / Enterprise

MOVEMENT SUMMARY
Site: 2021 PM base
Relocated Ruakura Rd/Holland RdNet 35 flowsGiveway / Yield (Two-Way)
Movement Performance - Vehicles
Demand Flows 95% Back of QueueMovID
ODMov
Deg.Satn
AverageDelay
Level ofService
Prop. Queued
Effective Stop Rate
AverageSpeed Total HV Vehicles Distance
veh/h % v/c sec veh m per veh km/hEast: Existing Ruakura Rd
5 T1 61 1.7 0.031 0.0 LOS A 0.0 0.0 0.00 0.00 80.0
6 R2 4 0.0 0.004 8.0 LOS A 0.0 0.1 0.39 0.60 63.6
Approach 65 1.6 0.031 0.5 NA 0.0 0.1 0.03 0.04 78.7
North: Holland Rd
7 L2 3 0.0 0.153 9.2 LOS A 0.6 4.4 0.43 0.69 63.0
9 R2 114 0.9 0.153 9.1 LOS A 0.6 4.4 0.43 0.69 62.5
Approach 117 0.9 0.153 9.1 LOS A 0.6 4.4 0.43 0.69 62.5
West: Relocated Ruakura Rd
10 L2 235 0.4 0.125 7.0 LOS A 0.0 0.0 0.00 0.63 65.2
11 T1 108 1.0 0.055 0.0 LOS A 0.0 0.0 0.00 0.00 80.0
Approach 343 0.6 0.125 4.8 NA 0.0 0.0 0.00 0.43 69.2
All Vehicles 525 0.8 0.153 5.2 NA 0.6 4.4 0.10 0.44 68.6
Level of Service (LOS) Method: Delay (HCM 2000).
Vehicle movement LOS values are based on average delay per movement
Minor Road Approach LOS values are based on average delay for all vehicle movements.
NA: Intersection LOS and Major Road Approach LOS values are Not Applicable for two-way sign control since the average delay is not a good LOS measure due to zero delays associated with major road movements.
SIDRA Standard Delay Model is used. Control Delay includes Geometric Delay.
Gap-Acceptance Capacity: SIDRA Standard (Akçelik M3D).
HV (%) values are calculated for All Movement Classes of All Heavy Vehicle Model Designation.
Processed: Monday, 25 August 2014 11:52:02SIDRA INTERSECTION 6.0.22.4722
Copyright © 2000-2014 Akcelik and Associates Pty Ltdwww.sidrasolutions.com
Project: O:\ha_civ\231695 hamilton expressway\Secondary Investigation and SARA\Scheme Design\Transportation\AEE traffic\Ruakura Alteration- 2014\AEE report July14\assessment\Old Ruakura Rd Tee_mpm.sip68000051, OPUS INTERNATIONAL CONSULTANTS, NETWORK / Enterprise

SITE LAYOUT
Site: 2041 AM base
Relocated Ruakura Rd/Existing Ruakura Rd (from Holland Rd)Net 35 flowsGiveway / Yield (Two-Way)
Created: Thursday, 28 August 2014 08:55:50SIDRA INTERSECTION 6.0.22.4722
Copyright © 2000-2014 Akcelik and Associates Pty Ltdwww.sidrasolutions.com
Project: O:\ha_civ\231695 hamilton expressway\Secondary Investigation and SARA\Scheme Design\Transportation\AEE traffic\Ruakura Alteration- 2014\AEE report July14\assessment\Old Ruakura Rd Tee_mpm.sip68000051, OPUS INTERNATIONAL CONSULTANTS, NETWORK / Enterprise
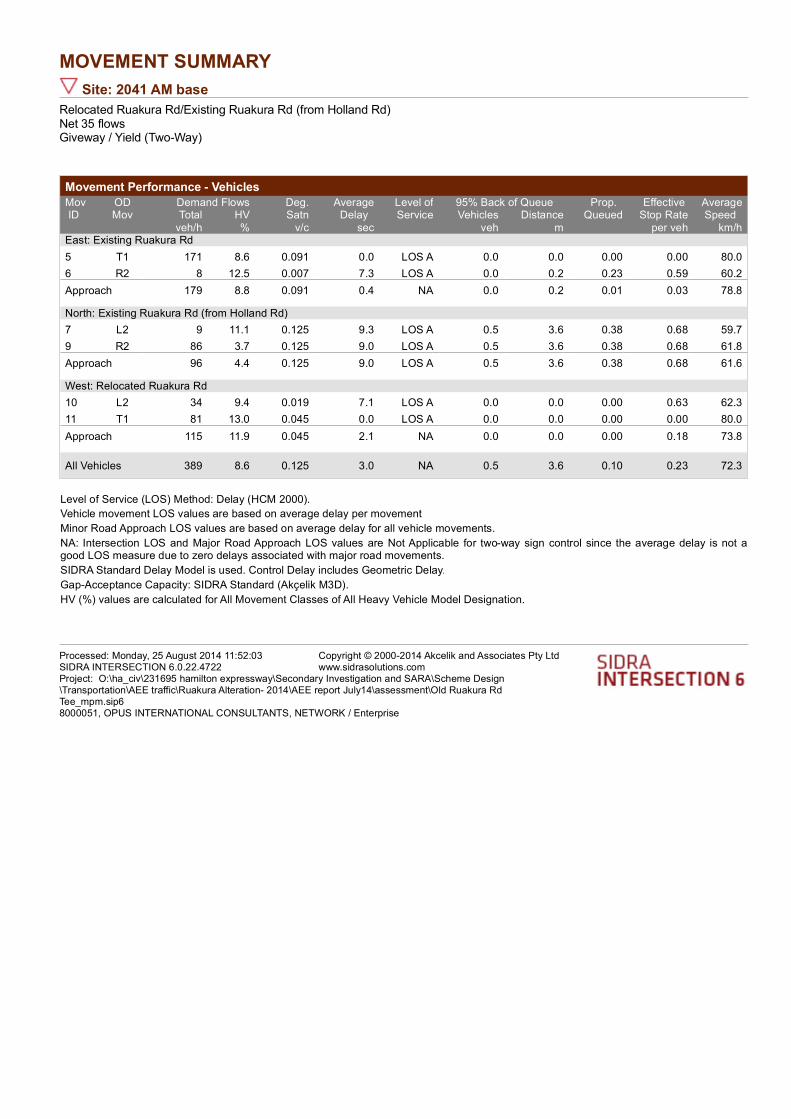
MOVEMENT SUMMARY
Site: 2041 AM base
Relocated Ruakura Rd/Existing Ruakura Rd (from Holland Rd)Net 35 flowsGiveway / Yield (Two-Way)
Movement Performance - Vehicles
Demand Flows 95% Back of QueueMovID
ODMov
Deg.Satn
AverageDelay
Level ofService
Prop. Queued
Effective Stop Rate
AverageSpeed Total HV Vehicles Distance
veh/h % v/c sec veh m per veh km/hEast: Existing Ruakura Rd
5 T1 171 8.6 0.091 0.0 LOS A 0.0 0.0 0.00 0.00 80.0
6 R2 8 12.5 0.007 7.3 LOS A 0.0 0.2 0.23 0.59 60.2
Approach 179 8.8 0.091 0.4 NA 0.0 0.2 0.01 0.03 78.8
North: Existing Ruakura Rd (from Holland Rd)
7 L2 9 11.1 0.125 9.3 LOS A 0.5 3.6 0.38 0.68 59.7
9 R2 86 3.7 0.125 9.0 LOS A 0.5 3.6 0.38 0.68 61.8
Approach 96 4.4 0.125 9.0 LOS A 0.5 3.6 0.38 0.68 61.6
West: Relocated Ruakura Rd
10 L2 34 9.4 0.019 7.1 LOS A 0.0 0.0 0.00 0.63 62.3
11 T1 81 13.0 0.045 0.0 LOS A 0.0 0.0 0.00 0.00 80.0
Approach 115 11.9 0.045 2.1 NA 0.0 0.0 0.00 0.18 73.8
All Vehicles 389 8.6 0.125 3.0 NA 0.5 3.6 0.10 0.23 72.3
Level of Service (LOS) Method: Delay (HCM 2000).
Vehicle movement LOS values are based on average delay per movement
Minor Road Approach LOS values are based on average delay for all vehicle movements.
NA: Intersection LOS and Major Road Approach LOS values are Not Applicable for two-way sign control since the average delay is not a good LOS measure due to zero delays associated with major road movements.
SIDRA Standard Delay Model is used. Control Delay includes Geometric Delay.
Gap-Acceptance Capacity: SIDRA Standard (Akçelik M3D).
HV (%) values are calculated for All Movement Classes of All Heavy Vehicle Model Designation.
Processed: Monday, 25 August 2014 11:52:03SIDRA INTERSECTION 6.0.22.4722
Copyright © 2000-2014 Akcelik and Associates Pty Ltdwww.sidrasolutions.com
Project: O:\ha_civ\231695 hamilton expressway\Secondary Investigation and SARA\Scheme Design\Transportation\AEE traffic\Ruakura Alteration- 2014\AEE report July14\assessment\Old Ruakura Rd Tee_mpm.sip68000051, OPUS INTERNATIONAL CONSULTANTS, NETWORK / Enterprise
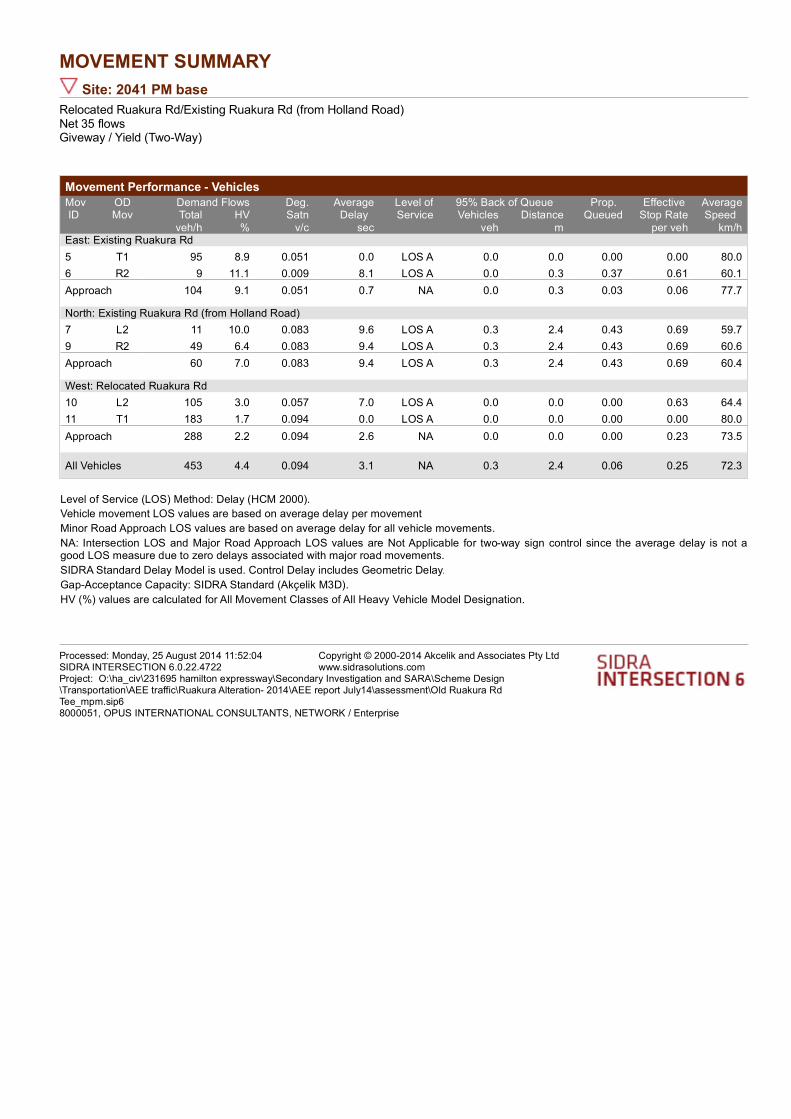
MOVEMENT SUMMARY
Site: 2041 PM base
Relocated Ruakura Rd/Existing Ruakura Rd (from Holland Road)Net 35 flowsGiveway / Yield (Two-Way)
Movement Performance - Vehicles
Demand Flows 95% Back of QueueMovID
ODMov
Deg.Satn
AverageDelay
Level ofService
Prop. Queued
Effective Stop Rate
AverageSpeed Total HV Vehicles Distance
veh/h % v/c sec veh m per veh km/hEast: Existing Ruakura Rd
5 T1 95 8.9 0.051 0.0 LOS A 0.0 0.0 0.00 0.00 80.0
6 R2 9 11.1 0.009 8.1 LOS A 0.0 0.3 0.37 0.61 60.1
Approach 104 9.1 0.051 0.7 NA 0.0 0.3 0.03 0.06 77.7
North: Existing Ruakura Rd (from Holland Road)
7 L2 11 10.0 0.083 9.6 LOS A 0.3 2.4 0.43 0.69 59.7
9 R2 49 6.4 0.083 9.4 LOS A 0.3 2.4 0.43 0.69 60.6
Approach 60 7.0 0.083 9.4 LOS A 0.3 2.4 0.43 0.69 60.4
West: Relocated Ruakura Rd
10 L2 105 3.0 0.057 7.0 LOS A 0.0 0.0 0.00 0.63 64.4
11 T1 183 1.7 0.094 0.0 LOS A 0.0 0.0 0.00 0.00 80.0
Approach 288 2.2 0.094 2.6 NA 0.0 0.0 0.00 0.23 73.5
All Vehicles 453 4.4 0.094 3.1 NA 0.3 2.4 0.06 0.25 72.3
Level of Service (LOS) Method: Delay (HCM 2000).
Vehicle movement LOS values are based on average delay per movement
Minor Road Approach LOS values are based on average delay for all vehicle movements.
NA: Intersection LOS and Major Road Approach LOS values are Not Applicable for two-way sign control since the average delay is not a good LOS measure due to zero delays associated with major road movements.
SIDRA Standard Delay Model is used. Control Delay includes Geometric Delay.
Gap-Acceptance Capacity: SIDRA Standard (Akçelik M3D).
HV (%) values are calculated for All Movement Classes of All Heavy Vehicle Model Designation.
Processed: Monday, 25 August 2014 11:52:04SIDRA INTERSECTION 6.0.22.4722
Copyright © 2000-2014 Akcelik and Associates Pty Ltdwww.sidrasolutions.com
Project: O:\ha_civ\231695 hamilton expressway\Secondary Investigation and SARA\Scheme Design\Transportation\AEE traffic\Ruakura Alteration- 2014\AEE report July14\assessment\Old Ruakura Rd Tee_mpm.sip68000051, OPUS INTERNATIONAL CONSULTANTS, NETWORK / Enterprise

SITE LAYOUT
Site: 2021 AM scheme
Relocated Ruakura Rd/Existing Ruakura Rd (from Holland Road)Net 35 flowsGiveway / Yield (Two-Way)
Created: Thursday, 28 August 2014 08:55:55SIDRA INTERSECTION 6.0.22.4722
Copyright © 2000-2014 Akcelik and Associates Pty Ltdwww.sidrasolutions.com
Project: O:\ha_civ\231695 hamilton expressway\Secondary Investigation and SARA\Scheme Design\Transportation\AEE traffic\Ruakura Alteration- 2014\AEE report July14\assessment\Old Ruakura Rd Tee_mpm.sip68000051, OPUS INTERNATIONAL CONSULTANTS, NETWORK / Enterprise

MOVEMENT SUMMARY
Site: 2021 AM scheme
Relocated Ruakura Rd/Existing Ruakura Rd (from Holland Road)Net 35 flowsGiveway / Yield (Two-Way)
Movement Performance - Vehicles
Demand Flows 95% Back of QueueMovID
ODMov
Deg.Satn
AverageDelay
Level ofService
Prop. Queued
Effective Stop Rate
AverageSpeed Total HV Vehicles Distance
veh/h % v/c sec veh m per veh km/hEast: Existing Ruakura Rd
5 T1 259 11.0 0.141 0.0 LOS A 0.0 0.0 0.00 0.00 80.0
6 R2 7 0.0 0.006 7.5 LOS A 0.0 0.2 0.32 0.59 63.9
Approach 266 10.7 0.141 0.2 NA 0.0 0.2 0.01 0.02 79.4
North: Existing Ruakura Rd (from Holland Rd)
7 L2 9 0.0 0.150 11.1 LOS B 0.6 4.1 0.53 0.79 60.9
9 R2 79 1.3 0.150 11.0 LOS B 0.6 4.1 0.53 0.79 60.4
Approach 88 1.2 0.150 11.0 LOS B 0.6 4.1 0.53 0.79 60.4
West: Relocated Ruakura Rd
10 L2 27 3.8 0.015 7.0 LOS A 0.0 0.0 0.00 0.63 64.1
11 T1 192 15.9 0.107 0.0 LOS A 0.0 0.0 0.00 0.00 80.0
Approach 219 14.4 0.107 0.9 NA 0.0 0.0 0.00 0.08 77.6
All Vehicles 574 10.6 0.150 2.1 NA 0.6 4.1 0.09 0.16 75.1
Level of Service (LOS) Method: Delay (HCM 2000).
Vehicle movement LOS values are based on average delay per movement
Minor Road Approach LOS values are based on average delay for all vehicle movements.
NA: Intersection LOS and Major Road Approach LOS values are Not Applicable for two-way sign control since the average delay is not a good LOS measure due to zero delays associated with major road movements.
SIDRA Standard Delay Model is used. Control Delay includes Geometric Delay.
Gap-Acceptance Capacity: SIDRA Standard (Akçelik M3D).
HV (%) values are calculated for All Movement Classes of All Heavy Vehicle Model Designation.
Processed: Monday, 25 August 2014 11:52:05SIDRA INTERSECTION 6.0.22.4722
Copyright © 2000-2014 Akcelik and Associates Pty Ltdwww.sidrasolutions.com
Project: O:\ha_civ\231695 hamilton expressway\Secondary Investigation and SARA\Scheme Design\Transportation\AEE traffic\Ruakura Alteration- 2014\AEE report July14\assessment\Old Ruakura Rd Tee_mpm.sip68000051, OPUS INTERNATIONAL CONSULTANTS, NETWORK / Enterprise

MOVEMENT SUMMARY
Site: 2021 PM scheme
Relocated Ruakura Rd/Existing Ruakura Rd (from Holland Road)Net 35 flowsGiveway / Yield (Two-Way)
Movement Performance - Vehicles
Demand Flows 95% Back of QueueMovID
ODMov
Deg.Satn
AverageDelay
Level ofService
Prop. Queued
Effective Stop Rate
AverageSpeed Total HV Vehicles Distance
veh/h % v/c sec veh m per veh km/hEast: Existing Ruakura Rd
5 T1 208 12.1 0.114 0.0 LOS A 0.0 0.0 0.00 0.00 80.0
6 R2 12 0.0 0.012 8.2 LOS A 0.0 0.3 0.42 0.63 63.5
Approach 220 11.5 0.114 0.4 NA 0.0 0.3 0.02 0.03 78.9
North: Existing Ruakura Rd (from Holland Rd)
7 L2 8 0.0 0.100 11.6 LOS B 0.4 2.6 0.54 0.79 60.5
9 R2 46 2.3 0.100 11.5 LOS B 0.4 2.6 0.54 0.79 59.6
Approach 55 1.9 0.100 11.5 LOS B 0.4 2.6 0.54 0.79 59.8
West: Relocated Ruakura Rd
10 L2 89 1.2 0.048 7.0 LOS A 0.0 0.0 0.00 0.63 65.0
11 T1 275 9.2 0.148 0.0 LOS A 0.0 0.0 0.00 0.00 79.9
Approach 364 7.2 0.148 1.7 NA 0.0 0.0 0.00 0.15 75.7
All Vehicles 639 8.2 0.148 2.1 NA 0.4 2.6 0.05 0.17 75.0
Level of Service (LOS) Method: Delay (HCM 2000).
Vehicle movement LOS values are based on average delay per movement
Minor Road Approach LOS values are based on average delay for all vehicle movements.
NA: Intersection LOS and Major Road Approach LOS values are Not Applicable for two-way sign control since the average delay is not a good LOS measure due to zero delays associated with major road movements.
SIDRA Standard Delay Model is used. Control Delay includes Geometric Delay.
Gap-Acceptance Capacity: SIDRA Standard (Akçelik M3D).
HV (%) values are calculated for All Movement Classes of All Heavy Vehicle Model Designation.
Processed: Monday, 25 August 2014 11:52:06SIDRA INTERSECTION 6.0.22.4722
Copyright © 2000-2014 Akcelik and Associates Pty Ltdwww.sidrasolutions.com
Project: O:\ha_civ\231695 hamilton expressway\Secondary Investigation and SARA\Scheme Design\Transportation\AEE traffic\Ruakura Alteration- 2014\AEE report July14\assessment\Old Ruakura Rd Tee_mpm.sip68000051, OPUS INTERNATIONAL CONSULTANTS, NETWORK / Enterprise

SITE LAYOUT
Site: 2041 AM scheme
Relocated Ruakura Rd/Existing Ruakura Rd (from Holland Road)Net 36 flowsGiveway / Yield (Two-Way)
Created: Thursday, 28 August 2014 08:55:59SIDRA INTERSECTION 6.0.22.4722
Copyright © 2000-2014 Akcelik and Associates Pty Ltdwww.sidrasolutions.com
Project: O:\ha_civ\231695 hamilton expressway\Secondary Investigation and SARA\Scheme Design\Transportation\AEE traffic\Ruakura Alteration- 2014\AEE report July14\assessment\Old Ruakura Rd Tee_mpm.sip68000051, OPUS INTERNATIONAL CONSULTANTS, NETWORK / Enterprise

MOVEMENT SUMMARY
Site: 2041 AM scheme
Relocated Ruakura Rd/Existing Ruakura Rd (from Holland Road)Net 36 flowsGiveway / Yield (Two-Way)
Movement Performance - Vehicles
Demand Flows 95% Back of QueueMovID
ODMov
Deg.Satn
AverageDelay
Level ofService
Prop. Queued
Effective Stop Rate
AverageSpeed Total HV Vehicles Distance
veh/h % v/c sec veh m per veh km/hEast: Existing Ruakura Rd
5 T1 259 8.5 0.139 0.0 LOS A 0.0 0.0 0.00 0.00 80.0
6 R2 12 9.1 0.011 7.9 LOS A 0.0 0.3 0.35 0.61 60.8
Approach 271 8.6 0.139 0.4 NA 0.0 0.3 0.01 0.03 78.9
North: Existing Ruakura Rd (from Holland Road)
7 L2 13 8.3 0.172 11.7 LOS B 0.7 4.8 0.54 0.80 58.2
9 R2 84 3.8 0.172 11.5 LOS B 0.7 4.8 0.54 0.80 59.3
Approach 97 4.3 0.172 11.5 LOS B 0.7 4.8 0.54 0.80 59.1
West: Relocated Ruakura Rd
10 L2 35 9.1 0.020 7.1 LOS A 0.0 0.0 0.00 0.63 62.4
11 T1 214 10.3 0.116 0.0 LOS A 0.0 0.0 0.00 0.00 80.0
Approach 248 10.2 0.116 1.0 NA 0.0 0.0 0.00 0.09 76.9
All Vehicles 616 8.5 0.172 2.4 NA 0.7 4.8 0.09 0.17 74.2
Level of Service (LOS) Method: Delay (HCM 2000).
Vehicle movement LOS values are based on average delay per movement
Minor Road Approach LOS values are based on average delay for all vehicle movements.
NA: Intersection LOS and Major Road Approach LOS values are Not Applicable for two-way sign control since the average delay is not a good LOS measure due to zero delays associated with major road movements.
SIDRA Standard Delay Model is used. Control Delay includes Geometric Delay.
Gap-Acceptance Capacity: SIDRA Standard (Akçelik M3D).
HV (%) values are calculated for All Movement Classes of All Heavy Vehicle Model Designation.
Processed: Monday, 25 August 2014 11:52:07SIDRA INTERSECTION 6.0.22.4722
Copyright © 2000-2014 Akcelik and Associates Pty Ltdwww.sidrasolutions.com
Project: O:\ha_civ\231695 hamilton expressway\Secondary Investigation and SARA\Scheme Design\Transportation\AEE traffic\Ruakura Alteration- 2014\AEE report July14\assessment\Old Ruakura Rd Tee_mpm.sip68000051, OPUS INTERNATIONAL CONSULTANTS, NETWORK / Enterprise

MOVEMENT SUMMARY
Site: 2041 PM scheme
Relocated Ruakura Rd/Existing Ruakura Rd (from Holland Road)Net 36 flowsGiveway / Yield (Two-Way)
Movement Performance - Vehicles
Demand Flows 95% Back of QueueMovID
ODMov
Deg.Satn
AverageDelay
Level ofService
Prop. Queued
Effective Stop Rate
AverageSpeed Total HV Vehicles Distance
veh/h % v/c sec veh m per veh km/hEast: Existing Ruakura Rd
5 T1 200 8.9 0.107 0.0 LOS A 0.0 0.0 0.00 0.00 80.0
6 R2 15 7.1 0.016 8.6 LOS A 0.1 0.5 0.44 0.65 60.9
Approach 215 8.8 0.107 0.6 NA 0.1 0.5 0.03 0.04 78.3
North: Existing Ruakura Rd (from Holland Road)
7 L2 4 25.0 0.112 12.8 LOS B 0.4 3.1 0.57 0.82 53.3
9 R2 52 6.1 0.112 12.3 LOS B 0.4 3.1 0.57 0.82 57.9
Approach 56 7.5 0.112 12.3 LOS B 0.4 3.1 0.57 0.82 57.5
West: Relocated Ruakura Rd
10 L2 96 3.3 0.052 7.0 LOS A 0.0 0.0 0.00 0.63 64.3
11 T1 292 6.1 0.154 0.0 LOS A 0.0 0.0 0.00 0.00 79.9
Approach 387 5.4 0.154 1.7 NA 0.0 0.0 0.00 0.16 75.4
All Vehicles 658 6.7 0.154 2.3 NA 0.4 3.1 0.06 0.18 74.3
Level of Service (LOS) Method: Delay (HCM 2000).
Vehicle movement LOS values are based on average delay per movement
Minor Road Approach LOS values are based on average delay for all vehicle movements.
NA: Intersection LOS and Major Road Approach LOS values are Not Applicable for two-way sign control since the average delay is not a good LOS measure due to zero delays associated with major road movements.
SIDRA Standard Delay Model is used. Control Delay includes Geometric Delay.
Gap-Acceptance Capacity: SIDRA Standard (Akçelik M3D).
HV (%) values are calculated for All Movement Classes of All Heavy Vehicle Model Designation.
Processed: Monday, 25 August 2014 11:52:08SIDRA INTERSECTION 6.0.22.4722
Copyright © 2000-2014 Akcelik and Associates Pty Ltdwww.sidrasolutions.com
Project: O:\ha_civ\231695 hamilton expressway\Secondary Investigation and SARA\Scheme Design\Transportation\AEE traffic\Ruakura Alteration- 2014\AEE report July14\assessment\Old Ruakura Rd Tee_mpm.sip68000051, OPUS INTERNATIONAL CONSULTANTS, NETWORK / Enterprise

(This page has been intentionally left blank)

Ruakura Interchange – Assessment of Traffic Effects 39
2-31695.00 | 25 August 2014 Opus International Consultants Ltd
Opus International Consultants Ltd Opus House, Princes Street Private Bag 3057, Waikato Mail Centre, Hamilton 3240 New Zealand t: +64 7 838 9344 f: +64 7 838 9324 w: www.opus.co.nz