Trading Apparel: Developing Countries in 2005
26
Trading Apparel: Developing Countries in 2005 Soamiely Andriamananjara * Judith Dean * and Dean Spinanger ** Abstract This paper estimates the determinants of the shares of various developing countries in total U.S. apparel imports. We make use of two new sources of data: new export tax-equivalent estimates of the QRs under the ATC and qualitative information from surveys of major exporting firms. The export tax-equivalents are estimated using license prices from nine developing countries. The firm data was collected from 14 major textile, clothing and trading companies located in Hong Kong but operating throughout Asia. They capture the importance of factors influencing sourcing decisions. While we find that the degree of restraint imposed by the quotas is an important influence in a supplier’s market share, other factors including production costs, tariffs, quality of infrastructure, and transport costs also play major roles. Keywords: ATC, MFA, TEXTILES, CLOTHING, LIBERALIZATION, QUOTAS, May 2004 * Office of Economics, U.S. International Trade Commission, 500 E Street SW, Washington, DC 20436, USA. E- mails: [email protected] and [email protected] . The views and conclusions expressed in this paper are those of the authors alone, and should not be in any way attributed to the U.S. International Trade Commission as a whole or to any individual Commissioner. ** Kiel Institute of World Economics, 24100 Kiel, Germany, E-mail: [email protected]
Transcript of Trading Apparel: Developing Countries in 2005
Trading Apparel: Developing Countries in 2005
Soamiely Andriamananjara*
Judith Dean*
and
Dean Spinanger**
Abstract This paper estimates the determinants of the shares of various developing countries in total U.S. apparel imports. We make use of two new sources of data: new export tax-equivalent estimates of the QRs under the ATC and qualitative information from surveys of major exporting firms. The export tax-equivalents are estimated using license prices from nine developing countries. The firm data was collected from 14 major textile, clothing and trading companies located in Hong Kong but operating throughout Asia. They capture the importance of factors influencing sourcing decisions. While we find that the degree of restraint imposed by the quotas is an important influence in a supplier’s market share, other factors including production costs, tariffs, quality of infrastructure, and transport costs also play major roles.
Keywords: ATC, MFA, TEXTILES, CLOTHING, LIBERALIZATION, QUOTAS,
May 2004
* Office of Economics, U.S. International Trade Commission, 500 E Street SW, Washington, DC 20436, USA. E-mails: [email protected] and [email protected]. The views and conclusions expressed in this paper are those of the authors alone, and should not be in any way attributed to the U.S. International Trade Commission as a whole or to any individual Commissioner. ** Kiel Institute of World Economics, 24100 Kiel, Germany, E-mail: [email protected]

1
Trading Apparel: Developing Countries in 2005
1. Introduction
According to the Agreement on Textiles and Clothing (ATC), the U.S., Canadian, and EU
quantitative restrictions (QRs) on textiles and apparel imports are to be phased out by January 1, 2005.
How will this phaseout affect developing country exporters? Although the elimination of MFA quotas is
predicted to result in an increase in global trade, the impact is likely to differ among countries and
regions.1 For each individual country, quota elimination represents both an opportunity and a threat: an
opportunity because markets will no longer be restricted and a threat because other suppliers will no
longer be restrained and major markets will be open to intense competition (Kathuria and Bhardwaj,
1998, Yang and Mlachila 2004). In much of the popular press, China is expected to win most of the
newly freed market to the detriment of other developing country exporters.
A few early econometric studies suggest that the QRs under the MFA significantly distorted the
pattern of exports across developing countries. Thus, we might anticipate that countries which are highly
restricted now, will gain relatively larger shares in 2005. Dean (1990) showed evidence that the QRs
under MFA I, II, and III were indeed binding on exporting countries, even though some quotas showed
low utilization rates. Dean (1995) showed that the expanson of the MFA restraint system targeted small
exporters with rapid growth in sales to the U.S., thus limiting their ability to expand import shares.
Spinanger (1999) found evidence that EU textile and apparel restraints have inhibited expected
diversification of the market across exporting countries based on relative cost. However, EU and U.S.
regional agreements have also distorted the pattern of exports, leading to unusually high import shares for
some European or Mediterranean countries in the EU market, and to Mexico in the U.S. market.
Recent simulation studies have predicted that ASEAN and South Asian countries and China are
likely to experience the largest exports expansions, while Hong Kong, Taiwan and South Korea, as well
as Latin American and African countries will likely see relatively small expansions (and possibly
reductions) in exports.2 While the degree of restraint imposed by the MultiFibre Agreement (MFA)
quotas is important in determining the extent of the impact of their removal on world trade patterns, other
1 For instance, Diao and Somwaru (2001) estimate that over the 25-year period following the ATC implementation, the annual growth of world textile and apparel trade would be more than 5 percent faster than in the absence of the ATC. According to their simulations, this acceleration translates into about $20 billion more trade in the short run (upon implementation) and as much as $200 billion in the long run (25 years). Similar results are reported by Avisse and Fouquin (2001), who find that, as a result of the ATC, the global trade in textiles and apparel would be about 10 percent and 14 percent higher, respectively. 2 See for example, Avisse and Fouquin (2001).Diao and Somwaru (2001), and Terra (2001).
2
(competitiveness) factors such as political stability, infrastructure, or labor quality are also likely to be
very influential in the post-2005 market position of different exporters.3
This paper estimates econometrically the determinants of a developing country's share of U.S.
imports of apparel products. It is structured as follows. In section 2, we provide a brief characterization
of the textiles and apparel quota system, and quantify their restrictiveness using license prices compiled
for nine major suppliers. Section 3 discusses a number of non-quota factors that are important in
influencing the patterns of textiles and apparel trade, and location and sourcing decisions. It presents
qualitative data from surveys of 14 major textile, clothing and trading companies located in Hong Kong
but operating throughout Asia. They capture the importance of factors influencing investment as well as
sourcing decisions.
Section 4 sets up a structural model that yields an econometric specification for testing the
relationship between a supplier’s share of the U.S. import market for apparel, and the degree of
restrictiveness of the quotas as well as other non-quota factors. Section 5 presents the data and the
estimation techniques used to test the relationships derived in the previous section. Section 6 discusses
the results, and section 7 concludes with a few policy implications of the paper’s findings.
2. Quotas on textiles and apparel
In 2002, the United States had quantitative restraints on textiles and apparel imports from 45
suppliers, which accounted for almost 80 percent of the total U.S. imports of such goods (see table 1).
Because the restraints are administered in the form of Avoluntary@ export restraints (VERs), they affect the
market in a unique way.4 VERs are discriminatory, i.e., they are imposed on some countries and not on
others. Thus, unrestrained exporters can still undercut a restrained exporter, and capture its market share.
VERs are also bilaterally negotiated. Thus, the particular products restrained, and the severity of the
restraints vary across exporting countries. Lastly, VERs are supply-side restraints, i.e. they are
implemented by the exporting country. Exporting country governments typically restrain the export of a
product to the United States by issuing licenses to their exporters, such that total exports of each product
are less than or equal to the quota allocated to that country for that product. Hence, the restraints in
textiles and apparel are also commonly referred to as bilateral quotas, or simply quotas (though they are
distinct from import quotas).
3 USITC (2004) provides a detailed assessment of the competitiveness of different supplier of textile and apparel products to the U.S. market. 4 The U.S., European, and Canadian VERs in textiles and apparel have long been a standard textbook example. As is well known, they are not voluntary. They are imposed at the request of the importing country, and agreed to by the exporting country to avoid the imposition of other types of trade barriers. For the seminal empirical study on this topic, see Hamilton (1986). For a more in-depth examination see Takacs (1978).

3
In 2002, twenty-eight out the 45 restrained suppliers had at least one quota category filled at 85
percent—a fill rate that could be considered binding. 5 As shown in table 1, the number of binding quota
categories vary greatly among those suppliers, with China and Indonesia having high fill rates for as
many as 58 and 38 quota categories, respectively.6 A casual look at the numbers in the table suggests
that larger suppliers (in terms of their share of total U.S. imports) tend to have more binding categories.
Simply counting the number of highly utilized quota categories, however, provides only a very
small fraction of the full story with respect to the actual restrictiveness of the quota system on a given
supplier. A binding quota effectively limits the supply to the U.S. market of a given product, making its
price higher in the United States than in the world market. Given the resulting price wedge, the limited
and scarce supply of quotas becomes valuable and economic rents (in the form of the ability to charge
higher prices) accrue to firms that have access to them. These quota rents can also be viewed as an
implicit tax on exports of textiles and apparel from restrained countries to the United States: in order to
export, a firm in a quota-constrained country has to obtain or buy the right to use the quota (or an export
license). Given that the quotas impose a cost on exporting firms that is analogous to an export tax, one
common way to measure their restrictiveness is to compute their export tax-equivalent (ETE). This
measures the degree to which the quota increases the export price (i.e., the price before entry into the U.S.
market).7
The most straightforward way to compute the ETEs is to use license price data which can be
reasonably assumed to capture the “value” of the quota or the exporter’s maximum willingness to pay for
the right to export a given commodity (identified at the MFA quota category).8 License prices could also
be thought as a broad measure of the cost gap between actual production costs and freight-on-board
5 A variety of threshholds have been used in the literature as denoting a binding constraint. The actual extent of utilization can be difficult to measure and quotas can be binding despite relatively low utilization rates. For further discussion of this issue, see USITC (2002), chapter 3. 6 In general, the literature reveals that Asian countries are relatively more constrained than other regions. Flanagan (2003) categorizes countries into groups depending on how “quota-constrained” they are in terms of the number of product categories where quotas seriously hold back demand. In the group of “Countries seriously held back, almost across the board, by quota today” are Bangladesh, China, Hong Kong, India, Indonesia, Pakistan, Philippines, Korea, Sri Lanka, and Thailand. At the other end of the spectrum, countries such as Nepal, Oman, Qatar, and United Arab Emirates (UAE) are categorized as “Countries whose quotas have been a valuable tool, now threatened.” According to Flanagan, China, India and Indonesia have shown the most consistent and widespread near-saturation of quotas for yarn, fabric, and garments. 7 See, for example, Francois and Spinanger (2002). 8 In addition to the prices of the license quotas themselves, the nature or the quality of the quota administration system can also restrict an individual country’s exports. Whalley (1999) points out that many developing countries have built costly domestic administrative structures around the internal allocation of MFA quotas. Krishna and Tan (1998) present empirical evidence that the costs of the export license system within the restrained countries are significant and that both the license cost as well as these hidden administrative costs are added to the price of the product prior to entering the foreign market. These extra inefficiency costs would also be eliminated when the quotas are removed which would likely intensify the estimated effects of the ATC.
4
(f.o.b.) prices in the U.S. market. In this paper, we collected actual license prices from a variety of
sources for nine suppliers. These countries (Bangladesh, Cambodia, China, Hong Kong, India, Indonesia,
Macau, Pakistan, and Taiwan) account for about 36 percent of total U.S. import of textiles and apparel,
and almost 50 percent of U.S. imports facing restrictive quotas. 9
The collected quota prices are often listed on a monthly basis, in the local currency, and in terms
of a quota category-specific unit (e.g., doz, kg., nos.). To obtain the export tax equivalents, we first
convert the 2002 quota prices for those suppliers to an annual U.S. dollar by Square Meter Equivalent
(SME) basis. For each apparel quota category (j) and each of the nine suppliers (i), we then approximate
the production costs (or, alternatively, supply price net of rent) (denoted ijPC ) as the difference between
the f.o.b export unit value of export to the U.S. market ( ijUV ) and the license price per unit ( Lij ):10
ijijij LUVPC −= .
The ETEs are then calculated, for 106 apparel quota categories and the nine suppliers with license prices,
simply as:
ijijij PCLe /= .
Given the high degree of heterogeneity in apparel product and apparel suppliers, the computed
ETEs vary greatly across suppliers as well as across quota categories. They are used as a determinant of a
country’s import market share in the econometric exercises we conduct in section 4. For illustrative
purpose, the weighted averages of the computed ETEs for the suppliers with available apparel and textiles
license prices are reported in table 2. Even at those highly aggregated sectors, the average ETEs still vary
considerably among the nine suppliers. For instance, the ETEs for apparel ranges from around 20 percent
for Bangladesh and China, to 0.7 percent for Taiwan. For the five countries with binding textile QRs, the
ETEs range from 18 percent for India to 1.4 percent for Taiwan.
9 Chinese license prices are from www.chinaquota.com. Those for India and Pakistan were from garments.indiaexcite.com and www.qsc.com.pk, respectively. Those for Bangladesh, Hong Kong, Indonesia, and Macau are listed on www.texwatch.com. Quota prices for Cambodia and Taiwan were collected from home.kimo.com.tw/ctquota/. 10 F.O.B. unit values, measured in 2002 U.S. dollars are used to proxy for price. They were calculated from U.S. import data provided by USDOC, Office of Textiles and Apparel (OTEXA), available on the internet at www.otexa.ita.doc.gov. The values and quantities of U.S. imports are reported on a “customs value” basis, and are equivalent to the f.o.b. designation for exports.

5
3. Other factors affecting market shares: Survey Results
While the degree of restrictiveness of the quotas is an important determinant of the like ly impact
of the removal of the MultiFibre Agreement (MFA) quotas on the patterns of trade, other factors may be
as or more important in determining the post-2005 market position of different exporters. To find out
what factors specifically affect trade and/or investment, two surveys were carried out among 14 major
T&C producers/traders in Hong Kong in January 2000, and February/March 2003 (Spinanger, Vamar,
2003).
The 14 companies approached were asked about the factors influencing their decisions to
purchase T&C products and/or establish production facilities in a given country. The companies had
activities in Hong Kong, China, throughout Asia and around the world. Some of them were major players,
others were medium-size businesses. In all cases, the individuals had senior positions in their firms--
most were owners, CEOs or managing directors. In other words, there are two sets of data reflecting
overall trade and investment conditions in 2000 and in 2003 as viewed by almost exactly the same
individuals. In all but one case were the individuals contacted in 2003 not the same as those in 2000.
In the survey, they were asked to estimate the relative importance of 18 factors determining
where they would buy/source clothes or invest in manufacturing facilities. The factors selected were those
usually found in the relevant literature and respondents were requested to give a "gut" reply to each factor
by responding with a number between "10" if a factor was totally and absolutely important, and "1"
if it was totally and absolutely unimportant. The questions asked referred to the factors shown in table
3 (numbered by importance of answers in 2000 and listed in line with average importance in 2000 and
2003).
The overall results of the two surveys are presented in Figures 1 (2000) and 2 (2003); Figure 3
contains an average of the two years.. They clearly portray a world which fits well into the picture of how
T&C companies react to quotas and what makes countries competitive. The information provided by the
answers to the questions is portrayed in the diagrams by plotting the average rankings (scores) given to
each question (on the vertical axis) against the coefficient of variation (on the horizontal axis). The
resulting downward sloping pattern reflects those questions with little variation in rankings between
companies (i.e., low coefficient of variation) and high average ranking values on the upper left side of the
diagram and those answers with a high variation (i.e., high coefficient of variation) on the bottom right,
but lower average ranking values on the left.
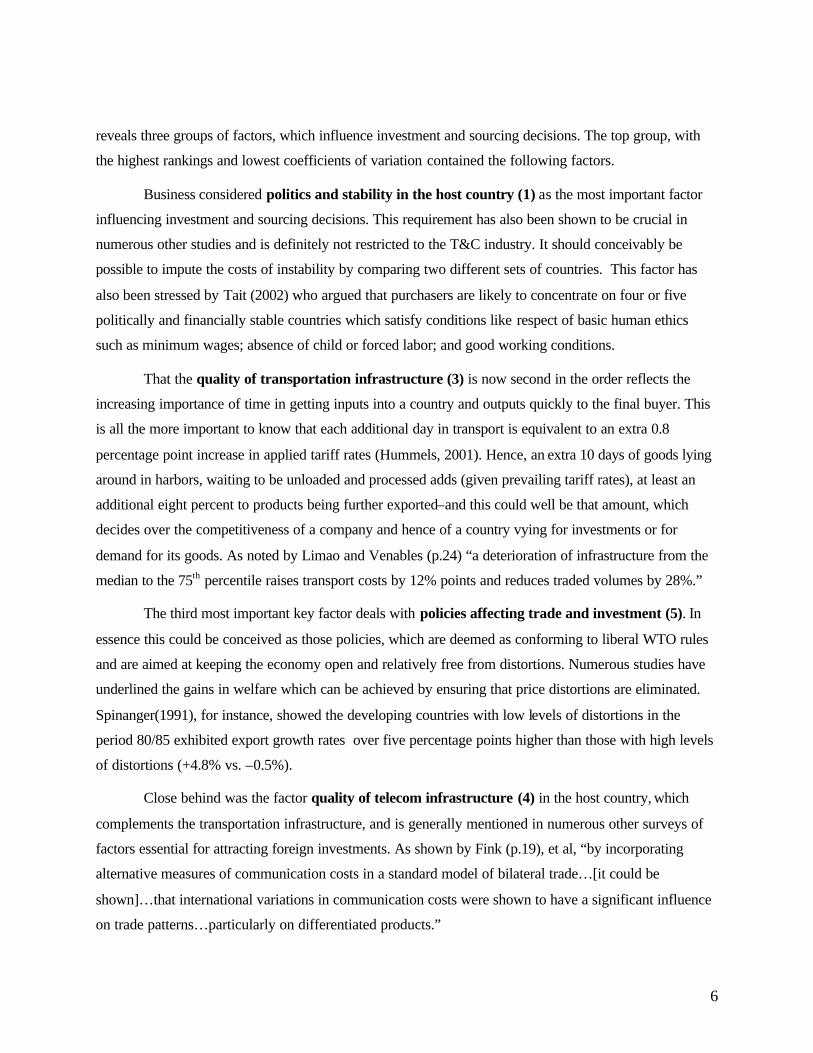
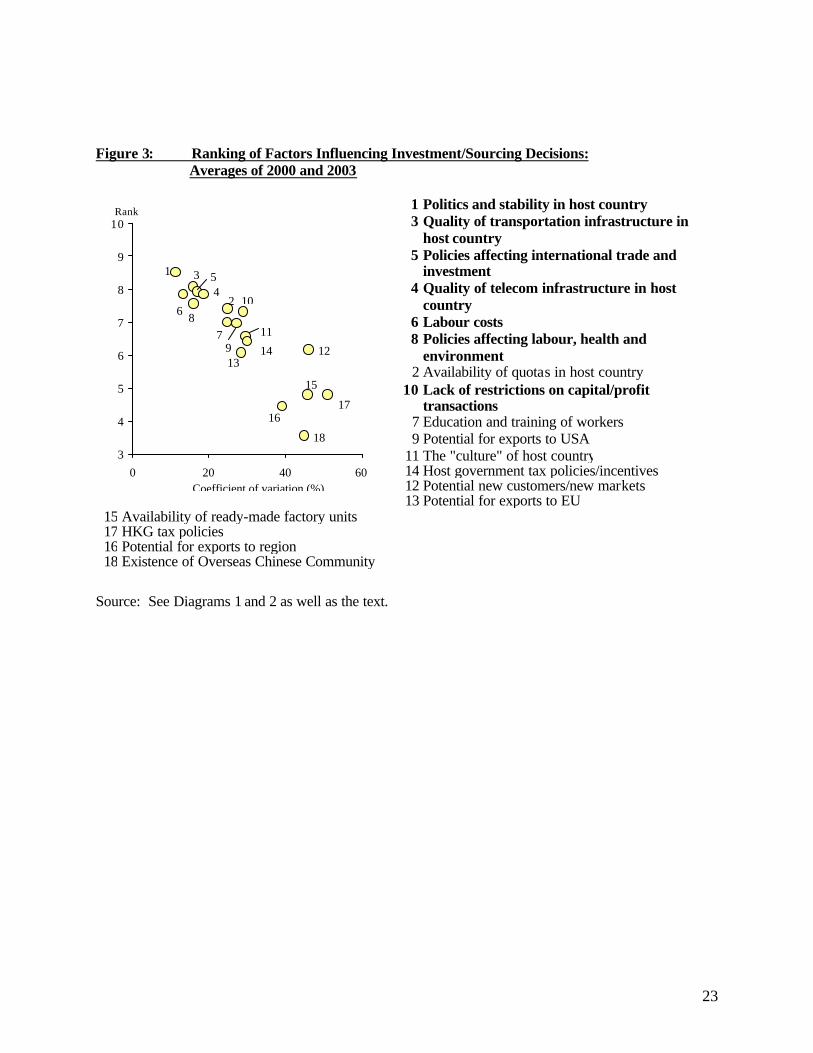
We want to focus on the questions that received the highest values and had the lowest degree of
variance. These are the essential factors shaping investment and sourcing decisions. Figure 3 clearly
6
reveals three groups of factors, which influence investment and sourcing decisions. The top group, with
the highest rankings and lowest coefficients of variation contained the following factors.
Business considered politics and stability in the host country (1) as the most important factor
influencing investment and sourcing decisions. This requirement has also been shown to be crucial in
numerous other studies and is definitely not restricted to the T&C industry. It should conceivably be
possible to impute the costs of instability by comparing two different sets of countries. This factor has
also been stressed by Tait (2002) who argued that purchasers are likely to concentrate on four or five
politically and financially stable countries which satisfy conditions like respect of basic human ethics
such as minimum wages; absence of child or forced labor; and good working conditions.
That the quality of transportation infrastructure (3) is now second in the order reflects the
increasing importance of time in getting inputs into a country and outputs quickly to the final buyer. This
is all the more important to know that each additional day in transport is equivalent to an extra 0.8
percentage point increase in applied tariff rates (Hummels, 2001). Hence, an extra 10 days of goods lying
around in harbors, waiting to be unloaded and processed adds (given prevailing tariff rates), at least an
additional eight percent to products being further exported–and this could well be that amount, which
decides over the competitiveness of a company and hence of a country vying for investments or for
demand for its goods. As noted by Limao and Venables (p.24) “a deterioration of infrastructure from the
median to the 75th percentile raises transport costs by 12% points and reduces traded volumes by 28%.”
The third most important key factor deals with policies affecting trade and investment (5). In
essence this could be conceived as those policies, which are deemed as conforming to liberal WTO rules
and are aimed at keeping the economy open and relatively free from distortions. Numerous studies have
underlined the gains in welfare which can be achieved by ensuring that price distortions are eliminated.
Spinanger(1991), for instance, showed the developing countries with low levels of distortions in the
period 80/85 exhibited export growth rates over five percentage points higher than those with high levels
of distortions (+4.8% vs. –0.5%).
Close behind was the factor quality of telecom infrastructure (4) in the host country, which
complements the transportation infrastructure, and is generally mentioned in numerous other surveys of
factors essential for attracting foreign investments. As shown by Fink (p.19), et al, “by incorporating
alternative measures of communication costs in a standard model of bilateral trade…[it could be
shown]…that international variations in communication costs were shown to have a significant influence
on trade patterns…particularly on differentiated products.”

7
The next factor – labor costs (6) – should be expected to be crucial in the case of such a labor-
intensive industry such as clothing. However, the fact that it is not given a higher rating points to
statements underlined by numerous interviewees, namely that in many cases higher labor costs can be
easily accepted if they are accordingly compensated for by other factors.
The next factor – policies affecting labor, health and environment (8) – has become more
important recently, particularly as a result of government and NGO controls to ensure that certain
standards are upheld. That this factor has become more important over time shows how well the survey
actually picked up activity of the NGOs, international organizations and the increased awareness of
corporations with respect to goverance.
The final factor in the top group--lack of restrictions on capital/profit transactions (10)--is
crucial if such ventures are to produce returns. With countries trying all the harder these days to solve
fiscal problems, it has become all the more essentia l to ensure that such barriers are dealt with openly and
up front.
Obviously availability of quotas (number 2) are not of importance in the year 2003, with their
elimination occurring at the end of 2004. Here again the survey correctly reflected the change in
conditions over the three year period. This lends credence to using the above information to analyse what
is actually going on out in the real world. Of the remaining factors, it can probably be contended that
factors 11 through 18 can be generally considered as not being highly relevant with respect to influencing
investment/sourcing decisions. It is particularly interesting to note that the existence of an Overseas
Chinese Community is not a relevant factor in influencing the choice of investment and sourcing
decisions. This is positive in particular for South Asian countries in the sense that it means that the
negligible presence of ethnic Chinese in the region do not hinder their chances in profiting from FDI or
sourcing contracts from Hong Kong Chinese.
4. Analytical model
The model presented here is a simple variant of the Krugman intra-industry trade model. The
differentiated-product features of the model makes it very useful and convenient in studying the import
shares of different apparel suppliers to the United States market. The model is characterized by
increasing returns and imperfect competition which are very attractive aspects given the importance of
scale economies in the clothing sector.
Demand Side
The social utility function in the United States is assumed to have the CES form:

8
(1) 1,][1
)1/(/)1( >= ∑=
−− σσσσσN
iiCU ,
where N is the number of varieties of the differentiated good (identified at the MFA quota category)
available to the consumer, Ci is the U.S. consumption of the i-th differentiated good and, σ is the
elasticity of substitution between any two varieties. For simplicity, it is assumed that each of the N
varieties is produced by a single firm in N different countries (i.e., there are N exporting country
suppliers).
Utility is maximized subject to the budget constraint, YCPN
iii =∑
=1
where Pi is the domestic price
i-th differentiated good, and Y is the U.S. national income. Utility maximization yields the U.S.’s demand
function for typical variety i which is given by:
(2) ∑=
−−− ==N
jj
ii PPY
PP
C1
/11 ])([,)( σσσ .
P can be thought of as an index of the U.S. price level for the differentiated good.
Supply Side
On the supply side, assume that a firm produces apparel or textile products using a composite
input denoted by li. For a typical variety i, the composite input requirement is given by:
(3) 0,, >+= iiiiii xl βαβα ,
where xi is the output of variety i, αi is a fixed cost necessary for any positive amount of production and,
βi denotes the input requirement per unit of output. The two technological parameters are assumed to vary
by country. In particular, one can think of βi as a productivity proxy for the different suppliers. Since it
was assumed that there is only one firm in each country producing a single variety, i can also be used to
denote both the product variety and the exporting country.
The total cost incurred by the producer in the i-th exporting country is therefore:
(4) iiiiii xWWTC ... βα += ,
where Wi is the wage rate (or rental rate for the composite input) in country i. In this application, Wi will
also be used to denote the general cost of doing business in a particular country. Due to the fixed cost, the
production technology exhibits increasing returns to scale.

9
As was discussed in section 2, an apparel firm in a quota-constrained country has to obtain or
buy the right to use the quota (or an export license) in order to be able to export to the United States.11
The MFA quota can thus be viewed as imposing an implicit tax on exports of textiles and apparel from
restrained countries to the United States. Accordingly, we assume that an exporter incurs an additional
cost of ei per unit of export. It should be noted that from another point of view, the limited and scarce
supply of export licenses can become very valuable and can significantly benefit firms with access to
them: exporters who have licenses to export the products to the United States are able to capture
economic rents by increasing the export prices of their products. In this model, this will be reflected by a
higher Pi. Given the cost of obtaining the quota, a typical (representative) manufacturer in country i, then,
maximizes its operating profit:
(5) iiiiii
iii xWW
retxP
...)1)(1)(1(
βα −−+++
=Π ,
where ti, ri are, respectively, the tariff rate and the transport cost facing country i’s firm when exporting to
the United States. As is common in the literature, it is assumed that there is a large number of
varieties/suppliers so that a firm considers σ to be the elasticity of demand that it faces (Helpman and
Krugman, 1985). The first order condition for the firm is given by:
(6) )1)(1)(1.(.)1
1.( iiiiii retWP +++=− βσ
.
Assuming that the supplier is small enough and cannot significantly affect the overall price index P in the
United States, the volume of apparel exported can be derived using equations (2) and (6):
(7) YP
retWx iiiii
iσ
σβσ −
−+++
= ))1(
)1)(1)(1.(.( ,
which can be characterized by 0<Wix , 0<tix , 0<rix , 0<eix , and 0>Pix , 0>Yix . That is,
supplier i’s production (and export to the United States) responds positively to U.S. national income and
U.S. price level, but negatively to production costs, quota costs, transport costs, and U.S. tariffs.
One can think of a situation in which the government agency that administer the quota allocation
system anticipates the firm’s response to the quota cost, and thus choose ei in such a way that xi = Q ,
where Q is the country’s total quota for exporting to the United States. One can easily derive the
resulting license price:
11 Note that even in countries where quotas are distributed without charge, the exporters must forgo the opportunity to sell the valuable quotas to other suppliers. This could also be viewed as an opportunity cost.

10
(8) .1))1)(1.(.
)1(( /1/1 −
++−
= − σσ
βσσ
QYrtW
Pe
iiiii
which has the following properties: 0<Wie , 0<tie , 0<rie , 0<Qie , and 0>Pie , 0>Yie . As
expected, the license price (or the export tax equivalent of the quota) is a negative function of the quota
level, the cost of production and transport, as well as the U.S. import tariffs. On the other hand, it is
positively related to U.S. national income and price level.
Market Share
The variable of interest for this application is the share of a given exporting country in the U.S.
import market. It is denoted by si and is defined as follow:
(9)
∑∑=
−
−
=
==N
jj
iN
jj
ii
P
P
C
Cs
11
σ
σ
.
One can then use (6) and rewrite si in function of the trading costs and the other characteristics of the
exporting countries:
(10) P
retWs iiiii
i ~)]1)(1)(1.(.[ σβ −+++
=
where ∑∑=
−
=
− +++==N
jjjjjj
N
jj retWPP
11
)]1)(1)(1.(.[~ σσ β , which represents a general average measure
of U.S. price for the given product (constant across suppliers). This expression is similar to that derived
by Winters and Breton (1993) in their study of the UK’s footwear VERs.
5. Data and estimation
Equation (10) , derived in the previous section, provides a specification for testing the impact of
the QRs and other qualitative factors on a country’s share of U.S. imports. For the purpose of our
econometric analysis, we manipulate it by taking logs and get a simple linear estimable equation:
)~
ln()1ln()1ln()1ln().ln()ln( 543211 PretWs iiiii ααααβαα ++++++++= (10)'
We collected data for nine countries (Bangladesh, Cambodia, China, Hong Kong, India, Indonesia,
Macau, Pakistan, and Taiwan) and for 106 apparel product categories (all cotton, wool, man-made and
silk MFA product categories) on share of U.S. imports in 2002. This yields a panel of 730 observations,
since some countries do not trade all products. We estimate (10)' using GLS, with a correction for cross-
section (groupwise) heteroskedasticity.

11
Table 4 shows the average values of the data (across all products) for the nine countries in our
sample. Import share is constructed from data on quantity of imports (in SMEs), obtained from the
OTEXA website (www.otexa.ita.doc.gov). Data from OTEXA is also used to construct an average unit
value for U.S. imports (customs value of imports/quantity of imports in SMEs) for each of the 106
product categories, from all sources. This is used to represent the average price of each apparel import in
the U.S. market. The U.S. statutory tariffs on apparel are available at the HS 8-digit level on the USITC
Trade Dataweb, in the Tariff Database (www.usitc.gov). A trade-weighted average statutory tariff for
each MFA category was derived, using a 2002 OTEXA concordance (HS 10-digit to MFA). Each
exporting country's production costs for each product were proxied by the difference between the unit
value (customs value of imports/quantity of imports in SMEs) and the license price.
Data on two measures related to transport costs were obtained from Veson Nautical
(http://apps.veson.com/distances/).12 This website allows calculation of the nautical miles between the
exporting and importing country ports, for various shipping routes. More important, it provides the
shipping time (in days). Thus, we are able to calculate the number of days it takes to ship products from
each of our nine countries to three ports in the United States, including days in the exporting port, days at
sea, and days in the importing country port. We chose to proxy transport costs (by country by product)
using two alternative measures: shipping days per dollar shipped (days/customs value) and shipping days
per unit shipped (days/quantity in SMEs), between the country of origin and Los Angeles.13
We were able to include several of the top 6 qualitative factors from the exporter survey in our
analysis. The Global Competitiveness Report (www.weforum.org/gcr) and the Economic Freedom of the
World report (http://www.freetheworld.com/release.html) ranked six of our nine countries (Bangladesh,
China, Hong Kong, India, Indonesia, and Taiwan) according to policies related to trade and investment,
policies affecting labor, health and environment, quality of transportation infrastructure and
telecommunications infrastructure, and restrictions on capital markets. (We expect to include an index of
overall political stability in future analyses.) The first four of these are rankings between 1 and 80 with 1
being best. The last is ranked on a scale of 1 to 10 with 10 being best. The underlying components of
these indices and raw data are included in Appendix A. Table 5 shows the values of the indices used in
our analysis.
12 We are grateful to Veson Nautical for giving us access to this data for this project.

12
6. Results
Results for four different specifications of equation (10)' , exclusive of any qualitative indices are
shown in table 6. Columns (1) and (3) show results with dummies for apparel groups by fiber (cotton,
wool, man-made fibers, with silk omitted), but without country fixed effects. Columns (2) and (4)
include country fixed effects. What is immediately striking is the impact of the ETE on import share.
Although January 2002 saw a significant number of apparel categories freed of restraints, a country's
import share is still highly responsive to a change in the ETE. Loosening the QR on a product will reduce
the ETE of the license price (ceteris paribus). Columns (1) - (4) suggest that the elasticity of import share
to the ETE is between -1.5 and -3.9. Thus a percentage point reduction in the ETE would increase a
country's import share by between 1.5 and 3.9 percentage points. Since the higher elasticity estimates are
drawn from the specifications with better fit (inclusive of fixed effects), they may be a better measure of
the impact of removing the QRs.
The results in table 6 suggest that relative reductions in price due to the removal of the QRs in
January 2005 will be a major factor in influencing market share. Using the weighted average ETEs
shown in table 2, we would anticipate the largest increases in shares (in our sample) accruing to
Bangladesh, China, and Hong Kong, followed closely by India, Pakistan and Macau. However, relative
production efficiency also has a significant impact on import share at the product level. Results in table 6
suggest that the elasticity of import share with respect to production costs is between -0.4 and -1.1. In
addition, shipping costs (per dollar or per unit) are a significant determinant of import share. The
elasticity estimates for import share with respect to transport costs are -0.5 to -0.6. An additional two
days in transit per dollar (SME) shipped reduces import share by about 1 percentage point.
The qualitative indices which are available differ across countries, but not across apparel
products. Thus, we re-estimated (10)' including five qualitative factors, but no country fixed effects.
Because these indices are only available for six countries, the sample size is reduced. The results are
shown in table 7. We see that the qualitative factors cited by the survey of exporting firms clearly are
significant factors in determining import share. Countries with better transport infrastructure (lower
values) have significantly higher import shares. This is also true for telecommunications infrastructure,
though the results is not statistically significant. Countries with more favorable policies toward health,
labor and the environment also have higher shares of the U.S. import market. The two indices which do
not behave as expected are Trade and Investment Policies and Restrictions on Capital Markets. Fewer
restraints on the capital market (higher values) and better Trade and Investment Policies (lower values)
13 Ports of origin for the nine countries are Chittagong, Bangkok (proxy for Macau), Guangzhou, Hong Kong, Mumbai, Jakarta, Karachi, Kaoshiung.

13
should imply a larger import share. The perverse signs here may be due to the small number of
components which make up these two indices (see appendix A).
Another important result is evident in table 7. The inclusion of qualitative indices does not
significantly change the importance of the other economic variables which impact import share. In
particular, import share is now even more responsive to changes in the ETE than before. These results
support the idea that both changes in relative price due to liberation of the QRs and qualitative
characteristics of countries will together determine which exporting countries shares grow the most in the
new liberated apparel market.
7. Conclusions
This paper uses two novel data sources to estimate the determinants of the shares of various
developing countries in total U.S. apparel imports. Using panel data on 9 countries and 106 apparel
products in 2002, we test the impact of both changes in the export tax equivalents of the apparel VERs
and differences in qualitative characteristics of countries on import shares. We find that the degree of
restraint imposed by the quotas is still a critical factor in determining a country's import share in the U.S.
market. A percentage point drop in the export tax equivalent of the quota (due to loosening the restraint)
would likely increase import share by between 1.5 and 3.9 percentage points. However, lower production
costs, lower tariffs and transport costs, better quality of infrastructure and more favorable policies toward
health, labor and environment will also play a key role in determining shares of the U.S. import market
post 2005.

14
References
Avisse , Richard and Michel Fouquin (2001) ATextiles and Clothing: the End of Discriminatory
Protection,@ La Lettre du CEPII, No 198, Feb. 2001. Baldwin, R.(1970). Non-tariff Distortions in International Trade. Brookings Institution, Washington, DC.
Bora, B. A. Kuwahara, S. Laird (2002). Quantification of Non-Tariff Measures. Policy Issues in International Trade and Commodities, Study Series 18, UNCTAD, Geneva.
Dean, J. AThe Impact of the MFA on Small Exporters,@ Review of Economics and Statistics, 72 (1), Feb. 1990, 63-69.
Dean, J., AMarket Disruption and the Incidence of VERs Under the MFA,@ Review of Economics and Statistics, 77 (2), May 1995, 383-388.
Diao, Xinshen and Agapi Somwaru (2001) AImpact of the MFA Phase-Out on the World Economy: An
Intertemporal Global General Equilibrium Analysis,@ TMD Discussion Paper No. 79, Trade and Macroeconomics Division, International Food Policy Research Institute, Oct. 2001.
Fink, C. A. Mattoo, I. C. Neagu (2002). Assessing the Impact of Communication Costs on International
Trade. World Bank Policy Research Working Paper 2929. Washington, DC.
Flanagan, Mike (2003) AApparel Sourcing in the 21st Century, the 10 Lessons So Far,@ just-style.com, Jan. 2003.
Francois, J. (1996). A User’s Guide to Uruguay Round Assessments. WTO Staff Working Paper RD-96-003. London.
Francois, J.F., B. McDonald, and H. Nordstrom (1994). The Uruguay Round: A Global General Equilibrium Assessment. CEPR Discussion Paper.
_____ (1995). Assessing the Uruguay Round. In: W. Martin and L. A. Winters (eds.), The Uruguay Round and the Developing Countries. World Bank, Washington, D.C. World Bank Discussion Papers 307: 117–214.
Francois, Joseph and Spinanger, D. (2002), “ATC Export-tax Equivalents” in Betina V. Dimaranan and Robert A. McDougall, Global Trade, Assistance, and Production: The GTAP 5 Data Base, Center for Global Trade Analysis, Purdue University.
Hamilton, Carl (1986) AAn Assessment of Voluntary Restraints on Hong Kong Exports to Europe and the USA,@ Economica 53, Aug. 1986, 339-350
Harrison, G.W., T.F. Rutherford, and D.G. Tarr (1995). Quantifying the Uruguay Round. In: W. Martin and L.A. Winters (eds.), The Uruguay Round and the Developing Economies. World Bank Discussion Paper 307. Washington, D.C.
Helpman, Elhanan, and Paul Krugman (1985). Market Structure and Foreign Trade: Increasing Returns, Imperfect Competition, and the International Economy. Cambridge: The MIT Press.
Hertel, T.W., W. Martin, K. Yanagishima, and B. Dimaranan (1995). Liberalizing Manufactures in a
Changing World Economy. In: W. Martin and L.A. Winters (eds.), The Uruguay Round and the Developing Economies. World Bank Discussion Paper 307. Washington, D.C.
Hummels. D. (2001). Time as a Trade Barrier. Purdue University, mimeo.

15
Kathuria, Sanjay and Anjali Bhardwaj (1998) AExport Quotas and Policy Constraints in the Indian Textile and Garment Industries,@ mimeo, World Bank, 1998.
Krishna, Kala and Ling Hui Tan, Rags and Riches (Ann Arbor: University of Michigan Press, 1998).
Limao, N., A. J. Venables (2001). Infrastructure, Geographic Disadvantage, Transportation Costs and Trade. World Bank Economic Review, 15: 451-479.
Nguyen, T.T., C. Perroni, and R.M. Wigle (1993) An Evaluation of the Draft Final Act of the Uruguay Round. The Economic Journal 103: 1540-49.
Pacific Economic Cooperation Council – PECC (2000). Non-tariff Measures in Goods and Services Trade. Singapore
Spinanger, D.(1991). “From Sandlots to the Big League: Some Thoughts on Why East Asia Has Been Winning”. In: S. Koppers, S. Dingens, A. Kaas and H-E. Wermuth, Growth Determinants in East and Southeast Asian Economies. Berlin
_____ (1999). ATextiles Beyond the MFA Phase-Out,@ World Economy 22(4), 455-76. Spinanger, D., and S. Verma (2003). “The Coming Death of the ATC and China’s WTO Accession: Will Push Come to Shove for Indian T&C Exports?” in Bridging the Differences - Analyses of Five Issues of the WTO Agenda: Investment; Competition; Antidumping; Mobility of Labour; Textiles and Clothing. Jaipur. Takacs, Wendy (1978). AThe Non-Equivalence of Tariffs, Import Quotas, and Voluntary Export
Restraints,@ Journal of International Economics 8, 1978, 565-73.
Tait, Niki (2002) ATowards 2005: The Survival of the Fittest,@ just-style.com, Apr.15, 2002.
Terra, Maria Ines (2001) ATrade Liberalization in Latin American Countries and the Agreement on Textiles and Clothing in the WTO,@ Paper Presented at the Conference on the Impacts of Trade Liberalization Agreements on Latin America and the Caribbean, Inter-American Development Bank, Washington D.C, Nov. 5-6, 2001.
USITC (2002). The Economic Effects of Significant U.S. Trade Barriers: Third Update (Inv. No. 332-325) USITC Publication 3519, June.
_____ (2004). Textiles and Apparel: Assessment of the Competitiveness of Certain Foreign Suppliers to the U.S. Market (inv. No. 332-448), USITC Publication 3671, Jan.
Whalley, John (1999) ANotes On Textiles And Apparel In The Next Trade Round,@ Paper prepared for a conference on Developing Countries in the Next WTO Trade Round, Harvard University, Nov. 5-6, 1999.
Winters, L. Alan, and P.A. Brenton (1993) “Quantifying the Economic Effects of Non-tariff Barriers: The Case of UK Footwear,” Kyklos, vol 44, fasc 1, 77-92.
Yang, Y. (1994). "Trade Liberalization and Externalities: A General Equilibrium Assessment of the Uruguay Round." Australian National University, manuscript.
Yang, Y. and M. Mlachila (2004). "The End of Textile Quotas: a Case Study of the Impact on Bangladesh," manuscript.

16
Table 1 Suppliers subject to U.S. import quotas on textiles and apparel in 2002: Imports and Import share
Imports Import share
Number of “binding”
quota categories1
Supplier
Million dollars Percent China 8,744 12.1 58 Mexico2 8,619 11.9 1 Hong Kong 4,032 5.6 26 India 2,993 4.1 18 Korea, Republic of 2,881 4.0 2 Indonesia 2,329 3.2 38 Taiwan 2,208 3.1 10 Thailand 2,204 3.1 16 Dominican Republic 2,173 3.0 Philippines 2,042 2.8 21 Bangladesh 1,990 2.8 24 Pakistan 1,983 2.7 25 El Salvador 1,709 2.4 Turkey 1,678 2.3 14 Guatemala 1,669 2.3 1 Sri Lanka 1,527 2.1 19 Macau 1,148 1.6 12 Cambodia 1,061 1.5 13 Malaysia 775 1.1 14 Costa Rica 730 1.0 Egypt 474 0.7 Russia 370 0.5 Colombia 370 0.5 1 Brazil 332 0.5 1 Burma (Myanmar) 310 0.4 2 Singapore2 289 0.4 2 United Arab Emirates 281 0.4 4 Bahrain 202 0.3 Bulgaria 146 0.2 Nepal 136 0.2 3 Oman 125 0.2 2 Jamaica 125 0.2 Romania 119 0.2 3 Qatar 102 0.1 2 Ukraine 78 0.1 1 Fiji 75 0.1 Poland 61 0.1 2 Macedonia 44 0.1 Belarus 43 0.1 Hungary 41 0.1 Kuwait 29 0.0 Czech Republic 27 0.0 Uruguay 10 0.0 Slovak Republic 10 0.0 Laos 2 0.0 World 72,183 100.0
1 A bolded supplier name indicates that, in 2002, a given supplier had at least one quota category filled at 85 percent or more. Quota utilization rates were from Performance Report, OTEXA, USDOC, July 2003. 2 The United States eliminated quota restrictions on textile and apparel imports from Singapore and Mexico in 2004.. Source: USITC (2004, Forthcoming) and OTEXA, USDOC.

17
Table 2 Weighted average ETEs for apparel suppliers with available license prices 2002
Supplier Average
Apparel ETEs Percent
Average Textiles ETEs
Percent Bangladesh 1 21.56 0 China 19.74 9.74 Hong Kong 18.62 1.46 India 12.48 18.42 Pakistan 11.26 11.91 Macau 1 9.81 0 Indonesia1 5.41 0 Cambodia1 3.87 0 Taiwan 0.7 1.38 Source: Computed from license prices as described in the text. 1This country had no positive license price (no binding constraint) on textile products in 2002.
Table 3 Factors influencing sourcing decisions
1 Politics and stability in host country 3 Quality of transportation infrastructure in host country 5 Policies affecting international trade and investment 4 Quality of telecom infrastructure in host country 6 Labour costs 8 Policies affecting labour, health and environment 2 Availability of quotas in host country
10 Lack of restrictions on capital/profit transactions 7 Education and training of workers 9 Potential for exports to USA
11 The "culture" of host country 14 Host government tax policies/incentives 12 Potential new customers/new markets 13 Potential for exports to EU 15 Availability of ready-made factory units 17 HKG tax policies 16 Potential for exports to region 18 Existence of Overseas Chinese Community

18
Table 4. Descriptive Statistics (averages)
Supplier
Shares of US
Apparel Imports
(percent)
Cost per unit
($/SME)
Average Tariff,
Import Weighted (percent)
Shipping Time1
(days)
Shipping Distance1
(nautical miles)
Bangladesh 7.91 2.89 15.47 27.1 9123 Cambodia 5.14 4.47 15.96 22.6 8438 China 39.16 6.27 9.87 15 6404 Hong Kong 10.02 7.26 16.44 14.9 6335 India 9.93 5.43 15.35 25 10053 Indonesia 6.46 4.68 17.69 22.5 8135 Macau 2.55 6.22 18.33 27.2 6370 Pakistan 4.83 4.93 16.27 26 10513 Taiwan 7.14 3.95 21.39 14.3 6094
Source: see text 1Includes days in port of origin and destination, and days at sea. Shipping routes discussed in text. Data from Veson Nautical, http://apps.veson.com/distances/ . Table 5. Qualitative factors (indices)1
Supplier
Trade/Inv.
Policies2 Lbr/Hlth/Env. Pol.2
Telecom. Infra.2
Transport Infra.2
Capital Restrictions3
Bangladesh 52 52 68 76 2.23 China 49 36 58 54 1.83 Hong Kong 21 19 5 6 9.7 India 47 63 56 56 1.33 Indonesia 64 63 64 61 6.53 Taiwan 27 14 18 22 7.53
Source: Global Competitiveness Report (www.weforum.org/gcr) and Economic Freedom of the World Report (http://www.freetheworld.com/release.html). 1 Components of each index may be found in Appendix A. 2 Countries ranked on a scale of 1 to 80 where 1 is best. 3 Countries ranked on a scale of 1 to 10 where 10 is best.

19
Table 6. The Impact of QRs and Other Factors on Exporters' Shares of U.S. Imports1
(1) (2) (3) (4)
Variable Coeff t-Stat Coeff t-Stat Coeff t-Stat Coeff t-Stat
Constant -5.64 -27.19 -5.58 -24.59 -5.61 -27.29 -5.55 -24.58 Fiber Dummies2 Cotton Dummy -0.85 -6.02 -0.51 -3.88 -0.87 -6.22 -0.53 -4.02 Wool Dummy -0.23 -1.47 -0.26 -1.84 -0.23 -1.48 -0.26 -1.84 MM Fiber Dummy -0.67 -4.08 -0.58 -3.93 -0.68 -4.21 -0.59 -4.01 Log Costs per unit -0.99 -14.08 -1.08 -15.25 -0.43 -6.28 -0.57 -8.24 Log ETE -1.97 -4.93 -3.90 -10.67 -1.50 -3.83 -3.46 -9.48 Log Tariff -4.19 -4.53 -1.66 -1.95 -4.24 -4.62 -1.75 -2.07 Log World Price 0.83 8.69 0.89 10.00 0.86 9.01 0.91 10.26 Log Days3 per Dollar Shipped -0.61 -38.54 -0.54 -33.22 Log Days per Unit4 Shipped -0.61 -38.86 -0.54 -35.37 Country Dummies5 Bangladesh 0.58 3.20 0.56 3.14 Cambodia -0.28 -1.81 -0.29 -1.87 China 2.06 11.97 2.02 11.70 Hong Kong 0.67 4.35 0.67 4.34 India 0.60 3.61 0.61 3.65 Indonesia 0.51 3.13 0.50 3.06 Macau 0.05 0.32 0.04 0.28 Pakistan -0.27 -1.42 -0.29 -1.54 R-squared 0.69 0.78 0.69 0.78 Adjusted R-squared 0.69 0.77 0.69 0.77 F-statistic 203.25 158.23 206.62 157.69 Prob(F-statistic) 0.00 0.00 0.00 0.00 Durbin-Watson stat 1.47 1.67 1.48 1.67 Observations 730 730 730 730
1 GLS estimation with correction for cross-country heteroskedasticity. 2 Omitted fiber is silk (MFA categories 733 to 759 and 831 to 859). 3 Shipping days: includes days in home port, at sea and in port of destination. Data from http://apps.veson.com/distances/ . 4 Units are square meter equivalents. 5 Omitted country is Taiwan.

20
Table 7. The Impact of QRs and Other Factors on Exporters' Shares of U.S. Imports1
(1) (2)
Variable Coeff t-Stat Coeff t-Stat
Constant -13.74 -5.57 -13.18 -5.45 Fiber Dummies2 Cotton Dummy -0.58 -3.80 -0.60 -3.93 Wool Dummy -0.22 -1.28 -0.21 -1.27 MM Fiber Dummy -0.55 -3.22 -0.56 -3.30 Log Costs per unit -1.17 -14.22 -0.69 -8.56 Log ETE -3.85 -10.01 -3.42 -8.92 Log Tariff -2.29 -2.20 -2.45 -2.37 Log World Price 0.99 9.46 1.02 9.73 Log Days3 per Dollar Shipped -0.52 -28.49 Log Days per Unit4 Shipped -0.52 -28.74 Qualitative Indices Trade/Inv. Policies5 8.87 6.18 8.50 6.00 Lbr/Hlth/Env. Pol.5 -2.40 -7.75 -2.31 -7.48 Telecom. Infra.5 -1.35 -0.89 -1.13 -0.76 Capital Restrictions6 -0.47 -8.04 -0.45 -7.87 Transport Infra.5 -2.26 -1.99 -2.36 -2.13
R-squared 0.76 0.76 Adjusted R-squared 0.76 0.76 F-statistic 128.31 127.97 Prob(F-statistic) 0.00 0.00 Durbin-Watson stat 1.68 1.68 Observations 532 532
1 GLS estimation with correction for cross-country heteroskedasticity. 2 Omitted fiber is silk (MFA categories 733 to 759 and 831 to 859). 3 Shipping days: includes days in home port, at sea and in port of destination. Data from http://apps.veson.com/distances/ . 4 Units are square meter equivalents. 5 Countries ranked from 1 to 80, with 1 best. 6 Countries ranked from 1 to 10, with 10 best.

21
Figure 1: Ranking of Factors Influencing Investment/Sourcing Decisions: 2000
1 Politics and stability in host country 2 Availability of quotas in host country 3 Quality of transportation infrastructure in host
country 4 Quality of telecom infrastructure in host
country 5 Policies affecting international trade and
investment 6 Labor costs 7 Education and training of workers 8 Policies affecting labor, health and
environment 9 Potential for exports to USA
10 Lack of restrictions on capital/profit transactions
11 The "culture" of host country 12 Potential new customers/new markets 13 Potential for exports to EU
14 Host government tax policies/incentives 15 Availability of ready-made factory units 16 Potential for exports to region 17 HKG tax policies 18 Existence of Overseas Chinese Community
Source: Based on interviews with CEOs from 14 textile/clothing companies as well as large trading companies in Hong Kong (01/2000). See also text.
3
4
5
6
7
8
9
10
0 20 40 60 80 100
15
1312
14
109
4
87
16
11
17
5
18
36
1
2
Rank
Coefficient of vairation (%)

22
Figure 2: Ranking of Factors Influencing Investment/Sourcing Decisions: 2003
1 Labor costs 2 Policies affecting international trade and
investment 3 Politics and stability in host country 4 Policies affecting labor, health and
environment 5 Quality of transportation infrastructure in host
country 6 Lack of restrictions on capital/profit
transactions 7 Quality of telecom infrastructure in host
country 8 Host government tax policies/incentives 9 Potential for exports to USA
10 The "culture" of host country 11 Education and training of workers 12 Potential new customers/new markets 13 Availability of quotas in host country
14 Potential for exports to EU 15 HKG tax policies 16 Availability of ready-made factory units 17 Potential for exports to region 18 Existence of Overseas Chinese Community
Source: Based on interviews with CEOs from 14 textile/clothing companies as well as large trading companies in Hong Kong (02/2003). See also text.
3
4
5
6
7
8
9
10
0 20 40 60 80 100
1513
1214109
48
7
16
11
17
5
18
36
1
2
Rank
Coefficient of variation (%)
23
Figure 3: Ranking of Factors Influencing Investment/Sourcing Decisions:
Averages of 2000 and 2003
1 Politics and stability in host country 3 Quality of transportation infrastructure in
host country 5 Policies affecting international trade and
investment 4 Quality of telecom infrastructure in host
country 6 Labour costs 8 Policies affecting labour, health and
environment 2 Availability of quotas in host country
10 Lack of restrictions on capital/profit transactions
7 Education and training of workers 9 Potential for exports to USA
11 The "culture" of host country 14 Host government tax policies/incentives 12 Potential new customers/new markets 13 Potential for exports to EU
15 Availability of ready-made factory units 17 HKG tax policies 16 Potential for exports to region 18 Existence of Overseas Chinese Community
Source: See Diagrams 1 and 2 as well as the text.
3
4
5
6
7
8
9
10
0 20 40 60
15
1214
119
7
410
17
2
16
6
18
5
8
1 3
13
Rank
Coefficient of variation (%)

6
APPENDIX A: Source Bangladesh China Hong Kong India Indonesia Taiwan
QUALITATIVE INDEX DATA Data Rank Data Rank Data Rank Data Rank Data Rank Data Rank
Policies re. Trade + Investment
2.04 Ease of access to loans GCP02-03 2.30 69 2.50 60 4.60 6 2.80 55 2.40 63 3.90 28
2.05 Access to credit GCP02-03 4.00 49 4.40 30 4.90 14 5.20 5 2.60 79 5.20 5
2.09 Regulatory obstacles to business GCP02-03 4.90 12 3.50 77 3.40 78 4.10 56 4.10 58 4.30 48
2.10 Hidden trade barriers GCP02-03 3.70 65 4.90 34 6.30 3 4.30 48 3.50 69 5.10 30
2.11 Cost of importing foreign equipment GCP02-03 3.20 64 2.30 43 1.30 4 3.40 69 2.50 50 1.70 23
AVERAGE RANK 51.8 48.8 21.0 46.6 63.8 26.8
5.C.(v) Irregular Payments of covernment Officials
2001 EFreedom03 2.50 6.70 8.50 4.30 2.80 7.60
Policies affecting Labor, Health, and Environment
10.18 Hiring and firing practices GCP02-03 4.00 27 4.10 24 5.70 1 2.10 78 2.90 57 4.70 10
10.19 Flexibility of wage determination GCP02-03 5.10 34 5.20 29 6.70 1 4.10 61 4.10 60 6.10 5
10.20 Cooperation in labor-employer relations GCP02-03 4.00 58 4.70 32 5.30 14 4.00 55 3.50 74 5.50 12
5.09 Difference in the quality of healthcare GCP02-03 1.70 62 3.70 31 5.30 12 1.60 68 2.20 52 5.30 13
5.16 health expenditure per capita GCP02-03 12.00 74 40.00 66 #N/A #N/A #N/A #N/A 8.00 75 650.00 27
11.05 Stringency of environment regulations GCP02-03 2.70 73 3.50 54 4.00 43 3.50 53 2.90 67 5.20 21
11.08 Compliance with international agreements GCP02-03 3.60 61 5.20 17 4.40 42 3.50 64 3.80 56 5.40 16
11.13 Political context of environment gains GCP02-03 3.90 51 3.60 64 4.40 23 3.70 61 3.50 73 4.60 18
AVERAGE RANK 52.2857 35.8571 19.4286 62.8571 62.7143 13.5714
Quality transport infra.
5.01 Overall infrastructure quality GCP02-03 2.30 75 3.40 52 5.90 14 2.80 62 2.80 64 5.00 23
5.03 Port infrastructure quality GCP02-03 2.20 74 3.80 44 6.60 2 3.00 61 2.90 64 5.30 20
5.04 Air transport infrastructure quality GCP02-03 2.80 78 3.60 65 6.60 3 4.80 45 4.20 56 5.50 23
5.10 Paved roads GCP02-03 9.53 72 22.40 59 100.00 1 45.70 46 46.30 44 #N/A #N/A
AVERAGE RANK (exluding paved roads) 75.6667 53.6667 6.33333 56 61.3333 22
Lack of restriction cap/prof. trans.
3.D. Freedom to Own Foreign Currency

7
2001 EFreedom03 0.00 0.00 10.00 0.00 10.00 10.00
4.E(i) Access to Foreign Capital
2001 EFreedom03 5.90 4.70 9.90 4.00 8.10 7.60
4.E(ii) Restrictions of Foreign Capital Transactions
2001 EFreedom03 0.80 0.80 9.20 0.00 1.50 5.00 (1995 value)
AVERAGE RANK 2.23 1.83 9.70 1.33 6.53 7.53
Quality telecom infra.
4.01 Availability of mobile or cellular telephones GCP02-03 5.80 57 5.10 73 6.90 5 6.10 46 5.60 64 6.30 37
4.03 Quality of competition in the ISP sector GCP02-03 4.20 46 3.70 57 6.20 2 4.50 35 4.20 43 5.30 18
4.07 Cellular telephones, 2001 GCP02-03 0.40 79 11.17 60 85.46 2 0.63 78 2.47 74 96.55 1
4.10 Telephone lines, 2001 GCP02-03 0.39 80 13.81 53 57.66 12 3.38 75 3.70 74 57.34 14
5.06 Telephone/fax infrastructure quality GCP02-03 1.80 78 5.50 49 6.90 4 5.60 47 4.50 67 6.40 21
AVERAGE RANK 68 58.4 5 56.2 64.4 18.2