Composites for Renewable Energy - Eric Greene Associates Inc

06
UNITED STATESSECURITIES AND EXCHANGE COMMISSION
WASHINGTON, D.C. 20549
FORM 10-Q
☒☒ QUARTERLY REPORT PURSUANT TO SECTION 13 OR 15(d) OF THE SECURITIES EXCHANGE ACT OF 1934For the quarterly period ended June 30, 2021
OR☐☐ TRANSITION REPORT PURSUANT TO SECTION 13 OR 15(d) OF THE SECURITIES EXCHANGE ACT OF 1934
Commission File Number 001-37839
TPI Composites, Inc.(Exact name of registrant as specified in its charter)
Delaware 20-1590775(State or other jurisdiction of
incorporation or organization) (I.R.S. Employer
Identification Number)
8501 N. Scottsdale Rd.Gainey Center II, Suite 100
Scottsdale, AZ 85253(480) 305-8910
(Address, including zip code, and telephone number,including area code, of registrant’s principal executive offices)
Securities registered pursuant to Section 12(b) of the Act:
Title of each class Trading Symbol(s) Name of each exchange on which registeredCommon Stock, par value $0.01 TPIC NASDAQ Global Market
Indicate by check mark whether the registrant (1) has filed all reports required to be filed by Section 13 or 15(d) of the Securities Exchange Act of 1934 during thepreceding 12 months (or for such shorter period that the Registrant was required to file such reports), and (2) has been subject to such filing requirements for thepast 90 days. Yes ☒ No ☐Indicate by check mark whether the registrant has submitted electronically every Interactive Data File required to be submitted pursuant to Rule 405 ofRegulation S-T (§232.405 of this chapter) during the preceding 12 months (or for such shorter period that the registrant was required to submit suchfiles). Yes ☒ No ☐Indicate by check mark whether the registrant is a large accelerated filer, an accelerated filer, a non-accelerated filer, a smaller reporting company, or an emerginggrowth company. See the definitions of “large accelerated filer,” “accelerated filer,” “smaller reporting company” and “emerging growth company” in Rule 12b-2of the Exchange Act.
Large accelerated filer ☒ Accelerated filer ☐Non-accelerated filer ☐ Smaller reporting company ☐Emerging growth company ☐ If an emerging growth company, indicate by check mark if the registrant has elected not to use the extended transition period for complying with any new orrevised financial accounting standards provided pursuant to Section 13(a) of the Exchange Act ☐Indicate by check mark whether the registrant is a shell company (as defined in Rule 12b-2 of the Exchange Act). Yes ☐ No ☒As of July 30, 2021, there were 37,248,140 shares of common stock outstanding.
TPI COMPOSITES, INC. AND SUBSIDIARIES
INDEX Page
PART I. FINANCIAL INFORMATION
ITEM 1. Condensed Consolidated Financial Statements (Unaudited) 4
Condensed Consolidated Balance Sheets as of June 30, 2021 and December 31, 2020 4
Condensed Consolidated Statements of Operations for the Three and Six Months Ended June 30, 2021 and 2020 5
Condensed Consolidated Statements of Comprehensive Income (Loss) for the Three and Six Months Ended June 30, 2021 and 2020 6
Condensed Consolidated Statements of Changes in Stockholders’ Equity for the Three and Six Months Ended June 30, 2021 and 2020 7
Condensed Consolidated Statements of Cash Flows for the Six Months Ended June 30, 2021 and 2020 8
Notes to Condensed Consolidated Financial Statements (Unaudited) 10
ITEM 2. Management’s Discussion and Analysis of Financial Condition and Results of Operations 21
ITEM 3. Quantitative and Qualitative Disclosures About Market Risk 31
ITEM 4. Controls and Procedures 32
PART II. OTHER INFORMATION
ITEM 1. Legal Proceedings 33
ITEM 1A. Risk Factors 33
ITEM 2. Unregistered Sales of Equity Securities and Use of Proceeds 33
ITEM 3. Defaults Upon Senior Securities 33
ITEM 4. Mine Safety Disclosures 33
ITEM 5. Other Information 33
ITEM 6. Exhibits 34
SIGNATURES 35
1
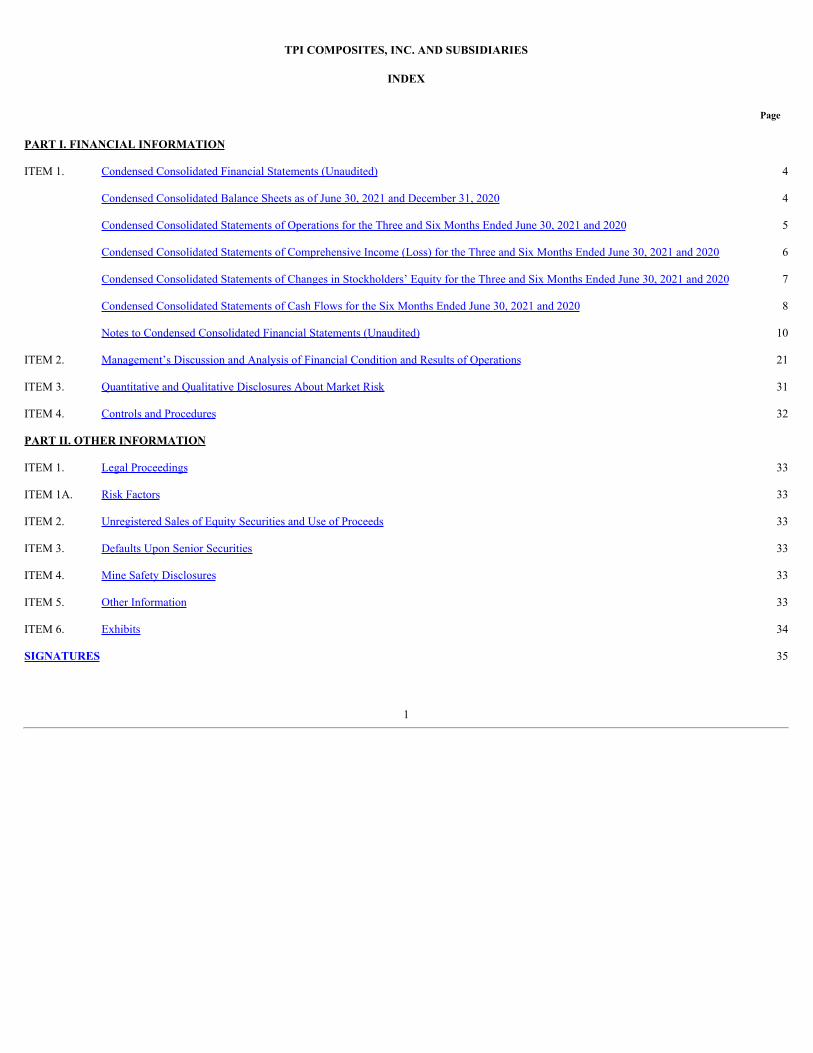
SPECIAL NOTE REGARDING FORWARD-LOOKING STATEMENTS
This Quarterly Report on Form 10-Q contains forward-looking statements within the meaning of the federal securities law. All statements other than statements ofhistorical facts contained in this Quarterly Report on Form 10-Q, including statements regarding our future results of operations and financial position, businessstrategy and plans and objectives of management for future operations, are forward-looking statements. In many cases, you can identify forward-lookingstatements by terms such as “may,” “should,” “expects,” “plans,” “anticipates,” “could,” “intends,” “target,” “projects,” “contemplates,” “believes,” “estimates,”“predicts,” “potential” or “continue” or the negative of these terms or other similar words. Forward-looking statements contained in this Quarterly Report onForm 10-Q include, but are not limited to, statements about:
the potential impact of the COVID-19 pandemic on our business and results of operations;
competition from other wind blade and wind blade turbine manufacturers;
our ability to procure adequate supplies of raw materials and components in a cost-effective manner to fulfill our volume commitments to ourcustomers;
the discovery of defects in our products and our ability to estimate the future cost of warranty campaigns;
growth of the wind energy and electric vehicle markets and our addressable markets for our products and services;
the potential impact of the increasing prevalence of auction-based tenders in the wind energy market and increased competition from solar energy onour gross margins and overall financial performance;
our future financial performance, including our net sales, cost of goods sold, gross profit or gross margin, operating expenses, ability to generatepositive cash flow, and ability to achieve or maintain profitability;
changes in domestic or international government or regulatory policy, including without limitation, changes in trade policy and a potential extensionof the Production Tax Credit in the United States;
the sufficiency of our cash and cash equivalents to meet our liquidity needs;
our ability to attract and retain customers for our products, and to optimize product pricing;
our ability to effectively manage our growth strategy and future expenses, including our startup and transition costs;
our ability to successfully expand in our existing wind energy markets and into new international wind energy markets, including our ability toexpand our field service inspection and repair services business and manufacture wind blades for offshore wind energy projects;
our ability to successfully open new manufacturing facilities, take over existing facilities of our customers and expand our existing facilities on timeand on budget;
the impact of the accelerated pace of new product and wind blade model introductions on our business and our results of operations;
our ability to successfully expand our transportation business and execute upon our strategy of entering new markets outside of wind energy;
worldwide economic conditions and their impact on customer demand;
our ability to maintain, protect and enhance our intellectual property;
our ability to comply with existing, modified or new laws and regulations applying to our business, including the imposition of new taxes, duties orsimilar assessments on our products;
the attraction and retention of qualified employees and key personnel;
our ability to maintain good working relationships with our employees, and avoid labor disruptions, strikes and other disputes with labor unions thatrepresent certain of our employees; and
the potential impact of one or more of our customers becoming bankrupt or insolvent, or experiencing other financial problems.
These forward-looking statements are only predictions. These statements relate to future events or our future financial performance and involve known andunknown risks, uncertainties and other important factors that may cause our actual results, levels of activity, performance or achievements to materially differ fromany future results, levels of activity, performance or achievements expressed or
2

implied by these forward-looking statements. We have described in the “Risk Factors” section of our Annual Report on Form 10-K filed with the United StatesSecurities and Exchange Commission (SEC) on February 25, 2021 the principal risks and uncertainties that we believe could cause actual results to differ fromthese forward-looking statements. Because forward-looking statements are inherently subject to risks and uncertainties, some of which cannot be predicted orquantified, you should not rely on these forward-looking statements as guarantees of future events.
The forward-looking statements in this Quarterly Report on Form 10-Q represent our views as of the date of this Quarterly Report on Form 10-Q. We anticipatethat subsequent events and developments will cause our views to change. However, while we may elect to update these forward-looking statements at some pointin the future, we undertake no obligation to update any forward-looking statement to reflect events or developments after the date on which the statement is madeor to reflect the occurrence of unanticipated events except to the extent required by applicable law. You should, therefore, not rely on these forward-lookingstatements as representing our views as of any date after the date of this Quarterly Report on Form 10-Q. Our forward-looking statements do not reflect thepotential impact of any future acquisitions, mergers, dispositions, joint ventures, or investments we may make.
3

PART I. FINANCIAL INFORMATION
ITEM l. CONDENSED CONSOLIDATED FINANCIAL STATEMENTS (UNAUDITED)
TPI COMPOSITES, INC. AND SUBSIDIARIES
CONDENSED CONSOLIDATED BALANCE SHEETS
(Unaudited) June 30, December 31, 2021 2020 (in thousands, except par value data) Assets Current assets:
Cash and cash equivalents $ 123,107 $ 129,857 Restricted cash 154 339 Accounts receivable 147,827 132,768 Contract assets 231,780 216,928 Prepaid expenses 21,019 29,507 Other current assets 20,520 27,921 Inventories 13,168 10,839
Total current assets 557,575 548,159 Property, plant and equipment, net 205,716 209,001 Operating lease right of use assets 148,991 158,827 Other noncurrent assets 28,232 40,270
Total assets $ 940,514 $ 956,257
Liabilities and Stockholders’ Equity Current liabilities:
Accounts payable and accrued expenses $ 310,320 $ 295,992 Accrued warranty 47,462 50,852 Current maturities of long-term debt 56,137 32,551 Current operating lease liabilities 23,100 26,099 Contract liabilities 2,258 614
Total current liabilities 439,277 406,108 Long-term debt, net of current maturities 180,138 184,316 Noncurrent operating lease liabilities 152,059 155,925 Other noncurrent liabilities 8,143 8,873
Total liabilities 779,617 755,222 Commitments and contingencies (Note 12) Stockholders’ equity:
Common shares, $0.01 par value, 100,000 shares authorized, 37,248 shares issued and 37,040 shares outstanding at June 30, 2021 and 100,000 shares authorized, 36,771 shares issued and 36,564 shares outstanding at December 31, 2020 372 368 Paid-in capital 359,527 349,472 Accumulated other comprehensive loss (41,559 ) (32,990 )Accumulated deficit (151,310 ) (109,716 )Treasury stock, at cost, 208 shares at June 30, 2021 and 207 shares at December 31, 2020 (6,133 ) (6,099 )
Total stockholders’ equity 160,897 201,035 Total liabilities and stockholders’ equity $ 940,514 $ 956,257
See accompanying notes to unaudited condensed consolidated financial statements.
4

TPI COMPOSITES, INC. AND SUBSIDIARIES
CONDENSED CONSOLIDATED STATEMENTS OF OPERATIONS
(Unaudited) Three Months Ended Six Months Ended June 30, June 30, 2021 2020 2021 2020 (in thousands, except per share data) Net sales $ 458,841 $ 373,817 $ 863,521 $ 730,453 Cost of sales 440,416 367,644 823,472 716,119 Startup and transition costs 10,099 10,920 24,453 22,954
Total cost of goods sold 450,515 378,564 847,925 739,073 Gross profit (loss) 8,326 (4,747 ) 15,596 (8,620 )
General and administrative expenses 6,712 6,887 15,634 16,383 Loss on sale of assets and asset impairments 1,451 1,440 2,748 3,358 Restructuring charges, net 2,196 181 2,454 298
Loss from operations (2,033 ) (13,255 ) (5,240 ) (28,659 )Other income (expense):
Interest expense, net (2,691 ) (2,545 ) (5,395 ) (4,316 )Foreign currency loss (6,504 ) (1,928 ) (10,231 ) (968 )Miscellaneous income 321 939 1,060 1,634
Total other expense (8,874 ) (3,534 ) (14,566 ) (3,650 )Loss before income taxes (10,907 ) (16,789 ) (19,806 ) (32,309 )
Income tax provision (28,890 ) (49,312 ) (21,788 ) (34,284 )Net loss $ (39,797 ) $ (66,101 ) $ (41,594 ) $ (66,593 )
Weighted-average common shares outstanding: Basic 36,881 35,299 36,742 35,256 Diluted 36,881 35,299 36,742 35,256
Net loss per common share: Basic $ (1.08 ) $ (1.87 ) $ (1.13 ) $ (1.89 )Diluted $ (1.08 ) $ (1.87 ) $ (1.13 ) $ (1.89 )
See accompanying notes to unaudited condensed consolidated financial statements.
5

TPI COMPOSITES, INC. AND SUBSIDIARIES
CONDENSED CONSOLIDATED STATEMENTS OF COMPREHENSIVE INCOME (LOSS)
(Unaudited) Three Months Ended Six Months Ended June 30, June 30, 2021 2020 2021 2020 (in thousands) Net loss $ (39,797 ) $ (66,101 ) $ (41,594 ) $ (66,593 )Other comprehensive income (loss):
Foreign currency translation adjustments (4 ) (2,289 ) (5,295 ) (11,513 )Unrealized gain (loss) on hedging derivatives, net of taxes of $85, $(939), $736 and $1,100, respectively (239 ) 3,549 (3,274 ) (4,120 )
Comprehensive income (loss) $ (40,040 ) $ (64,841 ) $ (50,163 ) $ (82,226 )
See accompanying notes to unaudited condensed consolidated financial statements.
6

TPI COMPOSITES, INC. AND SUBSIDIARIES
CONDENSED CONSOLIDATED STATEMENTS OF CHANGES IN STOCKHOLDERS’ EQUITY
(Unaudited) Six Months Ended June 30, 2021
Accumulated
Common Paid-in other
comprehensive Accumulated Treasury stock, Total
stockholders'
Shares Amount capital loss deficit at cost equity
(in thousands)
Balance at December 31, 2020 36,771 $ 368 $ 349,472 $ (32,990 ) $ (109,716 ) $ (6,099 ) $ 201,035 Net loss — — — — (1,797 ) — (1,797 )Share-based compensation expense — — 2,494 — — — 2,494 Issuances under share-based compensation plan 149 1 1,235 — — — 1,236 Common stock repurchased for treasury — — — — — (34 ) (34 )Other comprehensive loss — — — (8,326 ) — — (8,326 )
Balance at March 31, 2021 36,920 369 353,201 (41,316 ) (111,513 ) (6,133 ) 194,608 Net loss — — — — (39,797 ) — (39,797 )Share-based compensation expense — — 2,836 — — — 2,836 Issuances under share-based compensation plan 328 3 3,490 — — — 3,493 Other comprehensive loss — — — (243 ) — — (243 )
Balance at June 30, 2021 37,248 $ 372 $ 359,527 $ (41,559 ) $ (151,310 ) $ (6,133 ) $ 160,897 Six Months Ended June 30, 2020
Accumulated
Common Paid-in other
comprehensive Accumulated Treasury stock, Total
stockholders'
Shares Amount capital loss deficit at cost equity
(in thousands)
Balance at December 31, 2019 35,326 $ 353 $ 322,906 $ (23,612 ) $ (90,689 ) $ (3,908 ) $ 205,050 Net loss — — — — (492 ) — (492 )Share-based compensation expense — — 2,970 — — — 2,970 Issuances under share-based compensation plan 109 1 861 — — — 862 Common stock repurchased for treasury — — — — — (459 ) (459 )Other comprehensive loss — — — (16,893 ) — — (16,893 )
Balance at March 31, 2020 35,435 354 326,737 (40,505 ) (91,181 ) (4,367 ) 191,038 Net loss — — — — (66,101 ) — (66,101 )Share-based compensation expense — — 2,186 — — — 2,186 Issuances under share-based compensation plan 81 1 510 — — — 511 Common stock repurchased for treasury — — — — — (49 ) (49 )Other comprehensive income — — — 1,260 — — 1,260
Balance at June 30, 2020 35,516 $ 355 $ 329,433 $ (39,245 ) $ (157,282 ) $ (4,416 ) $ 128,845
See accompanying notes to unaudited condensed consolidated financial statements.
7
TPI COMPOSITES, INC. AND SUBSIDIARIES
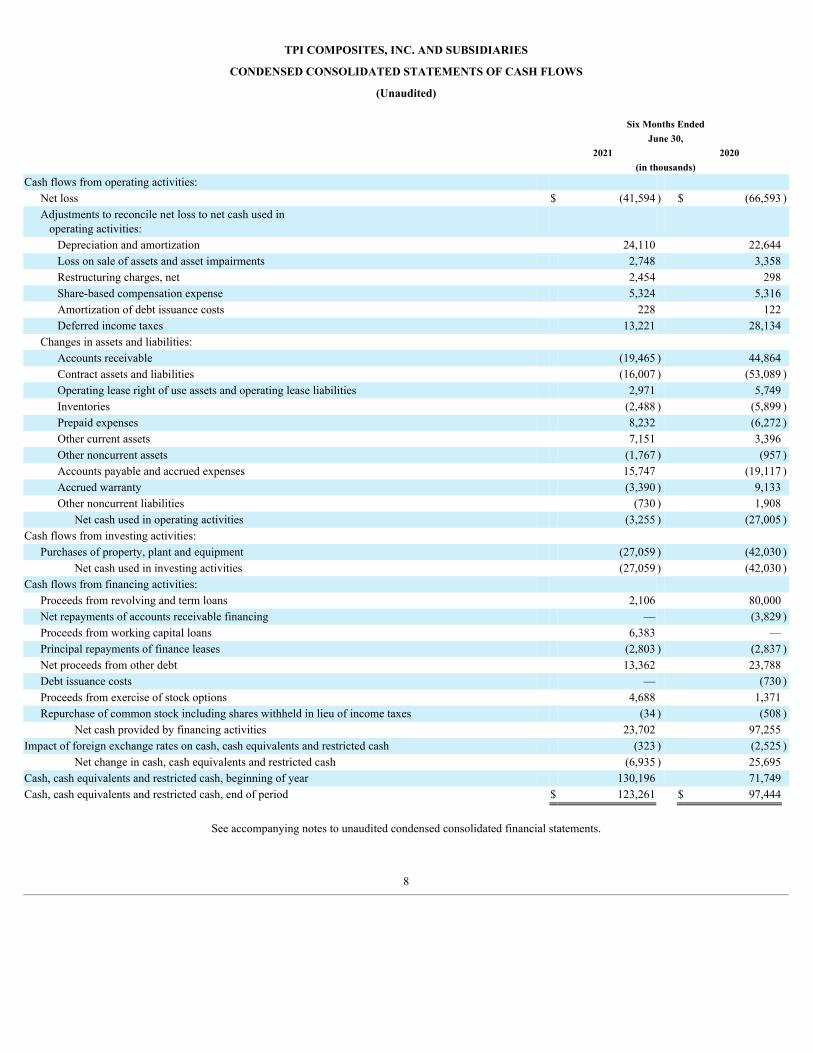
CONDENSED CONSOLIDATED STATEMENTS OF CASH FLOWS
(Unaudited) Six Months Ended June 30, 2021 2020 (in thousands) Cash flows from operating activities:
Net loss $ (41,594 ) $ (66,593 )Adjustments to reconcile net loss to net cash used in operating activities:
Depreciation and amortization 24,110 22,644 Loss on sale of assets and asset impairments 2,748 3,358 Restructuring charges, net 2,454 298 Share-based compensation expense 5,324 5,316 Amortization of debt issuance costs 228 122 Deferred income taxes 13,221 28,134
Changes in assets and liabilities: Accounts receivable (19,465 ) 44,864 Contract assets and liabilities (16,007 ) (53,089 )Operating lease right of use assets and operating lease liabilities 2,971 5,749 Inventories (2,488 ) (5,899 )Prepaid expenses 8,232 (6,272 )Other current assets 7,151 3,396 Other noncurrent assets (1,767 ) (957 )Accounts payable and accrued expenses 15,747 (19,117 )Accrued warranty (3,390 ) 9,133 Other noncurrent liabilities (730 ) 1,908
Net cash used in operating activities (3,255 ) (27,005 )Cash flows from investing activities:
Purchases of property, plant and equipment (27,059 ) (42,030 )Net cash used in investing activities (27,059 ) (42,030 )
Cash flows from financing activities: Proceeds from revolving and term loans 2,106 80,000 Net repayments of accounts receivable financing — (3,829 )Proceeds from working capital loans 6,383 — Principal repayments of finance leases (2,803 ) (2,837 )Net proceeds from other debt 13,362 23,788 Debt issuance costs — (730 )Proceeds from exercise of stock options 4,688 1,371 Repurchase of common stock including shares withheld in lieu of income taxes (34 ) (508 )
Net cash provided by financing activities 23,702 97,255 Impact of foreign exchange rates on cash, cash equivalents and restricted cash (323 ) (2,525 )
Net change in cash, cash equivalents and restricted cash (6,935 ) 25,695 Cash, cash equivalents and restricted cash, beginning of year 130,196 71,749 Cash, cash equivalents and restricted cash, end of period $ 123,261 $ 97,444
See accompanying notes to unaudited condensed consolidated financial statements.
8
TPI COMPOSITES, INC. AND SUBSIDIARIES
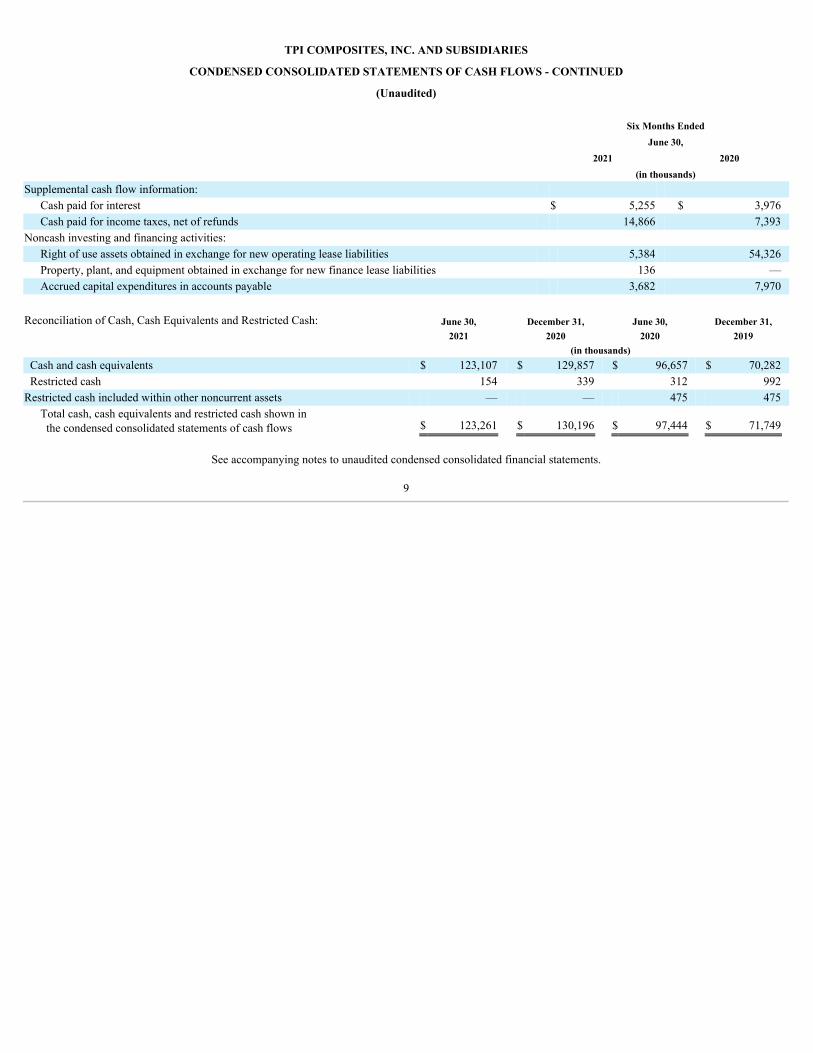
CONDENSED CONSOLIDATED STATEMENTS OF CASH FLOWS - CONTINUED
(Unaudited)
Six Months Ended June 30, 2021 2020 (in thousands)
Supplemental cash flow information: Cash paid for interest $ 5,255 $ 3,976 Cash paid for income taxes, net of refunds 14,866 7,393
Noncash investing and financing activities: Right of use assets obtained in exchange for new operating lease liabilities 5,384 54,326 Property, plant, and equipment obtained in exchange for new finance lease liabilities 136 — Accrued capital expenditures in accounts payable 3,682 7,970
Reconciliation of Cash, Cash Equivalents and Restricted Cash: June 30, December 31, June 30, December 31, 2021 2020 2020 2019 (in thousands) Cash and cash equivalents $ 123,107 $ 129,857 $ 96,657 $ 70,282 Restricted cash 154 339 312 992 Restricted cash included within other noncurrent assets — — 475 475
Total cash, cash equivalents and restricted cash shown in the condensed consolidated statements of cash flows $ 123,261 $ 130,196 $ 97,444 $ 71,749
See accompanying notes to unaudited condensed consolidated financial statements.
9

TPI COMPOSITES, INC. AND SUBSIDIARIES
NOTES TO CONDENSED CONSOLIDATED FINANCIAL STATEMENTS
(Unaudited)
Note 1. Basis of Presentation
The condensed consolidated financial statements included herein have been prepared by us without audit, pursuant to the rules and regulations of the SEC andshould be read in conjunction with the audited consolidated financial statements for the year ended December 31, 2020 included in our Annual Report on Form 10-K. Certain information and footnote disclosures normally included in financial statements prepared in accordance with accounting principles generally accepted inthe United States (GAAP) have been condensed or omitted, as permitted by the SEC, although we believe the disclosures that are made are adequate to make theinformation presented herein not misleading. The accompanying condensed consolidated financial statements reflect, in the opinion of our management, all normalrecurring adjustments necessary to present fairly our financial position at June 30, 2021, and the results of our operations, comprehensive income (loss) and cashflows for the periods presented. Interim results for the three and six months ended June 30, 2021 and 2020 are not necessarily indicative of the results to beexpected for the full years. Certain prior period amounts in the condensed consolidated financial statements and accompanying notes have been reclassified toconform to the current period’s presentation.
The preparation of these condensed consolidated financial statements in conformity with GAAP requires management to make estimates and assumptions thataffect the reported amounts of assets and liabilities and disclosure of contingent assets and liabilities at the date of the condensed consolidated financial statementsand the reported amounts of revenues and expenses during the reporting period. Actual results could differ from those estimates.
The accompanying condensed consolidated financial statements include the accounts of TPI Composites, Inc. and all of our majority owned subsidiaries. Allsignificant intercompany transactions and balances have been eliminated.
References to TPI Composites, Inc, the “Company,” “we,” “us” or “our” in these notes refer to TPI Composites, Inc. and its consolidated subsidiaries.
Accounting Pronouncements
Recently Adopted Accounting Pronouncements
Convertible Instruments
In August 2020, the Financial Accounting Standards Board (FASB) issued Accounting Standards Update (ASU) 2020-06, Debt—Debt with Conversion and OtherOptions (Subtopic 470-20) and Derivatives and Hedging— Contracts in Entity’s Own Equity (Subtopic 815-40): Accounting for Convertible Instruments andContracts in an Entity’s Own Equity. This ASU is intended to simplify the accounting for certain convertible instruments with characteristics of both liability andequity. This ASU removes certain accounting models which separate the embedded conversion features from the host contract for convertible instruments. As aresult, after the adoption of this guidance, an entity’s convertible debt instrument will be wholly accounted for as debt. This ASU also expands disclosurerequirements for convertible instruments and simplifies areas of the guidance for diluted earnings-per-share calculations by requiring the use of the if-convertedmethod.
This ASU is effective for all public business entities (other than smaller reporting companies) for fiscal years beginning after December 15, 2021, with earlyadoption permitted for fiscal years beginning after December 15, 2020 and can be adopted on either a fully retrospective or modified retrospective basis. An entityshould adopt the guidance at the beginning of its annual fiscal year. We adopted this standard on January 1, 2021 on a modified retrospective basis and it did nothave a material effect on our condensed consolidated financial statements.
Recently Issued Accounting Pronouncements
Reference Rate Reform
In March 2020, the FASB issued ASU 2020-04, Reference Rate Reform (Topic 848): Facilitation of the Effects of Reference Rate Reform on Financial Reporting,which provides optional expedients and exceptions for applying GAAP to contracts, hedging relationships, and other transactions affected by reference rate reformif certain criteria are met. This ASU only applies to contracts, hedging relationships, and other transactions that reference the London Interbank Offered Rate(LIBOR) or another reference rate expected to be discontinued because of reference rate reform. This ASU is effective for all entities beginning on March 12, 2020and entities may elect to apply the ASU prospectively through December 31, 2022. The FASB later issued ASU 2021-01, Reference Rate
10
TPI COMPOSITES, INC. AND SUBSIDIARIES
NOTES TO CONDENSED CONSOLIDATED FINANCIAL STATEMENTS
(Unaudited)
Reform (Topic 848): Scope, to clarify the scope of Topic 848 so that derivatives affected by the discounting transition are explicitly eligible for certain optionalexpedients and exceptions in Topic 848. We are currently evaluating the impact this guidance may have on our condensed consolidated financial statements andrelated disclosures.
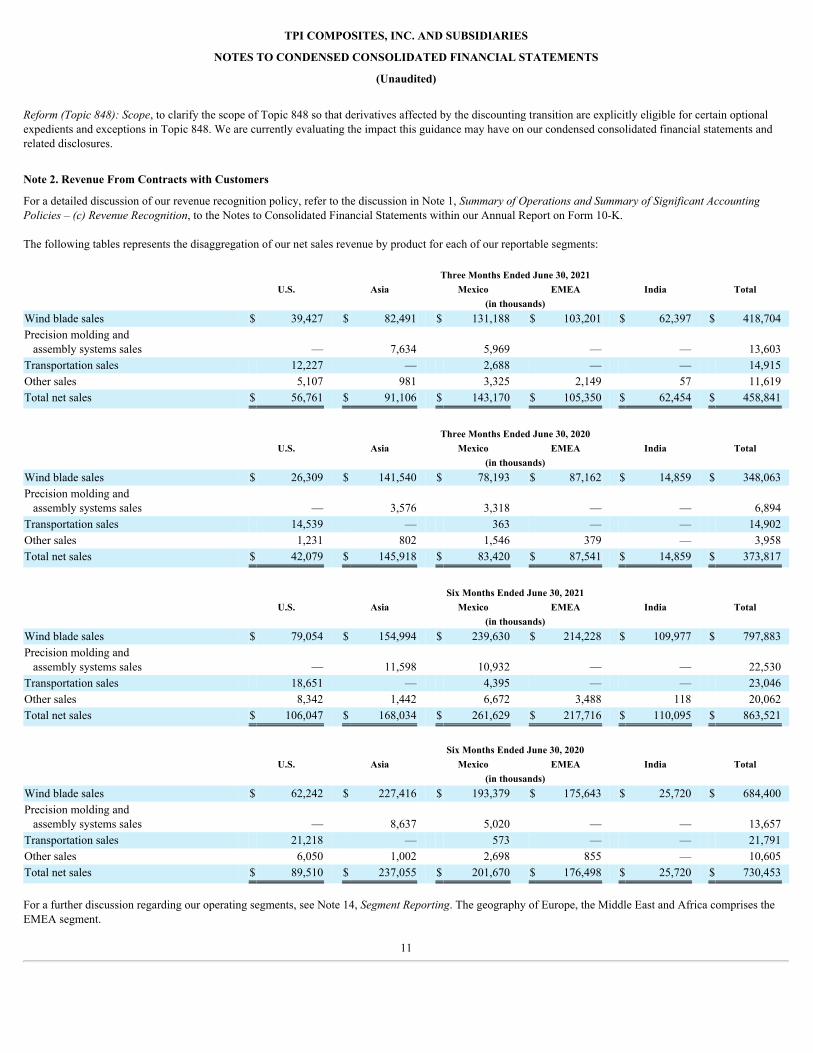
Note 2. Revenue From Contracts with Customers
For a detailed discussion of our revenue recognition policy, refer to the discussion in Note 1, Summary of Operations and Summary of Significant AccountingPolicies – (c) Revenue Recognition, to the Notes to Consolidated Financial Statements within our Annual Report on Form 10-K.
The following tables represents the disaggregation of our net sales revenue by product for each of our reportable segments: Three Months Ended June 30, 2021 U.S. Asia Mexico EMEA India Total (in thousands) Wind blade sales $ 39,427 $ 82,491 $ 131,188 $ 103,201 $ 62,397 $ 418,704 Precision molding and assembly systems sales — 7,634 5,969 — — 13,603 Transportation sales 12,227 — 2,688 — — 14,915 Other sales 5,107 981 3,325 2,149 57 11,619 Total net sales $ 56,761 $ 91,106 $ 143,170 $ 105,350 $ 62,454 $ 458,841
Three Months Ended June 30, 2020 U.S. Asia Mexico EMEA India Total (in thousands) Wind blade sales $ 26,309 $ 141,540 $ 78,193 $ 87,162 $ 14,859 $ 348,063 Precision molding and assembly systems sales — 3,576 3,318 — — 6,894 Transportation sales 14,539 — 363 — — 14,902 Other sales 1,231 802 1,546 379 — 3,958 Total net sales $ 42,079 $ 145,918 $ 83,420 $ 87,541 $ 14,859 $ 373,817
Six Months Ended June 30, 2021 U.S. Asia Mexico EMEA India Total (in thousands) Wind blade sales $ 79,054 $ 154,994 $ 239,630 $ 214,228 $ 109,977 $ 797,883 Precision molding and assembly systems sales — 11,598 10,932 — — 22,530 Transportation sales 18,651 — 4,395 — — 23,046 Other sales 8,342 1,442 6,672 3,488 118 20,062 Total net sales $ 106,047 $ 168,034 $ 261,629 $ 217,716 $ 110,095 $ 863,521 Six Months Ended June 30, 2020 U.S. Asia Mexico EMEA India Total (in thousands) Wind blade sales $ 62,242 $ 227,416 $ 193,379 $ 175,643 $ 25,720 $ 684,400 Precision molding and assembly systems sales — 8,637 5,020 — — 13,657 Transportation sales 21,218 — 573 — — 21,791 Other sales 6,050 1,002 2,698 855 — 10,605 Total net sales $ 89,510 $ 237,055 $ 201,670 $ 176,498 $ 25,720 $ 730,453 For a further discussion regarding our operating segments, see Note 14, Segment Reporting. The geography of Europe, the Middle East and Africa comprises theEMEA segment.
11
TPI COMPOSITES, INC. AND SUBSIDIARIES
NOTES TO CONDENSED CONSOLIDATED FINANCIAL STATEMENTS
(Unaudited)
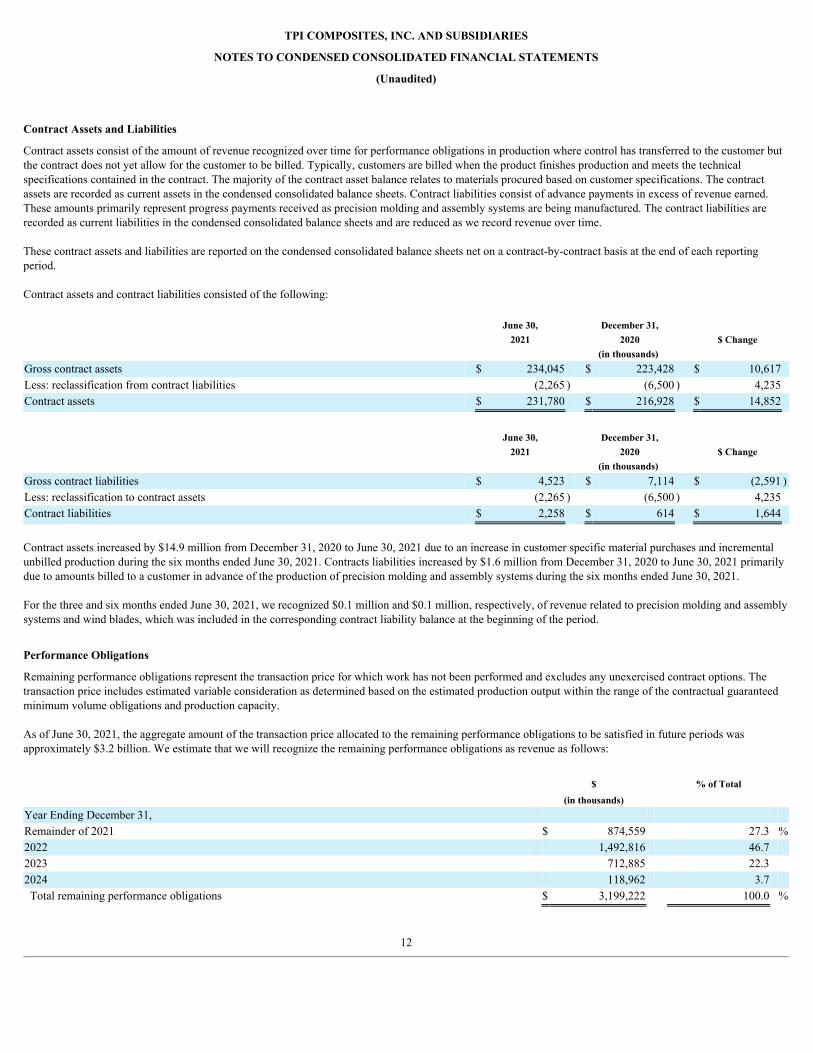
Contract Assets and Liabilities
Contract assets consist of the amount of revenue recognized over time for performance obligations in production where control has transferred to the customer butthe contract does not yet allow for the customer to be billed. Typically, customers are billed when the product finishes production and meets the technicalspecifications contained in the contract. The majority of the contract asset balance relates to materials procured based on customer specifications. The contractassets are recorded as current assets in the condensed consolidated balance sheets. Contract liabilities consist of advance payments in excess of revenue earned.These amounts primarily represent progress payments received as precision molding and assembly systems are being manufactured. The contract liabilities arerecorded as current liabilities in the condensed consolidated balance sheets and are reduced as we record revenue over time.
These contract assets and liabilities are reported on the condensed consolidated balance sheets net on a contract-by-contract basis at the end of each reportingperiod.
Contract assets and contract liabilities consisted of the following: June 30, December 31, 2021 2020 $ Change (in thousands) Gross contract assets $ 234,045 $ 223,428 $ 10,617 Less: reclassification from contract liabilities (2,265 ) (6,500 ) 4,235 Contract assets $ 231,780 $ 216,928 $ 14,852
June 30, December 31, 2021 2020 $ Change (in thousands) Gross contract liabilities $ 4,523 $ 7,114 $ (2,591 )Less: reclassification to contract assets (2,265 ) (6,500 ) 4,235 Contract liabilities $ 2,258 $ 614 $ 1,644
Contract assets increased by $14.9 million from December 31, 2020 to June 30, 2021 due to an increase in customer specific material purchases and incrementalunbilled production during the six months ended June 30, 2021. Contracts liabilities increased by $1.6 million from December 31, 2020 to June 30, 2021 primarilydue to amounts billed to a customer in advance of the production of precision molding and assembly systems during the six months ended June 30, 2021.
For the three and six months ended June 30, 2021, we recognized $0.1 million and $0.1 million, respectively, of revenue related to precision molding and assemblysystems and wind blades, which was included in the corresponding contract liability balance at the beginning of the period.
Performance Obligations
Remaining performance obligations represent the transaction price for which work has not been performed and excludes any unexercised contract options. Thetransaction price includes estimated variable consideration as determined based on the estimated production output within the range of the contractual guaranteedminimum volume obligations and production capacity.
As of June 30, 2021, the aggregate amount of the transaction price allocated to the remaining performance obligations to be satisfied in future periods wasapproximately $3.2 billion. We estimate that we will recognize the remaining performance obligations as revenue as follows:
$ % of Total (in thousands)
Year Ending December 31, Remainder of 2021 $ 874,559 27.3 %2022 1,492,816 46.7 2023 712,885 22.3 2024 118,962 3.7 Total remaining performance obligations $ 3,199,222 100.0 %
12

TPI COMPOSITES, INC. AND SUBSIDIARIES
NOTES TO CONDENSED CONSOLIDATED FINANCIAL STATEMENTS
(Unaudited)
For the three and six months ended June 30, 2021, net revenue recognized from our performance obligations satisfied in previous periods decreased by $4.0 millionand $12.5 million, respectively, as compared to increases of $5.8 million and $0.6 million, respectively, in the same periods in 2020. The current year decreasesprimarily relates to changes in certain of our estimated total contract values and related direct costs to complete the performance obligations.
Note 3. Significant Risks and Uncertainties
Our revenues and receivables are earned from a small number of customers. As such, our production levels are dependent on these customers’ orders. See Note 13,Concentration of Customers.
We may be required to reinstate temporary production suspensions or volume reductions at our manufacturing facilities to the extent there are new resurgences ofCOVID-19 cases in the regions where we operate or there is an outbreak of positive COVID-19 cases in any of our manufacturing facilities. In addition, our globalsupply chain may in the future be adversely affected if the COVID-19 pandemic persists. In 2021, there have been both significant price increases and supply constraints with respect to resin and carbon fiber, which are key raw materials that we use tomanufacture our products, as well as increases in logistics costs to obtain raw materials. We expect that the price of resin and carbon fiber will remain at elevatedlevels for the remainder of 2021. Approximately 55% of the resin and resin systems we use are purchased under contracts either controlled or borne by two of ourcustomers and therefore these customers receive/bear 100% of any increase in resin prices. With respect to our other customer supply agreements, our customerstypically bear 70% of any raw material price increases. If the supply of resin feedstocks and carbon fiber continue to be constrained for an extended period of time,such shortages could impact our ability to meet our customers’ forecasted demand for our products for the remainder of 2021 and have a further material adverseimpact on our results of operations.
We maintain our U.S. cash in bank deposit and money market accounts that, at times, exceed U.S. federally insured limits. U.S. bank accounts are guaranteed bythe Federal Deposit Insurance Corporation (FDIC) in an amount up to $250,000 during 2021 and 2020. U.S. money market accounts are not guaranteed by theFDIC. At June 30, 2021 and December 31, 2020, we had $55.2 million and $68.9 million, respectively, of cash in bank deposit and money market accounts in highquality U.S. banks, which was in excess of FDIC limits. We have not experienced losses in any such accounts.
We also maintain cash in bank deposit accounts outside the U.S. with no insurance. At June 30, 2021, this included $58.7 million in China, $5.1 million in Turkey,$2.3 million in Mexico, $1.5 million in India and $0.3 million in other countries. As of December 31, 2020, this included $47.4 million in China, $6.0 million inTurkey, $5.0 million in India, $2.1 million in Mexico and $0.5 million in other countries. We have not experienced losses in these accounts. In addition, at June 30,2021 and December 31, 2020, we had short-term deposits in interest bearing accounts in China of $0.2 million and $0.3 million, respectively, which are reported asrestricted cash in our condensed consolidated balance sheets.
Certain of our debt agreements are either tied to LIBOR or the Euro Interbank Offered Rate (EURIBOR) and certain of them have associated interest rate hedges.Due to the relatively low LIBOR and EURIBOR rates in effect as of June 30, 2021, a 10% change in the LIBOR or EURIBOR rate would not have had a materialimpact on our future earnings, fair values or cash flows.
Note 4. Accrued Warranty
The warranty accrual activity for the periods noted consisted of the following: Three Months Ended Six Months Ended June 30, June 30, 2021 2020 2021 2020 (in thousands) Warranty accrual at beginning of period $ 45,956 $ 51,528 $ 50,852 $ 47,639 Accrual during the period 5,400 4,509 10,247 8,374 Cost of warranty services provided during the period (3,781 ) (5,267 ) (11,352 ) (8,482 )Changes in estimate for pre-existing warranties, including expirations during the period (113 ) 6,002 (2,285 ) 9,241 Warranty accrual at end of period $ 47,462 $ 56,772 $ 47,462 $ 56,772
13

TPI COMPOSITES, INC. AND SUBSIDIARIES
NOTES TO CONDENSED CONSOLIDATED FINANCIAL STATEMENTS
(Unaudited)
Note 5. Long-Term Debt, Net of Current Maturities
Long-term debt, net of current maturities, consisted of the following: June 30, December 31, 2021 2020 (in thousands) Senior revolving loan—U.S. $ 171,154 $ 171,154 Unsecured financing—EMEA 45,913 30,040 Equipment financing—EMEA 2,101 4,335 Secured and unsecured working capital—India 6,383 — Unsecured term loan—India 2,106 — Equipment finance lease—Mexico 6,261 8,038 Equipment finance lease—EMEA 3,012 4,119 Other equipment finance leases 168 232
Total debt—principal 237,098 217,918 Less: Debt issuance costs (823 ) (1,051 )
Total debt, net of debt issuance costs 236,275 216,867 Less: Current maturities of long-term debt (56,137 ) (32,551 )
Long-term debt, net of debt issuance costs and current maturities $ 180,138 $ 184,316
Note 6. Share-Based Compensation Plans
During the six months ended June 30, 2021, we issued to certain employees and non-employee directors an aggregate of 168,993 timed-based restricted stock units(RSUs), 58,396 performance-based restricted stock units (PSUs) that vest upon achievement of a cumulative, three-year Adjusted EBITDA target measured fromJanuary 1, 2021 through December 31, 2023, and 79,784 PSUs that vest upon achievement of certain stock price hurdles for the period of the grant date throughDecember 31, 2023. All of the time-based RSUs vest on the third anniversary date of the grant date. Each of the time-based and performance-based awards aresubject to the recipient’s continued service with us, the terms and conditions of our stock option and incentive plan and the applicable award agreement.
The share-based compensation expense recognized in the condensed consolidated statements of operations was as follows: Three Months Ended Six Months Ended June 30, June 30,
2021 2020 2021 2020
(in thousands) Cost of goods sold $ 1,129 $ 465 $ 1,332 $ 636 General and administrative expenses 1,796 1,909 3,992 4,680
Total share-based compensation expense $ 2,925 $ 2,374 $ 5,324 $ 5,316 The share-based compensation expense recognized by award type was as follows: Three Months Ended Six Months Ended June 30, June 30,
2021 2020 2021 2020
(in thousands) RSUs $ 1,772 $ 1,181 $ 3,027 $ 2,137 Stock options 573 599 1,191 2,252 PSUs 580 594 1,106 927
Total share-based compensation expense $ 2,925 $ 2,374 $ 5,324 $ 5,316
14

TPI COMPOSITES, INC. AND SUBSIDIARIES
NOTES TO CONDENSED CONSOLIDATED FINANCIAL STATEMENTS
(Unaudited)
Note 7. Leases
We have operating and finance leases for our manufacturing facilities, warehouses, offices, automobiles and certain of our machinery and equipment. Our leaseshave remaining lease terms of between one and 15 years, some of which may include options to extend the leases up to five years.
The components of lease cost were as follows:
Three Months Ended Six Months Ended June 30, June 30,
2021 2020 2021 2020 (in thousands) Total operating lease cost $ 9,645 $ 9,148 $ 19,361 $ 17,719 Finance lease cost Amortization of assets under finance leases $ 906 $ 1,413 $ 1,806 $ 2,960 Interest on finance leases 169 256 358 535 Total finance lease cost $ 1,075 $ 1,669 $ 2,164 $ 3,495 Total lease assets and liabilities were as follows:
June 30, December 31, 2021 2020 (in thousands)
Operating Leases Operating lease right of use assets $ 148,991 $ 158,827 Current operating lease liabilities $ 23,100 $ 26,099 Noncurrent operating lease liabilities 152,059 155,925 Total operating lease liabilities $ 175,159 $ 182,024 Finance Leases Property, plant and equipment, gross $ 27,069 $ 28,462 Less: accumulated depreciation (13,341 ) (12,461 ) Total property, plant and equipment, net $ 13,728 $ 16,001 Current maturities of long-term debt $ 6,104 $ 6,018 Long-term debt, net of debt issuance costs and current maturities 3,337 6,371 Total finance lease liabilities $ 9,441 $ 12,389 Future minimum lease payments under noncancelable leases as of June 30, 2021 were as follows:
Operating Finance Leases Leases
(in thousands) Year Ending December 31, Remainder of 2021 $ 18,046 $ 2,955 2022 33,175 5,824 2023 31,374 904 2024 27,381 254 2025 27,076 37 Thereafter 100,393 7 Total future minimum lease payments 237,445 9,981 Less: interest (62,286 ) (540 ) Total lease liabilities $ 175,159 $ 9,441
15
TPI COMPOSITES, INC. AND SUBSIDIARIES
NOTES TO CONDENSED CONSOLIDATED FINANCIAL STATEMENTS
(Unaudited)
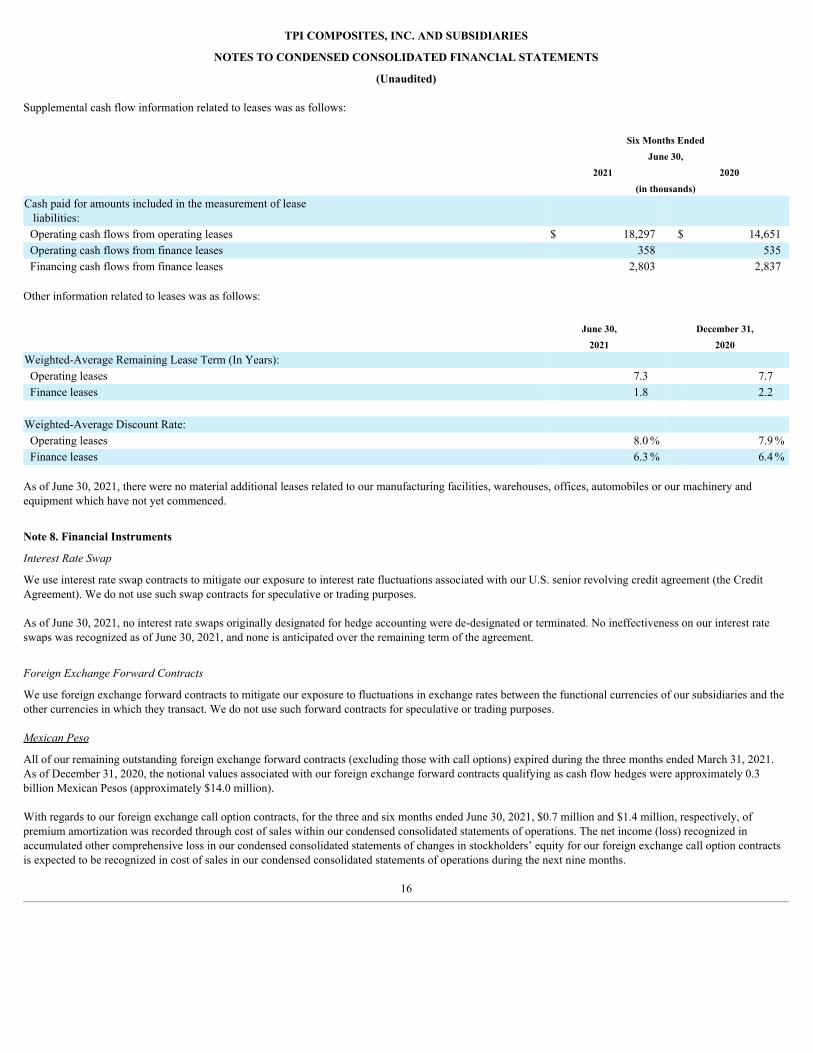
Supplemental cash flow information related to leases was as follows: Six Months Ended June 30, 2021 2020 (in thousands) Cash paid for amounts included in the measurement of lease liabilities: Operating cash flows from operating leases $ 18,297 $ 14,651 Operating cash flows from finance leases 358 535 Financing cash flows from finance leases 2,803 2,837 Other information related to leases was as follows: June 30, December 31, 2021 2020 Weighted-Average Remaining Lease Term (In Years): Operating leases 7.3 7.7 Finance leases 1.8 2.2 Weighted-Average Discount Rate: Operating leases 8.0% 7.9% Finance leases 6.3% 6.4% As of June 30, 2021, there were no material additional leases related to our manufacturing facilities, warehouses, offices, automobiles or our machinery andequipment which have not yet commenced.
Note 8. Financial Instruments
Interest Rate Swap
We use interest rate swap contracts to mitigate our exposure to interest rate fluctuations associated with our U.S. senior revolving credit agreement (the CreditAgreement). We do not use such swap contracts for speculative or trading purposes.
As of June 30, 2021, no interest rate swaps originally designated for hedge accounting were de-designated or terminated. No ineffectiveness on our interest rateswaps was recognized as of June 30, 2021, and none is anticipated over the remaining term of the agreement.
Foreign Exchange Forward Contracts
We use foreign exchange forward contracts to mitigate our exposure to fluctuations in exchange rates between the functional currencies of our subsidiaries and theother currencies in which they transact. We do not use such forward contracts for speculative or trading purposes.
Mexican Peso
All of our remaining outstanding foreign exchange forward contracts (excluding those with call options) expired during the three months ended March 31, 2021.As of December 31, 2020, the notional values associated with our foreign exchange forward contracts qualifying as cash flow hedges were approximately 0.3billion Mexican Pesos (approximately $14.0 million).
With regards to our foreign exchange call option contracts, for the three and six months ended June 30, 2021, $0.7 million and $1.4 million, respectively, ofpremium amortization was recorded through cost of sales within our condensed consolidated statements of operations. The net income (loss) recognized inaccumulated other comprehensive loss in our condensed consolidated statements of changes in stockholders’ equity for our foreign exchange call option contractsis expected to be recognized in cost of sales in our condensed consolidated statements of operations during the next nine months.
16

TPI COMPOSITES, INC. AND SUBSIDIARIES
NOTES TO CONDENSED CONSOLIDATED FINANCIAL STATEMENTS
(Unaudited)
As of June 30, 2021 and December 31, 2020, the notional values associated with our foreign exchange call option contracts qualifying as cash flow hedges wereapproximately 1.6 billion Mexican Pesos (approximately $79.7 million) and approximately 0.4 billion Mexican Pesos (approximately $17.3 million), respectively.
Chinese Renminbi
With regards to our foreign exchange forward contracts, for which hedge accounting does not apply, for the three and six months ended June 30, 2021, $0.5 millionand $0.6 million, respectively, in gains were recorded through foreign currency loss within our condensed consolidated statements of operations.
India Rupee
With regards to our foreign exchange forward contracts and our foreign exchange call option contracts, for which hedge accounting does not apply, for the threeand six months ended June 30, 2021, $0.5 million and $1.2 million, respectively, in gains were recorded through foreign currency loss within our condensedconsolidated statements of operations. Additionally, with regards to our foreign exchange call option contracts, for the three and six months ended June 30, 2021,$0.3 million and $0.3 million, respectively, of premium amortization was recorded as losses through foreign currency loss within our condensed consolidatedstatements of operations.
The fair values and location of our financial instruments in our condensed consolidated balance sheets were as follows: Condensed Consolidated June 30, December 31,
Financial Instrument Balance Sheet Line Item 2021 2020 (in thousands) Foreign exchange forward contracts Other current assets $ 1,706 $ 5,832 Foreign exchange forward contracts Accounts payable and accrued
expenses 1,218 2,096 Interest rate swap Other noncurrent liabilities 3,365 4,414 The following table presents the pretax amounts reclassified from accumulated other comprehensive loss into our condensed consolidated statements of operations:
Accumulated Condensed Consolidated Three Months Ended Six Months Ended Other Comprehensive Statement of Operations June 30, June 30,
Loss Component Line Item 2021 2020 2021 2020 (in thousands) Foreign exchange forward contracts Cost of sales $ (1,035 ) $ 2,738 $ (3,037 ) $ 2,516
Note 9. Income Taxes The income tax provisions for the three and six months ended June 30, 2021 were lower than for the corresponding periods in 2020 primarily due to the change inthe mix of earnings of foreign jurisdictions and U.S. tax on foreign earnings in the comparable periods, partially offset by the recording of a full U.S. valuationallowance during the three months ended June 30, 2021 and an increase in our uncertain tax positions for the three and six months ended June 30, 2021 ascompared to the same periods in 2020.
No changes in tax law occurred during the six months ended June 30, 2021, which had a material impact on our income tax provision. We do not record a deferredtax liability related to unremitted foreign earnings as we maintain our assertion to indefinitely reinvest our unremitted foreign earnings.
17

TPI COMPOSITES, INC. AND SUBSIDIARIES
NOTES TO CONDENSED CONSOLIDATED FINANCIAL STATEMENTS
(Unaudited)
Note 10. Net Income (Loss) Per Common Share
The following table sets forth the computation of basic and diluted net income (loss) per common share: Three Months Ended Six Months Ended June 30, June 30, 2021 2020 2021 2020 (in thousands, except per share data) Numerator: Net Loss $ (39,797 ) $ (66,101 ) $ (41,594 ) $ (66,593 ) Denominator: Basic weighted-average shares outstanding 36,881 35,299 36,742 35,256 Effect of dilutive awards — — — — Diluted weighted-average shares outstanding 36,881 35,299 36,742 35,256 Basic net loss per common share $ (1.08 ) $ (1.87 ) $ (1.13 ) $ (1.89 )Diluted net loss per common share $ (1.08 ) $ (1.87 ) $ (1.13 ) $ (1.89 ) Potentially dilutive shares excluded from the calculation due to net losses in the period 1,607 1,154 1,864 1,117 Anti dilutive share-based compensation awards excluded from the calculation — 6 — 55 Performance-based restricted stock units excluded from the calculation because the performance conditions had not been met 196 98 196 98
Note 11. Stockholders’ Equity
Accumulated Other Comprehensive Loss
The following tables presents the changes in accumulated other comprehensive loss (AOCL) by component: Six Months Ended June 30, 2021 Foreign Foreign currency exchange translation Interest rate forward Total adjustments swap contracts AOCL (in thousands) Balance at December 31, 2020 $ (30,111 ) $ (3,443 ) $ 564 $ (32,990 )
Other comprehensive income (loss) before reclassifications (5,291 ) 597 (2,281 ) (6,975 )Amounts reclassified from AOCL — — (2,002 ) (2,002 )Net tax effect — (139 ) 790 651
Net current period other comprehensive income (loss) (5,291 ) 458 (3,493 ) (8,326 )Balance at March 31, 2021 (35,402 ) (2,985 ) (2,929 ) (41,316 )
Other comprehensive income (loss) before reclassifications (4 ) 452 259 707 Amounts reclassified from AOCL — — (1,035 ) (1,035 )Net tax effect — (105 ) 190 85
Net current period other comprehensive income (loss) (4 ) 347 (586 ) (243 )Balance at June 30, 2021 $ (35,406 ) $ (2,638 ) $ (3,515 ) $ (41,559 )
18

TPI COMPOSITES, INC. AND SUBSIDIARIES
NOTES TO CONDENSED CONSOLIDATED FINANCIAL STATEMENTS
(Unaudited)
Six Months Ended June 30, 2020 Foreign Foreign currency exchange translation Interest rate forward Total adjustments swap contracts AOCL (in thousands) Balance at December 31, 2019 $ (22,012 ) $ (2,145 ) $ 545 $ (23,612 )
Other comprehensive income (loss) before reclassifications (9,223 ) (2,550 ) (6,936 ) (18,709 )Amounts reclassified from AOCL — — (222 ) (222 )Net tax effect — 535 1,503 2,038
Net current period other comprehensive income (loss) (9,223 ) (2,015 ) (5,655 ) (16,893 )Balance at March 31, 2020 (31,235 ) (4,160 ) (5,110 ) (40,505 )
Other comprehensive income (loss) before reclassifications (2,290 ) — 1,750 (540 )Amounts reclassified from AOCL — — 2,738 2,738 Net tax effect — — (938 ) (938 )
Net current period other comprehensive income (loss) (2,290 ) — 3,550 1,260 Balance at June 30, 2020 $ (33,525 ) $ (4,160 ) $ (1,560 ) $ (39,245 )
Note 12. Commitments and Contingencies
Legal Proceedings
From time to time, we are party to various lawsuits, claims, and other legal proceedings that arise in the ordinary course of business, some of which may not becovered by insurance. Upon resolution of any pending legal matters, we may incur charges in excess of presently established reserves. Our management does notbelieve that any such charges would, individually or in the aggregate, have a material adverse effect on our financial condition, results of operations or cash flows.
Note 13. Concentration of Customers
Net sales from certain customers (in thousands) in excess of 10 percent of our total consolidated net sales are as follows:
Three Months Ended Six Months Ended
June 30, June 30,
2021 2020 2021 2020
Customer Net sales % of Total Net sales % of Total Net sales % of Total Net sales % of Total
Vestas $ 208,787 45.5% $ 193,426 51.7% $ 378,005 43.8% $ 350,838 48.0%GE 105,937 23.1% 71,176 19.0% 210,789 24.4% 171,308 23.5%Nordex 81,505 17.8% 62,258 16.7% 158,048 18.3% 115,515 15.8% Trade accounts receivable from certain customers in excess of 10 percent of our total consolidated trade accounts receivable are as follows:
June 30, December 31, 2021 2020
Customer % of Total % of Total Nordex 36.5% 40.8%Vestas 32.9% 35.0%Siemens Gamesa 10.8% 5.9%
Note 14. Segment Reporting
Our operating segments are defined geographically into five geographic operating segments—(1) the United States (U.S.), (2) Asia, (3) Mexico, (4) EMEA and (5)India. For a detailed discussion of our operating segments, refer to the discussion in Note 19, Segment Reporting, to the Notes to Consolidated Financial Statementswithin our Annual Report on Form 10-K.
All of our segments operate in their local currency except for the Mexico and Asia segments, which both include a U.S. parent company, and India andSwitzerland, which operate in the U.S. dollar.
19

TPI COMPOSITES, INC. AND SUBSIDIARIES
NOTES TO CONDENSED CONSOLIDATED FINANCIAL STATEMENTS
(Unaudited)
The following tables set forth certain information regarding each of our segments:
Three Months Ended Six Months Ended June 30, June 30,
2021 2020 2021 2020 (in thousands) Net sales by segment:
U.S. $ 56,761 $ 42,079 $ 106,047 $ 89,510 Asia 91,106 145,918 168,034 237,055 Mexico 143,170 83,420 261,629 201,670 EMEA 105,350 87,541 217,716 176,498 India 62,454 14,859 110,095 25,720
Total net sales $ 458,841 $ 373,817 $ 863,521 $ 730,453 Net sales by geographic location :
United States $ 56,761 $ 42,079 $ 106,047 $ 89,510 China 91,106 145,918 168,034 237,055 Mexico 143,170 83,420 261,629 201,670 Turkey 105,350 87,541 217,716 176,498 India 62,454 14,859 110,095 25,720
Total net sales $ 458,841 $ 373,817 $ 863,521 $ 730,453 Income (loss) from operations:
U.S. $ 148 $ (12,045 ) $ (11,472 ) $ (27,631 )Asia 8,105 18,492 10,814 23,564 Mexico (25,256 ) (11,324 ) (29,280 ) (13,092 )EMEA 10,782 (1,145 ) 20,570 1,519 India 4,188 (7,233 ) 4,128 (13,019 )
Total loss from operations $ (2,033 ) $ (13,255 ) $ (5,240 ) $ (28,659 ) June 30, December 31, 2021 2020 (in thousands) Property, plant and equipment, net:
U.S. $ 33,246 $ 31,811 Asia (China) 41,143 46,075 Mexico 78,839 78,813 EMEA (Turkey) 22,154 28,312 India 30,334 23,990
Total property, plant and equipment, net $ 205,716 $ 209,001
(1) Net sales are attributable to countries based on the location where the product is manufactured or the services are performed.
(2) The losses from operations in our U.S. segment includes corporate general and administrative costs of $6.7 million and $6.9 million for the three months endedJune 30, 2021 and 2020, respectively, and $15.6 million and $16.4 million for the six months ended June 30, 2021 and 2020, respectively.
20
(1)
(2)

ITEM 2. MANAGEMENT’S DISCUSSION AND ANALYSIS OF FINANCIAL CONDITION AND RESULTS OF OPERATIONS
You should read the following discussion and analysis of our financial condition and results of operations together with our condensed consolidated financialstatements and the related notes and other financial information appearing elsewhere in this Quarterly Report on Form 10-Q (Form 10-Q). Some of theinformation contained in this discussion and analysis or set forth elsewhere in this Form 10-Q, including information with respect to plans and strategy for ourbusiness, includes forward-looking statements that involve risks and uncertainties. Our actual results could differ materially from those described in or implied bythese forward-looking statements as a result of various factors, including those discussed below and elsewhere in this Form 10-Q or in our previously filed AnnualReport on Form 10-K, particularly those under “Risk Factors.”
OVERVIEW
Our Company
We are the only independent manufacturer of composite wind blades for the wind energy market with a global manufacturing footprint. We deliver high-quality,cost-effective composite solutions through long term relationships with leading original equipment manufacturers (OEM) in the wind and transportation markets.We also provide field service inspection and repair services to our OEM customers and wind farm owners and operators, and supply high strength, lightweight anddurable composite products to the transportation market. We are headquartered in Scottsdale, Arizona and operate factories throughoutthe U.S., China, Mexico, Turkey, and India. We operate additional engineering development centers in Denmark and Germany.
Our business operations are defined geographically into five geographic operating segments—(1) the United States (U.S.), (2) Asia, (3) Mexico, (4) Europe, theMiddle East and Africa (EMEA) and (5) India. See Note 14, Segment Reporting, to our condensed consolidated financial statements for more details about ouroperating segments.
KEY TRENDS AND RECENT DEVELOPMENTS AFFECTING OUR BUSINESS
The COVID-19 pandemic did not materially adversely affect our business and operations during the three and six months ended June 30, 2021. Although all of ourmanufacturing facilities currently are operating at or near normal production levels, we may be required to reinstate temporary production suspensions or volumereductions at our manufacturing facilities to the extent there are new resurgences of COVID-19 cases in the regions where we operate or there is an outbreak ofpositive COVID-19 cases in any of our manufacturing facilities. For example, India and Turkey recently experienced significant increases in positive COVID-19cases although these resurgences did not have a material impact on our operations during the three months ended June 30, 2021. In addition, although we currentlyhave not experienced any significant disruptions in our global supply chain due to the COVID-19 pandemic, our global supply chain may in the future be adverselyaffected if the COVID-19 pandemic persists. We expect decreased demand for our wind blades from our customers during the remainder of 2021, in particular during the fourth quarter. We believe thisdecrease in demand is short term and due to the continued global renewable energy regulatory and policy uncertainty and raw material cost increases mentionedbelow. The result is an expected adverse impact to our Adjusted EBITDA in 2021 of approximately $28 million. We believe that general optimism aroundpotential legislation in the U.S. to extend the Production Tax Credit (PTC) on a long-term basis is causing developers to reevaluate project timelines in anticipationof being able to build projects at higher PTC levels once the expected extensions are in place and therefore are not purchasing wind blades or turbines to satisfycurrent PTC safe harbor requirements. In 2021, there have been both significant price increases and supply constraints with respect to resin and carbon fiber, which are key raw materials that we use tomanufacture our products, as well as increases in logistics costs to obtain raw materials. The resin price increases and supply constraints are due to a multitude offactors, including the extreme cold weather in Texas in February 2021, fires at resin manufacturing facilities in China and unplanned maintenance outages at resinmanufacturing facilities in Europe. Carbon fiber prices have increased primarily due to the cost of raw material inputs as well as increased global demand forcarbon fiber across multiple industries. These raw material price increases adversely affected our results of operations by approximately $4.4 million for both thethree and six months ended June 30, 2021. We expect that the price of resin and carbon fiber will remain at elevated levels for the remainder of 2021.Approximately 55% of the resin and resin systems we use are purchased under contracts either controlled or borne by two of our customers and therefore thesecustomers receive/bear 100% of any increase in resin prices. With respect to our other customer supply agreements, our customers typically bear 70% of any rawmaterial price increases. After taking into account our contractual share of any price increases for resin and carbon fiber, we estimate that the impact of these rawmaterials price increases, together with increased logistics costs, will adversely impact our results of operations by approximately $20 million for 2021. If thesupply of resin feedstocks and carbon fiber continue to be constrained for an extended period of time, such shortages could impact our ability to meet ourcustomers’ forecasted demand for our products for the remainder of 2021 and have a further material adverse impact on our results of operations for the remainderof 2021.
21

We are forecasting to incur a total of between $22 million and $37 million of restructuring charges associated with our global footprint alignment and consolidationin 2021 and 2022 relating to our China and North America operations. Between $15 million and $22 million of the total is forecasted to be incurred in 2021, withthe remainder in 2022. We are forecasting that between 20% to 30% of the restructuring charges will be non-cash. In July 2021, we commenced supplying wind blades to one of our customers at a manufacturing facility in Matamoros, Mexico pursuant to a 3-year supplyagreement. In connection with the supply agreement, we will, among other things, (1) operate the manufacturing facility, and (2) utilize our workforce, procureraw materials and manufacture blades for the customer. The customer will resume management and operation of the wind blade manufacturing facility at the endof the 3-year term if the supply agreement is not extended and we will cease to operate and supply blades from the customer’s manufacturing facility.
KEY METRICS USED BY MANAGEMENT TO MEASURE PERFORMANCE
For a detailed discussion of our key financial measures and our key operating metrics, refer to the discussion in “Management’s Discussion and Analysis ofFinancial Condition and Results of Operations – Key Metrics Used By Management To Measure Performance” included in Part II, Item 7 of our Annual Report onForm 10-K.
KEY FINANCIAL MEASURES
Three Months Ended Six Months Ended June 30, June 30,
2021 2020 2021 2020 (in thousands) Net sales $ 458,841 $ 373,817 $ 863,521 $ 730,453 Net loss $ (39,797 ) $ (66,101 ) $ (41,594 ) $ (66,593 )EBITDA $ 4,285 $ (2,628 ) $ 9,699 $ (5,349 )Adjusted EBITDA $ 17,361 $ 3,295 $ 30,456 $ 4,591 Capital expenditures $ 27,059 $ 42,030 Free cash flow $ (30,314 ) $ (69,035 ) June 30, December 31, 2021 2020 (in thousands) Total debt, net of debt issuance costs $ 236,275 $ 216,867 Net debt $ (113,991 ) $ (88,061 )
(1) See below for a reconciliation of EBITDA, adjusted EBITDA, free cash flow and net debt to net income (loss), net income (loss), net cash provided by (usedin) operating activities and total debt, net of debt issuance costs, respectively, the most directly comparable financial measures calculated and presented inaccordance with GAAP.
22
(1)
(1)
(1)
(1)

The following tables reconcile our non-GAAP key financial measures to the most directly comparable GAAP measures:
EBITDA and adjusted EBITDA are reconciled as follows: Three Months Ended Six Months Ended June 30, June 30, 2021 2020 2021 2020 (in thousands) Net loss $ (39,797 ) $ (66,101 ) $ (41,594 ) $ (66,593 )Adjustments:
Depreciation and amortization 12,501 11,616 24,110 22,644 Interest expense, net 2,691 2,545 5,395 4,316 Income tax provision 28,890 49,312 21,788 34,284
EBITDA 4,285 (2,628 ) 9,699 (5,349 )Share-based compensation expense 2,925 2,374 5,324 5,316 Foreign currency loss 6,504 1,928 10,231 968 Loss on sale of assets and asset impairments 1,451 1,440 2,748 3,358 Restructuring charges, net 2,196 181 2,454 298
Adjusted EBITDA $ 17,361 $ 3,295 $ 30,456 $ 4,591 Free cash flow is reconciled as follows: Six Months Ended June 30, 2021 2020 (in thousands) Net cash used in operating activities $ (3,255 ) $ (27,005 )Less capital expenditures (27,059 ) (42,030 )Free cash flow $ (30,314 ) $ (69,035 ) Net debt is reconciled as follows: June 30, December 31, 2021 2020 (in thousands) Cash and cash equivalents $ 123,107 $ 129,857 Less total debt, net of debt issuance costs (236,275 ) (216,867 )Less debt issuance costs (823 ) (1,051 )Net debt $ (113,991 ) $ (88,061 )
KEY OPERATING METRICS
Three Months Ended Six Months Ended June 30, June 30, 2021 2020 2021 2020
Sets 843 788 1,657 1,519 Estimated megawatts 3,303 2,655 6,375 4,984 Utilization 82% 70% 80% 70%Dedicated manufacturing lines 50 52 50 52 Manufacturing lines installed 51 54 52 54
23

RESULTS OF OPERATIONS
The following table summarizes our operating results as a percentage of net sales for the three and six months ended June 30, 2021 and 2020 that have beenderived from our condensed consolidated statements of operations: Three Months Ended Six Months Ended June 30, June 30, 2021 2020 2021 2020 Net sales 100.0 % 100.0 % 100.0 % 100.0 %Cost of sales 96.0 98.4 95.4 98.0 Startup and transition costs 2.2 2.9 2.8 3.2
Total cost of goods sold 98.2 101.3 98.2 101.2 Gross profit (loss) 1.8 (1.3 ) 1.8 (1.2 )
General and administrative expenses 1.5 1.8 1.8 2.2 Loss on sale of assets and asset impairments 0.3 0.4 0.3 0.5 Restructuring charges, net 0.5 0.1 0.3 0.0
Loss from operations (0.5 ) (3.6 ) (0.6 ) (3.9 ) Total other expense (1.9 ) (0.9 ) (1.7 ) (0.5 )
Loss before income taxes (2.4 ) (4.5 ) (2.3 ) (4.4 ) Income tax provision (6.3 ) (13.2 ) (2.5 ) (4.7 )
Net loss (8.7 ) % (17.7 ) % (4.8 ) % (9.1 ) %
Net sales
Consolidated discussion
The following table summarizes our net sales by product/service for the three and six months ended June 30, 2021 and 2020: Three Months Ended Six Months Ended June 30, Change June 30, Change 2021 2020 $ % 2021 2020 $ % (in thousands) (in thousands) Wind blade sales $ 418,704 $ 348,063 $ 70,641 20.3% $ 797,883 $ 684,400 $ 113,483 16.6%Precision molding and assembly systems sales 13,603 6,894 6,709 97.3% 22,530 13,657 8,873 65.0%Transportation sales 14,915 14,902 13 0.1% 23,046 21,791 1,255 5.8%Other sales 11,619 3,958 7,661 193.6% 20,062 10,605 9,457 89.2%Total net sales $ 458,841 $ 373,817 $ 85,024 22.7% $ 863,521 $ 730,453 $ 133,068 18.2% The increase in net sales of wind blades during the three and six months ended June 30, 2021 as compared to the same periods in 2020 was primarily driven by a7% and 9% increase in the number of wind blades produced, respectively, primarily as a result of increased production at our Mexico, India, Turkey and Iowafacilities. The increase was also due to a higher average sales price due to the mix of wind blade models produced during the three and six months ended June 30,2021 as compared to the same periods in 2020 and foreign currency fluctuations. Additionally, when comparing our net sales during the three and six monthsended June 30, 2021 against the comparable prior year periods, our net sales were negatively impacted by the removal of five contracted manufacturing lines thatexpired in China at the end of 2020, which was partially offset by the adverse impact that the COVID-19 pandemic had on our net sales in the prior year periods.Finally, the net sales increases in both periods were partially offset by a decrease in the year over year number of wind blades still in the production process at theend of the periods. The fluctuating U.S. dollar against the Euro in our Turkey operations and the Chinese Renminbi in our China operations had a favorable impactof 1.8% and 1.7% on consolidated net sales for the three and six months ended June 30, 2021, respectively, as compared to the 2020 periods.
24

Segment discussion
The following table summarizes our net sales by our five geographic operating segments for the three and six months ended June 30, 2021 and 2020: Three Months Ended Six Months Ended June 30, Change June 30, Change 2021 2020 $ % 2021 2020 $ % (in thousands) (in thousands) U.S. $ 56,761 $ 42,079 $ 14,682 34.9% $ 106,047 $ 89,510 $ 16,537 18.5%Asia 91,106 145,918 (54,812 ) -37.6% 168,034 237,055 (69,021 ) -29.1%Mexico 143,170 83,420 59,750 71.6% 261,629 201,670 59,959 29.7%EMEA 105,350 87,541 17,809 20.3% 217,716 176,498 41,218 23.4%India 62,454 14,859 47,595 NM 110,095 25,720 84,375 NM Total net sales $ 458,841 $ 373,817 $ 85,024 22.7% $ 863,521 $ 730,453 $ 133,068 18.2%NM - not meaningful
U.S. Segment
The following table summarizes our net sales by product/service for the U.S. segment for the three and six months ended June 30, 2021 and 2020: Three Months Ended Six Months Ended June 30, Change June 30, Change 2021 2020 $ % 2021 2020 $ % (in thousands) (in thousands) Wind blade sales $ 39,427 $ 26,309 $ 13,118 49.9% $ 79,054 $ 62,242 $ 16,812 27.0%Transportation sales 12,227 14,539 (2,312 ) -15.9% 18,651 21,218 (2,567 ) -12.1%Other sales 5,107 1,231 3,876 NM 8,342 6,050 2,292 37.9%Total net sales $ 56,761 $ 42,079 $ 14,682 34.9% $ 106,047 $ 89,510 $ 16,537 18.5% The increase in the U.S. segment’s net sales of wind blades during the three and six months ended June 30, 2021 as compared to the same periods in 2020 wasprimarily due to a 35% and 17% increase in the number of wind blades produced, respectively, primarily due to the adverse impact of the COVID-19 pandemic inthe prior year periods, as well as a higher average sales price of wind blade models produced in the two comparative periods.
Asia Segment
The following table summarizes our net sales by product/service for the Asia segment for the three and six months ended June 30, 2021 and 2020: Three Months Ended Six Months Ended June 30, Change June 30, Change 2021 2020 $ % 2021 2020 $ % (in thousands) (in thousands) Wind blade sales $ 82,491 $ 141,540 $ (59,049 ) -41.7% $ 154,994 $ 227,416 $ (72,422 ) -31.8%Precision molding and assembly systems sales 7,634 3,576 4,058 113.5% 11,598 8,637 2,961 34.3%Other sales 981 802 179 22.3% 1,442 1,002 440 43.9%Total net sales $ 91,106 $ 145,918 $ (54,812 ) -37.6% $ 168,034 $ 237,055 $ (69,021 ) -29.1% The decrease in the Asia segment’s net sales of wind blades during the three months ended June 30, 2021 as compared to the same period in 2020 was primarilydue to a 52% decrease in the number of wind blades produced, primarily due to the removal of five contracted manufacturing lines that expired in China at the endof 2020. The sales decrease during the three months ended June 30, 2021 was partially offset by an increase in the average sales price of wind blades due to achange in the mix of wind blades produced in the two comparative periods. Additionally, for the three months ended June 30, 2021, there was an increase in theperiod over period number of wind blades still in the production process at the end of the period. The fluctuating U.S. dollar against the Chinese Renminbi in ourChina operations had a favorable impact of 0.1% on consolidated net sales for the three months ended June 30, 2021 as compared to the 2020 period.
25
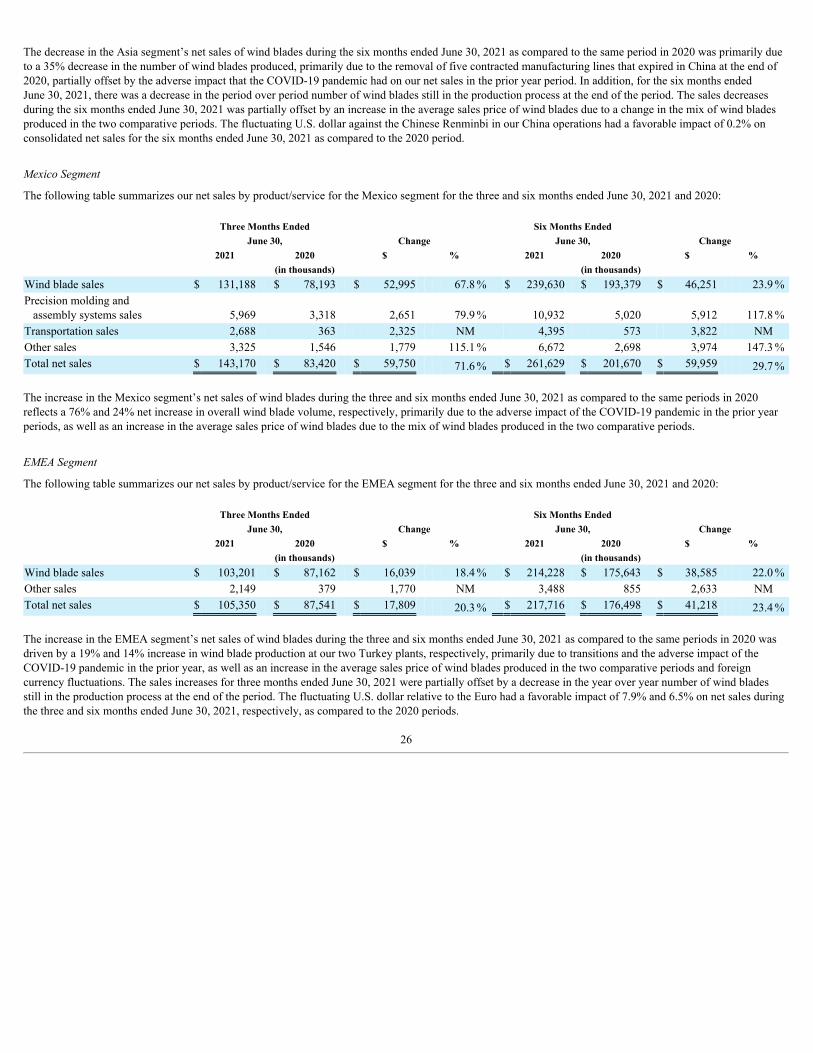
The decrease in the Asia segment’s net sales of wind blades during the six months ended June 30, 2021 as compared to the same period in 2020 was primarily dueto a 35% decrease in the number of wind blades produced, primarily due to the removal of five contracted manufacturing lines that expired in China at the end of2020, partially offset by the adverse impact that the COVID-19 pandemic had on our net sales in the prior year period. In addition, for the six months endedJune 30, 2021, there was a decrease in the period over period number of wind blades still in the production process at the end of the period. The sales decreasesduring the six months ended June 30, 2021 was partially offset by an increase in the average sales price of wind blades due to a change in the mix of wind bladesproduced in the two comparative periods. The fluctuating U.S. dollar against the Chinese Renminbi in our China operations had a favorable impact of 0.2% onconsolidated net sales for the six months ended June 30, 2021 as compared to the 2020 period.
Mexico Segment
The following table summarizes our net sales by product/service for the Mexico segment for the three and six months ended June 30, 2021 and 2020: Three Months Ended Six Months Ended June 30, Change June 30, Change 2021 2020 $ % 2021 2020 $ % (in thousands) (in thousands) Wind blade sales $ 131,188 $ 78,193 $ 52,995 67.8% $ 239,630 $ 193,379 $ 46,251 23.9%Precision molding and assembly systems sales 5,969 3,318 2,651 79.9% 10,932 5,020 5,912 117.8%Transportation sales 2,688 363 2,325 NM 4,395 573 3,822 NM Other sales 3,325 1,546 1,779 115.1% 6,672 2,698 3,974 147.3%Total net sales $ 143,170 $ 83,420 $ 59,750 71.6% $ 261,629 $ 201,670 $ 59,959 29.7% The increase in the Mexico segment’s net sales of wind blades during the three and six months ended June 30, 2021 as compared to the same periods in 2020reflects a 76% and 24% net increase in overall wind blade volume, respectively, primarily due to the adverse impact of the COVID-19 pandemic in the prior yearperiods, as well as an increase in the average sales price of wind blades due to the mix of wind blades produced in the two comparative periods.
EMEA Segment
The following table summarizes our net sales by product/service for the EMEA segment for the three and six months ended June 30, 2021 and 2020: Three Months Ended Six Months Ended June 30, Change June 30, Change 2021 2020 $ % 2021 2020 $ % (in thousands) (in thousands) Wind blade sales $ 103,201 $ 87,162 $ 16,039 18.4% $ 214,228 $ 175,643 $ 38,585 22.0%Other sales 2,149 379 1,770 NM 3,488 855 2,633 NM Total net sales $ 105,350 $ 87,541 $ 17,809 20.3% $ 217,716 $ 176,498 $ 41,218 23.4% The increase in the EMEA segment’s net sales of wind blades during the three and six months ended June 30, 2021 as compared to the same periods in 2020 wasdriven by a 19% and 14% increase in wind blade production at our two Turkey plants, respectively, primarily due to transitions and the adverse impact of theCOVID-19 pandemic in the prior year, as well as an increase in the average sales price of wind blades produced in the two comparative periods and foreigncurrency fluctuations. The sales increases for three months ended June 30, 2021 were partially offset by a decrease in the year over year number of wind bladesstill in the production process at the end of the period. The fluctuating U.S. dollar relative to the Euro had a favorable impact of 7.9% and 6.5% on net sales duringthe three and six months ended June 30, 2021, respectively, as compared to the 2020 periods.
26

India Segment
The following table summarizes our net sales by product/service for the India segment for the three and six months ended June 30, 2021 and 2020: Three Months Ended Six Months Ended June 30, Change June 30, Change 2021 2020 $ % 2021 2020 $ % (in thousands) (in thousands) Wind blade sales $ 62,397 $ 14,859 $ 47,538 NM $ 109,977 $ 25,720 $ 84,257 NMOther sales 57 — 57 NM 118 — 118 NMTotal net sales $ 62,454 $ 14,859 $ 47,595 NM $ 110,095 $ 25,720 $ 84,375 NM The increase in the India segment’s net sales of wind blades during the three and six months ended June 30, 2021 as compared to the same period in 2020 wasdriven by the commencement of production in 2020, and the ramp up of such production in 2021.
Total cost of goods sold
The following table summarizes our total cost of goods sold for the three and six months ended June 30, 2021 and 2020: Three Months Ended Six Months Ended June 30, Change June 30, Change 2021 2020 $ % 2021 2020 $ % (in thousands) (in thousands) Cost of sales $ 440,416 $ 367,644 $ 72,772 19.8% $ 823,472 $ 716,119 $ 107,353 15.0% Startup costs 4,504 6,897 (2,393 ) -34.7% 9,056 14,753 (5,697 ) -38.6% Transition costs 5,595 4,023 1,572 39.1% 15,397 8,201 7,196 87.7% Total startup and transition costs 10,099 10,920 (821 ) -7.5% 24,453 22,954 1,499 6.5% Total cost of goods sold $ 450,515 $ 378,564 $ 71,951 19.0% $ 847,925 $ 739,073 $ 108,852 14.7% % of net sales 98.2% 101.3% -3.1% 98.2% 101.2% -3.0% Total cost of goods sold as a percentage of net sales decreased by approximately three percentage points during the three and six months ended June 30, 2021 ascompared to the same periods in 2020, driven primarily by a decrease in warranty costs and direct labor costs, partially offset by an increase in direct material costsand foreign currency fluctuations. The fluctuating U.S. dollar against the Euro, Turkish Lira, Chinese Renminbi and Mexican Peso had an unfavorable impact of2.2% and 1.7% on consolidated cost of goods sold for the three and six months ended June 30, 2021, respectively, as compared to the 2020 periods.
General and administrative expenses
The following table summarizes our general and administrative expenses for the three and six months ended June 30, 2021 and 2020: Three Months Ended Six Months Ended June 30, Change June 30, Change 2021 2020 $ % 2021 2020 $ % (in thousands) (in thousands) General and administrative expenses $ 6,712 $ 6,887 $ (175 ) -2.5% $ 15,634 $ 16,383 $ (749 ) -4.6% % of net sales 1.5% 1.8% -0.3% 1.8% 2.2% -0.4% The decreases in general and administrative expenses as a percentage of net sales for the three and six months ended June 30, 2021 as compared to the sameperiods in 2020 were primarily driven by our continued focus on reducing costs.
Restructuring costs, net The increases in restructuring costs, net for the three and six months ended June 30, 2021 as compared to the same periods in 2020 were associated with theoptimization of our global footprint, comprised of $2.2 million and $2.5 million, respectively, of severance benefits to terminated employees. All severancebenefits were paid to the terminated employees by the end of July 2021.
27

Income (loss) from operations
Segment discussion
The following table summarizes our income (loss) from operations by our five geographic operating segments for the three and six months ended June 30, 2021and 2020: Three Months Ended Six Months Ended June 30, Change June 30, Change 2021 2020 $ % 2021 2020 $ % (in thousands) (in thousands) U.S. $ 148 $ (12,045 ) $ 12,193 101.2% $ (11,472 ) $ (27,631 ) $ 16,159 58.5%Asia 8,105 18,492 (10,387 ) -56.2% 10,814 23,564 (12,750 ) -54.1%Mexico (25,256 ) (11,324 ) (13,932 ) -123.0% (29,280 ) (13,092 ) (16,188 ) -123.6%EMEA 10,782 (1,145 ) 11,927 NM 20,570 1,519 19,051 NM India 4,188 (7,233 ) 11,421 157.9% 4,128 (13,019 ) 17,147 131.7%Total loss from operations $ (2,033 ) $ (13,255 ) $ 11,222 84.7% $ (5,240 ) $ (28,659 ) $ 23,419 81.7% % of net sales -0.4% -3.5% 3.1% -0.6% -3.9% 3.3%
U.S. Segment
The decrease in the loss from operations in the U.S. segment for the three and six months ended June 30, 2021 as compared to the same periods in 2020 wasprimarily due to the increase in wind blade volume, an increase in the average sales price of wind blades and a decrease in direct labor costs, partially offset by anincrease in direct material costs at our Newton, Iowa blade facility.
Asia Segment
The decrease in the income from operations in the Asia segment for the three and six months ended June 30, 2021 as compared to the same periods in 2020 wasprimarily due to the decrease in the net sales of wind blades and foreign currency fluctuations, partially offset by an increase in the average sales price of windblades. In addition, for the six months ended June 30, 2021, there was a decrease in startup and transition costs. The fluctuating U.S. dollar against the ChineseRenminbi had an unfavorable impact of 6.7% and 6.5% on cost of goods sold for the three and six months ended June 30, 2021, respectively, as compared to the2020 periods.
Mexico Segment
The increase in the loss from operations in the Mexico segment for the three and six months ended June 30, 2021 as compared to the same periods in 2020 wasprimarily due to an increase in direct material costs and startup and transition costs, partially offset by the increase in wind blade volume and an increase in theaverage sales price of wind blades. In addition, for the three and six months ended June 30, 2021, there was an increase and a decrease, respectively, in warrantycosts as compared to the 2020 periods. The fluctuating U.S. dollar relative to the Mexican Peso had an unfavorable impact of 2.1% and 1.1% on cost of goods soldfor the three and six months ended June 30, 2021, respectively, as compared to the 2020 periods.
EMEA Segment
The increase in the income from operations in the EMEA segment for the three and six months ended June 30, 2021 as compared to the same periods in 2020 wasprimarily driven by increased wind blade production at our two Turkey manufacturing facilities, an increase in the average sales price of wind blades, and adecrease in warranty costs. In addition, for the three months ended June 30, 2021, there was a decrease in startup and transition costs as compared to the 2020period. Additionally, for the six months ended June 30, 2021, there was an increase in direct material costs as compared to the 2020 period. The fluctuating U.S.dollar relative to the Turkish Lira and Euro had an unfavorable impact of 1.1% and 0.4% on cost of goods sold for the three and six months ended June 30, 2021,respectively, as compared to the 2020 periods.
India Segment
The increase in the income from operations in the India segment for the three and six months ended June 30, 2021 as compared to the same periods in 2020 wasdriven by the commencement of production in 2020, and the ramp up of such production in 2021.
28

Other income (expense)
The following table summarizes our total other income (expense) for the three and six months ended June 30, 2021 and 2020: Three Months Ended Six Months Ended June 30, Change June 30, Change 2021 2020 $ % 2021 2020 $ % (in thousands) (in thousands) Interest expense, net $ (2,691 ) $ (2,545 ) $ (146 ) -5.7% $ (5,395 ) $ (4,316 ) $ (1,079 ) -25.0% Foreign currency loss (6,504 ) (1,928 ) (4,576 ) NM (10,231 ) (968 ) (9,263 ) NM Miscellaneous income 321 939 (618 ) -65.8% 1,060 1,634 (574 ) -35.1% Total other expense $ (8,874 ) $ (3,534 ) $ (5,340 ) -151.1% $ (14,566 ) $ (3,650 ) $ (10,916 ) NM The increase in the total other expense for the three and six months ended June 30, 2021 as compared to the same periods in 2020 were primarily due to an increasein the foreign currency loss primarily due to net Euro liability exposure against the Turkish Lira in the current year periods as compared to the same periods in2020.
Income taxes
The following table summarizes our income taxes for the three and six months ended June 30, 2021 and 2020: Three Months Ended Six Months Ended June 30, Change June 30, Change 2021 2020 $ % 2021 2020 $ % (in thousands) (in thousands) Income tax provision $ (28,890 ) $ (49,312 ) $ 20,422 41.4% $ (21,788 ) $ (34,284 ) $ 12,496 36.4% Effective tax rate -264.9% -293.7% -110.0% -106.1% See Note 9, Income Taxes, to our condensed consolidated financial statements for more details about our income taxes for the three and six months ended June 30,2021 and 2020.
Net loss
The following table summarizes our net loss for the three and six months ended June 30, 2021 and 2020: Three Months Ended Six Months Ended June 30, Change June 30, Change 2021 2020 $ % 2021 2020 $ % (in thousands) (in thousands) Net loss $ (39,797 ) $ (66,101 ) $ 26,304 39.8% $ (41,594 ) $ (66,593 ) $ 24,999 37.5%
The decrease in the net loss for the three and six months ended June 30, 2021 as compared to the same periods in 2020 was primarily due to the reasons set forthabove. The diluted net loss per share was $1.08 for the three months ended June 30, 2021, compared to a diluted net loss per share of $1.87 for the three monthsended June 30, 2020. The diluted net loss per share was $1.13 for the six months ended June 30, 2021, compared to a diluted net loss per share of $1.89 for the sixmonths ended June 30, 2020.
LIQUIDITY AND CAPITAL RESOURCES
As a result of the uncertainty relating to: (i) the evolving nature, magnitude and duration of the COVID-19 pandemic, (ii) the variety of measures implemented bygovernments around the world to address its effects and (iii) the impact on our manufacturing operations, we have and will continue to manage our liquidity toensure our long-term viability until the COVID-19 pandemic abates.
Our primary needs for liquidity have been, and in the future will continue to be, capital expenditures, new facility startup costs, the impact of transitions, workingcapital, debt service costs, warranty costs and restructuring costs associated with the optimization of our global footprint. Our capital expenditures have beenprimarily related to machinery and equipment at our new facilities and expansion and improvements at our existing facilities. Historically, we have funded ourworking capital needs through cash flows from operations, the proceeds received from our credit facilities and from proceeds received from the issuance of stock.We had net proceeds under our financing arrangements of $19.0 million for the six months ended June 30, 2021 as compared to net proceeds under our financingarrangements of $97.1 million in the comparable period of 2020. As of June 30, 2021 and December 31, 2020, we had $237.1 million and $217.9 million inoutstanding indebtedness, excluding debt issuance costs, respectively. As of June 30, 2021,
29

we had an aggregate of $115.9 million of remaining capacity and $91.1 million of remaining availability under our various credit facilities. Working capitalrequirements have increased as a result of our overall growth and the need to fund higher accounts receivable and inventory levels as our business volumes haveincreased, as well as increased raw material costs primarily related to resin, carbon fiber and logistics. Based upon current and anticipated levels of operations, webelieve that cash on hand, available credit facilities and cash flows from operations will be adequate to fund our working capital and capital expenditurerequirements and to make required payments of principal and interest on our indebtedness over the next twelve months.
We anticipate that any new facilities and future facility expansions will be funded through cash flows from operations, the incurrence of other indebtedness andother potential sources of liquidity. At June 30, 2021 and December 31, 2020, we had unrestricted cash, cash equivalents and short-term investments totaling$123.1 million and $129.9 million, respectively. The June 30, 2021 balance includes $67.9 million of cash located outside of the United States, including$58.7 million in China, $5.1 million in Turkey, $2.3 million in Mexico, $1.5 million in India, and $0.3 million in other countries.
Our ability to repatriate funds from China is subject to a number of restrictions imposed by the Chinese government. We repatriate funds through severaltechnology license and corporate/administrative service agreements. We are compensated quarterly based on agreed upon royalty rates for such intellectualproperty licenses and quarterly fees for those services. Certain of our subsidiaries are limited in their ability to declare dividends without first meeting statutoryrestrictions of China, including retained earnings as determined under Chinese-statutory accounting requirements. Until 50% ($26.6 million as of June 30, 2021and December 31, 2020) of registered capital is contributed to a surplus reserve, our China operations can only pay dividends equal to 90% of after-tax profits(10% must be contributed to the surplus reserve). Once the surplus reserve fund requirement is met, our China operations can pay dividends equal to 100% of after-tax profit assuming other conditions are met. At June 30, 2021 and December 31, 2020, the amount of the surplus reserve fund was $9.4 million and $7.0 million,respectively. In July 2021, China paid a dividend of approximately $19.5 million, net of withholding taxes, to our subsidiary in Switzerland.
Financing Facilities
Our total principal amount of debt outstanding as of June 30, 2021 was $237.1 million, including our Credit Agreement, secured and unsecured financingagreements and equipment finance leases. See Note 5, Long-Term Debt, Net of Current Maturities, to our condensed consolidated financial statements for moredetails on our debt balances.
Cash Flow Discussion
The following table summarizes our key cash flow activity for the six months ended June 30, 2021 and 2020: Six Months Ended June 30, 2021 2020 $ Change (in thousands) Net cash used in operating activities $ (3,255 ) $ (27,005 ) $ 23,750 Net cash used in investing activities (27,059 ) (42,030 ) 14,971 Net cash provided by financing activities 23,702 97,255 (73,553 )Impact of foreign exchange rates on cash, cash equivalents and restricted cash (323 ) (2,525 ) 2,202 Net change in cash, cash equivalents and restricted cash $ (6,935 ) $ 25,695 $ (32,630 )
Operating Cash Flows
Net cash used in operating activities decreased by $23.8 million for the six months ended June 30, 2021 as compared to the same period in 2020 primarily as aresult of higher operating results and favorable working capital usage.
Investing Cash Flows
Net cash used in investing activities decreased by $15.0 million for the six months ended June 30, 2021 as compared to the same period in 2020 as a result of adecrease in capital expenditures.
We anticipate fiscal year 2021 capital expenditures of between $55 million to $65 million and we estimate that the cost that we will incur after June 30, 2021 tocomplete our current projects in process will be approximately $8.5 million. We have used, and will
30
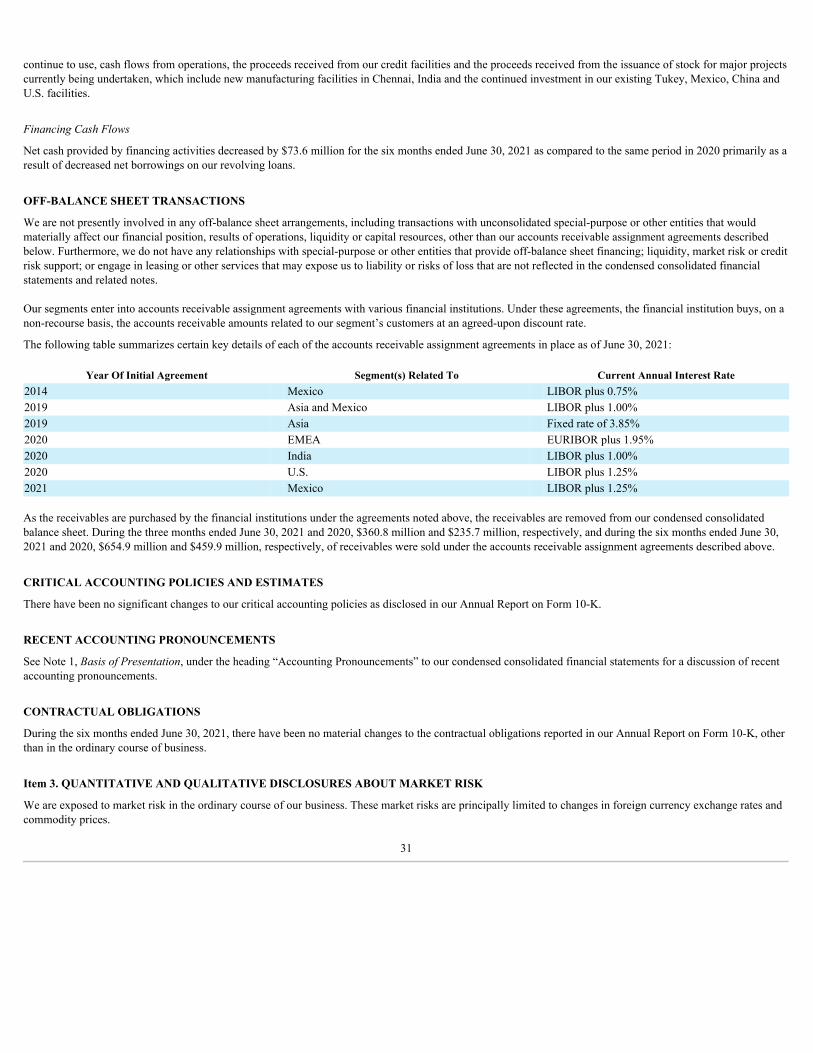
continue to use, cash flows from operations, the proceeds received from our credit facilities and the proceeds received from the issuance of stock for major projectscurrently being undertaken, which include new manufacturing facilities in Chennai, India and the continued investment in our existing Tukey, Mexico, China andU.S. facilities.
Financing Cash Flows
Net cash provided by financing activities decreased by $73.6 million for the six months ended June 30, 2021 as compared to the same period in 2020 primarily as aresult of decreased net borrowings on our revolving loans.
OFF-BALANCE SHEET TRANSACTIONS
We are not presently involved in any off-balance sheet arrangements, including transactions with unconsolidated special-purpose or other entities that wouldmaterially affect our financial position, results of operations, liquidity or capital resources, other than our accounts receivable assignment agreements describedbelow. Furthermore, we do not have any relationships with special-purpose or other entities that provide off-balance sheet financing; liquidity, market risk or creditrisk support; or engage in leasing or other services that may expose us to liability or risks of loss that are not reflected in the condensed consolidated financialstatements and related notes.
Our segments enter into accounts receivable assignment agreements with various financial institutions. Under these agreements, the financial institution buys, on anon-recourse basis, the accounts receivable amounts related to our segment’s customers at an agreed-upon discount rate.
The following table summarizes certain key details of each of the accounts receivable assignment agreements in place as of June 30, 2021:
Year Of Initial Agreement Segment(s) Related To Current Annual Interest Rate2014 Mexico LIBOR plus 0.75%2019 Asia and Mexico LIBOR plus 1.00%2019 Asia Fixed rate of 3.85%2020 EMEA EURIBOR plus 1.95%2020 India LIBOR plus 1.00%2020 U.S. LIBOR plus 1.25%2021 Mexico LIBOR plus 1.25% As the receivables are purchased by the financial institutions under the agreements noted above, the receivables are removed from our condensed consolidatedbalance sheet. During the three months ended June 30, 2021 and 2020, $360.8 million and $235.7 million, respectively, and during the six months ended June 30,2021 and 2020, $654.9 million and $459.9 million, respectively, of receivables were sold under the accounts receivable assignment agreements described above.
CRITICAL ACCOUNTING POLICIES AND ESTIMATES
There have been no significant changes to our critical accounting policies as disclosed in our Annual Report on Form 10-K.
RECENT ACCOUNTING PRONOUNCEMENTS
See Note 1, Basis of Presentation, under the heading “Accounting Pronouncements” to our condensed consolidated financial statements for a discussion of recentaccounting pronouncements.
CONTRACTUAL OBLIGATIONS
During the six months ended June 30, 2021, there have been no material changes to the contractual obligations reported in our Annual Report on Form 10-K, otherthan in the ordinary course of business.
Item 3. QUANTITATIVE AND QUALITATIVE DISCLOSURES ABOUT MARKET RISK
We are exposed to market risk in the ordinary course of our business. These market risks are principally limited to changes in foreign currency exchange rates andcommodity prices.
31

Foreign Currency Risk. We conduct international operations in China, Mexico, Turkey and India. Our results of operations are subject to both currency transactionrisk and currency translation risk. We incur currency transaction risk whenever we enter into either a purchase or sale transaction using a currency other than thelocal currency of the transacting entity. With respect to currency translation risk, our financial condition and results of operations are measured and recorded in therelevant domestic currency and then translated into U.S. dollars for inclusion in our condensed consolidated financial statements. In recent years, exchange ratesbetween these foreign currencies and the U.S. dollar have fluctuated significantly and may do so in the future. A hypothetical change of 10% in the exchange ratesfor the countries above would have resulted in a change to income from operations of approximately $15.7 million for the six months ended June 30, 2021.
Commodity Price Risk. We are subject to commodity price risk under agreements for the supply of our raw materials. We have not hedged our commodity priceexposure. We generally lock in pricing for most of our key raw materials for 12 months which protects us from price increases within that period, which we believehelps to mitigate the impact of raw material price increases. As many of our raw material supply agreements have meet or release clauses, if raw materials pricesdecrease, we are able to benefit from the reductions in price.
Resin and resin systems are the primary commodities for which we do not have fixed pricing. Approximately 55% of the resin and resin systems we use arepurchased under contracts either controlled or borne by two of our customers and therefore they receive/bear 100% of any increase or decrease in resin costsfurther limiting our exposure to price fluctuations.
Prior to taking into account any contractual obligations of our customers to share with us the cost savings or increases resulting from a change in the currentforecasted price of resin and resin systems, we believe that a 10% change in the current forecasted price of resin and resin systems for the customers in which weare exposed to fluctuating prices would have had an impact to income from operations of approximately $11.8 million for the full year 2021. Under our customersupply agreements, our customers typically receive 70% of the cost savings or increases resulting from a change in the price of resin and resin systems.
Interest Rate Risk. As of June 30, 2021, our Credit Agreement includes interest on the unhedged principal amount of $96.2 million which is tied to the LondonInterbank Offered Rate (LIBOR), our India segment has two credit agreements outstanding which are tied to LIBOR, and our EMEA segment has one generalcredit agreement outstanding which is tied to the Euro Interbank Offered Rate (EURIBOR). For a discussion of the interest rate swap arrangement we entered intorelated to our Credit Agreement, see Note 13, Financial Instruments, to the notes to the consolidated financial statements within our 2020 Annual Report on Form10-K. The India credit agreements had secured and unsecured working capital financing of $6.4 million and unsecured term loan financing of $2.1 millionoutstanding as of June 30, 2021. The two EMEA credit agreements had unsecured financing of $5.9 million and financing of capital expenditures of $2.1 millionoutstanding as of June 30, 2021. Our Credit Agreement, the two India credit agreements, and the one EMEA general credit agreement are the only variable ratedebt agreements that we had outstanding as of June 30, 2021 as all remaining working capital loans, secured and unsecured financing and finance lease obligationsare fixed rate instruments and are not subject to fluctuations in interest rates. Due to the relatively low LIBOR and EURIBOR rates in effect as of June 30, 2021, a10% change in the LIBOR or EURIBOR rate would not have had a material impact on our future earnings, fair values or cash flows.
Item 4. CONTROLS AND PROCEDURES
Evaluation of Disclosure Controls and Procedures
We maintain disclosure controls and procedures that are designed to provide reasonable assurance that information required to be disclosed in our reports under theExchange Act is recorded, processed, summarized, and reported within the time period specified in the SEC’s rules and forms and that such information isaccumulated and communicated to our management, including our Chief Executive Officer and Chief Financial Officer, as appropriate, to allow timely decisionsregarding required disclosure.
As required by Rule 13a-15(b) promulgated under the Exchange Act, our management, with the participation of our Chief Executive Officer and Chief FinancialOfficer, evaluated the design and operating effectiveness as of June 30, 2021 of our disclosure controls and procedures, as defined in Rule 13a-15(e) promulgatedunder the Exchange Act. Based on this evaluation, our Chief Executive Officer and Chief Financial Officer concluded that our disclosure controls and procedureswere effective as of June 30, 2021.
Changes in Internal Control Over Financial Reporting
There were no changes in our internal control over financial reporting during the three months ended June 30, 2021 that have materially affected, or are reasonablylikely to materially affect, our internal control over financial reporting.
32

PART II. OTHER INFORMATION
Item 1. LEGAL PROCEEDINGS
See Note 12, Commitments and Contingencies, under the heading “Legal Proceedings” to our condensed consolidated financial statements for a discussion of legalproceedings and other related matters.
Item 1A. RISK FACTORS
Except as noted below, there have been no material changes to the Risk Factors (Part I, Item 1A) in our Annual Report on Form 10-K, which could materiallyaffect our business, financial condition, and/or future results.
Our business, operations and financial condition during the six months ended June 30, 2021 were not materially adversely affected by the COVID-19pandemic however we cannot estimate the duration of the COVID-19 pandemic and our business may be adversely affected in the future if the COVID-19pandemic persists. The COVID-19 pandemic did not materially adversely affect our business and operations during the six months ended June 30, 2021. Although all of ourmanufacturing facilities currently are operating at or near normal production levels, we may be required to reinstate temporary production suspensions or volumereductions at our manufacturing facilities to the extent there are new resurgences of COVID-19 cases in the regions where we operate or there is an outbreak ofpositive COVID-19 cases in any of our manufacturing facilities. For example, India and Turkey recently experienced significant increases in positive COVID-19cases although these resurgences did not have a material impact on our operations during the six months ended June 30, 2021. In addition, although we are notcurrently experiencing any significant disruptions in our global supply chain due to the COVID-19 pandemic, our global supply chain may in the future beadversely affected if the COVID-19 pandemic persists.
Item 2. UNREGISTERED SALES OF EQUITY SECURITIES AND USE OF PROCEEDS
Issuer Purchases of Equity Securities
Not applicable.
Use of Proceeds
Not applicable.
Item 3. DEFAULTS UPON SENIOR SECURITIES
Not applicable.
Item 4. MINE SAFETY DISCLOSURES
Not applicable.
Item 5. OTHER INFORMATION
None.
33
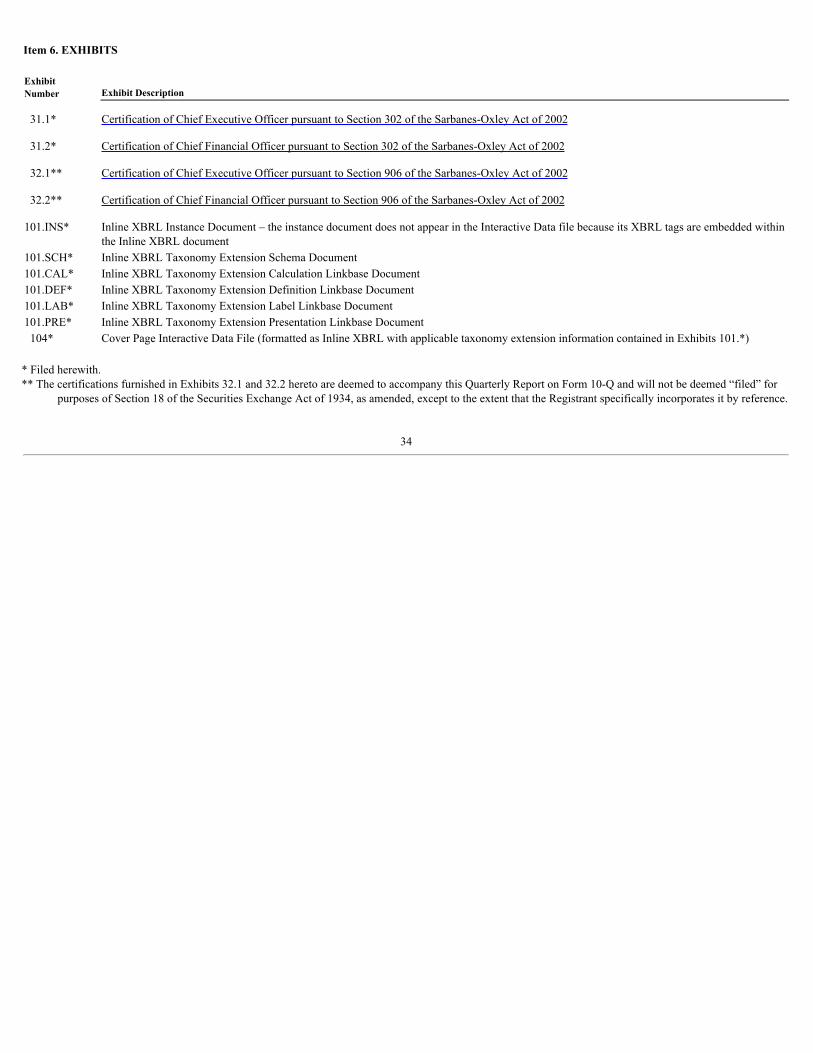
Item 6. EXHIBITS ExhibitNumber Exhibit Description
31.1* Certification of Chief Executive Officer pursuant to Section 302 of the Sarbanes-Oxley Act of 2002
31.2* Certification of Chief Financial Officer pursuant to Section 302 of the Sarbanes-Oxley Act of 2002
32.1** Certification of Chief Executive Officer pursuant to Section 906 of the Sarbanes-Oxley Act of 2002
32.2** Certification of Chief Financial Officer pursuant to Section 906 of the Sarbanes-Oxley Act of 2002
101.INS* Inline XBRL Instance Document – the instance document does not appear in the Interactive Data file because its XBRL tags are embedded withinthe Inline XBRL document
101.SCH* Inline XBRL Taxonomy Extension Schema Document101.CAL* Inline XBRL Taxonomy Extension Calculation Linkbase Document101.DEF* Inline XBRL Taxonomy Extension Definition Linkbase Document101.LAB* Inline XBRL Taxonomy Extension Label Linkbase Document101.PRE* Inline XBRL Taxonomy Extension Presentation Linkbase Document 104* Cover Page Interactive Data File (formatted as Inline XBRL with applicable taxonomy extension information contained in Exhibits 101.*) * Filed herewith.** The certifications furnished in Exhibits 32.1 and 32.2 hereto are deemed to accompany this Quarterly Report on Form 10-Q and will not be deemed “filed” for
purposes of Section 18 of the Securities Exchange Act of 1934, as amended, except to the extent that the Registrant specifically incorporates it by reference.
34
SIGNATURES
Pursuant to the requirements of Section 13 or 15(d) of the Securities Exchange Act of 1934, the registrant has duly caused this report to be signed on its behalf bythe undersigned, thereunto duly authorized. TPI COMPOSITES, INC. Date: August 5, 2021 By: /s/ Adan Gossar Adan Gossar Chief Accounting Officer (Principal Accounting Officer)
35

Exhibit 31.1
CERTIFICATION
I, William E. Siwek, certify that:
1. I have reviewed this quarterly report on Form 10-Q of TPI Composites, Inc.;
2. Based on my knowledge, this report does not contain any untrue statement of a material fact or omit to state a material fact necessary to make the statementsmade, in light of the circumstances under which such statements were made, not misleading with respect to the period covered by this report;
3. Based on my knowledge, the financial statements, and other financial information included in this report, fairly present in all material respects the financialcondition, results of operations and cash flows of the registrant as of, and for, the periods presented in this report;
4. The registrant’s other certifying officer and I are responsible for establishing and maintaining disclosure controls and procedures (as defined in Exchange ActRules 13a-15(e) and 15d-15(e)) and internal control over financial reporting (as defined in Exchange Act Rules 13a-15(f) and 15d-15(f)) for the registrant andhave:
a) Designed such disclosure controls and procedures, or caused such disclosure controls and procedures to be designed under our supervision, to ensure thatmaterial information relating to the registrant, including its consolidated subsidiaries, is made known to us by others within those entities, particularly during theperiod in which this report is being prepared;
b) Designed such internal control over financial reporting, or caused such internal control over financial reporting to be designed under our supervision, toprovide reasonable assurance regarding the reliability of financial reporting and the preparation of financial statements for external purposes in accordance withgenerally accepted accounting principles;
c) Evaluated the effectiveness of the registrant’s disclosure controls and procedures and presented in this report our conclusions about the effectiveness ofthe disclosure controls and procedures, as of the end of the period covered by this report based on such evaluation; and
d) Disclosed in this report any change in the registrant’s internal control over financial reporting that occurred during the registrant’s most recent fiscalquarter (the registrant’s fourth fiscal quarter in the case of an annual report) that has materially affected, or is reasonably likely to materially affect, the registrant’sinternal control over financial reporting; and
5. The registrant’s other certifying officer and I have disclosed, based on our most recent evaluation of internal control over financial reporting, to the registrant’sauditors and the audit committee of the registrant’s board of directors (or persons performing the equivalent functions):
a) All significant deficiencies and material weaknesses in the design or operation of internal control over financial reporting which are reasonably likely toadversely affect the registrant’s ability to record, process, summarize and report financial information; and
b) Any fraud, whether or not material, that involves management or other employees who have a significant role in the registrant’s internal control overfinancial reporting. Date: August 5, 2021 By: /s/ William E. Siwek
William E. Siwek
Chief Executive Officer
(Principal Executive Officer)

Exhibit 31.2
CERTIFICATION
I, Bryan R. Schumaker, certify that:
1. I have reviewed this quarterly report on Form 10-Q of TPI Composites, Inc.;
2. Based on my knowledge, this report does not contain any untrue statement of a material fact or omit to state a material fact necessary to make the statementsmade, in light of the circumstances under which such statements were made, not misleading with respect to the period covered by this report;
3. Based on my knowledge, the financial statements, and other financial information included in this report, fairly present in all material respects the financialcondition, results of operations and cash flows of the registrant as of, and for, the periods presented in this report;
4. The registrant’s other certifying officer and I are responsible for establishing and maintaining disclosure controls and procedures (as defined in Exchange ActRules 13a-15(e) and 15d-15(e)) and internal control over financial reporting (as defined in Exchange Act Rules 13a-15(f) and 15d-15(f)) for the registrant andhave:
a) Designed such disclosure controls and procedures, or caused such disclosure controls and procedures to be designed under our supervision, to ensure thatmaterial information relating to the registrant, including its consolidated subsidiaries, is made known to us by others within those entities, particularly during theperiod in which this report is being prepared;
b) Designed such internal control over financial reporting, or caused such internal control over financial reporting to be designed under our supervision, toprovide reasonable assurance regarding the reliability of financial reporting and the preparation of financial statements for external purposes in accordance withgenerally accepted accounting principles;
c) Evaluated the effectiveness of the registrant’s disclosure controls and procedures and presented in this report our conclusions about the effectiveness ofthe disclosure controls and procedures, as of the end of the period covered by this report based on such evaluation; and
d) Disclosed in this report any change in the registrant’s internal control over financial reporting that occurred during the registrant’s most recent fiscalquarter (the registrant’s fourth fiscal quarter in the case of an annual report) that has materially affected, or is reasonably likely to materially affect, the registrant’sinternal control over financial reporting; and
5. The registrant’s other certifying officer and I have disclosed, based on our most recent evaluation of internal control over financial reporting, to the registrant’sauditors and the audit committee of the registrant’s board of directors (or persons performing the equivalent functions):
a) All significant deficiencies and material weaknesses in the design or operation of internal control over financial reporting which are reasonably likely toadversely affect the registrant’s ability to record, process, summarize and report financial information; and
b) Any fraud, whether or not material, that involves management or other employees who have a significant role in the registrant’s internal control overfinancial reporting. Date: August 5, 2021 By: /s/ Bryan R. Schumaker Bryan R. Schumaker
Chief Financial Officer
(Principal Financial Officer)

Exhibit 32.1
Certification Pursuant To18 U.S.C. Section 1350,
As Adopted Pursuant ToSection 906 of the Sarbanes-Oxley Act of 2002
I, William E. Siwek, Chief Executive Officer of TPI Composites, Inc., certify, pursuant to 18 U.S.C. Section 1350, as adopted pursuant to Section 906 of theSarbanes-Oxley Act of 2002, that:
1. the report on Form 10-Q of TPI Composites, Inc. for the three months ended June 30, 2021 (the “Report”) fully complies with the requirements of Section 13(a)or 15(d) of the Securities Exchange Act of 1934 (15 U.S.C. Section 78m or 78o(d)); and
2. the information contained in the Report fairly presents, in all material respects, the financial condition and results of operations of TPI Composites, Inc. Date: August 5, 2021 By: /s/ William E. Siwek
William E. Siwek
Chief Executive Officer
(Principal Executive Officer)

Exhibit 32.2
Certification Pursuant To18 U.S.C. Section 1350,
As Adopted Pursuant ToSection 906 of the Sarbanes-Oxley Act of 2002
I, Bryan R. Schumaker, Chief Financial Officer of TPI Composites, Inc., certify, pursuant to 18 U.S.C. Section 1350, as adopted pursuant to Section 906 of theSarbanes-Oxley Act of 2002, that: 1. the report on Form 10-Q of TPI Composites, Inc. for the three months ended June 30, 2021 (the “Report”) fully complies with the requirements of Section 13(a)or 15(d) of the Securities Exchange Act of 1934 (15 U.S.C. Section 78m or 78o(d)); and
2. the information contained in the Report fairly presents, in all material respects, the financial condition and results of operations of TPI Composites, Inc. Date: August 5, 2021 By: /s/ Bryan R. Schumaker Bryan R. Schumaker
Chief Financial Officer
(Principal Financial Officer)