Toward Point-of-Care Drug Quality Assurance in Developing ...
62
Toward Point-of-Care Drug Quality Assurance in Developing Countries: Comparison of Liquid Chromatography and Infrared Spectroscopy Quantitation of a Small-Scale Random Sample of Amoxicillin, Ciprofloxacin and Doxycycline. Norah Alotaibi Thesis submitted to the Faculty of Science University of Ottawa in partial fulfillment of the requirements for the degree of Master of Science in the Department of Chemistry and Biomolecular Sciences December 2019 Candidate Norah Alotaibi ã Norah Alotaibi, Ottawa, Canada, 2020 Supervisor/Superviseur Dr. Paul M. Mayer
Transcript of Toward Point-of-Care Drug Quality Assurance in Developing ...

Toward Point-of-Care Drug Quality Assurance in Developing Countries: Comparison of Liquid Chromatography and Infrared Spectroscopy Quantitation of a Small-Scale Random Sample of Amoxicillin, Ciprofloxacin and Doxycycline.
Norah Alotaibi
Thesis submitted to the Faculty of Science
University of Ottawa in partial fulfillment of the requirements for
the degree of Master of Science in the Department of Chemistry and Biomolecular Sciences
December 2019
Candidate
Norah Alotaibi
ã Norah Alotaibi, Ottawa, Canada, 2020
Supervisor/Superviseur
Dr. Paul M. Mayer

ii
List of Publications
1. Alotaibi, Norah, Sean Overton, Sharon Curtis, Jason W. Nickerson, Amir Attaran, Sheldon
Gilmer, and Paul M. Mayer. 2018. “Toward Point-of-Care Drug Quality Assurance in Developing Countries: Comparison of Liquid Chromatography and Infrared Spectroscopy Quantitation of a Small-Scale Random Sample of Amoxicillin.” American Journal of Tropical Medicine and Hygiene.
List of authors and their roles on the project:
I ran all samples for amoxicillin, ciprofloxacin, and doxycycline on the FT-IR and quantified the
results. I also performed the LC-UV analysis for doxycycline. I was involved in the data analysis
for the three antibiotics, developing the discussion, and deriving the conclusion of the paper
and the thesis.
Amir Attaran: Our collaborator in public health law
Jason Nickerson: Formerly of the Bruyrere Research Institute, currently with Doctors Without
Borders. He collected the non-African samples during his travels
Sean Overton: Sean collected samples in Ghana and Sierra Leone, taught me how to use the
FTIR and LC-UV, ran all the LC-UV samples for amoxicillin and ciprofloxacin.
Sharon Curtis: JLH Facility Manager who ran the standard samples in the method validation.
Shelden Gilmer: The collaborator from World Hope Canada who escorted Sean Overton on his
sampling trip to Ghana and Sierra Leone.

iii
Contents
List of Publications ........................................................................................................ ii
List of Figures ................................................................................................................ v
List of Tables ................................................................................................................. vi
List of Abbreviations .................................................................................................... vii
Abstract ...................................................................................................................... viii
Acknowledgements ....................................................................................................... ix
1. Introduction ............................................................................................................ 1
2. Experimental Techniques ........................................................................................ 6 2.1 Infrared (IR) spectroscopy .......................................................................................................... 6 2.2 Attenuated total reflectance (ATR) ......................................................................................... 9 2.3 IR spectroscopy of the target antibiotics ............................................................................. 10 2.4 Calibration of FT-IR ..................................................................................................................... 13 2.5 High- and ultrahigh-performance liquid chromatography (HPLC-UV and UPLC-UV) ................................................................................................................................................................. 18 2.6 Calibration of LC-UV ................................................................................................................... 22
3. Amoxicillin trihydrate ............................................................................................ 23 3.1 Structure ........................................................................................................................................ 23 3.2 Chemical and physical properties .......................................................................................... 23 3.3 Materials and methods ............................................................................................................. 24
3.3.1 Sampling ......................................................................................................... 24 3.3.2 Sample preparation. ...................................................................................... 24 3.3.3 UPLC-UV protocol. ......................................................................................... 25 3.3.4 FT-IR protocol. ................................................................................................ 26
3.4 Results and discussion ............................................................................................................... 27 3.4.1 Total dose mass ............................................................................................. 27 3.4.2 UPLC-UV results ............................................................................................. 28 3.4.3 FT-IR results ................................................................................................... 29 3.4.4 UPLC vs FT-IR .................................................................................................. 30

iv
4. Ciprofloxacin Hydrochloride .................................................................................. 31 4.1 Structure ........................................................................................................................................ 31 4.2 Chemical and physical properties .......................................................................................... 31 4.3 Materials and methods ............................................................................................................. 32
4.3.1 Sampling. ........................................................................................................ 32 4.3.2 Sample preparation. ...................................................................................... 32 4.3.3 UPLC protocol. ............................................................................................... 33 4.3.4 FT-IR Protocol. ................................................................................................ 34
4.4 Results and discussion ............................................................................................................... 35 4.4.1 Total dose mass. ............................................................................................ 35 4.4.2 UPLC-UV results. ............................................................................................ 36 4.4.3 FT-IR results. .................................................................................................. 37 4.4.4 UPLC vs FT-IR .................................................................................................. 38
5. Doxycycline hyclate ............................................................................................... 39 5.1 Structure ........................................................................................................................................ 39 5.2 Chemical and physical properties .......................................................................................... 39 5.3 Materials and methods ............................................................................................................. 40
5.3.1 Sampling. ........................................................................................................ 40 5.3.2 Sample preparation. ...................................................................................... 40 5.3.3 UPLC protocol. ............................................................................................... 41 5.3.4 FT-IR protocol. ................................................................................................ 42
5.4 Results and discussion ............................................................................................................... 43 5.4.1 Total dose mass. ............................................................................................ 43 5.4.2 UPLC-UV results. ............................................................................................ 44 5.4.3 FT-IR results. .................................................................................................. 45 5.4.4 UPLC vs FT-IR .................................................................................................. 46
6. Conclusions ........................................................................................................... 48
Bibliography ................................................................................................................ 50
Appendix
A1. Raw results for amoxicillin A2. Raw results for ciprofloxacin A3. Raw results for doxycycline

v
List of Figures
Figure 2.1: The components of a simple dispersive infrared spectrometer, based on ref. 19.19 ... 7
Figure 2.2: The components of FT-IR, based on ref. 19.19 .............................................................. 8
Figure 2.3: How ATR works, based on ref. 23.23 ........................................................................... 10
Figure 2.4: The experimental IR vs. the theoretical IR spectra (B3-LYP/6-31+G(d) level of theory)
for amoxicillin ciprofloxacin, and doxycycline. ............................................................................. 11
Figure 2.5: IR spectra of a)amoxicillin, b)ciprofloxacin, and c)doxycycline and the calibration
mixtures with a calibration curve taken at a single wavelength to demonstrate linearity for
amoxicillin. .................................................................................................................................... 17
Figure 2.6: An example of a spectrum obtained by LC-UV for ciprofloxacin. ............................... 19
Figure 2.7: The calibration curve for ciprofloxacin with the regression equation and R2 value"
error bars are smaller than the symbol size". .............................................................................. 22
Figure 3.1: The structure of amoxicillin.28 .................................................................................... 23
Figure 3.2: Mass results by countries. .......................................................................................... 27
Figure 3.3: The LC-UV results for amoxicillin by countries. .......................................................... 28
Figure 3.4: The FT-IR results for amoxicillin by countries. ............................................................ 29
Figure 3.5: %API of amoxicillin by LC-UV vs. FT-IR. ....................................................................... 30
Figure 4.1: The structure of ciprofloxacin.32 ................................................................................. 31
Figure 4.2: The mass results for ciprofloxacin by countries. ........................................................ 35
Figure 4.3: The LC-UV results for ciprofloxacin by countries. ....................................................... 36
Figure 4.4: The FT-IR results for ciprofloxacin by countries. ........................................................ 37
Figure 4.5: %API of ciprofloxacin by LC-UV vs. FT-IR. .................................................................. 38
Figure 5.1: The structure of doxycycline.34 ................................................................................... 39
Figure 5.2: The mass results for doxycycline by countries. .......................................................... 43
Figure 5.3: The LC-UV results for doxycycline by countries. ......................................................... 44
Figure 5.4: The FT-IR results for doxycycline by countries. .......................................................... 45
Figure 5.5: %API of doxycycline by LC-UV vs. FT-IR ...................................................................... 46

vi
List of Tables
Table 1: The infrared regions and their wavelength and wavenumber range.22 ........................... 6
Table 2: Selected vibrational frequencies of the functional groups in the IR spectrum of
amoxicillin. .................................................................................................................................... 12
Table 3: Selected vibrational frequencies of the functional groups in the IR spectrum of
ciprofloxacin. ................................................................................................................................ 12
Table 4: Selected vibrational frequencies of the functional groups in the IR spectrum of
doxycycline. .................................................................................................................................. 13

vii
List of Abbreviations
API: Active Pharmaceutical Ingredient
ATR: Attenuated Total Reflectance
DRC: Democratic Republic of Congo
FT-IR: Fourier Transform Infrared
HPLC: High-Performance Liquid Chromatography
PLS: Partial Least Squares
PNG: Papua New Guinea
UPLC: Ultra High-Performance Liquid Chromatography
USP: United States Pharmacopoeia
UV: Ultraviolet, used to represent ultraviolet-visible spectroscopy detection of the UPLC
VWD: Variable Wavelength Detector
WHO: The World Health Organization

viii
Abstract
Substandard antibiotics are thought to be a major threat to public health in developing
countries and a cause of antimicrobial resistance. However, assessing quality outside of a
laboratory setting, using simple equipment, is challenging. The aim of this study was to validate
the use of a portable Fourier transform infrared (FT-IR) spectrometer for the identification of
substandard antibiotics. Results are presented for amoxicillin, ciprofloxacin, and doxycycline
packages from Haiti, Ghana, Sierra Leone, Democratic Republic of Congo, India, Papua New
Guinea, and Ethiopia collected over the course of 6 months in 2017, including two field trips with
the FT-IR to Ghana and Sierra Leone. Canadian samples were used as a control. Regarding drug
quality, of 290, 280, and 42 individual capsules and tablets of amoxicillin, ciprofloxacin, and
doxycycline analyzed, 13, 14, and 27 respectively were found to be substandard with total active
pharmaceutical ingredients (API) lying outside the acceptable range of 90–110%. The FT-IR
reliably identified the outliers of amoxicillin and ciprofloxacin and was found to yield results in
good agreement with the established pharmacopeia liquid chromatography protocol. Results for
doxycycline were less promising, but LC-UV analysis was also found to be problematic. We
conclude that the portable FT-IR may be suitable to intercept substandard antibiotics in
developing countries where more sophisticated techniques are not readily available.

ix
Acknowledgements
All praise the Almighty Allah for giving me the strength and ability to complete this journey.
I would like to express my very profound gratitude to my parents and siblings for their
endless support, unconditional love, and prayers to complete this journey. Most of all, my
appreciation goes to my husband and lovely daughter for providing me with unfailing support
and continuous encouragement throughout my years of study and through the process of
researching and writing this thesis. This accomplishment would not have been possible without
them.
There are no words that can express how thankful I am to my supervisor, Prof. Paul Mayer,
for allowing me to be in his research group and for guidance and continuous support. I would
also like to express my thanks to Sean Overton for his assistance in the project and helping in
numerical analysis. I also wish to thank Dr. Sharon Curtis for valuable assistance in the research.
Special thanks to Dr. Brandi West for her help, assistance, and the great time we spent in the
office.
My sincere thanks are also extended to the Ministry of Education in Saudi Arabia
represented by the Saudi Arabian Cultural Bureau in Canada for financial support.
Finally, my grateful thanks go to my friends Shaimaa Almalki and Nouf Almohammadi, for
helping, supporting, being a good listener, and all the great time I have spent with them in
Ottawa.

1
Chapter 1
Introduction
Note. Taken largely from the paper discussed in the list of publications
In recent years, evidence has emerged that the problem of substandard medicines is large
and growing.1 These medicines, which may contain the wrong amount or type of ingredients, can
cause drug resistance, injury, and death—sometimes hundreds of patients at a time. Little is
known about the true dimensions of this issue and which patients or medicines it targets,
although work by the World Health Organization (WHO) and INTERPOL roughly estimates that it
affects between 1% and 30% of drugs.2 Loopholes in law and regulation let wrongdoers trade
bad-quality drugs, with little risk of punishment. INTERPOL notes that police reports of medicine
crime are up 10-fold since 2000, sometimes causing hundreds of deaths.3 Serious as that is, the
WHO laments that current data on medicine quality “are often of poor quality and are not …
systematized.”2 Pezzola and Sweet, in a study developing indicators for pharmaceutical
regulation in developing countries, have noted resistance to the implementation of quality
standards.4 Even neighboring countries can have wildly different levels of regulation.4 Jason W.,
Nickerson et al. have corroborated these concerns in small-scale exploratory studies that clearly
illustrate the grave risks of treatment failure, drug resistance, and death. For example, they linked
a specific vial of substandard antibiotic ceftriaxone in a Ugandan hospital to a young boy’s death
in that hospital.5 In addition, Nickerson, Jason W. et al. recently published on the identification
of substandard propofol in Zambia, which was identified because of concerns of drug quality
following several adverse events on administration, ranging from bronchospasm to hypotension

2
and cardiac arrest.6 The literature contains little data on medicine testing in most disease areas
(e.g., almost no published studies of noncommunicable-disease drugs), which in turn means
there is not an evidence base that politicians find compelling enough to strengthen the laws and
law enforcement needed to effectively criminalize and punish those who traffic substandard
medicines. Nayyar and coworkers7,8 published reviews in 2012 and 2015, highlighting the
significance of falsified pharmaceuticals worldwide and the detection strategies that have been
used. In addition to the high-performance liquid chromatography (HPLC) pharmacopeia standard
methods, colorimetric and thin-layer chromatographies are two of the more common testing
methods, less expensive, rapid, field-adapted and require no trained personnel. However, there
are some drawbacks to each of them. Colorimetric techniques need sample pre-treatment. If the
medicines do not have particular chemical groups that easily react with specific reagents to yield
colored products, they can be transformed by acid or base treatment to more reactive
compounds. Also, the specificity of the test is pH-dependent. Finally, colorimetry does not
provide information on the chemical composition of counterfeit medicines. The thin-layer
chromatography provides a semiquantitative measurement.
Fatal consequences and promoting the emergence of drug resistance are results of
substandard or intentionally adulterated medicinal products in low-income countries.1 For
example, poor-quality antimalarial medicines contribute to emerging antibiotic resistance and
treatment failure. Because when the antibiotic concentration is lower than what is needed, it will
not kill all the bacteria. Instead, substandard medicine use promotes the development of
antibiotic-resistant bacteria. Thus, poor-medicine effectively selecting bacteria that is resistant
to the antibiotic and allowing them to survive to grow and continue to multiply, causing more

3
harm. Then over time, the bacteria will show resistance to that drug.9 This not only endangers
patient safety but consequently risks the loss of patients’ trust in the health care system. In many
low-income countries, drugs with little or no active ingredient, including first-line therapies for
the treatment of tuberculosis, malaria and human immunodeficiency viruses, have been found.10
In 21 countries of sub-Saharan Africa, 21 studies reporting chemical analyses and assessments of
the packaging of antimalarial drugs showed that 796 (35%) of 2297 failed chemical analysis, 28
(36%) of 77 failed packaging analysis, and 79 (20%) of 389 were classified as falsified.7 A study
from the major cities of six African countries highlighted similar quality concerns, finding that
35% of all samples tested were outside acceptable quality ranges.11 In 2008, a total of 1080
samples of oral antimalarial tablets purchased from retail outlets across 21 districts in mainland
Tanzania to determine the amount of the active ingredient and dissolution profile by following
the published United States Pharmacopoeia (USP) monogram for the particular tablet being
tested. Overall 38 out of 1080 or 12.2% of the samples did not comply within the tolerance limits
of the dissolution and quantification analysis.12
A limitation of most studies in the literature is that they are carried out after a patient or
patients have been harmed by substandard dosing (as was performed in our previous work). This
is a consequence of gold standard quantitative analysis being laboratory-based, and it points to
a need for more portable, cost-effective, and user-friendly methods if this type of analysis is to
be performed in a preventative manner.13 Portable near-infrared (IR) and Raman spectroscopy
devices have been deployed with mixed success, with quantitation of the active pharmaceutical
ingredient (API) being most challenging.13–18 This means that portable Raman and NIR
instruments work in different fields; however, there are some limitations in each study. For
4
example, a study reviewed the recent analytical methods employed to control the quality of drug
formulations, using artemisinin derivatives as an example, mentioned that portable Raman and
NIR instruments for the in-field chemical identification of counterfeit drugs have now become
available. Still, the practical advantage of the Raman technique is limited by the poor efficiency
of the Raman scattering and strong fluorescent interferences. A significant drawback for the
implementation of portable NIR spectrometers in resource-poor settings (but not in developed
countries) is the need to process the spectral data by chemometric techniques to differentiate
between original and fake formulations.13 IR spectroscopy has been used to probe paracetamol
tablets, over the fingerprint region 1,100–2,400 cm-1.19 The authors determined that once a
database of drugs had been developed, it was possible to demonstrate the reliability of a sample
quickly and efficiently.
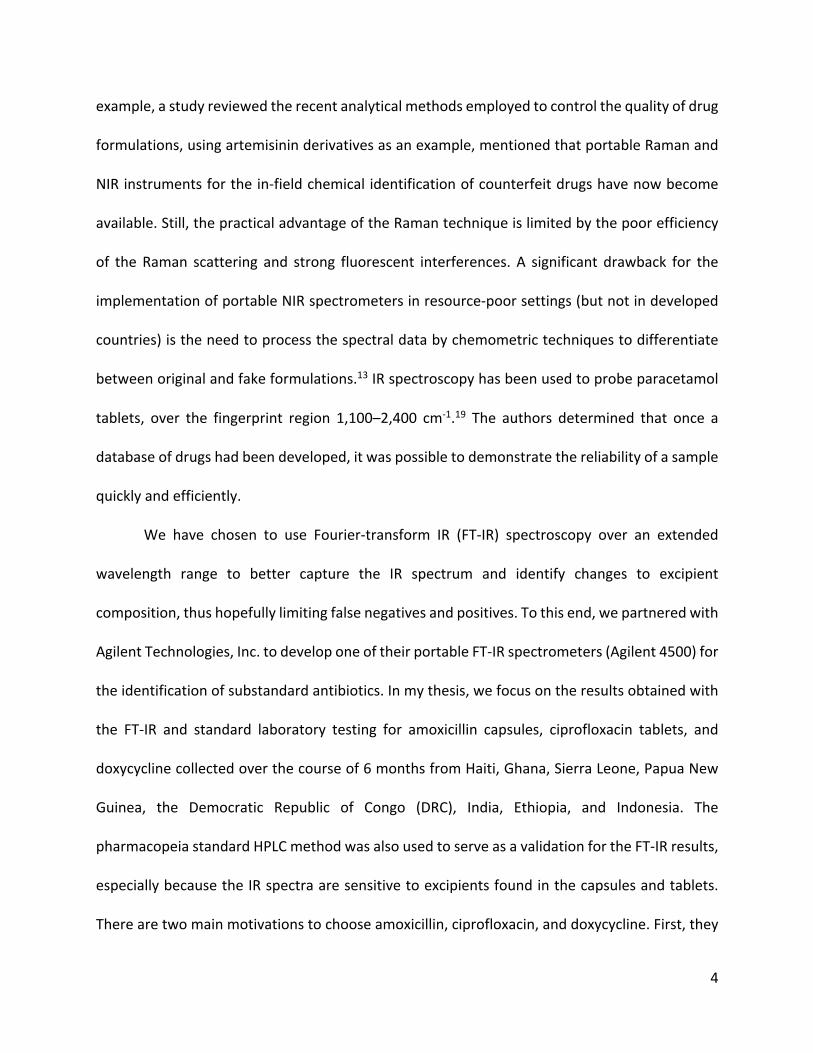
We have chosen to use Fourier-transform IR (FT-IR) spectroscopy over an extended
wavelength range to better capture the IR spectrum and identify changes to excipient
composition, thus hopefully limiting false negatives and positives. To this end, we partnered with
Agilent Technologies, Inc. to develop one of their portable FT-IR spectrometers (Agilent 4500) for
the identification of substandard antibiotics. In my thesis, we focus on the results obtained with
the FT-IR and standard laboratory testing for amoxicillin capsules, ciprofloxacin tablets, and
doxycycline collected over the course of 6 months from Haiti, Ghana, Sierra Leone, Papua New
Guinea, the Democratic Republic of Congo (DRC), India, Ethiopia, and Indonesia. The
pharmacopeia standard HPLC method was also used to serve as a validation for the FT-IR results,
especially because the IR spectra are sensitive to excipients found in the capsules and tablets.
There are two main motivations to choose amoxicillin, ciprofloxacin, and doxycycline. First, they

5
are the primary antibiotics used in most countries. Second, they represent the biggest families of
antibiotics (penicillin, quinolines and tetracyclines, respectively). We concentrated on developing
countries because pharmaceutical regulation is weaker there and pharmaceutical factories are
more likely to have quality-control problems. The work for amoxicillin presented here has been
already published in the paper mentioned above in the list of publications.

6
Chapter 2
Experimental Techniques
2.1 Infrared (IR) spectroscopy20–22
Infrared (IR) spectroscopy studies the interaction between infrared radiation and matter.
IR radiation is a part of the electromagnetic spectrum that has a longer wavelength than visible
light. A longer wavelength means light carries less energy. IR spectroscopy can be subdivided,
depending on the wavelength, into near, mid and far infrared (see Table 1), although mid-infrared
is usually meant when the term IR spectroscopy is used.
Table 1: The infrared regions and their wavelength and wavenumber range.22
Regions Wavelength range (nm) Wavenumber range (cm-1)
Near-IR 780–2500 nm 13,500–4000
Mid-IR 2500–25,000 4000–400
Far-IR 25,000–1,000,000 400–10
IR light interacts with matter by being absorbed by specific vibrational modes. There are
different kinds of molecular vibration including symmetric stretching, anti-symmetric stretching
and deformation vibrations. Other vibrations are rocking, wagging and twisting vibrations.
For measuring the IR spectrum:
1- IR radiation is generated by a light source and directed at the sample.
2- While some light is reflected, the sample absorbs specific amounts of the light.

7
3- The remaining light is transmitted and collected by a detector to produce an electronic
signal.
Turning the electronic signal to a spectrum depends on how the IR spectrometer set up.
The dispersive IR spectrometer generates infrared radiation from a hot wire and splits it into two
parallel beams by way of mirrors (Figure 2.1). One of the parallel beams passes through the
sample, and the other beam is used as a reference. Then each beam is alternately dispersed by a
diffraction grating, which transmits a selected wavelength to the detector. The difference
between the sample and reference signals constitutes the recorded intensity at that wavelength.
Rotating the diffraction grating passes differing wavelengths to the detector until the entire
difference spectrum is acquired. Figure 2.1 schematically illustrates the components of a simple
dispersive IR spectrometer. However, Fourier-transform infrared spectrometers offer significant
advantages. They have improved signal to noise ratio, and they are a faster acquisition of IR
spectra.
Figure 2.1: The components of a simple dispersive infrared spectrometer, based on ref. 19.19

8
The FT-IR spectrometer differs from a dispersive IR spectrometer. A schematic diagram
of an FT-IR spectrometer is shown in Figure 2.2. The center of an FT-IR spectrometer is the
Michelson interferometer. During the measurement, the IR beam enters the interferometer and
is directed at the beam-splitter. The beam is then split and directed at a fixed and a moving
mirror. The light travels back to the beam-splitter where it recombines causing interference and
finally directed at the sample material. That way all the spectral information of all wavelengths
is acquired simultaneously saving a lot of time. At the end, the detector produces a signal of light
intensity versus mirror position.
Figure 2.2: The components of FT-IR, based on ref. 19.19
To get a sample’s IR spectrum, environmental influences are first recorded (the “blank”).
The raw signal, called an interferogram, is then mathematically Fourier-transformed into a
classical IR plot of light intensity versus wavenumbers. The sample spectrum is then recorded.
Combining both spectra by subtraction results in the classic view of the FT-IR transmission
spectrum.

9
An FT-IR spectrum is like a chemical fingerprint. This enables chemical identification of a
variety of samples and is frequently used to characterize material properties and identify and
verify known and unknown samples. It is utilized by many chemical and manufacturing industries
but especially useful whenever chemical information needs to be obtained in a straightforward
and short amount of time. FT-IR is extremely versatile, depending on the spectrometer setup
and measuring technique used.
2.2 Attenuated total reflectance (ATR)
The most commonly used FT-IR sampling instrument today employs attenuated total
reflectance (ATR). ATR usually enables qualitative or quantitative sample analysis with little or
no sample preparing that significantly accelerates sample analysis. The primary advantage of ATR
sampling is the thin sampling path length of the IR beam. This is contrary to traditional
transmission FT-IR sampling where the sample must be diluted with an IR transparent salt or
solvent, pressed into a pellet or pushed into a thin film before analyzing to avoid fully absorbing
bands in the infrared spectrum.23
2.2.1 How ATR works
With the ATR accessory, the sample is placed on a diamond of high refractive index. The
IR beam is directed into the diamond. The IR beam reflects from the internal surface of the crystal
and creates an evanescent wave. The sample absorbs some of the energy of the reflected beam,
and the rest of the reflected radiation returns to the detector, thereby “attenuating” the beam.
Figure 2.4 demonstrates how the ATR accessory operates.

10
Figure 2.3: How ATR works, based on ref. 23.23
A nearly identical spectrum is acquired from both ATR-FT-IR and FT-IR working in the
transmission mode. Also, the peak position in wavenumbers is the same in both methods.
However, some variations in the comparative intensities of the peaks may be observed.
2.3 IR spectroscopy of the target antibiotics
The IR spectrum of a compound is a plot of absorption intensity versus wavenumber (or
sometimes wavelength). In the spectrum, the shape and fine structure of a peak often give clues
to its identity. For instance, C=O and C=C bonds absorb in the same region of the infrared
spectrum. To distinguish between them the C=O bond is a strong absorber while the C=C bond is
weak absorber. Consequently, the peak characteristics in the IR spectrum is as important as the
frequency. The fingerprint region is important because each different compound produces its
own unique pattern of peaks in this region. Once we identify an unknown compound, we
compare its IR spectrum with that of a known sample of the compound. If all peaks in the
fingerprint region match, we have identified our compound. Figure 2.4 displays the comparison

11
between the experimental and theoretical IR spectra for amoxicillin, ciprofloxacin, and
doxycycline respectively.
Figure 2.4: The experimental IR vs. the theoretical IR spectra (B3-LYP/6-31+G(d) level of
theory) for a) amoxicillin, b) ciprofloxacin, and c) doxycycline.
a)
b)
c)

12
Therefore, due to the functional group vibrations that appear in the IR spectra (Figure
2.5), we selected the fingerprint region of amoxicillin, ciprofloxacin, and doxycycline for
quantitation. The tables below classify the chemical vibration of the functional groups in the IR
spectrums for amoxicillin, ciprofloxacin, and doxycycline, respectively.
Table 2: Selected vibrational frequencies of the functional groups in the IR spectrum of
amoxicillin.
Bond Start wavenumber (cm-1)
End wavenumber (cm-1)
C-H in- plane def 1300 1200
C=C and S=N Stretch 1450 1410
C=C and C=N Stretch 1520 1470
C=C and C=N Stretch 1615 1570
C-H Stretch 3100 3010
Table 3: Selected vibrational frequencies of the functional groups in the IR spectrum of
ciprofloxacin.
Bond Start wavenumber (cm-1)
End wavenumber (cm-1)
COC symmetric stretch 1190 1130
COC antisymmetric stretch 1315 1260
C-H Bend, CH2/CH3 1480 1410
C=C Stretch 1645 1580
C=O Stretch 1740 1700
C-H Stretch, Alkyl 3000 2890
C-H Stretch, olefinic 3040 3010

13
Table 4: Selected vibrational frequencies of the functional groups in the IR spectrum of
doxycycline.
Bond Start wavenumber (cm-1)
End wavenumber (cm-1)
C-C/C-S Stretch, Ring 1445 1395
C-C/C-S Stretch, Ring 1565 1515
C-H Stretch, Aryl 3115 3050
2.4 Calibration of FT-IR
Calibration curves of %w/w for the FT-IR samples were made from 12 or 11 points of
different weights of standard drug and the excipients matrix (for more detail on how the
excipient matrices are prepared, see the FT-IR protocol for each antibiotic The standards are run
in triplicate in the FT-IR and a partial least squares multiple linear regression calibration model
was made using Agilent’s MicroLab Expert. The fingerprint regions from the IR spectra are
selected and used for calibration. Partial Least Squares (PLS) is an analytical tool to make
predictions based on measurements comprising multiple (potentially hundreds) of responses
that are highly co-linear. Developed in the 1960’s by Herman Wold for economics, it has been
applied to process monitoring involving hundreds of controllable variables with multiple
outcomes. In spectroscopy, PLS is used to take each measured frequency in a spectrum of an
analyte mixture and compare it to the calibration set of known relationship between the analyte
and the “impurities”. In the present case, the impurities are the excipients. PLS factors are
calculated as a linear combination of spectral peak amplitudes. Thus, the process is distinct from

14
selecting one, or even ten, key wavelengths for quantitation. PLS literally uses every measured
frequency of the selected spectral range.24
Examples of the IR spectra of pure amoxicillin, ciprofloxacin and doxycycline and the
calibration mixtures for each antibiotic are found in Figure 2.5, together with a calibration curve
taken at a single wavelength to demonstrate linearity for amoxicillin.

15

16

17
Figure 2.5: IR spectra of amoxicillin, ciprofloxacin, and doxycycline and the calibration mixtures
with a calibration curve taken at a single wavelength to demonstrate linearity for amoxicillin.

18
Characteristic regions on the spectrum for each antibiotic (the fingerprints) were
identified where there was little or no absorbance from excipient materials. In our IR spectra for
the three antibiotics, we noticed that the excipients dominated the region 2700-3000 cm-1.
2.5 High- and ultrahigh-performance liquid chromatography (HPLC-UV and UPLC-
UV)25
2.5.1 How Liquid Chromatography (LC) Works26,27
The sample mixture to be separated and analyzed is introduced into the flow path of the
mobile phase and passes to a cartridge or column packed with a stationary phase. When the
mobile phase moves through the column, the sample band separates into individual analyte
bands. The time between injection and detection of an analyte is its retention time. The
retention time of the samples will vary depending on the interaction between the stationary
phase, the molecules being analyzed, and the solvent or solvents used. Analytes having the least
amount of interaction with the stationary phase leave the column more rapidly. An example of
a spectrum obtaining by LC-UV for ciprofloxacin is shown in Figure 2.6.

19
Figure 2.6: An example of a spectrum obtained by LC-UV for ciprofloxacin.
The Van Deemter equation that governs chromatographic performance:
HEPT = A +Bu + C+u + C,u
Where:
• HETP = Height equivalent theoretical plate (plate height)
• A = Eddy-diffusion term
• B = longitudinal diffusion term
• C = Resistance to mass transfer term
• u = Linear velocity of the mobile phase
Height equivalent theoretical plate: is a result of normalizing the efficiency of a chromatography
column with the length of the column. Plate height is the distance between successive partitions
by the analyte with the stationary phase.

20
Eddy diffusion: describes the peak broadening due to the presence of stationary phase particles
in the column. Eddy diffusion occurs as a result of multiple flow paths through a packed column
bed.
Longitudinal diffusion: refers to the diffusion of individual analyte molecules in the mobile phase
along the longitudinal direction of a column. Longitudinal diffusion contributes to peak
broadening only at very low flow rates below the minimum plate height.
The C-term: relates to the mass transfer of sample components between the stationary phase
and the mobile phase during separation. There are two separate mass transfer terms:
Cm-term: describing the contributions to peak broadening in the mobile phase.
Cs-term: describing the contributions to peak broadening in the stationary phase.
Resistance to mass transfer is dependent on the speed with which the partition equilibrium
between mobile and stationary phases is obtained.
We can see that column performance is proportional to particle size, as shown by the
components of the Van Deemter equations:
𝐴 = 𝜆𝑑1 and 𝐶3 ∝ 𝑑15/𝐷3
Where:
𝜆: is particle shape
dp: Particle size or particle diameter; the larger the particles, the stronger the dispersion effect.
DM: Diffusion coefficient of analyte in the mobile phase

21
Therefore, if the size of the particles decreases, the magnitude of the Eddy diffusion term
and the mass transform into the mobile phase term can be dropped, and the plate height
decreases. So, columns with small particles (less than 2μm) provide higher resolution and better
efficiency than the conventional ones. Also, they require high pressure to deliver the mobile
phase. Thus, there has been a move away from high-performance liquid chromatography (HPLC)
toward ultra-high-performance liquid chromatography (UPLC). The particle size used in HPLC is
generally ranged between 3 and 50 µm with 5 µm particles being the most popular, while the
particle size used in UPLC is sub-3 µm. The pump designed to deliver the mobile phase in the 2
to 400 bar pressure range in HPLC, while in UPLC designed to deliver the mobile phase at 15,000
psi (1000 bar). Also, the peak resolution in UPLC higher than in HPLC because the column
dimension of UPLC is smaller than in HPLC. In addition, UPLC delivers separations in 3 to 10
minutes, as compared to 15 to 20-minute separations in traditional HPLC. Consequently, UPLC
technology facilitates improvements of resolution, sensitivity and speed to be achieved, without
compromise. HPLC and UPLC are suitable for a wide variety of applications, including
pharmaceuticals and food processing. It is particularly useful for organic compounds that are low
or non-volatile and cannot be treated with gas chromatography.

22
2.6 Calibration of LC-UV
For the calibration curve, standard solutions of each antibiotic were injected into the UPLC
system with different concentration and run five times (e.g. 0.272, 0510, and 0.830 mg/ml for
ciprofloxacin). Then the calibration graph was obtained by plotting peak area versus
concentration. The linear regression for ciprofloxacin is presented in Figure 2.7.
Figure 2.7: The calibration curve for ciprofloxacin with the regression equation and R2 value.
“error bars are smaller than the symbol size”.

23
Chapter 3
Amoxicillin trihydrate
Amoxicillin was found in 1958 and was used for medicinal purposes in 1972. Amoxicillin
is a broad-spectrum, semisynthetic aminopenicillin antibiotic with bactericidal activity.28
This medicine is used to treat infections caused by bacteria in different parts of the body.
Amoxicillin trihydrate contain amoxicillin as the active ingredient which belongs to the penicillin
family and is a β-lactam antibiotic.
3.1 Structure
Figure 3.1: The structure of amoxicillin.28
3.2 Chemical and physical properties
The amoxicillin trihydrate molecular formula is C16H19N3O5S•3H2O, and the molecular
weight is 419.45 g/mol. In terms of solubility, amoxicillin trihydrate is slightly water-soluble,
very slightly ethanol-soluble. Capsules, tablets, and powder for oral suspension of amoxicillin
are intended for oral administration.29
24
3.3 Materials and methods
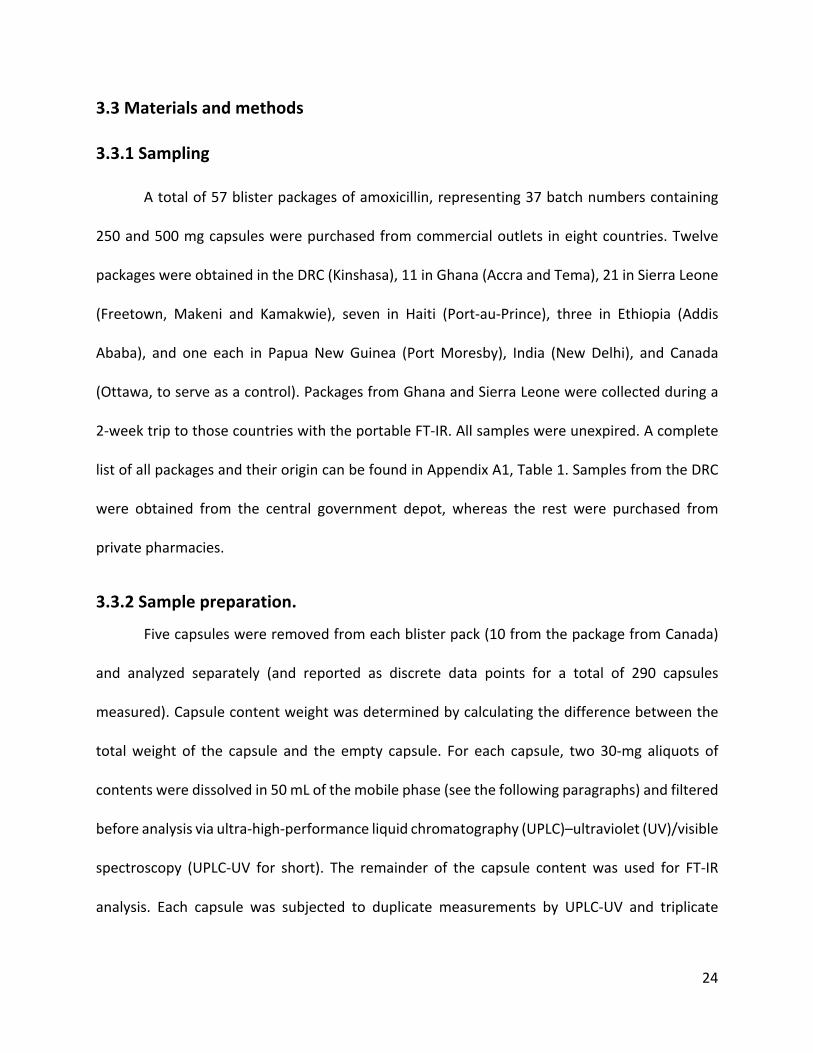
3.3.1 Sampling
A total of 57 blister packages of amoxicillin, representing 37 batch numbers containing
250 and 500 mg capsules were purchased from commercial outlets in eight countries. Twelve
packages were obtained in the DRC (Kinshasa), 11 in Ghana (Accra and Tema), 21 in Sierra Leone
(Freetown, Makeni and Kamakwie), seven in Haiti (Port-au-Prince), three in Ethiopia (Addis
Ababa), and one each in Papua New Guinea (Port Moresby), India (New Delhi), and Canada
(Ottawa, to serve as a control). Packages from Ghana and Sierra Leone were collected during a
2-week trip to those countries with the portable FT-IR. All samples were unexpired. A complete
list of all packages and their origin can be found in Appendix A1, Table 1. Samples from the DRC
were obtained from the central government depot, whereas the rest were purchased from
private pharmacies.
3.3.2 Sample preparation.
Five capsules were removed from each blister pack (10 from the package from Canada)
and analyzed separately (and reported as discrete data points for a total of 290 capsules
measured). Capsule content weight was determined by calculating the difference between the
total weight of the capsule and the empty capsule. For each capsule, two 30-mg aliquots of
contents were dissolved in 50 mL of the mobile phase (see the following paragraphs) and filtered
before analysis via ultra-high-performance liquid chromatography (UPLC)–ultraviolet (UV)/visible
spectroscopy (UPLC-UV for short). The remainder of the capsule content was used for FT-IR
analysis. Each capsule was subjected to duplicate measurements by UPLC-UV and triplicate

25
measurements by FT-IR, with the averages being reported in the figures and tables (see Appendix
A.1).
3.3.3 UPLC-UV protocol.
The UPLC-UV analysis was performed in accordance with the established pharmacopeia
protocol29 on an Agilent 1290 Infinity II system equipped with the following: the G7120A high-
speed binary pump, the G7167B multisampler with a 25-𝜇L sample loop, the G7116B
multicolumn thermostat, and the G7114B variable wavelength detector (VWD). Reagents were
purchased from Sigma-Aldrich and acetonitrile was purchased from Fisher Scientific Canada.
Amoxicillin trihydrate, pharmaceutical secondary standard, a certified reference material
traceable to BP 19; PhEur A0900000; and USP 1031503 was purchased from Sigma-Aldrich.
Standard calculations30 were used to translate the HPLC pharmacopeia procedure to UPLC (which
only changes mobile phase flow rate and column diameter). The mobile phase used was 0.2 M
ACS-grade potassium phosphate monobasic at a pH of 5.0, adjusted with 2 M of ACS-grade
sodium hydroxide, and UPLC-UV–quality acetonitrile at an isocratic ratio of 87:13. The flow rate
for the mobile phase was 0.579 mL/minute. The stationary phase used was the Zorbax SB-C18
UPLC column with a column length of 0.05 m, an internal diameter of 2.1 mm, and a pore size of
1.8 𝜇m. An injection volume of 10 𝜇L was used and the VWD was set at 254 nm.29
Three aliquots of certified reference material–grade amoxicillin trihydrate (Sigma-Aldrich)
was weighed in 15, 30, and 45 mg amounts and then dissolved in 50 mL of mobile phase and
filtered. The standard was analyzed at the same time as the analyte sample to produce the
external calibration curve for quantitation. The amount of amoxicillin in the analyzed aliquot
interpolated from the calibration curve is converted to the relative amount of API in %w/w and

26
multiplied by the total weight of the capsule’s contents.29 A complete set of numerical results
and their uncertainty can be found in Appendix A1, Table 3.
3.3.4 FT-IR protocol.
In triplicate, approximately 30–50 mg from each capsule was placed on the FT-IR sampling
crystal of an Agilent 4500a portable FT-IR equipped with a single-bounce attenuated total
reflectance sampling accessory. Both background and sample analyses are measured at a
resolution of 4 cm-1. One hundred and twenty-eight scans were performed over the spectral
range of 4,000–650 cm-1 for a total run time of 2 minutes.
The calibration curve of %w/w of amoxicillin (12 points varying between 0% and 84.6% of
anhydrous amoxicillin) was prepared by varying the amount of amoxicillin trihydrate (see UPLC
protocol for information on this standard) in a capsule and filling them to 594 mg with an
excipient matrix as described in the literature.31 Ten grams of excipient matrix was prepared by
mixing 4.997 g of sodium dodecyl sulfate, 4.330 g of magnesium stearate, and 0.673 g of silicon
dioxide. After that, all the excipients were ground with a mortar and pestle until it turns into a
fine powder, approximately 3-5 minutes. All excipients were of ACS grade and purchased from
Sigma-Aldrich. The standards were then run in triplicate and a partial least squares multiple linear
regression calibration model was made using Agilent’s MicroLab Expert with the area selected in
the region of 1,800–1,150 cm-1. Examples of the IR spectrum of amoxicillin and the calibration
mixtures are found in Figure 2.4 chapter 2 on IR calibration section. The software gives the
relative percentage of weight to weight of the API. Multiplying this percentage by the total mass
of the sample yields the total mass of the API. Dividing the total mass of API by the expected mass

27
from the package label results in the percentage API (%API) used in the figures. A complete set
of numerical results and their uncertainty can be found in Appendix A1, Table 4.
3.4 Results and discussion
3.4.1 Total dose mass
The simplest analysis performed on the capsules was to weigh them. This allowed for both
the identification of outliers as well as the determination of the %API by FT-IR (see methodology).
The results across all samples, plotted by country of origin, are shown in Figure 3.2 as the %
relative standard deviation from the expected mass listed on the packaging. Individual results are
listed in Excel spreadsheet format in Appendix A1, Table 2. All but five of the measurements fall
within the allowable ±10% of the listed mass, with a few exceptions. Notably, three of the
capsules obtained from Haiti were significantly low. This points to poor quality control in the
capsule filling process and leads to low values for the %API (see the following paragraphs).
Figure 3.2: Mass results by countries.

28
3.4.2 UPLC-UV results
The results of the %API across all samples are summarized in Figure 3.3 as function of
country of origin. Ninety-five percent of the capsules fell within the 90–110% limit for the %API,
but 13 fell below that deemed acceptable. As expected, those capsules with very poor content
masses by extension also had very low %API. Of particular concern were selected samples from
Haiti, the DRC, Ghana, and Sierra Leone that fell well below 90% API, including one capsule from
Haiti that contained only 65% API.
Figure 3.3: The LC-UV results for amoxicillin by countries.

29
3.4.3 FT-IR results
The results derived from the FT-IR protocol of the %API across all capsules are
summarized in Figure 3.4 as a function of country of origin. As was seen in the UV results, most
capsules (92%) fall inside the approved guidelines of 90–110% API. Eight percent of the capsules
fell outside this range; however, all but four lie close to the 90% API cutoff.
Figure 3.4: The FT-IR results for amoxicillin by countries.

30
3.4.4 UPLC vs FT-IR
Figure 3.5 displays the %API found for each capsule by the two techniques. The solid line
represents the ideal 1:1 agreement between the two. There is generally good agreement
between the two methods with the data clustering along the 1:1 line. The FT-IR predicts low %API
values for the same capsules identified by LC-UV. In other words, the major outliers, and thus the
capsules of concern, are identified by both techniques.
Figure 3.5: %API of amoxicillin by LC-UV vs. FT-IR.

31
Chapter 4
Ciprofloxacin Hydrochloride
Ciprofloxacin Hydrochloride is the hydrochloride salt form of ciprofloxacin, a
fluoroquinolone related to nalidixic acid with antibacterial activity.32
This medication is used to treat a variety of bacterial infections. Ciprofloxacin belongs to
a class of drugs called quinolone antibiotics.
4.1 Structure
Figure 4.1: The structure of ciprofloxacin.32
4.2 Chemical and physical properties
The molecular formula of ciprofloxacin hydrochloride is C17H18FN3O3,HCl, and the
molecular weight is 367.8 g/mol. Ciprofloxacin hydrochloride is soluble in water, slightly soluble
in methanol, very slightly soluble in ethanol, practically insoluble in acetone, in ethyl acetate and
in methylene chloride.33

32
4.3 Materials and methods
4.3.1 Sampling.
A total of 55 blister packages of ciprofloxacin, representing 36 batch numbers containing
250 and 500 mg tablets were purchased from commercial outlets in nine countries. Two packages
were obtained in the Democratic Republic of Congo (Kinshasa), 10 in Ghana (Accra and Tema,
Atimpoku/volta Bridge), 12 in Sierra Leone (Freetown, Makeni and Kamakwie), 3 in Haiti (Port-
au-Prince), 5 in Ethiopia (Addis Ababa) and 1 each in Papua New Guinea (Port Moresby), India
(New Delhi), Indonesia (Jakarta) and Canada (Ottawa, to serve as a control). Packages from Ghana
and Sierra Leone were collected during a two-week trip to those countries with the portable FT-
IR. All samples were unexpired. A complete list of all packages and their origin can be found in
Appendix A2, Table 1. Samples from the DRC were obtained from the central government depot,
while the rest were purchased from private pharmacies.
4.3.2 Sample preparation.
Five tablets were removed from each blister pack (10 from the package from Canada) and
analyzed separately (and reported as discrete data points for a total of 280 tablets of
ciprofloxacin measured). For each tablet, two 30 mg aliquots of contents were dissolved in 50 mL
of the mobile phase (see the following paragraph) and filtered before analysis via UPLC-UV. The
remainder of the tablet was used for FT-IR analysis. Each tablet was subjected to duplicate
measurements by UPLC-UV and triplicate measurements by FT-IR, with the averages being
reported in the figures and tables (see Appendix A2).

33
4.3.3 UPLC protocol.
The UPLC-UV analysis was performed in accordance with the established pharmacopeia
protocol33 on an Agilent 1290 Infinity II system equipped with the following: the G7120A high-
speed binary pump, the G7167B multisampler with a 25-𝜇L sample loop, the G7116B
multicolumn thermostat, and the G7114B variable wavelength detector (VWD). Reagents were
purchased from Sigma-Aldrich and acetonitrile was purchased from Fisher Scientific Canada.
Ciprofloxacin hydrochloride, pharmaceutical secondary standard, and USP 1031503 was
purchased from Sigma-Aldrich. Standard calculations30 were used to translate the HPLC
pharmacopeia procedure to UPLC (which only changes mobile phase flow rate and column
diameter). The mobile phase used was 2.45 g/L phosphoric acid at pH of 3.0, adjusted with 2M
of ACS grade sodium hydroxide, and UPLC-UV quality acetonitrile at an isocratic ratio of 87:13.
The flow rate for the mobile phase was 0.87 ml/min. The stationary phase used was the Zorbax
SB-C18 UPLC column with a column length of 0.05 m, an internal diameter of 2.1 nm and a pore
size of 1.8 µm. An injection volume of 10 µL was used and the VWD was set at 278 nm33.
Three aliquots of certified reference material grade ciprofloxacin (Sigma-Aldrich) were
weighed in 10, 25 and 40 mg amounts then dissolved in 50 mL of mobile phase and filtered. The
standard was analyzed at the same time as the analyte sample to produce the external calibration
curve for quantitation. The amount of ciprofloxacin in the analyzed aliquot interpolated from the
calibration curve is converted to the relative amount of API in %w/w and multiplied by the total
weight of the capsule’s and tablet's contents.33 A complete set of numerical results and their
uncertainty can be found in Appendix A2, Table 3.

34
4.3.4 FT-IR Protocol.
In triplicate, approximately 30 to 50 mg from each tablet was placed on the FT-IR
sampling crystal of an Agilent 4500a portable FT-IR equipped with a single-bounce attenuated
total reflectance (ATR) sampling accessory. Both background and sample analyses are measured
at a resolution of 4 cm-1. 128 scans were done over the spectral range of 4000 - 650 cm-1 for a
total run time of 2 minutes.
The calibration curve of % w/w of ciprofloxacin (11 points varying between 0 and 88.74%
of anhydrous ciprofloxacin was prepared by varying the amount of ciprofloxacin hyclate in a
capsule and filling them to 500 mg with an excipient matrix as described in the literature34. Five
grams of excipient matrix was prepared by mixing 821.4 mg of erospovidon, 2181.5 mg of sodium
starch glycolate, 259.6 mg of povidone, 1483.0 mg of cellulose, 165.5 of magnesium stearate,
and 95.8 mg silicon dioxide. After that, all the excipients were ground with a mortar and pestle
until it turns into a fine powder, approximately 3-5 minutes. All excipients were of ACS grade and
purchased from Sigma-Aldrich. The standards were run in triplicate and partial least squares
(PLS1) multiple linear regression calibration models were made using Agilent’s MicroLab Expert
with the area selected in the region of 1063.133-1768.786 cm-1, 2539.604-2803.991 cm-1 and
3463.096-3593.428 cm-1. The software gives the relative percentage of weight to weight of the
API. Multiplying this percentage by the total mass of the sample yields the total mass of the API.
Dividing the total mass of API by the expected mass from the package label results in the API
(%API) used in the figures. A complete set of numerical results and their uncertainty can be found
in Appendix A2, Table 4.
35
4.4 Results and discussion
4.4.1 Total dose mass.
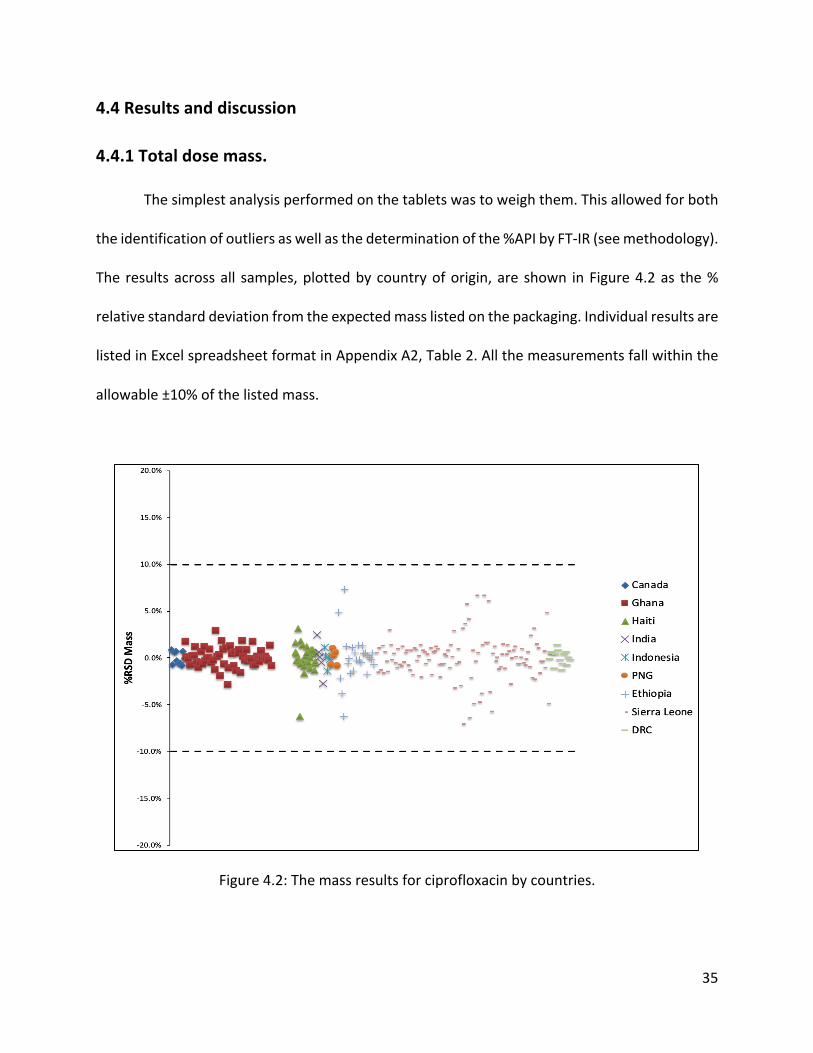
The simplest analysis performed on the tablets was to weigh them. This allowed for both
the identification of outliers as well as the determination of the %API by FT-IR (see methodology).
The results across all samples, plotted by country of origin, are shown in Figure 4.2 as the %
relative standard deviation from the expected mass listed on the packaging. Individual results are
listed in Excel spreadsheet format in Appendix A2, Table 2. All the measurements fall within the
allowable ±10% of the listed mass.
Figure 4.2: The mass results for ciprofloxacin by countries.

36
4.4.2 UPLC-UV results.
The results of the %API across all samples are summarized in Figure 4.3 as a function of
country of origin. The majority of the tablets fell within the 90–110% limit for the %API, but
fourteen fell up and below that deemed acceptable. Although all the tablets mass fell within the
range ±10%, five tablets contained more than the allowed amount of API and the remaining nine
tablets had an insufficient amount of the active pharmaceutical ingredients.
Figure 4.3: The LC-UV results for ciprofloxacin by countries.

37
4.4.3 FT-IR results.
The results derived from the FT-IR protocol of the %API across all tablets are summarized
in Figure 4.4 as a function of the country of origin. 236 out of 280 tablets fall inside the approved
guidelines of 90–110% API. Forty-four of the tablets fell outside this range. Thirty-four of the
tablets that fell outside the acceptable range fell down 90%, and five of them lie very close to the
90% API cutoff. The remaining ten tablets fell close to 110%.
Figure 4.4: The FT-IR results for ciprofloxacin by countries.

38
4.4.4 UPLC vs FT-IR
Figure 4.5 displays the %API found for each capsule by the two techniques. The solid line
represents the ideal 1:1 agreement between the two. There is generally good agreement
between the two methods with the data clustering along with the 1:1 line. The FT-IR predicts low
%API values for the same tablets identified by LC-UV. In other words, the major outliers, and thus
the capsules of concern, are identified by both techniques.
Figure 4.5: %API of ciprofloxacin by LC-UV vs. FT-IR.

39
Chapter 5
Doxycycline hyclate
Doxycycline hyclate is the hyclate salt form of doxycycline, a synthetic, broad-spectrum
tetracycline antibiotic exhibiting antimicrobial activity. Doxycycline can be used either by mouth
or by injection into a vein.35
5.1 Structure
Figure 5.1: The structure of doxycycline.34
5.2 Chemical and physical properties
The formula of the molecular of doxycycline hyclate is C22H24N2O8, HCL,0.5 C2H5OH,0.5
H2O, and the weight of the molecular is 512.94 g/mol. Doxycycline hyclate is freely soluble in
water and methanol, sparingly soluble in ethanol.35

40
5.3 Materials and methods
5.3.1 Sampling.
A total of 17 blister packages of doxycycline, representing 10 batch numbers containing
100 mg tablets and capsules were purchased from commercial outlets in 6 countries. 11 packages
were obtained in Ghana (Accra and Tema, Atimpoku/Volta Bridge), 2 in Sierra Leone (Freetown,
Makeni and Kamakwie), and one each in Papua New Guinea (Port Moresby), India (New Delhi),
in Ethiopia (Addis Ababa), and Canada (Ottawa, to serve as a control). Packages from Ghana and
Sierra Leone were collected during a two-week trip to those countries with the portable FT-IR.
All samples were unexpired and purchased from private pharmacies. A complete list of all
packages and their origin can be found in Appendix A3, Table 1.
5.3.2 Sample preparation.
Five capsules and tablets were removed (10 from the package from Canada) and analyzed
separately (and reported as discrete data points for a total of 42 of tablets and capsules of
doxycycline measured). Capsule content weight was determined by calculating the difference
between the total weight of the capsule and the empty capsule. The samples were analyzed first
in the FT-IR then the reminder capsule content was run via UPLC-UV. For each tablet and capsule,
two 6.2 mg aliquots of contents were dissolved in 10 mL of the mobile phase (see the following
paragraph) and filtered before analysis via UPLC-UV. Each tablet and capsule were subjected to
duplicate measurements by UPLC-UV and triplicate measurements by FT-IR, with the averages
being reported in the figures and tables (see Appendix A3).

41
5.3.3 UPLC protocol.
The UPLC-UV analysis was performed in accordance with the established pharmacopeia
protocol35on an Agilent 1290 Infinity II system equipped with the following: the G7120A high-
speed binary pump, the G7167B multisampler with a 25-𝜇L sample loop, the G7116B
multicolumn thermostat, and the G7114B variable wavelength detector (VWD). Reagents were
purchased from Sigma-Aldrich and acetonitrile was purchased from Fisher Scientific Canada.
Doxycycline hyclate, pharmaceutical secondary standard, and USP 1031503 was purchased from
Sigma-Aldrich. Standard calculations30 were used to translate the HPLC pharmacopeia procedure
to UPLC (which only changes mobile phase flow rate and column diameter). The mobile phase
used was water with 0.1% of trifluoroacetic acid (TFA), and acetonitrile adjusted with 0.1% of
TFA. The ratio was 60:40. The flow rate for the mobile phase was 0.58 ml/min. The stationary
phase used was the Zorbax SB-C18 UPLC column with a column length of 0.05m, an internal
diameter of 2.1 mm and a pore size of 18 µm. An injection volume of 0.8 µL was used and the
VWD was set at 360 nm.35
One aliquot of certified reference material grade doxycycline (Sigma-Aldrich) was
weighed in 50 mg amount then dissolved in 50 ml of the mobile phase and filtered then three
dilutions were taken in 0.5%, 0.1%, and 0.05%. The standard was analyzed at the same time as
the analyte sample to produce the external calibration curve for quantitation. The amount of
doxycycline in the analyzed aliquot interpolated from the calibration curve is converted to the
relative amount of API in %w/w and multiplied by the total weight of the capsule’s and tablet's
contents.35 A complete set of numerical results and their uncertainty can be found in Appendix
A3, Table 3.

42
5.3.4 FT-IR protocol.
In triplicate, approximately 20 to 30 mg from each capsule of doxycycline was placed on
the FT-IR sampling crystal of an Agilent 4500a portable FT-IR equipped with a single bounce
attenuated total reflectance (ATR) sampling accessory. Both background and sample analyses are
measured at a resolution of 4 cm-1. 128 scans were done over the spectral range of 4000 -650
cm-1 for a total run time of 2 minutes.
The calibration curve of %w/w of doxycycline (11 points varying between 0 and 81.55%
of hyclate doxycycline) was prepared by varying the amount of doxycycline hyclate in a capsule
and filling them to the same amount with an excipient matrix. 16.600 grams of excipient matrix
was prepared by mixing 13 grams of microcrystalline cellulose (Avicel PH 102), 2 grams of Starch
(cornstarch dried), 300 mg of sodium lauryl sulphate, 300 mg of sodium silicon dioxide (Aerosil
200), and 1-gram magnesium stearate. After that, all the excipients were ground with a mortar
and pestle until it turns into a fine powder, approximately 3-5 minutes. All excipients were of ACS
grade and purchased from Sigma-Aldrich. The standards were then run in triplicate and partial
least squares (PLS1) multiple linear regression calibration models were made using Grams IQ with
the area selected in the region of 1735.2-1489.5 cm-1. The software gives the relative percentage
of weight to weight of the API. Multiplying this percentage by the total mass of the sample yields
the total mass of the API. Dividing the total mass of API by the expected mass from the package
label results in the %API used in the figures. A complete set of numerical results and their
uncertainty can be found in Appendix A3, Table 4.

43
5.4 Results and discussion
5.4.1 Total dose mass.
The simplest analysis performed on the tablets was to weigh them. This allowed for both
the identification of outliers as well as the determination of the %API by FT-IR (see methodology).
The results across all samples, plotted by country of origin, are shown in Figure 5.2 as the %
relative standard deviation from the expected mass listed on the packaging. Individual results are
listed in Excel spreadsheet format in Appendix A3 Table1. All the measurements fall within the
allowable ±10% of the listed mass.
Figure 5.2: The mass results for doxycycline by countries.

44
5.4.2 UPLC-UV results.
The results of the %API across all samples are summarized in Figure 5.3 as a function of
country of origin. More than half of the capsules fell out the satisfactory range of the active
pharmaceutical ingredients (90% - 110%). One sample of the 28 pills that lie out of 90- 110% is
close to 110%, and five located in the range of eighty.
Figure 5.3: The LC-UV results for doxycycline by countries.

45
5.4.3 FT-IR results.
The results derived from the FT-IR protocol of the %API across all tablets are summarized
in Figure 5.4 as a function of the country of origin. 24 out of 42 tablets fall inside the approved
limit of 90–110% active pharmaceutical ingredients and the rest lie outside this range.
Figure 5.4: The FT-IR results for doxycycline by countries.

46
5.4.4 UPLC vs FT-IR
Figure 5.5 displays the %API found for each capsule by the two techniques. The solid line
represents the ideal 1:1 agreement between the two. There is not a good agreement between
the two methods with the data clustering along with the 1:1 line. When FT-IR predicts low %API
values, the UV gives the opposite values. Noticeably, samples 0004 and 0007 have the most
significant mass, the least LC-UV results, and the highest FT-IR results.
Figure 5.5: %API of doxycycline by LC-UV vs. FT-IR
The disagreement between both techniques, in this case, might be due to several reasons.
Usually, we run the samples in the LC-UV then by the FT-IR, but in the doxycycline case, we did
the opposite. Storing the content of the capsules after grinding them for eight months before

47
running them by the LC-UV could be a reason to change the chemical properties of the antibiotic.
In addition, perhaps the reason is that there are limits to the capabilities of the Fourier transform
IR spectrometer. One of those limitations is the masking effect. Masking effect happens in drug
studies when we are analyzing a mixture of compounds. When an excipient and active
pharmaceutical ingredient have dipole moments, they can absorb IR at similar wavelengths. The
excipient compound masks the signal (peak) of our actual active drug compound that we want
to analyze. As a result, the disagreement between the two methods LC-UV and FT-IR is significant.
48
Chapter 6
Conclusions
Poor-quality medicines present a serious public health problem, particularly in emerging
economies and developing countries, and may have a significant impact on the national clinical
and economic burden. Substandard medicines are widespread and represent a threat to health
because they can inadvertently lead to healthcare failures, such as antibiotic resistance and the
spread of disease within a community, as well as death or additional illness in individuals.
Regarding drug quality, 13 of 290, 14 of 280, and 28 of 42 individual capsules and tablets
of amoxicillin, ciprofloxacin, and doxycycline respectively were found to be substandard with
total API lying outside the acceptable range of 90–110%. The FT-IR reliably identified these
outliers and was found to yield results in good agreement, except for the doxycycline, with the
established pharmacopeia UPLC-UV protocol. Matrix effects were clearly identifiable in the FT-
IR since the entire IR spectrum is being acquired, rather than a single wavelength. This avoids
false readings from entering into the results. It is possible to modify the spectral window used in
the calibration and analyses after the fact, without having to rerun samples, to account for small
changes in excipient composition. This can be performed quickly on-site by the field technician
using the instrument software. When calibration needs to be updated with new excipients,
previously obtained IR data can simply be reloaded and checked against the new calibration
(perhaps performed in a laboratory), without rerunning the original samples. This avoids the
necessity of prolonged sample storage which may, by necessity, be in suboptimum conditions.
49
To conclude, the field portable FT-IR may be suitable to intercept substandard antibiotics
in developing countries where more sophisticated techniques are not available. The benefits of
the FT-IR come from its relatively low cost, its portability, simplicity of use, and rapid analysis
time.

50
Bibliography
1. Höllein L, Kaale E, Mwalwisi YH, Schulze MH, Holzgrabe U. Routine quality control of
medicines in developing countries: Analytical challenges, regulatory infrastructures and
the prevalence of counterfeit medicines in Tanzania. TrAC - Trends Anal Chem.
2016;76:60-70.
2. WHO. Substandard / Spurious / Falsely-Labelled / Falsified / Counterfeit Medical
Products. Geneva, Switzerland; 2012.
3. Interpol. 2004–2014—Ten Years of Combating Pharmaceutical Crime: Review and
Prospects, Dublin, Ireland 19–20 November 2014. Lyon, France; 2014.
4. Pezzola A, Sweet CM. Global pharmaceutical regulation: The challenge of integration for
developing states. Global Health. 2016:12:85.
5. Nickerson JW, Attaran A, Westerberg BD, Curtis S, Overton S, Mayer P. Fatal bacterial
meningitis possibly associated with substandard ceftriaxone — Uganda, 2013. Morb
Mortal Wkly Rep. 2016;64:1375-1377.
6. Mumphansha H, Nickerson JW, Attaran A, et al. An Analysis of Substandard Propofol
Detected in Use in Zambian Anesthesia. Anesth Analg. 2017;125:616-619.
7. Nayyar GML, Breman JG, Newton PN, Herrington J. Poor-quality antimalarial drugs in
southeast Asia and sub-Saharan Africa. Lancet Infect Dis. 2012;12:488-496.
8. Nayyar GML, Breman JG, Herrington JE. The global pandemic of falsified medicines:
laboratory and field innovations and policy perspectives. Am J Trop Med Hyg. 2015;92:2-
7.
9. Senior V. Antimicrobial resistance: What does medicine quality have to do with it? 2015.

51
10. Hajjou M, Krech L, Lane-Barlow C, et al. Monitoring the quality of medicines: results from
Africa, Asia, and South America. Am J Trop Med Hyg. 2015;92:68-74.
11. Bate R, Coticelli P, Tren R, Attaran A. Antimalarial drug quality in the most severely
malarious parts of Africa - A six country study. PLoS One. 2008;3:3-5.
12. Kaur H, Goodman C, Thompson E, et al. A nationwide survey of the quality of
antimalarials in retail outlets in Tanzania. PLoS One. 2008;3:1-7.
13. Martino R, Malet-Martino M, Gilard V, Balayssac S. Counterfeit drugs: Analytical
techniques for their identification. Anal Bioanal Chem. 2010;398:77-92.
14. Jamrógiewicz M. Application of the near-infrared spectroscopy in the pharmaceutical
technology. J Pharm Biomed Anal. 2012;66:1-10.
15. Been F, Roggo Y, Degardin K, Esseiva P, Margot P. Profiling of counterfeit medicines by
vibrational spectroscopy. Forensic Sci Int. 2011;211:83-100.
16. Sacré PY, Deconinck E, De Beer T, et al. Comparison and combination of spectroscopic
techniques for the detection of counterfeit medicines. J Pharm Biomed Anal.
2010;53:445-453.
17. Bate R, Tren R, Hess K, Mooney L, Porter K. Pilot study comparing technologies to test for
substandard drugs in field settings. African J Pharm Pharmacol. 2009;3:165-170.
18. Mbinze JK, Sacré PY, Yemoa A, et al. Development, validation and comparison of NIR and
Raman methods for the identification and assay of poor-quality oral quinine drops. J
Pharm Biomed Anal. 2015;111:21-27.
19. Said MM, Gibbons S, Moffat AC, Zloh M. Near-infrared spectroscopy (NIRS) and
chemometric analysis of Malaysian and UK paracetamol tablets: A spectral database

52
study. Int J Pharm. 2011;415:102-109.
20. Pavia DL, Lampman GM, Kriz GS, Vyvyan JR. INFRARED SPECTROSCOPY. In: Introduction
to Spectroscopy. Nelson Education, 2014; 2013:15-28.
21. Bunaciu AA, Aboul-Enein HY, Fleschin S. Application of fourier transform infrared
spectrophotometry in pharmaceutical drugs analysis. Appl Spectrosc Rev. 2010;45:206-
219.
22. Smith BC. Fundamentals of Fourier Transform Infrared Spectroscopy. New York,NY: CRC
Press; 2011.
23. PerkinElmer. FT-IR Spectroscopy Attenuated Total Reflectance (ATR). PerkinElmer Life
and Analystical Sciences. https://cmdis.rpi.edu/sites/default/files/ATR_FTIR.pdf.
Published 2005.
24. Tobias RD. An introduction to partial least squares regression. SAS Conf Proc SAS Users Gr
Int 20 (SUGI 20). 1995:2-5. doi:http://support.sas.com/techsup/technote/ts509.pdf
25. Kumar A, Saini G, Nair A, Sharma R. UPLC: A preeminent technique in pharmaceutical
analysis. Acta Pol Pharm - Drug Res. 2012;69:371-380.
26. Dong MW. Modern HPLC for Practicing Scientists. New Jersey: John Wiley & Sons, Inc.,
Hoboken; 2006.
27. Malviya R, Bansal V, Pal OP, Sharma PK. High performance liquid chromatography: A
short review. J Glob Pharma Technol. 2010;2:22-26.
28. Amoxicillin trihydrate. National Center for Biotechnology Information. PubChem
Database. https://pubchem.ncbi.nlm.nih.gov/compound/Amoxicillin-trihydrate.
Accessed November 13, 2019.

53
29. British Pharmacopoeia Commision. Amoxicillin trihydrate (Amoxicillinum trihydricum).
International Pharmacopoeia 2009. http://www.uspbpep.com/ep60/amoxicillin
trihydrate 0260e.pdf. Published 2009. Accessed October 1, 2017.
30. Sigma Aldrich. HPLC Method Transfer Calculator.
https://www.sigmaaldrich.com/analytical-chromatography/hplc/method-transfer-
calculator.html. Published 2018.
31. Niazi SK. Handbook of Pharmaceutical Manufacturing Formulations: Uncompressed Solid
Products. New York,NY: CRC Press; 2009.
32. Ciprofloxacin hydrochloride. National Center for Biotechnology Information. PubChem
Database. https://pubchem.ncbi.nlm.nih.gov/compound/Ciprofloxacin-hydrochloride .
Accessed November 14, 2019.
33. British Pharmacopoeia Commision. Ciprofloxacini hydrochloridum.
https://www.mendeley.com/catalogue/ciprofloxacini-hydrochloridum-cisapride-
monohydrate-cisapridum-monohydricum/. Published 2005. Accessed November 20,
2017.
34. Niazi SK. Handbook of Pharmaceutical Manufacturing Formulations: Compressed Solid
Products. New York,NY: CRC Press LLC; 2009.
35. Kogawa AC, Salgado HRN. Quantification of doxycycline hyclate in tablets by HPLC-UV
method. J Chromatogr Sci. 2013;51:919-925.