TOURISM IN ICELAND IN FIGURES - Ferðamálastofa · TOURISM IN ICELAND IN FIGURES Page ......
27
TOURISM IN ICELAND IN FIGURES MAY 2016 Geirsgata 9 | 101 Reykjavík | Sími 535 5500 Hafnarstræti 91 | 600 Akureyri | Sími 535-5500 [email protected] www.ferdamalastofa.is
Transcript of TOURISM IN ICELAND IN FIGURES - Ferðamálastofa · TOURISM IN ICELAND IN FIGURES Page ......

TOURISM IN ICELAND IN FIGURESMAY 2016
Geirsgata 9 | 101 Reykjavík | Sími 535 5500 Hafnarstræti 91 | 600 Akureyri | Sími 535-5500

1
REPORT BY: ODDNÝ ÞÓRA ÓLADÓTTIR
ASSISTANCE WITH DATA PROCESSING: KÁRI GUNNARSSON
COVER PHOTO: RAGNAR TH. SIGURÐSSON / PORTHÖNNUN
TOURISM IN ICELAND IN FIGURES CONTENTS
Page ECONOMIC STATISTICS IN ICELAND 2 FOREIGN CARD TURNOVER 3 PERMITS 4 INTERNATIONAL VISITORS AND CRUISES 5 INTERNATIONAL VISITORS TO ICELAND 2013-2015 6 INTERNATIONAL VISITORS BY MONTHS 7 INTERNATIONAL VISITORS BY SEASON 8 NATIONALITIES TROUGH KEFLAVIK AIRPORT 2015/2014 9 MARKETING AREAS THROUGH KEFLAVIK AIRPORT 2010-2015 10 DEPARTURES FROM KEFLAVÍK AIRPORT 2015 11 OVERNIGHT STAYS – ALL TYPES OF ACCOMMODATION 12 GUEST NIGHTS BY REGION 13 AVAILABLE ROOMS AND OCCUPANCY RATE 14 GUEST NIGHTS BY TYPE OF ACCOMMODATION 15 NUMBER & DEVELOPMENT OF GUEST NIGHTS & TRAVELLERS 16 NUMBER OF VISITORS AT TOURIST LOCATIONS 17
TRAVELS OF ICELANDERS 2015/2014 18 SURVEY AMONG TOURISM COMPANIES 25

2
ECONOMIC STATISTICS IN ICELANDIC TOURISM
THE SHARE OF TOURISM IN EXPORT REVENUE
Tourism’s share of foreign exchange earnings has grown from 18.8%
to 31.0% between 2010–2015 according to measurements on the
export of goods and services. At present, tourism accounts for more
foreign exchange income than the fisheries industry and aluminium
production.
Export of goods and services (ISK billion)
Tourism* (ISK billions)
Share of tourism
2010 865,628 162,828 18.8% 2011 960,364 196,497 20.5% 2012 1,012,182 239,544 23.7% 2013 1,047,616 276,343 26.4% 2014 1,067,242 303,609 28.4%
2015 1,176,616 364,352 31.0% *Total activity of Icelandic companies operating in Iceland and abroad.
SPENDING OF FOREIGN VISITORS
Revenue from foreign tourists amounted to ISK 208.4 billion in 2015,
i.e. ISK 49.3 billion more than in 2014. This represents a year-on-
year increase of some 31%.
Travel consumption (ISK bn. ¹)
Average spent per person
2010 68,536 140,300 2011 86,937 153,700 2012 108,070 160,600 2013 130,772 162,000 2014 159,050 159,300
2015 208,351 161,600 ¹In ISK at each year’s price levels. International flights and ferries are not included.
JOBS IN TOURISM-RELATED INDUSTRIES
The total amount of individuals working in tourism-related
industries was 21,600 in 2014, i.e. 2,600 more than in 2013. While
the number of people working nationally has increased by just more
than 6% since 2010, the number of those working in tourism-related
industries has increased by 37.6%.
Accommodation and restaurant operators,
travel agents, tour operators
Passenger transport on land, sea and
by air
Total
2010 9,800 6,300 15,700 2011 11,100 6,500 17,200 2012 11,100 6,800 17,500 2013 12,800 6,600 19,000 2014 14,500 7,600 21,600
Source: Statistics Iceland.
18,8% 20,5%
23,7%
26,4% 28,4%
31,0%
0
5
10
15
20
25
30
35
2010 2011 2012 2013 2014 2015
Tourism
Aluminium
Fisheries
EXPORT OF GOODS AND SERVICES

3
FOREIGN CARD TURNOVER
There has been considerable growth in foreign card turnover in
Iceland in recent years. In 2013, card turnover was more than ISK 90
billion; this rose to more than ISK 154 billion in 2015.
Foreign card turnover rose sharply in every month between 2013–14 and 2014–15. Card turnover was highest in the summer months;
for instance, summer turnover in 2015 was 41.8% of the year total. However, the ratio outside the summer months has increased in
accordance with increased tourism.
FOREIGN CARD TURNOVER BY EXPENSE ITEMS*
In 2015, almost a third (31.1%) of foreign card turnover was spent on accommodation and restaurant services, 19.2% on passenger
transport, 14.9% in shops, 13.9% on various types of tourism service, e.g. sightseeing tours, 4.2% on petrol services and vehicle
repair and maintenance, 2.4% on culture, entertainment and recreational activities and 5.5% on other tourism-related aspects. Cash withdrawals made up 9.1% of card turnover.
* The data on card turnover by expense items contains all payment card use, both debit and
credit cards. The card turnover of foreigners who purchase travel tickets or package tours to
Iceland from their home countries is not included unless the card turnover is channelled
through Icelandic acquirers.
Source: Centre for Retail Studies.
90,057 112,196
154,417
2013 2014 2015
TOTAL USE OF FOREIGN DEBIT AND CREDIT CARDS IN ICELAND (ISK billions)
0
5.000
10.000
15.000
20.000
25.000
J F M A M J J Á S O N D
CARD TURNOVER BY MONTH (ISK billions)
2013
2014
2015
14.116
8.503
3.636
6.473
21.402
22.730
29.651
17.230
30.678
Cash withdrawals
Other
Culture and recreation
Fuel, automobile services
Miscellaneous tourismservices
Shopping
Passenger transport etc.
Catering services
Accommodation services
2015
2014
2013
CARD TURNOVER BY EXPENSE ITEM (ISK billions)

4
NEW BUILDINGS IN REYKJAVÍK –
GUEST ACCOMODATIONS AND RESTAURANTS
In 2010–2015, the Office of the Building
Inspector in Reykjavík approved 57,600 m2 of
building volume for new guest accommodations
and restaurants. Most were approved in 2013,
or 22,000 m2.
In 2014, a building volume of
18,000 m2 was approved and 14,000 m
2 in 2015.
Region No. Capital Region 677
Reykjanes 50
West/Westfjords 76
North 158
East 37
South 160
Total 1,158
Year m2
2015 14,000 2014 18,000 2013 22,000 2012 300 2011 3,000 2010 300
Total 57,600
Catering
with without Total
Capital Region 98 367 465
Reykjanes 23 52 75
West/Westfj. 96 207 303
North 128 337 465
East 59 146 205
South 76 242 318
Total 480 1351 1831
PERMITS
GUESTHOUSE PERMITS
In 2015, 1,831 accommodations had a permit issued by the District
Commissioner*, thereof 480 with a catering license. Most of these were in
the Capital Region and North Iceland, or 465 in each area. These numbers
are irrespective of the size of the companies and only indicate the number
of operators.
*Permits from the District Commissioner are valid for a period of four years.
ISSUED TRAVEL AGENCY AND TOUR OPERATOR LICENCES
A number of new travel agency and tour operator licences were issued in
2010–2015, most in 2014, or 162, followed by 147 in 2015. The number of
issued licences varies considerably between areas, with most being issued
in the Capital Region and North Iceland.
2010 2011 2012 2013 2014 2015
Capital Region 65 46 64 92 98 95
Reykjanes 3 7 5 10 8 3
West 1 5 1 3 8 3
Westfjords 8 8 6 3 7 1
North 18 13 22 19 24 12
East 0 8 4 4 3 3
South 11 20 23 11 14 30
Total 106 107 125 142 162 147
Most travel agency and tour operator licences valid in 2015 were
registered in the Capital Area, or 58.5%. Outside the Capital Area, most
licences were registered in North and South Iceland.

5
INTERNATIONAL VISITORS AND CRUISES
FOREIGN TOURISTS TO ICELAND
The number of foreign tourists has more than doubled since 2010. The
average yearly growth rate has been 21.6% since 2010. The biggest
increase was from 2014 to 2015, or 29.1%.
Number of visitors Increase
2010 488,600 2010-11 16.6%
2011 565,600 2011-12 18.9%
2012 672,900 2012-13 20.0%
2013 807,300 2013-14 23.6% 2014 998,600 2014-15 29.1% 2015 1,289,140 2010-15* 21.6%
*Average yearly growth rate
INTERNATIONAL CRUISE SHIP PASSENGERS
Since 2010, cruise ship passengers to Iceland have increased significantly,
from 72,000 in 2010 to 103,000 in 2015. The mean annual increase has
been 9.1% per year.
2013 2014 2015
Vessels Passengers Vessels Passengers Vessels Passengers
Reykjavík¹ 80 92,400 91 104,800 108 100,141
Akureyri 63 71,300 78 72,700 86 72,150
Ísafjördur 38 42,300 45 40,300 64 54,000 Seydisfjördur 9 6,500 10 6,700 28 19,115
Grundarfjörður 8 1,900 19 5,400 28 12,628
Vestmannaeyjar² 15 5,900 22 8,200 31 8,036 ¹Approximately 97% of cruise ships visit Iceland in Reykjavík.
² 5,521 passengers came to Eskifjörður, 3,598 to Djúpivogur, 3,200 to Siglufjörður, 2,176 to
Húsavík and 2,000 to Grímsey in 2015.
Sources: Icelandic Tourist Board, Austfar, Isavia, Air Iceland, Faxaports and other
ports that maintain a record of the number of cruise ship passengers.
488,
000
565,
600
672,
800
807,
300 99
8,60
0 1,28
9,10
0
2010 2011 2012 2013 2014 2015
INTERNATIONAL VISITORS TO ICELAND 2010–2015
70,1
00
62,7
00
91,9
00
92,4
00
104,
800
100,
100
2010 2011 2012 2013 2014 2015
INTERNATIONAL CRUISE SHIP PASSENGERS TO REYKJAVÍK 2010-2015
Cruise-ship passengers are defined as day-trip
passengers, as they do not spend the night in Iceland.

6
INTERNATIONAL VISITORS TO ICELAND 2013-2015
The total number of foreign visitors was around 1.3 million in 2015, a 29.2% increase from 2014, when foreign visitors numbered around 998,000.
Around 1,290,000 tourists came on flights through Keflavík International Airport in 2015, or 97.9% of the total number of visitors. Around 18,000 came with Norræna through Seyðisfjörður, or around 1.4% of the total. Around 8,700 came on flights through Reykjavík Airport or Akureyri Airport, or 0.7 % of the total. It should be noted that figures for places other than Keflavík Airport are not based on counts but on assessments based on sales and passenger figures.
INTERNATIONAL VISITORS BY POINT OF ENTRY
Increase/decrease
2013 2014 2015 13/14 14/15
Keflavík Airport 781,016 969,181 1,261,938 24.1% 30.2%
Seyðisfjörður seaport 16,637 18,115 18,540 8.9% 2.3%
Other airports 9,696 10,260 8,662 5.8% -15.6%
Total 807,349 997,556 1,289,140 23.6% 29.2%
VISITORS THROUGH KEFLAVÍK AIRPORT By Nationality
2013 2014 2015 13/14 14/15
Canada 23,970 38,790 46,654 61.8% 20.3%
China 17,597 26,037 47,643 48.0% 83.0%
Denmark 43,119 48,237 49,225 11.9% 2.0%
Finland 13,799 15,415 16,021 11.7% 3.9%
France 48,313 58,293 65,822 20.7% 12.9%
Germany 75,814 85,915 103,384 13.3% 20.3%
Italy 16,213 19,870 23,817 22.6% 19.9%
Japan 12,363 13,340 16,547 7.9% 24.0%
Netherlands 22,820 26,222 29,546 14.9% 12.7%
Norway 52,707 53,647 51,402 1.8% -4.2%
Spain 17,017 20,932 27,166 23.0% 29.8%
Sweden 35,491 40,992 43,096 15.5% 5.1%
Switzerland 14,307 19,315 25,935 35.0% 34.3%
UK 137,108 180,503 241,024 31.7% 33.5%
USA 119,712 152,104 242,805 27.1% 59.6%
Other 130,666 169,569 231,851 29.8% 36.7%
Total 781,016 969,181 1,261,938 24.1% 30.2%
By Market Area
Nordic countries 145,116 158,291 159,744 9.1% 0.9%
UK 137,108 180,503 241,024 31.7% 33.5%
Central/S. Europe 194,484 230,547 275,670 18.5% 19.6%
North America 143,682 190,894 289,459 32.9% 51.6%
Other 160,626 208,946 296,041 30.1% 41.7%
Total 781,016 969,181 1,261,938 24.1% 30.2%
VISITORS THROUGH SEYÐISFJÖRÐUR SEAPORT 2013 2014 2015 13/14 14/15
Nordic countries 4,650 5,340 4,806 14.8% -10.0%
Germany 7,133 7,705 8,489 8.0% 10.2%
Central/S.Europe* 3,307 3,314 3,431 0.2% 3.5%
Other 1,547 1,756 1,814 13.5% 3.3%
Other 16,637 18,115 18,540 8.9% 2.3%
*Netherlands, Belgium, Austria, Switzerland, France, Spain and Italy.
Sources:
-The Icelandic Tourist Board counts visitors when they leave through
Keflavík Airport according to nationality and publishes the figures every
month on its website.
-Austfar estimates visitor numbers with Norræna based on sales figures.
-Isavia and Air Iceland estimate visitor numbers through other airports
based on passenger and sales figures.

7
INTERNATIONAL VISITORS BY MONTHS
Over the past three years, the increase in the number of tourists has
been proportionately greater in winter than in spring, summer and
fall. Records were broken in all months of 2014 and 2015 in
comparison with the same months in preceding years. The year-on-
year increase exceeded 30% for seven months of 2015, with the
highest point – 49% – in October 2015.
DEPARTURES FROM KEFLAVÍK AIRPORT BY MARKET
Travellers from individual market areas were widely distributed in
2015. Thus, travellers from Central and South Europe were
prominent during the summer months, while travellers from the
Nordic countries, North America and from countries categorised as
“elsewhere” were distributed evenly over the year. Travellers from
the UK were the exception, as around half of these visitors came
during the winter months.
Source: Icelandic Tourist Board.
63 70
84
72 91
137
181 18
9
123
99
82
71
J F M A M J J A S O N D
2013 2014 2015
DEPARTURES FROM KEFLAVÍK AIRPORT BY MONTH ('000)
40
31 35
29
24
23
17
16 21
26
31
29
35
34
27
21
36
24
25
23
39
49
34
32
J F M A M J J A S O N D
2013-14 2014-15
INCREASE OF VISITORS 2013-2015 (%)
0
10.000
20.000
30.000
40.000
50.000
60.000
70.000
80.000
J F M A M J J A S O N D
Nordic nations UK Central-/S-EuropeN-America Other
TRAVELLERS THROUGH KEFLAVÍK AIRPORT BY MARKET REGION - 2015

8
INTERNATIONAL VISITORS BY SEASON
VISITORS 2013–2015
Approximately 40% of travellers in 2015 came during the three
summer months (June–August), which was a decrease in ratio from
2013 (44.2%) and 2014 (42.2%). Approximately 30% came in the
spring or autumn (April–May/Sept.–Oct.) and a similar ratio during
winter (Jan.–Mar. and Nov.–Dec.).
2013 2014 2015
Number % Number % Number %
Spring 99,413 12.7 125,938 13.0 162,631 12.9 Summer 345,212 44.2 408,640 42.2 507,423 40.2 Autumn 126,115 16.1 154,805 16.0 222,326 17.6 Winter 210,276 26.9 279,798 28.9 369,558 29.3
Total 781,016 100 969,181 100 1,261,938 100
VISITORS BY MARKET 2015
In 2015, 59% of Central and Southern European visitors came during
the summer, as did 44% of North American visitors, 36% of Nordic
visitors, 18% of UK visitors and 42% of those categorised as from
“elsewhere”. Some 40% of Nordic visitors came in the spring or
autumn, as did 28% of UK visitors and 32% of North American
visitors. Approximately half of UK visitors came in winter, as did
nearly one-fourth of Nordic visitors, nearly one-fourth of North
American visitors and approximately one-fourth categorised as
coming from “elsewhere”.
Spring Summer Autumn Winter Total
No. % No. % No. % No. % No.
Nordic c. 30,911 19.4 58,183 36.4 33,270 20.8 37,380 23.4 159,744
UK 29,647 12.3 42,203 17.5 36,878 15.3 132,296 54.9 241,024
C/S-Eur. 29,109 10.6 153,928 55.8 43,659 15.8 48,974 17.8 275,670
N-America 38,039 13.1 127,604 44.1 54,423 18.8 69,393 24.0 289,459
Other 34,925 11.8 125,505 42.4 54,096 18.3 81,515 27.5 296,041
Total 162,631 12.9 507,423 40.2 222,326 17.6 369,558 29.3 1,261,938
Source: Icelandic Tourist Board.
210,
276
279,
798 36
9,55
8
225,
528
280,
743 38
4,95
7
345,
212
408,
640 50
7,42
3
2013 2014 2015
Winter
Spring/autumn
Summer
VISITORS BY SEASON
82 89 126
69 92
128 49 73
154
132 67
42
37 64
58
Winter Spring/autumn Summer
Nordic nations
UK
Cent./S-Europe
N-America
Other
VISITORS BY MARKET 2015 ('000)
9
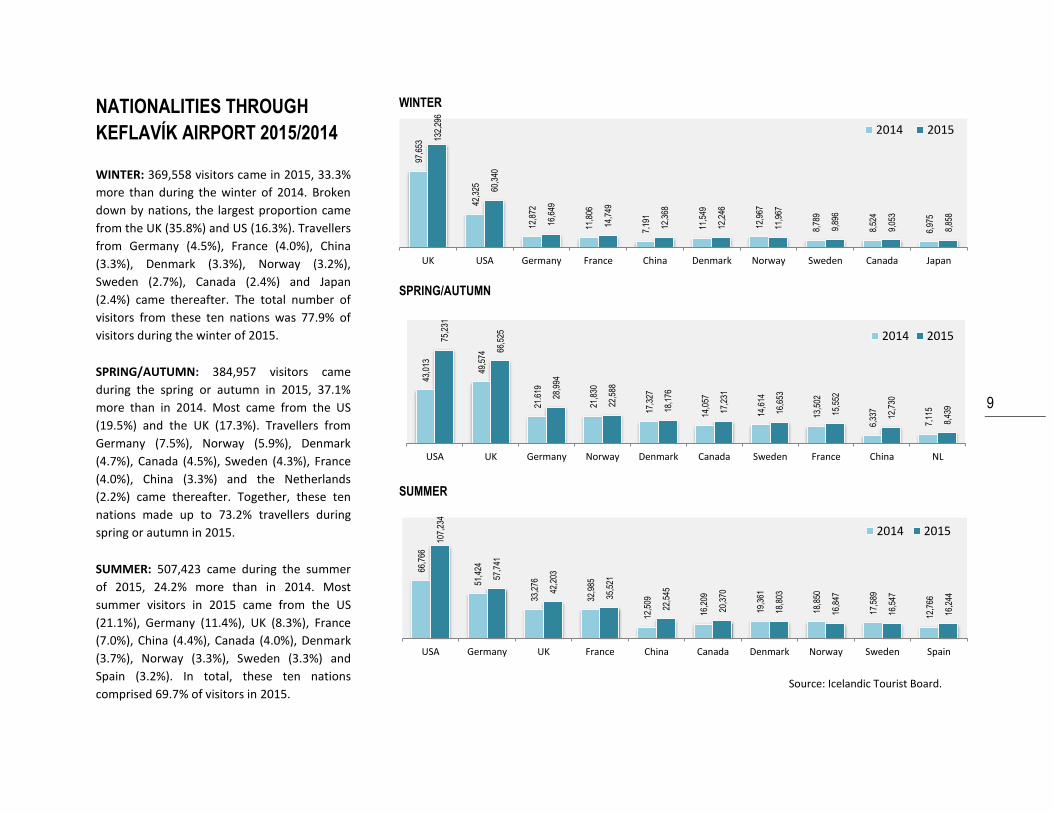
NATIONALITIES THROUGH
KEFLAVÍK AIRPORT 2015/2014
WINTER: 369,558 visitors came in 2015, 33.3%
more than during the winter of 2014. Broken
down by nations, the largest proportion came
from the UK (35.8%) and US (16.3%). Travellers
from Germany (4.5%), France (4.0%), China
(3.3%), Denmark (3.3%), Norway (3.2%),
Sweden (2.7%), Canada (2.4%) and Japan
(2.4%) came thereafter. The total number of
visitors from these ten nations was 77.9% of
visitors during the winter of 2015.
SPRING/AUTUMN: 384,957 visitors came
during the spring or autumn in 2015, 37.1%
more than in 2014. Most came from the US
(19.5%) and the UK (17.3%). Travellers from
Germany (7.5%), Norway (5.9%), Denmark
(4.7%), Canada (4.5%), Sweden (4.3%), France
(4.0%), China (3.3%) and the Netherlands
(2.2%) came thereafter. Together, these ten
nations made up to 73.2% travellers during
spring or autumn in 2015.
SUMMER: 507,423 came during the summer
of 2015, 24.2% more than in 2014. Most
summer visitors in 2015 came from the US
(21.1%), Germany (11.4%), UK (8.3%), France
(7.0%), China (4.4%), Canada (4.0%), Denmark
(3.7%), Norway (3.3%), Sweden (3.3%) and
Spain (3.2%). In total, these ten nations
comprised 69.7% of visitors in 2015.
WINTER
SPRING/AUTUMN
SUMMER
Source: Icelandic Tourist Board.
97,6
53
42,3
25
12,8
72
11,8
06
7,19
1
11,5
49
12,9
67
8,78
9
8,52
4
6,97
5
132,
296
60,3
40
16,6
49
14,7
49
12,3
68
12,2
46
11,9
67
9,89
6
9,05
3
8,85
8
UK USA Germany France China Denmark Norway Sweden Canada Japan
2014 2015
43,0
13
49,5
74
21.6
19
21,8
30
17,3
27
14,0
57
14,6
14
13,5
02
6,33
7
7,11
5
75,2
31
66,5
25
28,9
94
22,5
88
18,1
76
17,2
31
16,6
53
15,5
52
12,7
30
8,43
9
USA UK Germany Norway Denmark Canada Sweden France China NL
2014 2015
66,7
66
51,4
24
33,2
76
32,9
85
12,5
09
16,2
09
19,3
61
18,8
50
17,5
89
12,7
66
107,
234
57,7
41
42,2
03
35,5
21
22,5
45
20,3
70
18,8
03
16,8
47
16,5
47
16,2
44
USA Germany UK France China Canada Denmark Norway Sweden Spain
2014 2015

10
MARKETING AREAS THROUGH
KEFLAVIK AIRPORT 2010–2015
WINTER: The number of travellers in winter in
2015 was triple that of those measured in
2010. The average annual increase has been
28.9% since 2010. Visitors from the UK have
increased the most, or approximately 41% on
average, and became around a third of all
travellers in winter in 2015.
SPRING/AUTUMN: The number of tourists has
increased from approximately 147,000 during
spring and autumn to approximately 466,000
in the period between 2010 and 2015, or by
around 319,000 travellers. The increase has
been around 26.0% per year. The Nordic
countries were the largest market area to
begin with, but other market areas have since
grown at their expense.
SUMMER: Travellers in summer have more
than doubled since 2010, from 227,000 in 2010
to approximately 507,000 in 2015. The average
annual increase has been 17.5%. The largest
market share in summer is travellers from Mid-
and Southern Europe, but their share has
decreased from 2010, measuring at 30.3% in
2015.
Source: Icelandic Tourist Board.
WINTER
SPRING/AUTUMN
SUMMER
0
20.000
40.000
60.000
80.000
100.000
120.000
140.000
2010 2011 2012 2013 2014 2015
0
20.000
40.000
60.000
80.000
100.000
120.000
2010 2011 2012 2013 2014 2015
0
20.000
40.000
60.000
80.000
100.000
120.000
140.000
160.000
2010 2011 2012 2013 2014 2015
Nordic nations UK Central/S-Europe N-America Other
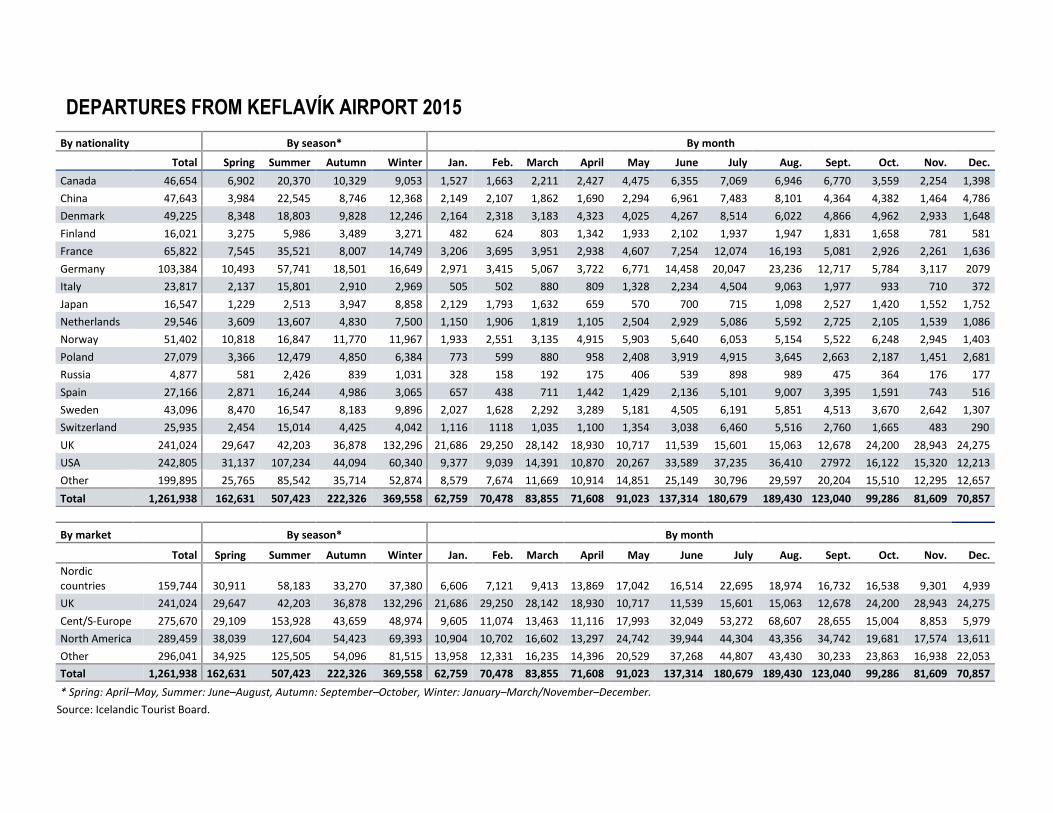
DEPARTURES FROM KEFLAVÍK AIRPORT 2015
By nationality By season* By month
Total Spring Summer Autumn Winter Jan. Feb. March April May June July Aug. Sept. Oct. Nov. Dec.
Canada 46,654 6,902 20,370 10,329 9,053 1,527 1,663 2,211 2,427 4,475 6,355 7,069 6,946 6,770 3,559 2,254 1,398
China 47,643 3,984 22,545 8,746 12,368 2,149 2,107 1,862 1,690 2,294 6,961 7,483 8,101 4,364 4,382 1,464 4,786
Denmark 49,225 8,348 18,803 9,828 12,246 2,164 2,318 3,183 4,323 4,025 4,267 8,514 6,022 4,866 4,962 2,933 1,648
Finland 16,021 3,275 5,986 3,489 3,271 482 624 803 1,342 1,933 2,102 1,937 1,947 1,831 1,658 781 581
France 65,822 7,545 35,521 8,007 14,749 3,206 3,695 3,951 2,938 4,607 7,254 12,074 16,193 5,081 2,926 2,261 1,636
Germany 103,384 10,493 57,741 18,501 16,649 2,971 3,415 5,067 3,722 6,771 14,458 20,047 23,236 12,717 5,784 3,117 2079
Italy 23,817 2,137 15,801 2,910 2,969 505 502 880 809 1,328 2,234 4,504 9,063 1,977 933 710 372
Japan 16,547 1,229 2,513 3,947 8,858 2,129 1,793 1,632 659 570 700 715 1,098 2,527 1,420 1,552 1,752
Netherlands 29,546 3,609 13,607 4,830 7,500 1,150 1,906 1,819 1,105 2,504 2,929 5,086 5,592 2,725 2,105 1,539 1,086
Norway 51,402 10,818 16,847 11,770 11,967 1,933 2,551 3,135 4,915 5,903 5,640 6,053 5,154 5,522 6,248 2,945 1,403
Poland 27,079 3,366 12,479 4,850 6,384 773 599 880 958 2,408 3,919 4,915 3,645 2,663 2,187 1,451 2,681
Russia 4,877 581 2,426 839 1,031 328 158 192 175 406 539 898 989 475 364 176 177
Spain 27,166 2,871 16,244 4,986 3,065 657 438 711 1,442 1,429 2,136 5,101 9,007 3,395 1,591 743 516
Sweden 43,096 8,470 16,547 8,183 9,896 2,027 1,628 2,292 3,289 5,181 4,505 6,191 5,851 4,513 3,670 2,642 1,307
Switzerland 25,935 2,454 15,014 4,425 4,042 1,116 1118 1,035 1,100 1,354 3,038 6,460 5,516 2,760 1,665 483 290
UK 241,024 29,647 42,203 36,878 132,296 21,686 29,250 28,142 18,930 10,717 11,539 15,601 15,063 12,678 24,200 28,943 24,275
USA 242,805 31,137 107,234 44,094 60,340 9,377 9,039 14,391 10,870 20,267 33,589 37,235 36,410 27972 16,122 15,320 12,213
Other 199,895 25,765 85,542 35,714 52,874 8,579 7,674 11,669 10,914 14,851 25,149 30,796 29,597 20,204 15,510 12,295 12,657
Total 1,261,938 162,631 507,423 222,326 369,558 62,759 70,478 83,855 71,608 91,023 137,314 180,679 189,430 123,040 99,286 81,609 70,857
By market By season* By month
Total Spring Summer Autumn Winter Jan. Feb. March April May June July Aug. Sept. Oct. Nov. Dec.
Nordic countries 159,744 30,911 58,183 33,270 37,380 6,606 7,121 9,413 13,869 17,042 16,514 22,695 18,974 16,732 16,538 9,301 4,939
UK 241,024 29,647 42,203 36,878 132,296 21,686 29,250 28,142 18,930 10,717 11,539 15,601 15,063 12,678 24,200 28,943 24,275
Cent/S-Europe 275,670 29,109 153,928 43,659 48,974 9,605 11,074 13,463 11,116 17,993 32,049 53,272 68,607 28,655 15,004 8,853 5,979
North America 289,459 38,039 127,604 54,423 69,393 10,904 10,702 16,602 13,297 24,742 39,944 44,304 43,356 34,742 19,681 17,574 13,611
Other 296,041 34,925 125,505 54,096 81,515 13,958 12,331 16,235 14,396 20,529 37,268 44,807 43,430 30,233 23,863 16,938 22,053
Total 1,261,938 162,631 507,423 222,326 369,558 62,759 70,478 83,855 71,608 91,023 137,314 180,679 189,430 123,040 99,286 81,609 70,857
* Spring: April–May, Summer: June–August, Autumn: September–October, Winter: January–March/November–December.
Source: Icelandic Tourist Board.

12
OVERNIGHT STAYS – ALL
TYPES OF ACCOMMODATION
The total number of overnight stays in
Iceland was around 6.5m in 2015. The
overnight stays of foreign visitors were
around 5.6m in 2015 and have increased
by 21.3% annually since 2010. Overnight
stays of Icelanders were 930,000 in 2015
and have increased by 2.4% since 2010.
OVERNIGHT STAYS BY SEASONS
Around 52% of the total overnight stays in
2015 were during summer, 25.9% during
spring and autumn and 22.4% during
winter.
There were nearly 3.1 million guest nights
spent in the the Capital Region and
Reykjanes area in 2015, or 48.2% of the
total number of guest nights. Of these,
30.4% were during spring and autumn,
34.5% during summer and 35.1% during
winter. Around half (51.8%) of guest
nights, or around 3.4 million, were spent in
other parts of Iceland, whereof 67.7%
were spent during summer, 21.6% during
spring and autumn and 10.7% during
winter.
Source: Statistics Iceland.
2,144 2,444
2,898
3,522
4,405
5,606
2010 2011 2012 2013 2014 2015
Icelanders
Foreigners
OVERNIGHT STAYS IN ALL TYPES OF ACCOMMODATION 2010-2015 ('000)
3,104 3,378
929 1,085 2,175 2,293
1,281 1,691
774 957
507 734
1,104
1,467
853 1,105 251
362
2014 2015 2014 2015 2014 2015
Total guest nights Capital Region/Reykjanes Countryside
Winter
Spring/Autumn
Summer
OVERNIGHT STAYS 2015/2014 ('000)

13
GUEST NIGHTS BY REGION
WINTER: Some 1.5 million guest nights were spent in the winter of 2015, i.e. 32.9% more than in 2014. Some 75% of guest nights (i.e. 1.1 million) were spent in the Capital Region and Reykjanes peninsula, 91.5% of which were spent by foreigners. Outside of the Capital Region and Reykjanes peninsula, most guest nights were spent in South Iceland (13.3% of the total) and North Iceland (5.2% of the total).
SUMMER: Some 3.4 million guest nights were spent in the summer of 2015, i.e. 8.8% more than in the same period in 2014. Around 32% of total guest nights were in the Capital Region and Reykjanes, 21.7% in South Iceland, 19.5% in North Iceland, 14.0 in West Iceland and the West Fjords. Foreigners accounted for 84.4% of total guest nights in Iceland in the summer of 2015. 64.8% of guest nights spent by foreigners were in rural Iceland.
SPRING/AUTUMN: Just less than 1.7 million guest nights were spent in the spring and autumn of 2015, i.e. 32.0% more than in the same period in 2014. Around 57% of total guest nights were in the Capital Region and Reykjanes peninsula, 17.3% in South Iceland, 11.2% in North Iceland, 8% in West Iceland and the Westfjords and 6.9% in East Iceland. Foreigners accounted for 87.2% of guest nights in the spring and autumn of 2015. Around 59% of guest nights spent by foreigners were in the Capital Region and Reykjanes peninsula.
Source: Statistics Iceland.
WINTER (´000)
SUMMER (´000)
SPRING/AUTUMN (´000)
110 94
743 1,011
89 156
2014 2015 2014 2015 2014 2015 2014 2015 2014 2015
CapitalRegion./Reykjanes
West/Westfjords North East South
Foreigners
Icelanders
97 83 108 119 212 136 100 60 153 131
832 1,002
286 353
485 524
314 370
518 602
2014 2015 2014 2015 2014 2015 2014 2015 2014 2015
CapitalRegion./Reykjanes
West/Westfjords North East South
Foreigners
Icelanders
107 83
667 874
66 110 103 150 62 102
153 239
2014 2015 2014 2015 2014 2015 2014 2015 2014 2015
CapitalRegion./Reykjanes
West/Westfjords North East South
Foreigners
Icelanders
14
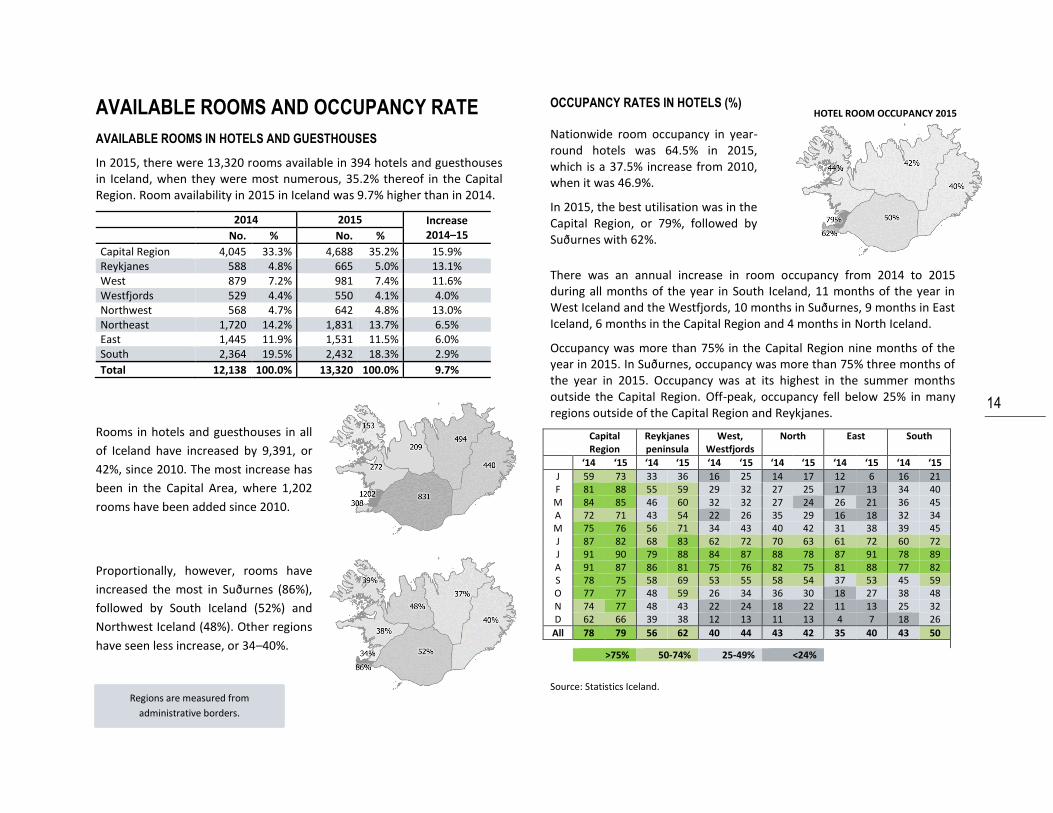
HOTEL ROOM OCCUPANCY 2015
AVAILABLE ROOMS AND OCCUPANCY RATE
AVAILABLE ROOMS IN HOTELS AND GUESTHOUSES
In 2015, there were 13,320 rooms available in 394 hotels and guesthouses in Iceland, when they were most numerous, 35.2% thereof in the Capital Region. Room availability in 2015 in Iceland was 9.7% higher than in 2014.
2014 2015 Increase 2014–15 No. % No. %
Capital Region 4,045 33.3% 4,688 35.2% 15.9% Reykjanes 588 4.8% 665 5.0% 13.1% West 879 7.2% 981 7.4% 11.6% Westfjords 529 4.4% 550 4.1% 4.0% Northwest 568 4.7% 642 4.8% 13.0% Northeast 1,720 14.2% 1,831 13.7% 6.5% East 1,445 11.9% 1,531 11.5% 6.0% South 2,364 19.5% 2,432 18.3% 2.9%
Total 12,138 100.0% 13,320 100.0% 9.7%
Rooms in hotels and guesthouses in all
of Iceland have increased by 9,391, or
42%, since 2010. The most increase has
been in the Capital Area, where 1,202
rooms have been added since 2010.
Proportionally, however, rooms have
increased the most in Suðurnes (86%),
followed by South Iceland (52%) and
Northwest Iceland (48%). Other regions
have seen less increase, or 34–40%.
OCCUPANCY RATES IN HOTELS (%)
Nationwide room occupancy in year-round hotels was 64.5% in 2015, which is a 37.5% increase from 2010, when it was 46.9%.
In 2015, the best utilisation was in the Capital Region, or 79%, followed by Suðurnes with 62%.
There was an annual increase in room occupancy from 2014 to 2015 during all months of the year in South Iceland, 11 months of the year in West Iceland and the Westfjords, 10 months in Suðurnes, 9 months in East Iceland, 6 months in the Capital Region and 4 months in North Iceland.
Occupancy was more than 75% in the Capital Region nine months of the year in 2015. In Suðurnes, occupancy was more than 75% three months of the year in 2015. Occupancy was at its highest in the summer months outside the Capital Region. Off-peak, occupancy fell below 25% in many regions outside of the Capital Region and Reykjanes.
Capital Region
Reykjanes peninsula
West, Westfjords
North East South
‘14 ‘15 ‘14 ‘15 ‘14 ‘15 ‘14 ‘15 ‘14 ‘15 ‘14 ‘15
J 59 73 33 36 16 25 14 17 12 6 16 21 F 81 88 55 59 29 32 27 25 17 13 34 40 M 84 85 46 60 32 32 27 24 26 21 36 45 A 72 71 43 54 22 26 35 29 16 18 32 34 M 75 76 56 71 34 43 40 42 31 38 39 45 J 87 82 68 83 62 72 70 63 61 72 60 72 J 91 90 79 88 84 87 88 78 87 91 78 89 A 91 87 86 81 75 76 82 75 81 88 77 82 S 78 75 58 69 53 55 58 54 37 53 45 59 O 77 77 48 59 26 34 36 30 18 27 38 48 N 74 77 48 43 22 24 18 22 11 13 25 32 D 62 66 39 38 12 13 11 13 4 7 18 26
All 78 79 56 62 40 44 43 42 35 40 43 50
>75% 50-74% 25-49% <24%
Source: Statistics Iceland. Regions are measured from
administrative borders.

15
GUEST NIGHTS BY TYPE OF ACCOMODATION
GUEST NIGHTS IN HOTELS AND GUESTHOUSES
In 2015, the total number of guest nights in hotels and guesthouses was
approximately 4.1 million, i.e. 25% more than in 2014. Guest nights spent
by foreigners were 87.9% of the 2015 total and accounted for all the
increase in guest nights between years.
2014 2015 Increase/decrease 2014–15 Number % Number %
Foreigners 2,787,254 84.8% 3,613,046 87.9% 29.6%
Icelanders 499,907 15.2% 495,844 12.1% -0.8%
Total 3,287,161 100% 4,108,890 100% 25.0%
Guest nights in hotels and guest houses increased every month in 2015 as compared to the previous year. The proportional distribution of guest nights across the seasons in 2015 was as follows: 43.6% in summer, 29.3% in spring and autumn and 27.2% in winter. Seasonal fluctuations applied to a lesser extent to Icelanders.
Twenty nationalities accounted for 94.7% of guest nights in hotels and guesthouses in 2015. The British, Americans, Germans and Icelanders were by far the most numerous. Icelanders spent fewer nights in hotels and guesthouses in 2015 than in 2014.
OTHER ACCOMMODATION (‘000) Guest nights in accommodation other than hotels and guest houses were 2.4 million in 2015, an increase of 10.2% on 2014. Most were in campsites (35.4%), apartments (20.7%) and hostels (19.7%). Foreigner guest nights accounted for 82.1% of the total number of guest nights in other accommodation. This is 23.2% greater than in 2014, with the biggest growth appearing in foreigner guest nights in private home accommodation and apartments.
Foreigners Icelanders Total
2014 2015 2014 2015 2014 2015
Camping sites 531 578 415 281 946 859 Apartments 362 482 49 20 411 502 Youth hostels 339 440 37 38 376 478 Holiday centres 170 223 38 42 208 265 Private home acc. 149 206 26 27 175 233 Lodges / sleeping bag 66 63 20 27 86 90
Total 1.617 1.993 585 435 2.202 2.427
Source: Statistics Iceland.
23
24
30
31
40
38
39
37
48
46
51
54
62
59
61
60
46
46
41
40
33
32
26
27 10
9 153
151 19
8
178 22
3
146
177
193 27
1 353 44
9 502 59
7
470 56
7
232 33
3
177 25
5
149 20
8
127 18
3
14 15 14 15 14 15 14 15 14 15 14 15 14 15 14 15 14 15 14 15 14 15 14 15
J F M A M J J A S O N D
Foreigners
Icelanders
OVERNIGHT STAYS IN HOTELS AND GUESTHOUSES
771
714
559
496
201
135
117
110
108
107
96
94
91
77
66
39
30
27
27
26
UK
USA
Ger
man
y
Icel
and
Fran
ce
Swed
en
Den
mar
k
No
rway N
L
Ch
ina
CH
Spai
n
Can
ada
Ital
y
Jap
an
Fin
lan
d
Bel
giu
m
Au
stra
lia
Isra
el
Au
stri
a
2014 2015
GUEST NIGHTS (‘000) BY NATIONALITY

16
Visitors from China '10 '11 '12 '13 '14 '15
Guest nights ('000) 9 14 24 46 69 152
Increase (%) 100 145 250 487 725 1612
Visitors KEF ('000) 5 9 14 18 26 48
Increase (%) 100 169 270 339 501 917
0%30%60%90%
120%150%
'10-'11 '11-'12 '12-'13 '13-'14 '14-'15
Guest nights Visitors
NUMBER AND
DEVELOPMENT OF GUEST
NIGHTS AND TRAVELLERS
Here is an overview of the number of guest nights with reference to the number of visitors through Keflavík airport (KEF) in 2010 to 2015. 2010 is the base year, and numbers on guest nights and travellers from year to year are proportional indices. This way, it can be determined whether the number of guest nights have been consistent with the increased number of travellers. The figures show the development since 2010, and the charts below illustrate the changes between
years.
Visitors Total '10 '11 '12 '13 '14 '15
Guest nights ('000) 2.144 2.444 2.898 3.522 4.405 5.606
Increase (%) 100 114 135 164 205 261
Visitors KEF ('000) 459 541 647 781 969 1.262
Increase (%) 100 118 141 170 211 275
Visitors from Scandinavia '10 '11 '12 '13 '14 '15
Guest nights ('000) 348 379 426 467 551 586
Increase (%) 100 109 122 134 158 168
Visitors KEF ('000) 113 127 142 145 158 160
Increase (%) 100 113 126 129 140 142
Visitors from Central and Southern Europe '10 '11 '12 '13 '14 '15
Guest nights ('000) 931 1.010 1.161 1.466 1.662 2.011
Increase (%) 100 108 125 157 179 216
Visitors KEF ('000) 132 149 170 194 231 276
Increase (%) 100 113 129 147 175 209
Visitors from the UK '10 '11 '12 '13 '14 '15
Guest nights ('000) 261 297 395 572 829 1.107
Increase (%) 100 114 151 219 317 424
Visitors KEF ('000) 60 68 95 137 181 241
Increase (%) 100 112 157 227 299 400
Visitors from North America '10 '11 '12 '13 '14 '15
Guest nights ('000) 201 324 409 566 839 1.170
Increase (%) 100 161 203 282 417 582
Visitors KEF ('000) 65 95 114 144 191 289
Increase (%) 100 148 176 222 295 448
Other Visitors '10 '11 '12 '13 '14 '15
Guest nights ('000) 403 434 507 451 524 732 Increase/decrease (%) 100 108 126 112 130 182
Visitors KEF ('000) 89 102 126 161 208 296
Increase (%) 100 115 142 181 234 333
0%
10%
20%
30%
40%
'10-'11 '11-'12 '12-'13 '13-'14 '14-'15
Guest nights Visitors
0%
10%
20%
30%
40%
'10-'11 '11-'12 '12-'13 '13-'14 '14-'15
Guest nights Visitors
0%
10%
20%
30%
40%
'10-'11 '11-'12 '12-'13 '13-'14 '14-'15
Guest nights Visitors
0%
20%
40%
60%
80%
'10-'11 '11-'12 '12-'13 '13-'14 '14-'15
Guest nights Visitors
0%
20%
40%
60%
80%
'10-'11 '11-'12 '12-'13 '13-'14 '14-'15
Guest nights Visitors
-20%
0%
20%
40%
60%
'10-'11 '11-'12 '12-'13 '13-'14 '14-'15
Guest nights Visitors

17
NUMBER OF VISITORS AT TOURIST LOCATIONS
Here are the results from the counting of visitors to six popular destinations in South and West Iceland, part of research on the tolerance limits of these locations. This project is a collaboration between the Icelandic Tourist Board and the University of Iceland. The results are based on vehicle traffic on the access routes to the destination, using vehicle counters, and measurements of average passenger numbers in private vehicles and buses. The measurement period was one year, February 2015 to February 2016.
NUMBER OF VISITORS BY PERIOD (‘000) Hakið
Þingvellir Jökulsárlón Sólheima
jökull Glacier
Hraun-fossar
Seltún Krýsuvík
Djúpa-lóns-
sandur
Late winter 65 36 23 7 11 4
End of winter 75 48 24 14 20 10
Spring 87 77 23 31 27 21
High season 116 103 31 47 35 28
Autumn 103 88 34 31 25 19
Early winter 84 49 27 15 14 7
High winter 144 39 47 13 13 5
Total 674 439 210 157 144 94
Late winter: weeks 8–15, End of winter: weeks 16–22, Spring: weeks 23–27, High season:
week 28-32, Autumn: weeks 33–37, Early winter: week 38-43, High winter: weeks 44 –07
NUMBER OF VISITORS BY PERIODS AND MONTHS
Here is the number of guests in the high season from early July to mid-August and in high winter, from November to February.
NUMBER OF VISITORS BY MONTH
As can be seen, most visit Hakið (Þingvellir) and Jökulsárlón all months of the year.
116 103
31 35 47
28
144
39 47
13 13 5
Hakið(Þingvellir)
Jökulsárlón Sólheimajökull Seltún Hraunfossar Djúpalóns-sandur
High season (5 weeks) High winter (16 weeks)
NUMBER OF GUESTS DURING HIGH SEASON AND HIGH WINTER ('000)
0
20
40
60
80
100
120
J F M A M J J A S O N D
Tho
usan
d
Djúpalónssandur Hakið Hraunfossar
Jökulsárlón Seltún Sólheimajökull
Source: Icelandic Tourist Board and University
of Iceland.

18
TRAVELS OF ICELANDERS 2015/2014
The Icelandic Tourist Board has for many years conducted surveys among Icelanders on their domestic and international travels. A survey from January 2016 was based on a 1400-person sample selected randomly from MMR's 18,000-person opinion group, which was randomly selected from the National Register. The response proportion was 66.0%. The results were processed according to several demographic categories: gender, age, residence, education, employment, income and length of stay.
GENDER 2014 2015
Female 47% 49% Male 53% 51% AGE 18–39 years 47% 44% 40–59 years 40% 36% 60–80 years 13% 19% RESIDENCY Capital Region 62% 64% Communities near the Capital Region 14% 12% Rest of Iceland 24% 24% HOUSEHOLD INCOME (ISK) Less than 249,000 14% 12% 250,000-399,000 17% 15% 400,000-599,000 21% 21% 600,000-799,000 17% 17% 800,000 and more 31% 35% JOB Managers and experts 28% 29% Technicians and office workers 13% 14% Waiters and shop assistants 12% 15% Tradesmen & industrial specialists 8% 9% Machinists/workers/seamen/farmers 9% 8% Students 15% 11% Not employed outside the home 15% 14%
TRIPS UNDERTAKEN IN ICELAND OR OVERSEAS 2015
Approximately 85% of respondents travelled domestically in 2015,
slightly fewer than in 2014. 71% travelled abroad in 2015, an
increase from the 67.5% in 2014.
NUMBER OF TRIPS
Those taking a foreign holiday in 2015 went on average 2.2 times,
which is less than the year before. Those taking day-trips in 2015
went on average 7.2 times, slightly less in 2014. Those taking
domestic trips away from home with at least one overnight stay
took, on average, 6 such trips, fewer than in 2014.
26.6%
23.4%
7.0%
9.0%
60.5%
61.7%
5.9%
5.9%
2014
2015
Only within Iceland Only overseas Both within Iceland and overseas Did not travel
TRAVELS IN ICELAND OR ABROAD
2.4
8.1
6.6
2.2
7.2
6.0
Overseas trips Domestic day trips Domestic trips
NUMBER OF TRIPS TAKEN
2014
2015

19
- OVERSEAS TRIPS
NUMBER OF TRIPS AND LENGTH OF STAY
Some 71% took a foreign holiday in 2015, on average 2.2 times.
Most, or 42.5%, went on one trip, 32% took two trips and 25.5%
took three or more trips.
The average length of stay for overseas trips was 17.5 nights ¹ in
2015, i.e. the same as in 2014. A fifth of travellers stayed less than a
week, around a quarter 1–2 weeks, a quarter 2–3 weeks and just
more than a quarter more than three weeks.
¹Those staying longer than 100 nights were not included in the data.
WHAT KIND OF TRIP AND WHERE?
The majority went on a city or town break overseas, a visit to friends
or relatives, sun-seeking holidays and a work-related trip in 2015.
Travels of Icelanders in 2015 were largely limited to Spain, Portugal,
the UK, Scandinavia, North America, Germany, Benelux countries,
Italy and France.
42.5%
31.9%
12.3% 6.1% 7.1%
1 trip 2 trips 3 trips 4 trips > 5 trips
HOW MANY OVERSEAS TRIPS WERE TAKEN ?
2014
2015
27.8%
25.0%
7.1%
19.0%
14.5%
6.7%
>3 weeks
2-3 weeks
11-13 nights
7-10 nights
4-6 nights
1-3 nights
2015
2014
HOW MANY NIGHTS WERE SPENT OVERSEAS?
13,4%
1.8%
4.1%
4.3%
4.9%
6.8%
24.3%
33.6%
36.0%
43.0%
Other
Skiing trip
Golf trip
Educational trip
Various speciality trip
Sports trip
Work-related
Sun-seeking holiday
Visit friends or relatives
City break
WHAT KIND OF OVERSEAS TRIP WAS TAKEN?
2015
2014
6.6%
7.4%
8.2%
12.0%
13.9%
18.6%
22.3%
23.1%
26.9%
33.8%
France
Italy
Benelux
Norway
Sweden
Germany
N-America
Denmark
UK/Ireland
Spain/Portugal
WHICH COUNTRIES WERE VISITED?
2015
2014

20
- DOMESTIC DAY TRIPS¹
Some 72% took a day-trip in 2015, on average 7.2 times. Close to a
third went on 1–2 trips, just less than a third on 3–5 trips, and two
out of every five on six trips or more.
Most day-trips were to South Iceland, followed by West Iceland,
Reykjanes, Greater Reykjavík and North Iceland.
WHERE WERE DAY-TRIPS TAKEN IN 2015?
Took a daytrip Average no. of trips
South 58.5% 4.7 West 33.5% 3.5 Reykjanes 30.2% 4.9 Capital Region 26.2% 8.2 North 24.6% 4.6 East 7.5% 4.2 Highlands 5.4% 3.9 Westfjords 4.2% 4.0 ¹ Recreational trip lasting at least 5 hours and spent away from the home without
staying overnight.
LOCATIONS VISITED ON DAY-TRIPS IN 2015
Of the 56 locations asked about in various part of Iceland, the
following were most often visited.
*There were separate queries for Þingvellir and Geysir/Gullfoss for the first time in January
2016.
15.7% 16.0%
11.8%
19.3% 20.8%
16.3%
1 trip 2 trips 3 trips 4-5 trips 6-10 trips >10 trips
HOW MANY DAY-TRIPS WERE TAKEN?
2014 2015
6.7%
8.0%
8.1%
8.7%
9.2%
9.4%
9.4%
9.6%
9.9%
11.0%
11.1%
12.8%
13.4%
14.0%
15.6%
18.1%
19.0%
19.0%
19.6%
23.4%
24.3%
26.2%
30.2%
Stykkishólmur
Blue lagoon
Snæfellsnes National park
Westmann-Islands
Skagafjörður
Skógar
Húsavík
Mývatn
Siglufjörður
Sandgerði
Húsafell/Reykholt
Reykjanes lighthouse etc.
Krísuvík
Akureyri
Akranes
Grindavík
Hvalfjörður
Borgarnes
Eyrarbakki
Reykjanesbær
Gullfoss/Geysir
Capital Region
Þingvellir
WHICH AREAS/PLACES WERE VISITED ON DAY-TRIPS?
2015
2014

21
- DOMESTIC TRAVELS¹
LENGTH OF STAY IN ICELAND
Approximately 85% travelled domestically in 2015, on average six
times. Just over a third went on 1–2 trips, just more a third on 3–5
trips and just less than a third on six or more.
July was the most popular month for trips in 2015, closely followed
by August and June. Fewer travelled at other times.
¹ Travel away from home and staying away for one or more nights.
OVERNIGHT STAYS BY REGION
The average duration in 2015 was 14.7 nights, one night less than in 2014.
Approximately 30% was less than a week, 28% 1–2 weeks, 23% 2–3 weeks
and 19.5% more than 3 weeks. The findings on length of stay by region
show that around half of guest nights were spent in South Iceland and
North Iceland in 2015, similar to 2014.
ACCOMMODATION OPTIONS USED DURING TRAVEL
The majority stayed with friends or relatives, in a tent, trailer tent or motor
home and in summer cottages or privately owned apartments. Stays in
cottages or apartments owned by associations were also extensively used,
while hotels and guesthouses came thereafter. Other forms of
accommodation were less used.
15.8%
20.0%
16.1% 19.0%
16.9%
12.2%
1 trip 2 trips 3 trips 4-5 trips 6-10 trips >10 trips
HOW MANY TRIPS WERE TAKEN?
2014
2015
11.7% 15.5% 15.1%
21.4% 23.%7
49.8%
68.6%
58.2%
26.9% 19.1% 16.0% 16.9%
J F M A M J J A S O N D
IN WHICH MONTH WAS THE TRIP TAKEN?¹
2014 2015
Capital area 9%
West 18%
Westfjords 9%
North 24%
East 10%
South 27%
Reykjanes 1%
Highlands 2%
28.5%
34.4%
37.5%
40.9%
45.0%
Hotel/guesthouse
Association-owned holiday cottage
Privately owned summer cottage orapartment
Tent/trailer/motor home
Stayed with friends or relatives
WHAT ACCOMMODATION WAS USED WHEN TRAVELLING?
2015
2014

REGIONS AND PLACES
VISITED BY ICELANDERS
MOST VISITED DESTINATIONS
Of the 56 locations specifically mentioned
in the survey carried out by the Tourist
Board, the following were most visited in
2015:
1. Akureyri 41.3% 2. Capital Region 24.3% 3. Borgarnes 23.4% 4. Þingvellir 20.4% 5. Geysir/Gullfoss 19.5% 6. Skagafjörður 17.7% 7. Húsafell/Reykholt 16.4% 8. Egilsstaðir/Hallormsstaður 15.7% 9. Siglufjördur 13.9% 10. Snæfellsnes National Park 13.3% 11. Stykkishólmur 13.1%
2014 2015 2014 2015 Reykjanes peninsula 11.4% 11.1% East 27.6% 22.2% Reykjanesbær 8.9% 8.9% Egilsstaðir/Hallormsstaður 20.3% 15.7%
Grindavik 5.1% 5.4% Djúpivogur 9.0% 6.5%
Sandgerði 2.6% 3.9% Borgarfjördur eystri 5.4% 6.4%
Reykjanes lighthouse & surr. 2.3% 2.9% Eskifjörður 9.3% 6.3%
Krísuvík 1.9% 2.3% Seydisfjördur 8.9% 4.1%
Blue Lagoon 2.6% 2.0% Vopnafjördur 4.8% 3.3%
West 44.5% 45.7% Stöðvarfjörður 7.2% 3.3% Borgarnes 23.6% 23.4% South 59.0% 61.8%
Húsafell/Reykholt 12.2% 16.4% Þingvellir* 20.4%
Snæfellsnes National Park 9.5% 13.3% Geysir/Gullfoss* 19.5%
Stykkishólmur 13.1% 13.1% Kirkjubæjarklaustur 13.1% 12.2%
Hvalfjördur 12.7% 11.2% Vestmannaeyjar 14.2% 12.0%
Akranes 10.6% 9.5% Vík 13.4% 10.9%
Dalir 10.8% 9.4% Skógar 12.6% 10.6%
Westfjords 20.7% 19.6% Eyrarbakki 11.7% 9.7%
Ísafjördur 11.2% 11.4% Hornafjördur 11.7% 9.3%
Hólmavík/Strandir 9.0% 8.2% Jökulsárlón-Glacier Lagoon 10.9% 7.5%
Patreksfjörður 7.1% 6.5% Skaftafell National Park 8.0% 7.0%
Hrafnseyri 2.2% 3.3% Þórsmörk 5.5% 4.0%
Látrabjarg 3.1% 3.0% Highlands 11.4% 9.6%
Djúpavík 3.4% 2.1% Landmannalaugar 4.3% 3.9%
Hornstrandir 1.9% 2.0% Kjölur (incl. Hveravellir) 2.8% 2.7%
Flatey in Breidafjördur 1.7% 1.7% Sprengisandur 2.9% 2.4%
North 61.0% 52.3% Kárahnjúkar 1.9% 1.0%
Akureyri 49.6% 41.3% Herdubreidalindir/Askja 1.6% 0.7%
Skagafjörður 20.5% 17.7% Lakagígar 0.4% 0.5%
Siglufjördur 16.9% 13.9% Kverkfjöll 0.9% 0.1%
Mývatn 17.8% 11.5%
Húsavík 18.4% 10.4% *There were separate queries for Þingvellir and
Hvammstangi 7.7% 7.2% Geysir/Gullfoss for the first time in January 2016.
Ásbyrgi 8.8% 6.1%
Dettifoss 7.0% 5.9%
Þórshöfn 3.8% 3.2%
9.6%
11.1%
19.6%
22.2%
24.3%
45.7%
52.3%
61.8%
Highlands
Reykjanes
Westfjords
East
Capital Region
West
North
South
2015
2014

23
RECREATIONAL ACTIVITIES
The most popular recreational activities paid for on trips in 2015 were:
swimming and nature baths, museums and exhibitions, concerts and
theatre, fishing, boat trips and golf. Travellers partook of other recreational
options, such as wellness programmes, various sightseeing tours, whale
watching, horse riding tours and snowmobile trips, to a lesser extent.
QUALITY AWARENESS
More than a fifth of respondents to the 2016 questionnaire were of the
opinion that a recognised quality certification was a rather important or
very important factor when it came to choosing a tour operator.
TYPE OF TRIPS PLANNED FOR 2016
Approximately 90% said they have plans for travel in 2016. Of these,
58.5% say they intend to spend time in a summer cottage in Iceland,
51% plan to visit friends or family, 42% plan to take a city break
overseas, 32% plan to travel in Iceland with friends, 28.4% plan to
go on a sun-seeking holiday abroad, 27.7% plan to take a city or
town break in Iceland, 18.5% plan to go on a domestic outdoor
recreation trip of some sort and 24.2% plan to simply go where the
weather is good.
4.6%
5.6%
5.8%
8.2%
11.5%
17.2%
20.5%
37.8%
74.8%
Hiking/mountain trips
Wellness
Guided sight-seeing tours
Golf
Boat trip
Fishing
Theatre/concerts
Museums/exhibitions
Swiminning/nature baths
2015
2014
WHAT RECREATIONAL ACTIVITIES WERE PAID FOR WHEN
36.5% 35.4% 28.1% 2016(Jan)
Very/somewhat important Neither nor Very/somewhat important
HOW MUCH OR LITTLE EFFECT DOES A QUALITY OR ENVIRONMENTAL CERTIFICATION HAVE ON YOUR CHOICE OF A TRAVEL SERVICE COMPANY WHEN TRAVELLING DOMESTICALLY?
2.3%
16.5%
28.4%
41.8%
5.1%
6.5%
8.2%
12.4%
13.6%
18.5%
24.2%
27.7%
31.6%
50.9%
58.5%
Skiing trip
Business trip
Sun-seeking holiday
City break
Educational trip
Cultural/health/spa trip
Sports trip
Skiing trip
Work-related travel/conference
Outdoor recreation
Chasing good weather
City/town break
Travel with friends
Vist friends and relatives
Summer cottage trip
Trav
el o
vers
eas
Trav
el in
Icel
and
WHAT KIND OF TRIPS ARE PLANNED FOR 2016?
24
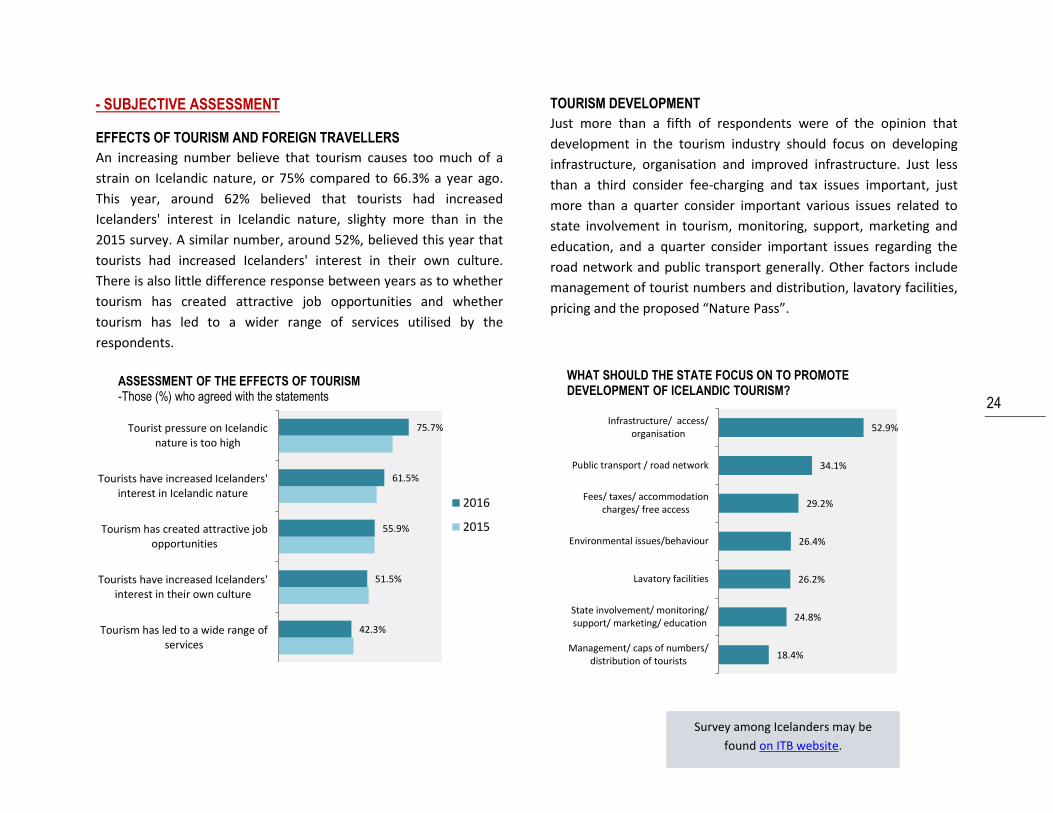
- SUBJECTIVE ASSESSMENT
EFFECTS OF TOURISM AND FOREIGN TRAVELLERS
An increasing number believe that tourism causes too much of a
strain on Icelandic nature, or 75% compared to 66.3% a year ago.
This year, around 62% believed that tourists had increased
Icelanders' interest in Icelandic nature, slighty more than in the
2015 survey. A similar number, around 52%, believed this year that
tourists had increased Icelanders' interest in their own culture.
There is also little difference response between years as to whether
tourism has created attractive job opportunities and whether
tourism has led to a wider range of services utilised by the
respondents.
TOURISM DEVELOPMENT
Just more than a fifth of respondents were of the opinion that
development in the tourism industry should focus on developing
infrastructure, organisation and improved infrastructure. Just less
than a third consider fee-charging and tax issues important, just
more than a quarter consider important various issues related to
state involvement in tourism, monitoring, support, marketing and
education, and a quarter consider important issues regarding the
road network and public transport generally. Other factors include
management of tourist numbers and distribution, lavatory facilities,
pricing and the proposed “Nature Pass”.
42.3%
51.5%
55.9%
61.5%
75.7%
Tourism has led to a wide range ofservices
Tourists have increased Icelanders'interest in their own culture
Tourism has created attractive jobopportunities
Tourists have increased Icelanders'interest in Icelandic nature
Tourist pressure on Icelandicnature is too high
2016
2015
ASSESSMENT OF THE EFFECTS OF TOURISM -Those (%) who agreed with the statements
18.4%
24.8%
26.2%
26.4%
29.2%
34.1%
52.9%
Management/ caps of numbers/distribution of tourists
State involvement/ monitoring/support/ marketing/ education
Lavatory facilities
Environmental issues/behaviour
Fees/ taxes/ accommodationcharges/ free access
Public transport / road network
Infrastructure/ access/organisation
WHAT SHOULD THE STATE FOCUS ON TO PROMOTE DEVELOPMENT OF ICELANDIC TOURISM?
Survey among Icelanders may be
found on ITB website.

25
SURVEY AMONG TOURISM COMPANIES
In early 2016, the Icelandic Tourist Board enlisted Gallup to conduct an Internet survey among Icelandic tourism companies in order to assess their performance in 2015 and the outlook for 2016. The survey was sent to 1,680 e-mail addresses from the Board's database. The response ratio was 35%. The results reflect the responses from individual companies and are analysed according to type of activity, location, number of employees, ratio of foreign companies, turnover and whether the company is operated during part of the year or year-round.
The sample The sample extended to companies in the following categories obtained from the Icelandic Tourist Board's database: 1. Boat trips, 2. Straight from the farm, 3. Car rental companies, 4. Booking services, 5. Farmhouse accommodation, 6. Day-trips, 7. Private accommodation, 8. Hostels, 9. Tour operators, 10. Travel agencies, 11. Guesthouses, 12. Hikes, 13. Hotels and 14. Bus trips. LOCATION 36.3% of the companies were in the Capital Region, 19.5% in North Iceland, 16.9% in South Iceland, 7.7% in West Iceland, 7.7% in the Westfjords, 6.5% in East Iceland and 5.5% in Reykjanes. LENGTH OF TIME IN OPERATION 38.7% of the companies had been in operation for more than 10 years, 22.5% for 6–10 years, 34.1% for 1–5 years and 4.6% for less than a year. TIME OF YEAR IN OPERATION 77.6% of the companies were operated year-round and 27.4% during part of the year. TYPE OF OPERATION 20.1% of respondents were guesthouses or hostels, 16.4% hotels, 13.1% other accommodation, 12% package/jeep/glacier/boat tours, 9.5% day-trips, 8.9% nature experiences, 8.0% communications, 6.6.% travel agencies and tour organisers and 5.1% catering and other services.
COMPANY'S 2015 TURNOVER COMPARED TO 2014
Most said that there was more turnover in all seasons in 2015, compared to 2014, mostly due to increased business with foreign travellers.
´´´´´´´´´´´´´´´´
TURNOVER AND MARGIN 2016 The vast majority (84.3%) believed that turnover would increase in 2016 compared to 2015, and the same applies to the companies' margin, although the number of those who believed that it would increase was slightly lower, or 69.1%.
67.8%
63.8%
60.1%
58.3%
27.5%
31.1%
34.3%
32.2% 9.5%
Autumn
Summer
Spring
Winter
More
Similar
Less
WAS THE TURNOVER IN WINTER/SPRING/SUMMER/AUTUMN 2015 GREATER, SIMILAR OR LESS THAN IN 2014?
19.4%
74.9%
62.7%
22.3%
17.9% Icelanders
Foreigntravellers
More
Similar
Less
WAS TURNOVER DUE TO TRANSACTIONS WITH FOREIGN TRAVELLERS AND ICELANDERS GREATER, SIMILAR OR LESS IN 2015 THAN IN 2014?
69.1%
84.3%
26.6%
14.0%
Margin(EBITDA)
Turnover Increase
Stay the same
Decrease
DO YOU BELIEVE THAT THE COMPANY’S TURNOVER AND MARGIN WILL INCREASE, STAY THE SAME OR DECREASE IN 2016 COMPARED TO 2015?
26
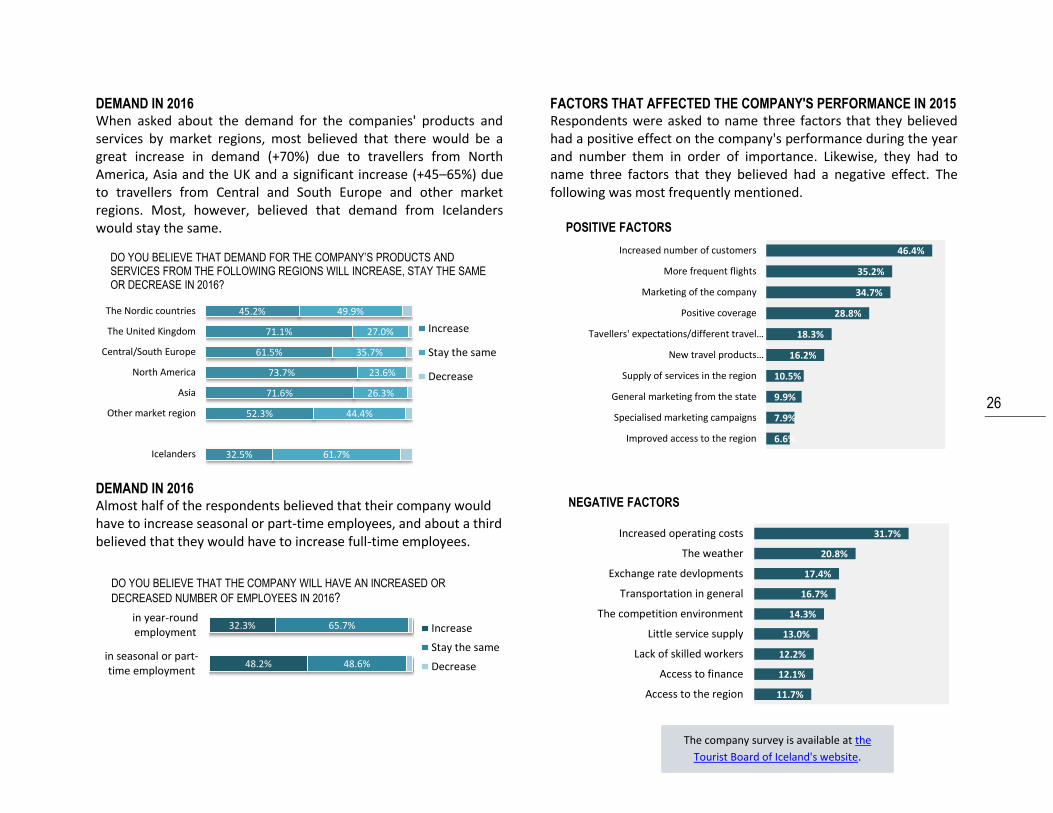
DEMAND IN 2016 When asked about the demand for the companies' products and services by market regions, most believed that there would be a great increase in demand (+70%) due to travellers from North America, Asia and the UK and a significant increase (+45–65%) due to travellers from Central and South Europe and other market regions. Most, however, believed that demand from Icelanders would stay the same.
DEMAND IN 2016 Almost half of the respondents believed that their company would have to increase seasonal or part-time employees, and about a third believed that they would have to increase full-time employees.
FACTORS THAT AFFECTED THE COMPANY'S PERFORMANCE IN 2015 Respondents were asked to name three factors that they believed had a positive effect on the company's performance during the year and number them in order of importance. Likewise, they had to name three factors that they believed had a negative effect. The following was most frequently mentioned.
32.5%
52.3%
71.6%
73.7%
61.5%
71.1%
45.2%
61.7%
44.4%
26.3%
23.6%
35.7%
27.0%
49.9%
Icelanders
Other market region
Asia
North America
Central/South Europe
The United Kingdom
The Nordic countries
Increase
Stay the same
Decrease
DO YOU BELIEVE THAT DEMAND FOR THE COMPANY’S PRODUCTS AND SERVICES FROM THE FOLLOWING REGIONS WILL INCREASE, STAY THE SAME OR DECREASE IN 2016?
48.2%
32.3%
48.6%
65.7%
in seasonal or part-time employment
in year-roundemployment Increase
Stay the same
Decrease
DO YOU BELIEVE THAT THE COMPANY WILL HAVE AN INCREASED OR
DECREASED NUMBER OF EMPLOYEES IN 2016?
6.6%
7.9%
9.9%
10.5%
16.2%
18.3%
28.8%
34.7%
35.2%
46.4%
Improved access to the region
Specialised marketing campaigns
General marketing from the state
Supply of services in the region
New travel products…
Tavellers' expectations/different travel…
Positive coverage
Marketing of the company
More frequent flights
Increased number of customers
POSITIVE FACTORS
11.7%
12.1%
12.2%
13.0%
14.3%
16.7%
17.4%
20.8%
31.7%
Access to the region
Access to finance
Lack of skilled workers
Little service supply
The competition environment
Transportation in general
Exchange rate devlopments
The weather
Increased operating costs
NEGATIVE FACTORS
The company survey is available at the
Tourist Board of Iceland's website.