swiss tourism in figures 2015 structure and industry data
60
SWISS TOURISM IN FIGURES 2015 STRUCTURE AND INDUSTRY DATA PARTNERSHIP. POLITICS. QUALITY.
Transcript of swiss tourism in figures 2015 structure and industry data

swiss tourism in figures 2015 structure and industry dataPartnershiP. Politics. quality.

edited byswiss tourism Federation (stF)
in cooperation withGastrosuisse | Public transport association | swiss cableways | swiss Federal statistical office (sFso) | swiss hiking trail Federation |switzerland tourism (st) | switzerlandMobility
imprintProduction: Béatrice herrmann, stF | Photo: Boris Baldinger | Print: länggass druck aG, 3000 Bern
the brochure contains the latest figures available at the time of printing. it is also obtainable on www.swisstourfed.ch. Bern, July 2016

3
contents
at a glance 4
legal bases 5
tourist regions 7
tourism – an important sector of the economy 8
travel behaviour of the swiss resident population 14
accommodation sector 16
hotel and restaurant industry 29
tourism infrastructure 34
formal education 47
international 49
Quality promotion 51
tourism associations and institutions 55

at a glance
4
28 737 km public transportation network25 836 train stations and stops
CHF 47,8 billion 1total revenue generated by Swiss tourism
170 118 full-time equivalents 1
CHF 17,4 billion 1gross value added
CHF 15,7 billion 2revenue from foreign tourists in Switzerland
35 628 476 hotel overnight staysaverage stay = 2,0 nights
5055 hotels and health establishments273 507 hotel beds
One of the largest export industries in Switzerland4,7 % of export revenue
28 806 restaurants8472 trainees
49 471 225 air passengers460 978 flights
CHF 15,4 billion 2outlays by Swiss tourists abroad
1 swiss Federal statistical office, annual indicators of the tourism satellite account tsa 2014 (first estimate)2 swiss Federal statistical office, tourism Balance of paymentssources: swiss Federal statistical office, litra Public transport information service, Federal office of civil aviation, Gastrosuisse

5
marketing switzerland as a tourist destination
Federal Act on Switzerland Tourism of 21 December 1955, Status as of 1 August 2008 (SR 935.21)
promotion of innovation, cooperation and knowledge creation in tourism
Federal Act on the Promotion of Innovation, Cooperation and Knowledge Creation in Tourism
of 30 September 2011, Status as of 1 February 2012 (SR 935.22)
promotion of the hotel industry
Federal Act on the Promotion of the Hotel Industry of 20 June 2003,
Status as of 1 January 2013 (SR 935.12)
regional policy
Federal Act on Regional Policy of 6 October 2006, Status as of 1 January 2013 (SR 901.0)
casinos
Federal Act on Gambling and Gambling Casinos of 18 December 1998,
Status as of 27 December 2006 (SR 935.52)
temporary special rate for accommodation services
Federal Act on Value Added Tax of 12 June 2009, Status as of 10 May 2016 (SR 641.20)
tourism statistics
Ordinance on the Conduct of Federal Statistical Surveys of 30 June 1993,
Status as of 1 December 2015 (SR 431.012.1)
nature parks
Federal Act on the Protection of Nature and Cultural Heritage of 1 July 1966,
Status as of 12 October 2014 (SR 451)
cablecars and chairlifts
Federal Act on Cableways for Passenger Transport of 23 June 2006, Status as of 1 January 2016
(SR 743.01)
source: terMdat, terminology database of the swiss Federal administration
legal basesnational tourism laws

cantonal tourism laws
Canton Internet Law
aargau www.ag.ch location development act of 1 January 2010
appenzell innerrhoden www.ai.ch Promotion of tourism act of 25 april 1999
appenzell ausserrhoden www.ar.ch tourism act of 25 april 1976
Basel-landschaft www.bl.ch tourism act of 19 June 2003
Basel-stadt www.bs.ch location development act of 29 June 2006
Bern www.be.ch tourism development act of 20 June 2005
Fribourg www.fr.ch tourism act of 13 october 2005
Geneva www.ge.ch tourism act of 24 June 1993
Glarus www.gl.ch tourism development act of 6 May 2007
Graubünden www.gr.ch economic development act of 27 august 2015
Jura www.jura.ch tourism act of 31 May 1990
lucerne www.lu.ch tourism act of 30 January 1996
neuchâtel www.ne.ch law to support the development of tourism (ltour) of 18 February 2014
nidwalden www.nw.ch tourism act of 25 april 1971
obwalden www.ow.ch tourism act of 3 May 2012
st. Gallen www.sg.ch tourism act of 26 november 1995
schaffhausen www.sh.ch no tourism law
solothurn www.so.ch economic and labour law (WaG) of 8 March 2015
schwyz www.sz.ch law on economic development of 27 november 1986
thurgau www.tg.ch law on actions against unemployment and for location development
of 28 november 1988
ticino www.ti.ch tourism act of 25 June 2014
uri www.ur.ch tourism Promotion act of 23 september 2012
Vaud www.vd.ch Promotion of tourism act of 12 June 2007
Valais www.vs.ch tourism act of 9 February 1996
Zug www.zg.ch tourism act of 27 March 2003
Zurich www.zh.ch no tourism law
6 leGal Bases

7
tourist regions
1 graubünden: canton of Graubünden
2 eastern switzerland: cantons of Glarus, appenzell ausserrhoden, appenzell innerrhoden, thurgau, schaffhausen (excluding
parts of the district of schaffhausen) and st. Gallen (excluding parts of the district of see-Gaster).
3 zurich region: cantons of Zurich, of Zug; canton of aargau: district Baden; canton of schwyz: district of höfe and part of
district of March; canton of st. Gallen: parts of see-Gaster district; canton of schaffhausen: part of district schaffhausen.
4 lucerne / lake lucerne: cantons of luzern, uri, obwalden and nidwalden; canton of schwyz (excluding the district of höfe
and parts of the district of March).
5 basel region: cantons of Basel-stadt and Basel-landschaft; canton of solothurn: districts dorneck and thierstein, parts of
district of thal.
6 bern region: canton of Bern: districts of emmental, oberaargau, Bern-Mittelland, parts of districts seeland and of thun.
canton of solothurn: parts of the district of Gäu.
7 bernese oberland: canton of Bern: districts of Frutigen-niedersimmental, interlaken-oberhasli, obersimmental-saanen,
part of the district of thun.
8 Jura & three-lakes: cantons of neuchâtel, Jura; canton of Bern: districts of Bernese Jura, Biel / Bienne, part of seeland;
canton of solothurn: districts of solothurn, Bucheggberg, lebern, parts of the districts of thal and Wasseramt.
9 lake geneva (vaud): canton of Vaud
10 geneva: canton of Geneva
11 valais: canton of Valais
12 ticino: canton of ticino
13 fribourg region: canton of Fribourg
14 aargau region: canton of aargau (without district Baden); canton of solothurn: districts of olten, Gösgen and parts of the
district Gäu
© swiss Federal statistical office, themaKart as of 2015

8
tourism – an important sector of the economy
Domestic and international tourism are important factors in the Swiss economy. Of a total revenue
of CHF 47.8 billion in 2014, 21.9 billion or almost 45.8 % came from tourist accommodation, meals
and transportation. These three tourism products are responsible for 63.1 % of the total value added
from tourism.
tourism – an invisible export
The expenditure of foreign guests in Switzerland has the same effect on the Swiss balance of payments
as the export of goods and services. In 2014, approximately 4.7 % of Switzerland’s export revenue
(goods without nonmonetary gold and services) come from tourism. 1
export revenue
Industry2015
CHF bn2014
CHF bn2013
CHF bn2012
CHF bn2011
CHF bn
chemical industry 84.7 85.3 80.9 79.0 74.6
Metal and machine industry 57.3 60.5 60.0 59.4 64.0
Merchanting 2 25.0 25.1 23.3 26.9 27.6
Watchmaking industry 21.5 22.3 21.8 21.4 19.3
Financial services 2 19.9 20.3 20.8 20.7 21.9
tourism (tourism Balance of Payments) 15.7 16.3 15.5 15.1 15.2
1 the tourism figures in the table above are based on the tourism Balance of Payments. For system-related reasons, however, they differ slightly from the values in the tourism satellite account. the tourism Balance of Payments, for instance, also reports expenditure by for-eign cross-border commuters and short-stay residents, foreign students at swiss private schools and foreign students at swiss colleges and universities, which are not included in the tourism satellite account. on the other hand, the tourism Balance of Payments does not include purchases of tickets (air travel and international rail tickets) from swiss transportation enterprises made by foreign visitors abroad.
2 data from the data portal of the swiss national Bank: data.snb.ch (access on 8 June 2016). sources: swiss Federal statistical office, swiss national Bank

9 tourisM – an iMPortant sector oF the econoMy
Switzerland’s income and expenditures related to travel are reflected in the Tourism Balance of Pay-
ments. On the assets side, it reports Switzerland’s income from travel by foreign visitors in Switzer-
land, and on the liabilities side, it shows expenditure by the resident Swiss population while abroad.
For system-related reasons, the figures in the Tourism Balance of Payments differ slightly from the
values in the Tourism Satellite Account. See footnote 1 on the previous page regarding this point.
The largest proportion of income comes from trips with overnight stays by foreign visitors. Of this
income, revenue from clients of accommodation establishments is largely dominant over revenue
from educational and hospital stays.
The Tourism Balance of Payments is based on numerous data sources including surveys of visitors
and households as well as tourism accommodation statistics.
tourism balance of payments
Revenue / Expenditure in billion CHFRevenue from foreign tourists
2015 2 2014 1 2013 1Expenditure of Swiss tourists abroad
2015 2 2014 1 2013 1
tourism, including overnight stays 10.6 10.9 10.7 11.2 11.4 11.0
Visitors staying in lodging facilities and
with relatives
7.4 7.7 7.5
educational & medical stays 3.2 3.2 3.2
excursionists, transit visitors, other tourism 2.6 3.0 2.6 4.2 4.0 4.0
consumption expenditure of border workers
incl. short-term residents (< 4 months)
2.5 2.4 2.3
total 15.7 16.3 15.5 15.4 15.4 15.0
1 revised figures2 Provisional figuressource: swiss Federal statistical office, tourism balance of payments
tourism balance of paymentslarGest share oF incoMe FroM traVel With oVerniGht stays

10 tourisM – an iMPortant sector oF the econoMy
the tourism satellite account
increase in oVerall tourisM deMand
Overall tourism demand rose considerably again in 2014 (1.1 %) after previously falling during the pre-
ceding years (2012: −0.1 %; 2013: −0.2 %). A positive development was observed for most products in
2014, leading to an increase in the overall tourism demand to a total of CHF 47,808 billion. The de-
crease in accommodation services (−0.4 %) and food and beverage serving services (−0.04 %) remained
relatively slight and was compensated with the higher growth among passenger transport services
(1.0 %), travel agencies (3.2 %) and tourism-connected products (2.1 %).
shares of the tourism industry in switzerland
0 % 5 % 10 % 15 % 20 % 25 %
Non-tourism-specific products
Tourism-connected services
Miscellaneous tourism services
Recreation andother entertainment services
Cultural services
Travel agency, tour operator andtourist guide services
Passenger transport services
Food and beverage serving services
Accommodation services
2014 120132012
1 First estimatesource: swiss Federal statistical office, annual indicators of the tourism satellite account
the goal of the tourism satellite account is to provide answers on the status and development of tourism in switzerland from an economic perspective. three core variables are surveyed: tourism overall demand (i.e. total tourism consumption), gross value added by tourism and tourism employment. the main challenge in capturing the statistics of tourism is that economic statistics are generally supply-oriented. the noGa division in different industries is based on the goods and services they mainly produce. By contrast, tourism as a cross-sectional sector includes several of these supply-side defined industries like accommodation, restaurant business, transport providers, travel agencies and tour operators to varying degrees. as such, restaurant services are not generally touristic but only insofar as they are actually consumed by tourists. Generally speaking, a good only becomes touristic when being consumed by tourists. tourism is hence defined by the demand side. the tourism satellite account represents the basic synthesising statistic to measure these economic impacts of tourism.

11 tourisM – an iMPortant sector oF the econoMy
the tourism satellite accounthiGh Gross Value added GroWth
In 2014, the total gross value added by tourism showed strong growth (1.8 %). Overall, this amounted
to CHF 17.386 billion. Almost every product recorded positive gross value added trends, with the
growth of recreation and other entertainment services registering an increase of 3.8 %. The product
categories ‘food and beverage serving services’ (1.7 %) and ‘accommodation services’ (0.8 %) overall
registered higher growth than ‘passenger transport services’ (−0.3 %). Growth for tourism-connected
products was 2.3 % and for non-tourism-specific products −0.4 %.
share of tourism gross value added according to products
0 % 5 % 10 % 15 % 20 % 25 %
2014 120132012
Non-tourism-specific products
Tourism-connected services
Miscellaneous tourism services
Recreation andother entertainment services
Cultural services
Travel agency, tour operator andtourist guide services
Passenger transport services
Food and beverage serving services
Accommodation services
1 First estimatesource: swiss Federal statistical office, annual indicators of the tourism satellite account

12 tourisM – an iMPortant sector oF the econoMy
the tourism satellite accountsliGht GroWth in tourisM eMPloyMent
Although the overall tourism demand and the gross value added recorded high growth rates, tourism
employment in full-time equivalents grow slightly in 2014 (0.4 %) to 170 118 full-time equivalents. A
decrease was registered only for the product ‘accommodation services’ (−0.8 %). All remaining prod-
ucts registered an increase in tourism employment in which the products ‘food and beverage serving
services’ (0.8 %), ‘passenger transport services’ (0.6 %) and ‘travel agencies’ (0.9 %) showed only a mod-
erate growth rate.
tourism employment rate according to products (in Full-tiMe equiValents)
0 10000 20000 30000 40000 50000
2014 120132012
Non-tourism-specific products
Tourism-connected services
Miscellaneous tourism services
Recreation andother entertainment services
Cultural services
Travel agency, tour operator andtourist guide services
Passenger transport services
Food and beverage serving services
Accommodation services
1 First estimatesource: swiss Federal statistical office, annual indicators of the tourism satellite account

13 tourisM – an iMPortant sector oF the econoMy
full-time eQuivalents according to economic sectors
(in 1000, annual aVeraGe)
2015 2014 2013 2012 2011 2010
service industry total 2842.6 2808.5 2783.4 2719.3 2653.4 2612.5
Men 1539.7 1524.1 1514.6 1477.5 1443.4 1420.1
Women 1302.9 1284.3 1268.7 1241.8 1210.0 1192.4
accommodation total 63.6 65.2 65.7 66.0 68.0 70.9
Men 29.7 30.3 30.6 30.6 31.5 32.5
Women 33.9 34.8 35.1 35.4 36.5 38.4
Food and beverage total 119.8 120.5 119.0 121.0 124.7 129.0service activities
Men 58.6 59.8 59.2 59.3 61.0 62.7
Women 61.1 60.7 59.8 61.7 63.7 66.2
land transport and total 105.8 104.9 104.0 102.0 99.0 97.3transport via pipelines
Men 91.3 90.6 90.0 88.2 86.0 84.4
Women 14.6 14.3 14.1 13.8 13.0 12.9
Water transport and total 13.8 14.0 14.0 13.2 12.3 11.1air transport
Men 8.5 8.6 8.5 8.0 7.4 6.6
Women 5.4 5.4 5.5 5.2 4.9 4.5
Jobs statistics: accommodation and food service activities (in 1000)
20154th quarter
20153rd quarter
20152nd quarter
20151st quarter
20144th quarter
Full-time jobs (90 % and over) 138.9 135.4 138.2 139.0 141.1
Men 77.2 73.9 77 77.7 79.1
Women 61.7 61.5 61.3 61.3 62.0
Part-time jobs i (50 – 89 %) 48.3 46.7 47.4 45.9 45.7
Part-time jobs ii (15 – 49 %) 42.5 42.3 40.8 39.4 40.7
Part-time jobs iii (< 15 %) 26.6 27.7 23.7 23.4 23.7
total number of jobs (overall) 256.3 252.1 250 247.6 251.2
Men 109.8 104.3 106.2 106.2 108.1
Women 146.4 147.8 143.8 141.4 143.1
source: swiss Federal statistical office, employment statistic
employment statistictransPort, accoMModation and Food serVice actiVities

14
In 2014, 88 % of the Swiss resident population 1 undertook at least one trip with one or more overnight
stays away from home. A total of 21.2 million trips were made, of which 7.7 million were within Swit-
zerland. On average 2.9 trips were made per person, of which 1.0 had a domestic destination.
While women and men make about the same number of trips, a comparison between different age
groups shows differences in travel behaviour. Whereas people aged 25 to 44 were the most frequent
travellers, taking 3.2 trips per year, people aged 65 or over took an average of 2.2 trips with overnight
stays.
number of trips (in 1000)
2014 2013 2012
trips with overnight stays 21 159 22 217 20 341
day trips 75 780 76 447 71 651
In addition to trips with overnight stays, data on day trips are also collected. The Swiss resident popu-
lation undertook a total of 75.8 million day trips in 2014, corresponding to an average of 10.3 trips per
person. Differences between language regions are observed. People living in the German-speaking
part of Switzerland undertook 11.7 day trips, whereas one from the French- or Italian-speaking popu-
lation made 7.0 and 5.2 trips per year respectively.
number of trips (Per Person)
2014 2013 2012
trips with overnight stays 2.9 3.0 2.8
day trips 10.3 10.5 9.9
1 swiss resident population aged 6 or over: 7 374 090 personssource: swiss Federal statistical office, travel behaviour 2014
travel behaviour of the swiss resident population

15 traVel BehaViour oF the sWiss resident PoPulation
travel destinations
Among the trips with overnight stays recorded in 2014, 37 % had a Swiss destination. 39 % of trips led
to countries that border Switzerland, namely Germany (12 %), Italy (12 %) and France (9 %). Compared
to 2013, the number of trips to Italy increased by 31 %. Finally, 18 % of trips had a destination in other
European countries and 7 % outside Europe.
number of trips with overnight stays by destination (in 1000)
2014 2013 2012
switzerland 7 732 8 648 7 417
Germany 2 639 2 952 3 053
austria 1 019 981 949
italy 2 557 1 951 2 091
France 1 2 003 2 247 2 042
southeast europe 2 972 933 764
southwest europe 3 1 497 1 310 1 084
rest of europe 1 283 1 616 1 396
rest of the world 1 454 1 575 1 544
unknown 3 4 0
total 21 159 22 217 20 341
1 including overseas departments and Monaco2 Greece, turkey, croatia, Bosnia and herzegovina, serbia, albania, slovenia, Montenegro, Kosovo, romania, Bulgaria, Macedonia3 spain, Portugal, andorra, Gibraltar
duration and purpose of travel
Trips with a destination abroad lasted longer than trips within Switzerland. In 2014, trips of 4 or more
overnight stays represented 66 % of the outbound and only 39 % of the inbound trips. On the other
hand, trips with only one overnight stay accounted for 28 % of domestic and 9 % of trips abroad. In
2014, the main reasons for trips were, as in the previous year, holidays and recreation. They accounted
for 63 % of trips, and almost two-thirds of these had a foreign destination. In second place came trips
for the purpose of visiting family and friends (21 %). Business trips accounted for 6 % of trips.
source: swiss Federal statistical office, travel behaviour 2014
16
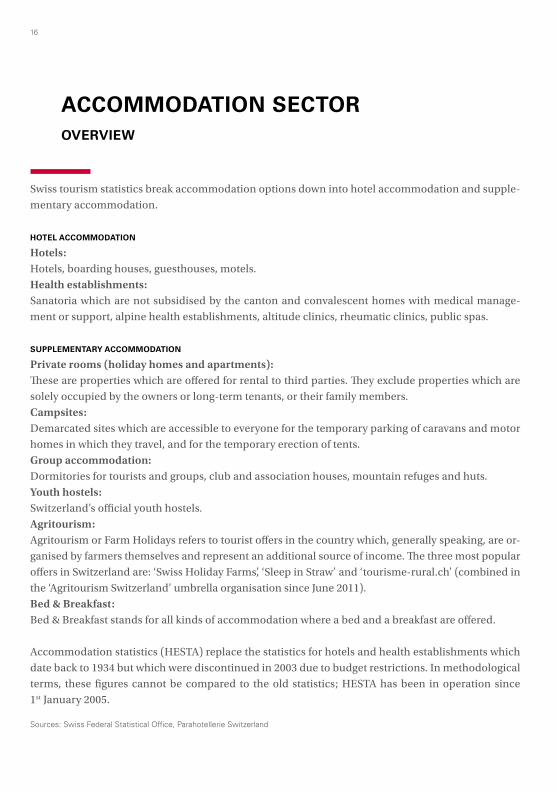
Swiss tourism statistics break accommodation options down into hotel accommodation and supple-
mentary accommodation.
hotel accommodation
Hotels:Hotels, boarding houses, guesthouses, motels.
Health establishments:Sanatoria which are not subsidised by the canton and convalescent homes with medical manage-
ment or support, alpine health establishments, altitude clinics, rheumatic clinics, public spas.
supplementary accommodation
Private rooms (holiday homes and apartments):These are properties which are offered for rental to third parties. They exclude properties which are
solely occupied by the owners or long-term tenants, or their family members.
Campsites:Demarcated sites which are accessible to everyone for the temporary parking of caravans and motor
homes in which they travel, and for the temporary erection of tents.
Group accommodation:Dormitories for tourists and groups, club and association houses, mountain refuges and huts.
Youth hostels:Switzerland’s official youth hostels.
Agritourism:Agritourism or Farm Holidays refers to tourist offers in the country which, generally speaking, are or-
ganised by farmers themselves and represent an additional source of income. The three most popular
offers in Switzerland are: ‘Swiss Holiday Farms’, ‘Sleep in Straw’ and ‘tourisme-rural.ch’ (combined in
the ‘Agritourism Switzerland’ umbrella organisation since June 2011).
Bed & Breakfast:Bed & Breakfast stands for all kinds of accommodation where a bed and a breakfast are offered.
Accommodation statistics (HESTA) replace the statistics for hotels and health establishments which
date back to 1934 but which were discontinued in 2003 due to budget restrictions. In methodological
terms, these figures cannot be compared to the old statistics; HESTA has been in operation since
1st January 2005.
sources: swiss Federal statistical office, Parahotellerie switzerland
accommodation sectoroverview
17
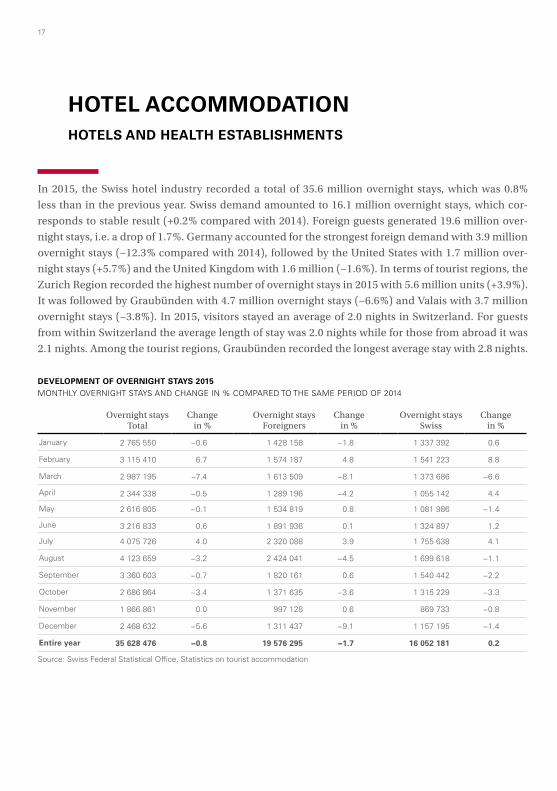
In 2015, the Swiss hotel industry recorded a total of 35.6 million overnight stays, which was 0.8 %
less than in the previous year. Swiss demand amounted to 16.1 million overnight stays, which cor-
responds to stable result (+0.2 % compared with 2014). Foreign guests generated 19.6 million over-
night stays, i.e. a drop of 1.7 %. Germany accounted for the strongest foreign demand with 3.9 million
overnight stays (−12.3 % compared with 2014), followed by the United States with 1.7 million over-
night stays (+5.7 %) and the United Kingdom with 1.6 million (−1.6 %). In terms of tourist regions, the
Zurich Region recorded the highest number of overnight stays in 2015 with 5.6 million units (+3.9 %).
It was followed by Graubünden with 4.7 million overnight stays (−6.6 %) and Valais with 3.7 million
overnight stays (−3.8 %). In 2015, visitors stayed an average of 2.0 nights in Switzerland. For guests
from within Switzerland the average length of stay was 2.0 nights while for those from abroad it was
2.1 nights. Among the tourist regions, Graubünden recorded the longest average stay with 2.8 nights.
development of overnight stays 2015
Monthly oVerniGht stays and chanGe in % coMPared to the saMe Period oF 2014
Overnight staysTotal
Change in %
Overnight stays Foreigners
Change in %
Overnight staysSwiss
Change in %
January 2 765 550 −0.6 1 428 158 −1.8 1 337 392 0.6
February 3 115 410 6.7 1 574 187 4.8 1 541 223 8.8
March 2 987 195 −7.4 1 613 509 −8.1 1 373 686 −6.6
april 2 344 338 −0.5 1 289 196 −4.2 1 055 142 4.4
May 2 616 805 −0.1 1 534 819 0.8 1 081 986 −1.4
June 3 216 833 0.6 1 891 936 0.1 1 324 897 1.2
July 4 075 726 4.0 2 320 088 3.9 1 755 638 4.1
august 4 123 659 −3.2 2 424 041 −4.5 1 699 618 −1.1
september 3 360 603 −0.7 1 820 161 0.6 1 540 442 −2.2
october 2 686 864 −3.4 1 371 635 −3.6 1 315 229 −3.3
november 1 866 861 0.0 997 128 0.6 869 733 −0.8
december 2 468 632 −5.6 1 311 437 −9.1 1 157 195 −1.4
entire year 35 628 476 −0.8 19 576 295 −1.7 16 052 181 0.2
source: swiss Federal statistical office, statistics on tourist accommodation
hotel accommodationhotels and health establishments

18 accoMModation sector
overnight stays by country of residence of visitors
Country of residence of visitors Calendar year 2015Winter season 2014 / 2015
(November to April)Summer season 2015
(Mai to October)
total 35 628 476 15 695 268 20 080 490
switzerland 16 052 181 7 357 201 8 717 810
Foreign countries 19 576 295 8 338 067 11 362 680
europe total (excl. switzerland) 11 788 182 5 894 492 6 053 676
Germany 3 853 180 1 915 438 2 010 174
united Kingdom 1 1 640 457 788 402 853 600
France 1 254 447 640 490 628 015
italy 936 913 473 343 470 968
netherlands 583 831 298 120 301 488
Belgium 566 201 294 702 279 200
russia 369 264 233 621 155 370
nordic countries 2 459 768 246 798 218 424
spain 396 044 167 052 230 887
austria 373 235 157 027 217 722
other countries europe 1 354 842 679 499 687 828
america total 2 419 448 857 649 1 557 433
united states 1 738 838 572 210 1 158 065
canada 234 218 86 823 147 335
Brazil 225 239 113 738 117 151
other countries america 221 153 84 878 134 882
asia total 4 741 090 1 342 962 3 373 229
china (incl. hong Kong) 1 519 100 443 979 1 068 153
Gulf states 3 929 799 181 017 735 050
Japan 394 784 84 469 312 996
india 591 924 116 772 472 249
republic of Korea 317 022 108 646 204 687
other countries asia 988 461 408 079 580 094
africa total 302 201 135 405 161 398
australia, oceania total 325 374 107 559 216 944
1 Great Britain and northern ireland2 denmark, Finland, norway, sweden, iceland3 Bahrain, qatar, Kuwait, oman, saudi arabia, united arab emiratessource: swiss Federal statistical office, statistics on tourist accommodation

19 accoMModation sector
hotel industry: supply and demand
cantons
Capacity 1 Overnight stays in thousands Net occupancy rate in %Canton Rooms Beds Swiss Foreigners Total Rooms 2 Beds 3
Graubünden 18 508 38 461 2 790 1 927 4 717 47 38
Bern 16 460 32 308 2 186 2 789 4 975 53 45
Zurich 14 808 25 606 1 389 3 623 5 012 65 54
Valais 13 779 28 558 2 061 1 677 3 738 47 40
Vaud 9 612 18 210 1 195 1 480 2 674 52 41
Geneva 9 282 15 249 566 2 387 2 953 65 53
ticino 8 102 15 993 1 348 832 2 180 46 39
lucerne 6 588 12 325 723 1 307 2 030 54 46
st. Gallen 4 916 9 571 557 411 968 38 29
Basel-stadt 4 067 7 306 398 804 1 202 62 45
aargau 3 133 5 238 358 344 702 48 38
schwyz 2 204 4 351 380 211 591 43 39
thurgau 2 176 3 846 273 146 418 40 31
Fribourg 2 095 4 310 283 169 452 40 29
obwalden 2 056 4 203 258 405 663 54 46
solothurn 1 683 3 032 198 198 396 47 37
Basel-landschaft 1 344 2 452 142 150 292 44 33
Zug 1 277 2 076 138 190 327 55 44
uri 1 261 2 650 97 144 241 37 28
neuchâtel 1 149 2 219 117 107 224 39 28
appenzell ausserrhoden 888 1 600 90 28 118 27 22
Jura 838 1 726 89 17 107 25 18
nidwalden 766 1 641 98 115 213 47 37
Glarus 723 1 558 108 20 128 30 25
schaffhausen 678 1 320 78 74 152 45 33
appenzell innerrhoden 587 1 814 133 22 154 45 26
total 128 979 247 625 16 052 19 576 35 628 52 42
1 only open establishments (available rooms and beds)2 number of room nights in per cent of the net room capacity3 number of overnight stays in per cent of the net bed capacitysource: swiss Federal statistical office, statistics on tourist accommodation

20 accoMModation sector
tourist regions
Capacity 1 Overnight stays in thousands Net occupancy rate in %Tourist region Rooms Beds Swiss Foreigners Total Rooms 2 Beds 3
Graubünden 18 508 38 461 2 790 1 927 4 717 46.7 38.1
Zurich region 17 266 29 698 1 653 3 959 5 612 63.3 52.2
Valais 13 779 28 558 2 061 1 677 3 738 47.3 39.6
lucerne / lake lucerne 12 310 24 178 1 484 2 123 3 607 50.6 42.8
Bernese oberland 11 449 23 309 1 542 2 180 3 722 54.8 47.5
eastern switzerland 9 713 19 223 1 214 671 1 885 37.3 28.4
lake Geneva region (Vaud) 9 612 18 210 1 195 1 480 2 674 52.5 41.3
Geneva 9 282 15 249 566 2 387 2 953 64.6 53.2
ticino 8 102 15 993 1 348 832 2 180 46.2 38.6
Basel region 5 574 10 028 552 968 1 521 57.3 42.1
Jura & three-lakes 3 949 7 487 448 297 745 38.4 28.2
Bern region 3 889 6 985 511 526 1 037 52.5 42.0
aargau region 3 452 5 935 405 380 786 47.3 37.2
Fribourg region 2 095 4 310 283 169 452 39.9 29.5
total 128 979 247 625 16 052 19 576 35 628 51.5 41.7
communes
Capacity 1 Overnight stays in thousands Net occupancy rate in %Communes Rooms Beds Swiss Foreigners Total Rooms 2 Beds 3
Zurich 8 013 14 017 613 2 335 2 948 69.9 57.7
Geneva 6 351 10 426 279 1 759 2 038 65.0 53.6
Basel 3 957 7 117 390 799 1 190 63.4 46.2
Zermatt 3 232 6 402 566 688 1 254 65.8 58.7
davos 3 031 5 920 423 374 797 51.8 43.4
lucerne 3 025 5 795 332 948 1 280 71.1 61.3
lausanne 2 507 4 439 329 434 762 60.7 47.5
st. Moritz 2 090 3 951 185 415 600 55.3 47.3
Bern 2 041 3 451 305 410 715 66.7 56.9
opfikon 1 913 3 121 182 507 689 69.2 60.5
lugano 1 647 3 099 211 280 491 53.0 43.9
interlaken 1 486 2 861 126 584 710 72.3 68.4
Meyrin 1 390 2 087 152 299 451 70.2 59.3
other communes 88 296 174 938 11 959 9 744 21 703 43.2 34.6
total 128 979 247 625 16 052 19 576 35 628 51.5 41.7

21 accoMModation sector
supply in hotels and health establishments
YearSurveyed
establishmentsSurveyed
roomsSurveyed
bedsOpen
establishmentsAvailable
roomsAvailable
beds
2015 5 055 141 018 273 507 4 509 128 979 247 625
2014 5 129 140 722 272 636 4 554 128 638 246 449
2013 5 191 140 192 271 298 4 662 128 648 246 489
2012 5 257 140 372 271 168 4 742 129 097 246 951
2011 5 396 142 101 273 969 4 773 128 719 245 072
2010 5 477 142 815 275 193 4 827 128 865 245 251
demand in hotels and health establishments
Year Arrivals Overnight stays
Average duration of stay
Net occupancy rate in % (rooms) 1
Net occupancy rate in % (beds) 2
2015 17 429 421 35 628 476 2.0 51.5 41.7
2014 17 162 053 35 933 512 2.1 52.0 42.2
2013 16 831 177 35 623 883 2.1 51.6 41.9
2012 16 297 767 34 766 273 2.1 50.5 40.8
2011 16 228 987 35 486 256 2.2 51.6 41.9
2010 16 202 574 36 207 812 2.2 52.3 42.9
size of hotels and health establishments
Size of establishment Open establishments in % Arrivals Overnight stays
0 to 10 beds 653 14.5 153 334 335 261
11 to 20 beds 977 21.7 625 269 1 315 778
21 to 50 beds 1 497 33.2 2 955 778 6 272 212
51 to 100 beds 842 18.7 4 512 976 9 446 782
101 to 150 beds 264 5.8 2 769 221 5 597 921
151 to 200 beds 109 2.4 1 458 206 3 164 212
201 to 300 beds 102 2.3 2 239 018 4 550 665
301 and more beds 66 1.5 2 715 619 4 945 645
total 4 509 100.0 17 429 421 35 628 476
1 number of room nights in per cent of the net room capacity2 number of overnight stays in per cent of the net bed capacitysource: swiss Federal statistical office, statistics on tourist accommodation
22
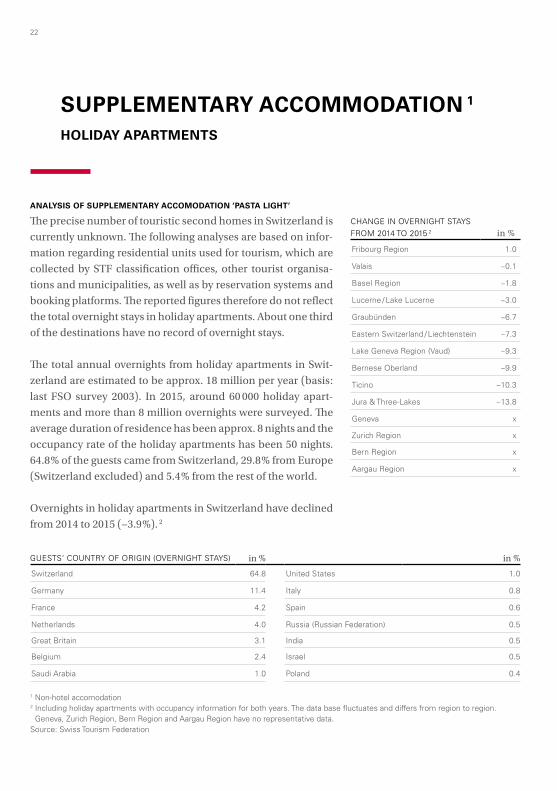
supplementary accommodation 1
holiday apartments
analysis of supplementary accomodation ‘pasta light’
The precise number of touristic second homes in Switzerland is
currently unknown. The following analyses are based on infor-
mation regarding residential units used for tourism, which are
collected by STF classification offices, other tourist organisa-
tions and municipalities, as well as by reservation systems and
booking platforms. The reported figures therefore do not reflect
the total overnight stays in holiday apartments. About one third
of the destinations have no record of overnight stays.
The total annual overnights from holiday apartments in Swit-
zerland are estimated to be approx. 18 million per year (basis:
last FSO survey 2003). In 2015, around 60 000 holiday apart-
ments and more than 8 million overnights were surveyed. The
average duration of residence has been approx. 8 nights and the
occupancy rate of the holiday apartments has been 50 nights.
64.8 % of the guests came from Switzerland, 29.8 % from Europe
(Switzerland excluded) and 5.4 % from the rest of the world.
Overnights in holiday apartments in Switzerland have declined
from 2014 to 2015 (−3.9 %). 2
Guests‘ country oF oriGin (oVerniGht stays) in % in %
switzerland 64.8 united states 1.0
Germany 11.4 italy 0.8
France 4.2 spain 0.6
netherlands 4.0 russia (russian Federation) 0.5
Great Britain 3.1 india 0.5
Belgium 2.4 israel 0.5
saudi arabia 1.0 Poland 0.4
chanGe in oVerniGht stays FroM 2014 to 2015 2 in %
Fribourg region 1.0
Valais −0.1
Basel region −1.8
lucerne / lake lucerne −3.0
Graubünden −6.7
eastern switzerland / liechtenstein −7.3
lake Geneva region (Vaud) −9.3
Bernese oberland −9.9
ticino −10.3
Jura & three-lakes −13.8
Geneva x
Zurich region x
Bern region x
aargau region x
1 non-hotel accomodation 2 including holiday apartments with occupancy information for both years. the data base fluctuates and differs from region to region.
Geneva, Zurich region, Bern region and aargau region have no representative data. source: swiss tourism Federation

23 suPPleMentary accoMModation
holiday apartments and guest rooms by regions
Tourist region Total
Valais 24 446 79 2 018 577 6 250 577 1 088 114 26 11 213
Graubünden 6 185 54 1 161 439 3 944 497 604 79 13 6 983
Bernese oberland 2 73 19 583 154 1 758 234 273 74 0 3 188
ticino 0 20 11 200 63 895 91 142 35 7 1 465
lucerne / lake lucerne 0 21 100 109 43 700 81 119 17 2 1 223
lake Geneva region (Vaud) 1 49 10 135 54 383 58 95 9 3 909
eastern switzerland / liechtenstein 0 1 4 117 21 314 54 65 18 1 619
Jura & three-lakes 0 3 0 27 17 193 54 55 12 1 525
Fribourg region 0 1 0 18 5 97 17 26 4 0 199
Zurich region 0 4 0 17 2 93 0 5 0 1 122
Bern region 1 0 0 3 2 16 0 9 0 2 34
Geneva 0 0 0 6 0 3 0 0 0 1 12
aargau region 0 0 0 1 0 2 0 1 0 0 4
Basel region 0 1 0 1 0 1 0 1 0 0 4
total 34 804 277 4 394 1 377 14 649 1 663 2 483 362 57 26 500 1
1 of these, 400 objects are guest rooms.
awarded certificates 2005 – 2015
0
5 000
10 000
15 000
20 000
25 000
20152014201320122011201020092008200720062005
15 19517 099
18 102
21 663
18 027
23 22725 117
14 476 14 728
18 705
26 500
as of 31.12.2015For more information on the classification of holiday apartments and guest rooms, please go to page 53 of this brochure.source: swiss tourism Federation
classified holiday apartments and guest rooms

24 suPPleMentary accoMModation
group lodgings
CONTACT groups.ch is the private umbrella organisation for group accommodation in Switzerland. In
2015, it acted as the intermediary for 1.77 million overnight stays (−3.3 %) by 12 335 groups at a total of
761 accommodation facilities. The increase in the average length of stay to 5 nights is very encouraging
(2014: 4.8), as is the simultaneous increase in the average group size to 29 persons (2014: 28). In most
regions, demand from the four main source countries (Switzerland, Germany, France and Italy) tailed
off again. The Basel, Bern and Jura & Three-Lakes regions were the only ones to post more overnight
stays. The number of affiliated businesses changed significantly in the following regions: Eastern Swit-
zerland (+7) and Valais (−4). The number of beds offered increased by a total of 816.
supply and demand
Tourist regionEstablish-
ments Beds Groups ArrivalsOvernight
staysDuration
of stayGroup
size
Valais 172 11 048 2 529 67 965 389 132 5.7 27
Graubünden 151 10 282 1 895 58 992 351 723 6 31
Bernese oberland 122 9 001 1 793 49 935 253 962 5.1 28
eastern switzerland / liechtenstein 74 4 594 1 372 38 988 171 083 4.4 28
lucerne / lake lucerne 71 5 544 1 257 37 439 153 674 4.1 30
Jura & three-lakes 51 2 837 1 045 31 775 149 656 4.7 30
lake Geneva region (Vaud) 37 3 175 792 25 830 112 599 4.4 33
ticino 25 1 134 541 11 981 55 511 4.6 22
Fribourg region 23 1 465 506 17 807 76 951 4.3 35
Bern region 10 621 145 3 483 12 775 3.7 24
Zurich region 10 598 197 5 481 16 779 3.1 28
aargau region 9 463 158 4 827 17 038 3.5 31
Basel region 5 312 97 2 153 9 303 4.3 22
Geneva 1 336 8 139 172 1.2 17
total 761 51 410 12 335 356 795 1 770 358 5.0 29
Guests’ Country of Origin Groups ArrivalsOvernight
staysDuration
of stay Group size
switzerland 10 021 295 555 1 350 236 5.5 29
Germany 922 22 898 178 600 7.8 25
France 239 5 335 48 936 9.2 22
others 1 153 33 007 192 586 5.8 29
total 12 335 356 795 1 770 358 5.0 29.0
source: contact groups.ch

25 suPPleMentary accoMModation
youth hostels
In 2015, youth hostels based in Switzerland recorded a total of 814 000 overnight stays or 14.4 % less
than during the previous year. Domestic demand was at 537 000 overnight stays, which corresponds to
a decrease (−2.0 %). Foreign demand generated 277 000 overnight stays or 31.3 % less than in 2014. Ger-
man guests accounted for the largest share of foreign demand with 76 000 overnight stays (−25.5 % com-
pared with 2014), followed by guests from the United Kingdom with 19 000 overnight stays (−48.2 %) and
from France with 16 000 overnight stays (−43.9 %). In terms of tourist regions, Graubünden recorded the
largest number of overnight stays with 138 000 units (which corresponds to a decrease of 7.6 % com-
pared with 2014), followed by the Zurich Region with 107 000 overnight stays (−11.3 %) and the Bernese
Oberland with 98 000 overnight stays (+2.6 %). In 2015, the average duration of stay in the youth hostels
was 2.0 nights at national level. Swiss guests stayed an average of 2.0 nights whereas foreign visitors
stayed an average of 1.9 nights. In terms of tourist regions, the longest length of stay was registered in
Graubünden with a result of 2.5 nights.
supply and demand
Tourist region
Surveyed establishments
Surveyedbeds
Arrivals
Overnight stays
Average duration of stay
Graubünden 8 1 030 55 107 138 333 2.5
Zurich region 7 735 55 503 106 600 1.9
Bernese oberland 5 546 52 598 97 629 1.9
eastern switzerland 5 464 26 459 44 244 1.7
ticino 4 596 40 627 84 545 2.1
lake Geneva region (Vaud) 4 550 36 254 78 880 2.2
Valais 4 509 35 456 69 800 2.0
lucerne / lake lucerne 4 425 34 305 58 439 1.7
Jura & three lakes 3 266 x x x
aargau region 3 190 x x x
Basel region 2 275 x x x
Bern region 1 180 x x x
Fribourg region 1 76 x x x
Geneva 0 0 0 0 0
total 51 5 842 415 194 813 635 2.0
x = omitted for purposes of data protection (less than 3 open establishments)source: swiss Federal statistical office, statistics on tourist accommodation

26 suPPleMentary accoMModation
campsites
In 2015, the campsites 1 recorded 2.7 million overnight stays representing a decrease of 0.6 % compared
with the previous year. Swiss guests accounted for 1.8 million overnight stays, up 9.8 %. Foreign guests
generated 870 000 overnight stays, down 16.7 %. German guests accounted for 315 000 overnight stays
(−21.8 % compared with 2014), which corresponds to the highest absolute result among the foreign
countries. They were followed by visitors from the Netherlands with 183 000 overnight stays (−31.5 %),
France with 81 000 (−1.0 %) and the United Kingdom with 66 000 (+3.8 %). With a total of 618 000 over-
night stays for 2015, Ticino ranks first among all tourist regions in terms of absolute overnight stays
but, however, saw a 11.2% decrease compared with the previous year. It was followed by Valais with
362 000 overnight stays (−4.5 %). For Switzerland as a whole, the average length of stay was 3.0 nights in
2015. Swiss guests spent an average of 3.3 nights on campsites while foreign guests stayed 2.7 nights. Of
all tourist regions, Ticino recorded the longest average length of stay with 3.8 nights.
supply and demand
Tourist region
Surveyed establish-
mentsTotal
campsites
Overnight leased
campsites
Permanentlyleased
campsites
Arrivals
Overnight
stays
Average duration
of stay
Valais 61 7 498 5 741 1 757 107 109 361 974 3.4
Bernese oberland 53 4 935 3 150 1 785 94 470 268 896 2.8
lake Geneva region (Vaud) and Geneva 2 44 7 901 3 361 4 539 99 926 305 874 3.1
Graubünden 44 5 502 3 858 1 644 86 327 266 645 3.1
lucerne / lake lucerne 39 5 108 2 339 2 769 95 200 236 906 2.5
Jura & three-lakes 38 5 676 2 479 3 197 59 003 183 988 3.1
eastern switzerland 37 4 717 1 845 2 871 64 575 159 900 2.5
ticino 33 5 971 4 999 972 161 363 617 552 3.8
Zurich region 23 2 786 1 281 1 505 47 451 111 954 2.4
Fribourg region 13 2 625 710 1 915 20 298 49 870 2.5
aargau region 10 989 349 640 13 843 34 908 2.5
Bern region 9 1 153 820 333 21 304 51 966 2.4
Basel region 6 508 138 370 3 004 6 847 2.3
total 410 55 369 31 071 24 298 873 873 2 657 280 3.0
1 only campsites which are included in the swiss Business and enterprise register (Ber). note: the methodology for calculating the statistic of campsites has been reworked in 2010. More information on: www.tourismus.bfs.admin.ch (in German or French)
2 two regions combined due to data protection (less than 3 open establishments in the Geneva tourist region)source: swiss Federal statistical office, statistics on tourist accommodation

27 suPPleMentary accoMModation
agritourism
In 2015, 31 000 overnight stays in holiday homes on farms were booked via the e-domizil booking
platform. This figure represents 13 % less overnight stays and an 8 % decrease in turnover year-on-
year. Not included: other accommodation categories such as ‘Sleep on Straw’, group accommodation
and rooms, and visitors’ own bookings arranged directly between the holiday guest and the provider.
From summer 2016 onwards, group accommodation on farms can be booked via gruppenhaus.ch,
and rooms on farms can be booked via e-domizil.
overnight stays and establishments
Tourist region
Overnight stays 2015‘Swiss Holiday Farms’ 1
lake Geneva region (Vaud) 5 885
lucerne / lake lucerne 3 701
Valais 3 701
Fribourg region 3 640
Jura & three-lakes 3 094
eastern switzerland 2 427
Graubünden 1 941
ticino 1 203
Bern region 1 699
Bernese oberland 1 021
Zurich region 929
aargau region 910
Geneva 546
Basel region 303
total 31 000
number of establishments 330
1 data of e-domizilsource: agritourism switzerland

28 suPPleMentary accoMModation
bed and breakfast
In 2015, 168 062 guests stayed in 911 lodging facilities in Switzerland (2014: 175 102 guests and 1022
lodging facilities). A total of 396 423 overnights were recorded (2014: 422 786). Guests from Switzerland
accounted for 204 000 overnights (2014: 210 644), while Europe – excluding Switzerland – represented
the second largest share with 149 990 (2014: 175 384). These results will not be extrapolated and are not
directly comparable to those of the preceding years because the number of lodging facilities fluctu-
ates year-by-year (additions and deletions throughout the year). However, the adjusted figures show
an increase in overnights (2014 /15: +1.4 %, 2013 /14: +3.9 %), while the average length of stay remained
unchanged (2.4 nights).
supply and demand
Year Establishments 1 Rooms Beds ArrivalsOvernight stays Swiss
Overnight stays foreigners
Overnight stays total
2015 911 2 830 5 658 168 062 204 000 192 423 396 423
2014 1 022 3 094 6 208 175 102 210 644 212 142 422 786
2013 1 036 3 031 6 239 186 478 218 123 227 278 445 401
2012 988 2 903 5 965 179 792 206 338 234 723 441 061
Tourist region
Overnight stays 2015
Overnight stays 2014
Change in %
Valais 51 669 60 524 −14.63
lucerne / lake lucerne 41 067 48 373 −15.10
lake Geneva region (Vaud) 37 855 39 777 −4.83
aargau region 34 230 – –
Bernese oberland 33 623 34 082 −1.35
ticino 31 362 33 177 −5.47
eastern switzerland 31 199 33 564 −7.05
Bern region 30 355 47 462 −36.04
Zurich region 29 996 38 247 −21.57
Graubünden 22 615 24 995 −9.52
Jura & three-lakes 19 324 24 936 −22.51
Fribourg region 15 691 19 779 −20.67
Basel region 13 582 14 979 −9.33
Geneva 3 855 2 891 33.34
total 396 423 422 786 −6.24
1 the accommodation units stem exclusively from the list of members of the Bed and Breakfast switzerland organisation.source: Bed and Breakfast switzerland

29
hotel and restaurant industrymaJor employer in switzerland
209 920 employees (2014)
8 472 trainees in basic vocational education and training (2014)
28 806 hotel and restaurant establishments (2013)
26 663 Vat-taxable hotel and restaurant establishments (2013)
28.4 billion francs of Vat-taxable annual turnover in catering business and hotels (2013)
938.5 million francs paid in Vat (after pre-tax deduction) (2013)
or
9.1 % of the overall net Federal tax administration (Fta) receivables (2012)
Switzerland’s hotel and restaurant industry, with its 209 920 employees, is a very important employer
in Switzerland. Some 5 % of the country’s employees work in the hotel and restaurant industry. In ad-
dition, this industry employs some 8 472 young people as trainees (apprentices) within the framework
of basic vocational education and training. In addition to the jobs in the hotel and restaurant industry
itself, the sector indirectly generates many other jobs – within the construction industry, in agricul-
ture, and in specialised trade. For instance, half of the meat in Switzerland is consumed in the catering
industry. This means that jobs are created both in agriculture and the butchery business.
The latest census by the Federal Statistical Office (2013) counts some 28 806 hotel and restaurant estab-
lishments in Switzerland. According to the survey of GastroSuisse members, 85 % were restaurants and
15 % were hotels. The hotel and catering industry generated a VAT-taxable annual turnover of around
CHF 28.4 billion. The hotel and restaurant industry makes a substantial contribution to VAT revenues.
In 2012, it paid the net sum of CHF 938.5 million in VAT. The approximately 28 806 restaurants and
hotels in 2013 liable for tax thus contributed 9.1 % of the overall Federal Tax Administration (FTA).
The most recent (2014) VAT statistics from the Swiss Federal Tax Administration (FTA) were not yet
available when this overview of the industry was printed. Therefore, this section is based on the 2013
figures. The latest statistics from the FTA are available online at www.estv.admin.ch.
source: Gastrosuisse, industry report 2016

30 hotel and restaurant industry
sales development compared to same Quarter of the previous year
RestaurantsAccommodationHotel and restauration industryin %
-12
-10
-8
-6
-4
-2
0
2
4
6
8
201520142013201220112010200920082007
source: survey KoF (economic research department of the swiss Federal institute of technology, Zurich) in cooperation with Gastrosuisse
hotel and restauration industry (accommodation and restaurant):
change in sales compared to the prior year
1st quarter – 5.7 % 3rd quarter – 3.4 %
2nd quarter – 3.5 % 4th quarter –2.7 %
source: survey KoF (economic research department of the swiss Federal institute of technology, Zurich) in cooperation with Gastrosuisse
In the first quarter of 2015, the hospitality industry had to accept a significant decrease in turnover due
to the abolition of the franc /euro exchange rate floor. Turnover in the second and third quarters was
also substantially lower than in the corresponding periods of the prior year. It was possible to curb this
downtrend to some extent in the final quarter.
accommodation:
change in sales compared to the prior year
1st quarter – 2.2 % 3rd quarter – 3.2 %
2nd quarter – 3.5 % 4th quarter – 4.9 %
source: survey KoF (economic research department of the swiss Federal institute of technology, Zurich) in cooperation with Gastrosuisse

31 hotel and restaurant industry
The accommodation sector experienced the first slight impact of the franc /euro exchange rate shock
in March 2015. Overnight stays plummeted at this time, reducing turnover by −2.2 % in the first quar-
ter. Poor snow conditions exacerbated the already difficult situation for the accommodation sector,
leading to significant loss of turnover in the final quarter of 2015. Fewer European visitors are taking
holidays in Switzerland because the franc is so expensive. By contrast, demand from Asian and Arab
visitors saw a sharp increase (+18.6 %).
restaurants:
change in sales compared to the prior year
1st quarter – 7.0 % 3rd quarter – 3.5 %
2nd quarter – 3.5 % 4th quarter –1.5 %
source: survey KoF (economic research department of the swiss Federal institute of technology, Zurich) in cooperation with Gastrosuisse
Catering outlets were hit very hard by the abolition of the franc /euro exchange rate floor in the first
quarter, and this sector posted a downturn of 7 %. Good summer weather provided support for the
sector in the second quarter. This slowed the pace of the downturn, resulting in a 1.5 % decrease in
the fourth quarter.
turnover per establishment
Annual turnover in CHF
Turnover per establishment in %
Hotel Restaurant
0 5 10 15 20 25
more than 5 000 000
2 000 001 to 5 000 000
1500 001 to 2 000 000
1100 001 to 1500 000
850 001 to 1100 000
550 001 to 850 000
350 001 to 550 000
250 001 to 350 000
150 001 to 250 000
up to 150 000
source: Gastrosuisse, industry report 2016

32 hotel and restaurant industry
In 2015, one entrepreneur in every three (33.2 %) generated annual turnover of up to CHF 350 000. This
represents a year-on-year increase of 0.6 percentage points. 17.5 % of hotel and catering businesses
posted turnover of between CHF 350 000 and CHF 550 000. 16.5 % earned between CHF 550 000 and
CHF 850 000. Almost one business in three achieved turnover in excess of CHF 850 000.
The type of business has a major influence on the level of annual turnover achieved. The lowest turn-
over categories (up to CHF 550 000) contain more restaurants (54.8 %) than hotels (28.4 %). Annual
turnover of between CHF 550 001 and CHF 1 100 000 was posted by 31.8 % of hotels and 25.3 % of res-
taurants. Turnover in excess of CHF 1.1 million was earned by almost twice as many hotels (39.8 %)
as restaurants (19.9 %).
an overview of important key ratios for the restaurant industry 2014
total turnover per operating day 2 177 chF
total turnover per employee 102 629 chF
total turnover per employee and operating day 387 chF
turnover per restaurant per seat 8 482 chF
turnover per restaurant per seat and operating day 32 chF
turnover from food preparation per seat 5 401 chF
turnover from food preparation per seat and operating day 20 chF
source: Gastrosuisse, industry report 2016
Turnover of CHF 2 177 was generated in an average restaurant on one business day in 2014. Each
employed person generated daily turnover of CHF 387 which, when extrapolated to the whole year,
represents turnover of CHF 102 629 per employed person. A restaurant generates turnover of CHF 32
per seat and business day, CHF 20 of which is accounted for by sales of items produced in the kitchen.
In 2014, the average total turnover of a hotel with restaurant was CHF 4 601 per business day.
For more information, check the publication from GastroSuisse ‘Branchenspiegel 2016’ (‘Industry
Report 2016’), available from GastroSuisse (phone: 0848 377 111) for CHF 35.

33 hotel and restaurant industry
business size: number of seats per region
0 5 10 15 20 25 30 35
201 and more seats
101 to 200 seats
76 to 100 seats
51 to 75 seats
26 to 50 seats
1 to 25 seats
Portion of businesses in %
Urban Tourist regionRural
source: Gastrosuisse, industry report 2016
turnover mix
In 2014, 64.1 % of the turnover of an average restaurant was generated by dishes ordered from the
kitchen. Second place was taken by alcoholic beverages, which remained stable with 20.4 % of turn-
over. Turnover from sales of mineral water, coffee and tea amounted to 15.5 %. The quota of total turn-
over generated by the kitchen rose again by 1 percentage point year-on-year.
source: Gastrosuisse, industry report 2016
0 5 10 15 20 25 30 35 40 45 50 55 60 65
Wine
Beer
Spirits
Mineral water
Kitchen
Coffee / Tea
in %

34
tourism infrastructuretransport
passenger transportation
nuMBer oF PassenGers Per carrier 1950 – 2014
0
1000
2000
3000
4000
5000
6000
7000
Private road transp. Public transp. road ¹ Public transp. railways
201420132012201120102009200820072006200520042003200019901980197019601950
in millions of travellers
nuMBer oF PassenGers Per carrier 2014 in % oF total transPorts
Private road transportation
Public transportation road
Public transportation railways
Ship travel / aerial cableways
6.7%
73.8%
16.9%
2.6%
1 From 2013 trams shall be mapped on Public transportation road.source: litra Public transport information service

35 tourisM inFrastructure
public transport
The public transport route network on railways, roads, lakes and rivers adds up to a total of 28 737
kilometres. 25 836 stopping points are served. In 2015, 2.33 million passengers made use of a half-
fare card, 460 000 persons held a general abonnement valid throughout the country and 1.3 million
persons obtained a combined season ticket in one of the 19 regional tariff networks.
one oF the densest railWay netWorKs in the World
The railroad network of Switzerland totals 5 304 kilometres. 3 033 kilometres are part of the Swiss
Federal Railways network. From Monday to Friday, the Swiss railways (SBB) operate around 6 260
passenger trains or 407 000 train kilometres on their route network. Around half of this consists of
long-distance services (Eurocity, Intercity and express trains), the other half of regional and subur-
ban railway services. In 2015, Swiss Federal Railways carried 442 million passengers. The average
journey distance mounted to 41 kilometres. In addition to Swiss Federal Railways, a further 39 railway
companies operate in the public transport sector, which are often referred to as private railways.
Finely tuned transPort netWorK With Buses, traMs and the PostBus
During the year 2014, 118 transport companies transported guests by tram, trolley bus and bus on a
20 733 kilometre-long network (figures include PostBus). Around 16 600 employees were necessary in
order to transport the approximately 1.5 billion passengers with buses and trams.
The 877 PostBus routes operate a network of approximately 12 000 kilometres. 2 287 PostBus Switzer-
land Ltd. employees, with an additional 1 628 drivers from PostBus operators, conveyed almost 145
million passengers with 2 238 Postbuses. The vehicles covered an overall distance of 112.7 million
kilometers.
sources: Public transport association, swiss railway network, PostBus switzerland ltd.

36 tourisM inFrastructure
navigation: active lake and river cruising in switzerland
In 2015 the 16 companies joined together in the Association of Swiss Navigation Companies (ASNC)
transported a total of 12.3 million passengers with 148 boats. This represents an increase of 300 000
passengers compared to the prior year.
Lake Lucerne, with 2.46 million passengers, lead the ranking based on the number of passengers,
followed by the Lake Geneva with 2.24 million passengers and the Lake Zurich Horgen–Meilen ferry
with 2.08 million passengers and Lake Zurich (incl. Limmat River) with 1.73 million passengers.
In distance travelled, the performance rised by 19 000 kilometres to 2.42 million kilometres. Inland
waterway transportation covers a network of approximately 1 545 kilometres.
source: litra Public transport information service
air traffic: over 49 million air passengers
In 2015, Switzerland’s airports recorded some 460 978 flight movements (take-offs and landings, only
schedule and charter flights), 1.35 % more than in 2014. Of the 49.47 million passengers taking off
from or landing in Switzerland, about 78 525 used Switzerland as a transit station.
FliGht MoVeMents and PassenGers
Airport
Movements
Local and transfer passengers
Transitpassengers
Totalpassengers
Zurich Kloten 231 095 26 251 507 42 810 26 294 317
Genève cointrin 146 440 156 82 128 12 475 15 694 603
Basel Mulhouse 67 814 7 028 970 23 143 7 052 113
Bern Belp 7 928 175 024 97 175 121
lugano agno 5 397 156 435 0 156 435
st. Gallen altenrhein 1 732 91 976 0 91 976
sion 572 6 660 0 6 660
total 460 978 49 392 700 78 525 49 471 225
sources: Federal office of civil aviation, swiss Federal statistical office
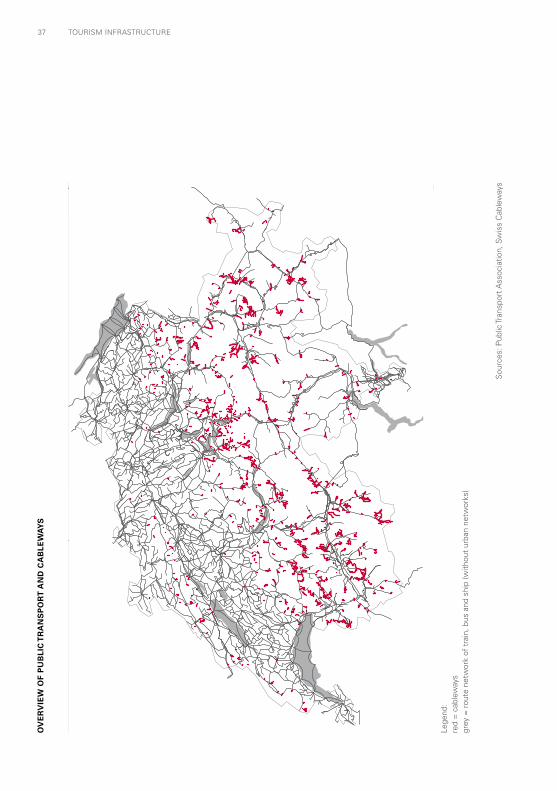
37 tourisM inFrastructure
sou
rces
: Pub
lic tr
ansp
ort a
ssoc
iatio
n, s
wis
s c
able
way
s
lege
nd:
red
= c
able
way
sgr
ey =
rou
te n
etw
ork
of t
rain
, bus
and
shi
p (w
ithou
t ur
ban
netw
orks
)
ov
er
vie
w o
f p
ub
lic
tr
an
sp
or
t a
nd
ca
ble
wa
ys

38 tourisM inFrastructure
The mountain regions within the Alps and their peripheral areas are largely dependent on the income
generated from tourism. The cableways occupy a key position in the tourism value creation chain.
They are often the driving force in tourist destinations.
– By the end of 2015, there were 2 450 licensed facilities in Switzerland. A third of these are T-bars.
Rope tows and conveyors account for another third and approximately 20 % are continuously oper-
ating lifts (chairlifts, gondolas, 3-rope gondolas and funitels).
– Throughout Switzerland, cableways hire almost 3 400 full-time employees and almost 6 800 sea-
sonal workers in transport operations alone.
– In its core business of passenger transport, Swiss cableways achieved in the 2014 /15 winter season
the sum of CHF 708 millions. Additional revenue of CHF 206 million was generated by the food
service industry and other activities (e.g. rentals).
– The areas where visitors and locals can take advantage of the Swiss cableways spread from the Alps
of canton Vaud to Eastern Switzerland and the Graubünden Alps. The cableways from Valais and
Graubünden together generate almost 60 % of all passenger transports’ incomes in Switzerland.
change in winter revenue in switzerland (in 1000)
0
200 000
400 000
600 000
800 000
1000 000
1200 000
OtherFood service industryPassenger transportation
2014/152013/142012/132011/122010/112009/102008/092007/082006/07
in CHF
source: swiss cableways (scW), Facts and numbers in favour of swiss cableways industry 2015; laurent Vanat, season balance 2014 /15
cableways: important in terms of regional economics

39 tourisM inFrastructure
evolution of skier-days
Development of the Skier-days (first entry per person and day during winter) depend primarily on the
currency, economy and weather factors influencing tourism. Clearly visible is also a notable reduc-
tion in the number of children and youths skiing or snowboarding.
eVolution oF sKier-days in sWitZerland (in 1000)
0
5 000
10 000
15 000
20 000
25 000
30 000
2014/152013/142012/132011/122010/112009/102008/092007/082006/072005/062004/05
source: swiss cableways (scW), Facts and numbers in favour of swiss cableways industry 2015; laurent Vanat, season balance 2014 /15
seasonal distribution of passenger transport income
The importance of the summer season for the cableway sector varies greatly from region to region.
Winter is the most important season in Graubünden with a quota of 92 %, whereas summer and winter
account for almost equal shares in Ticino. In Switzerland as a whole, the winter quota is 78 %. Valais
and Graubünden generate by far the largest income from passenger transport. In absolute figures, the
8 % summer quota in Graubünden (CHF 18.3 million) still represents significantly more income than
the 52 % summer quota in Ticino (CHF 6.3 million).
source: swiss cableways (scW), Facts and numbers in favour of swiss cableways industry 2015
0%
20%
40%
60%
80%
100%
SummerWinter
TicinoCentral Switzerland
JuraEastern Switzerland
Bernese OberlandFribourg / Vaud
ValaisGraubünden
CH-Average Winter

switzerlandmobility
SwitzerlandMobility is the national network of non-motorized traffic for leisure and tourism focusing
on the development and communication of the most attractive hiking, cycling, mountain biking,
skating, and canoeing routes in Switzerland. SwitzerlandMobility links these routes with public
transportation and a wide variety of services in the leisure and tourism industry. The supporting body
of the network is the SwitzerlandMobility Foundation.
switzerlandmobility route network
National routes Regional routes Local routes Number of kilometres
hiking 7 64 265 12 000
cycling 9 55 68 12 000
Mountain biking 3 16 180 8 000
skating 3 13 2 1 000
canoeing 1 8 23 350
total 23 156 538 33 350
status as of 31.12.2015
oVerVieW MaP oF national routes
HikingCyclingMountain bikingSkatingCanoeing
source: switzerlandMobility
40 tourisM inFrastructure

sales generated as a result of switzerlandmobility
Since SwitzerlandMobility was launched in the spring of 2008, the interest of the Swiss population
and foreign tourists has grown steadily: while the web portal schweizmobil.ch registered just over
1 million visits in 2008, the number jumped to over 8.5 million in 2015. In 2011 the LINK-Institute
found that about 2 million people, or 24 % of the Swiss population, are familiar with Switzerland-
Mobility.
Swiss users Foreign visitors
Turnover from Swiss users (in CHF)
Turnover from foreign users (in CHF)
Total turnover (in CHF)
hiking 920 000 101 000 270 million 30 million 300 million
cycling 750 000 75 000 290 million 65 million 355 million
Mountain biking 160 000 16 000 65 million 10 million 75 million
total 1 830 000 192 000 625 million 105 million 680 million
source: switzerlandMobility, surveys on usage in 2013
slow up
SwitzerlandMobility, jointly with Switzerland Tourism and Health Promotion Switzerland, is a sup-
porter of slowUp projects, car-free days of adventure in all regions of Switzerland.
GroWth in nuMBer oF sloW uP ParticiPants 2001 – 2015
0
100 000
200 000
300 000
400 000
500 000
201520142013201220112010200920082007200620052004200320022001
12
3
6
10
1214 14
1516
18 18 18
Number of slowUp-events
19 18
Participants:
– 50 % each women and men
– Average age: 39.6 years
– Expenditures per person: CHF 24.90
source: switzerlandMobility
41 tourisM inFrastructure

swiss hiking trails
Switzerland offers hikers an attractive and extensive network of hiking trails covering more than 65 000
kilometres – an offering unrivalled by any other country in the world. Swiss hiking trails are legally
protected and they feature signage compliant with official standards. The ‘Swiss Hiking Trail Federa-
tion’ is the umbrella organisation for the 26 cantonal hiking trail organisations. Together, they promote
hiking, support attractive hiking trail projects and represent hikers’ interests at the political level. The
umbrella federation also supports the cantonal organisations and their members, who number ap-
proximately 45 000; it is responsible for fund-raising at national level, and it publishes the WANDERN.
CH magazine. On its services website, the Swiss Hiking Trail Federation posts a vast range of fascinat-
ing background reports, tips and hints on hiking, and a database containing over 500 suggestions for
hiking throughout Switzerland: www.wandern.ch.
network of hiking trails per region
Region 1Total networkof walks (km)
Paved walks (km)
Mountain walks (km)
eastern switzerland 19 508 4 101 11 169
schweizer Mittelland 15 273 4 660 2 640
lake Geneva region 12 279 2 761 3 425
central switzerland 8 247 2 172 3 068
ticino 4 352 612 3 405
Zurich 3 037 1 031 12
north-West switzerland 2 762 961 7
total 65 458 16 298 23 726
1 official Fso main regions of switzerlandsource: swiss hiking
facts from the recent study on hiker behaviour in switzerland (2014)
– Hiking is the most popular leisure and sporting activity in Switzerland: almost half of the popula-
tion aged 15 to 74 state that they are active hikers / mountain hikers. This figure translates into 2.7
million Swiss hikers in addition to 300,000 tourists from abroad.
– The popularity of hiking has continued to increase in recent years: Switzerland has 7 % more hikers
today than in 2008.
– On average, each hiker takes 20 hikes of various lengths per year, with an average hiking time
of three hours. Spread over a full year, this results in about 60 hours of hiking for a typical hiker.
Three quarters of hikers also hike during the winter months.
42 tourisM inFrastructure

– The average spend per person and day during a hike in Switzerland is CHF 45 or CHF 860 per year.
Therefore, revenue generated by hikers amounts to approximately CHF 2.8 billion, broken down as
follows: travel to and from the destination (approx. CHF 750 million), public transportation used
along the way (approx. CHF 160 million), meals (approx. CHF 950 million), overnight accommoda-
tion (approx. CHF 420 million), equipment (approx. CHF 490 million), and miscellaneous (approx.
CHF 40 million).
– Hikers are by no means the only users of hiking trails: overall, about 80 % of the Swiss population
make use of signed hiking trails.
– Signposts and trail markers are the most important forms of navigation support along the way.
importance of various reasons for hiking
0% 20% 40% 60% 80% 100%
not importantless importantimportantvery important
Compete with othersTrain for a competition/event
Test one’s limitsPursue personal performance goals
Look betterMeet other people
Create memorable experiencesEnjoy time with friends
RelaxUnwind
Stay fit and in shapeHave fun
Enjoy being activeSpend time outdoors
Promote health
source: ‘sport schweiz 2014’ study, number of respondents: 10 652, of which 3665 hikers (recognized athletes only)
hikers are satisfied with the offer
Of particular importance to hikers are the attractive scenery along the trails, the experience of nature
and the opportunity to unwind while hiking. In terms of infrastructure, end-to-end trail signage (in-
cluding information on hiking times at regular intervals), unpaved (natural) paths, and varied, well
maintained trails are rated as very important by hikers. More than 60 % also consider restaurants, inns
and public transportation to the trails to be important or very important. Most hikers are very satisfied
with the above-mentioned aspects.
source: swiss hiking
43 tourisM inFrastructure

swiss parks
The park environment in Switzerland has taken shape. Following the dynamic developments of the
past eight years, the latest map (updated January 2016) includes 20 parks and park projects, represent-
ing more than 15 % of the area of Switzerland in 13 different cantons.
The Swiss National Park in the Engadine is the best-known park in the country. It was established over
100 years ago as the first national park in the Alpine region, and it has its own legal basis. Two other
national park projects are seeking to obtain the national label: Parc Adula (Graubünden / Ticino) and
Parco Nazionale del Locarnese (Ticino).
In addition to the national parks, Switzerland has 14 regional nature parks and one nature discovery
park, all nationally recognised according to the Federal Act on the Protection of Nature and Cultural
Heritage (NCHA) of 2007. One other nature park is in the development phase (candidate): the Schaff-
hausen Regional Nature Park (Canton of Schaffhausen), and work is in progress on a new nature dis-
covery park in the Jorat region (Vaud). The perimeters of the candidates have not yet been finalised.
The local population will decide in the next few years whether their municipalities will definitely par-
ticipate in the parks.
Swiss park policy has been a success story. Regional nature parks have sprung up in all areas of the
country. They have become pillars of long-term regional growth, creating added value for the nature
and the countryside, for society and the regional economy – with tourism and regional products as
the main economic beneficiaries. The national and nature discovery parks focus on conservation of
nature and the countryside, with particular emphasis on natural processes (core zones). By providing
the basis for experiences of nature, these parks also attract tourism.
In 2016, the Swiss Parks won the Tourism For Tomorrow Award, an international prize for sustainable
tourism. Thanks to its parks, Switzerland was thus honoured as one of the world’s most sustainable
destinations.
Studies on value added by tourism in the UNESCO Biosphere Entlebuch (Knaus F., 2012) and the Bio-
phere Reserve ‘Val Müstair Parc Naziunal’ (Backhaus N., 2013) have shown that 16 % of visitors make
their journeys because of the Biosphere Entlebuch, while as many as 36 % travel on account of the
Swiss National Park. They generate total added value of CHF 6 million for the Entlebuch region and
CHF 20 million for the Swiss National Park region, corresponding to six times the amount of the public
funds invested (at federal, cantonal and municipal levels).
source: swiss Parks network
44 tourisM inFrastructure
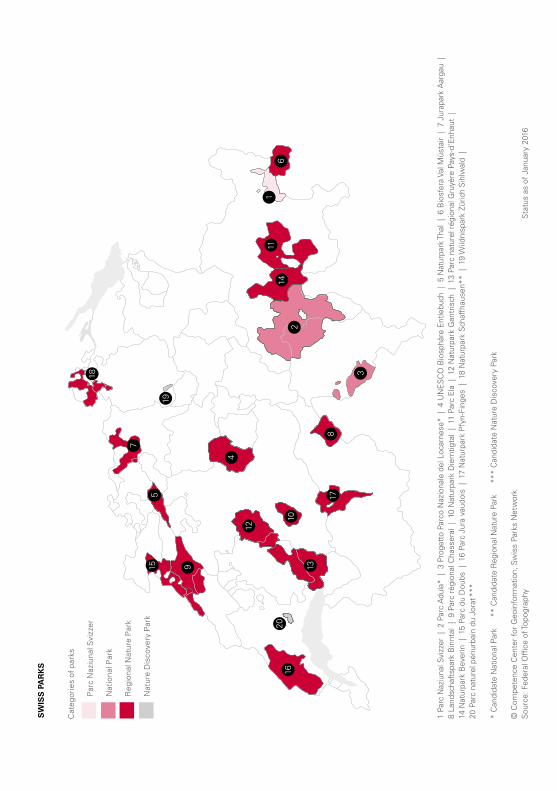
sw
iss
pa
rk
s
4
2
3
8
19
16
1114
18
7
5 17
10
12
13915
1620
Cat
egor
ies
of p
arks
Par
c N
aziu
nal S
vizz
er
Nat
iona
l Par
k
Reg
iona
l Nat
ure
Par
k
Nat
ure
Dis
cove
ry P
ark
© c
ompe
tenc
e c
ente
r fo
r G
eoin
form
atio
n, s
wis
s Pa
rks
net
wor
ks
ourc
e: F
eder
al o
ffice
of t
opog
raph
y
1 Pa
rc n
aziu
nal s
vizz
er |
2 P
arc
adu
la*
| 3
Pro
gett
o Pa
rco
naz
iona
le d
el l
ocar
nese
* |
4 u
ne
sc
o B
iosp
häre
ent
lebu
ch |
5 n
atur
park
tha
l |
6 B
iosf
era
Val M
üsta
ir |
7 J
urap
ark
aar
gau
|
8 la
ndsc
haft
spar
k B
innt
al |
9 P
arc
régi
onal
cha
sser
al |
10
nat
urpa
rk d
iem
tigta
l |
11 P
arc
ela
| 1
2 n
atur
park
Gan
tris
ch |
13
Parc
nat
urel
rég
iona
l Gru
yère
Pay
s-d‘
enh
aut
|
14 n
atur
park
Bev
erin
| 1
5 Pa
rc d
u d
oubs
| 1
6 Pa
rc J
ura
vaud
ois
| 1
7 n
atur
park
Pfy
n-Fi
nges
| 1
8 n
atur
park
sch
affh
ause
n**
| 1
9 W
ildni
spar
k Zü
rich
sih
lwal
d |
20
Par
c na
ture
l pér
iurb
ain
du J
orat
***
* c
andi
date
nat
iona
l Par
k
**
can
dida
te r
egio
nal n
atur
e Pa
rk
***
can
dida
te n
atur
e d
isco
very
Par
k
sta
tus
as o
f Ja
nuar
y 20
16

46 tourisM inFrastructure
swiss ski schools
In 152 Swiss ski schools, approximately 4 000 ski, snowboard, telemark and nordic instructors are
engaged. During the high season, as many as 7 000 teach in these schools that offer skiing, snow-
board, nordic and telemark lessons for both children and adults. On request, there are also a number
of other sportive and comprehensive activities available to guests.
change in the number of lessons sold by swiss ski schools 1
1 status as of 30.06.2015source: sWiss snoWsPorts
Because of a system change in data entries, Swiss Snowsports is currently unable to provide accu-
rate figures for the season 2015/2016. Up-to-date figures for the season 2015/2016 will be available
at www.snowsports.ch as of August 2016. These will additionally be published in the annual report.
3 000 000
3 500 000
4 000 000
4 500 000
5 000 000
2014/152013/142012/132011/122010/112009/102008/092007/082006/072005/06
Sold lessons

47
formal educationbasic vocational education and training
advanced federal certificate (afc)
Hotel and restaurant
Certificates of qualification issued 2015 2014
Apprentices hired 2015 2014
hotel- und Gastrofachmann / -frau 18 24 18 22
hotelfachmann/-frau eFZ 306 323 328 348
Koch/Köchin eFZ 1 537 1 567 1 750 1 772
restaurationsfachmann/-frau eFZ 603 594 589 579
systemgastronomiefachmann/-frau eFZ – – 58 –
Transport services
Matrose/Matrosin der Binnenschifffahrt eFZ 13 9 13 15
seilbahn-Mechatroniker/-in eFZ 28 21 30 31
Fachmann/-frau öffentlicher Verkehr eFZ – – 34 –
Economy and administration
Kaufmann/-frau B eFZ
hotel-Gastro-tourismus 46 21 10 7
Öffentlicher Verkehr 23 18 3 0
reisebüro 8 9 3 7
transport 12 10 11 4
Kaufmann/-frau e eFZ
hotel-Gastro-tourismus 201 196 165 149
Öffentlicher Verkehr 291 261 342 336
reisebüro 174 171 149 171
transport 24 26 35 29
basic federal certificate (bfc)
Hotel and restaurant
hotellerieangestellte/-r eBa 30 37 25 25
Küchenangestellte/-r eBa 289 272 340 367
restaurationsangestellte/-r eBa 104 106 128 124
seilbahner/-in eBa 8 3 6 5
source: swiss Federal statistical office

48 ForMal education
higher vocational education and training: final exams
federal certificates Men2015
Women Total2014Total
2013Total
Bereichsleiter/-in hotellerie-hauswirtschaft 6 66 72 81 74
Bereichsleiter/-in restauration 4 27 31 30 30
Bergführer/-in 22 1 23 20 25
cabin crew Member 9 38 47 60 47
chef de réception 0 0 0 13 14
chefkoch / chefköchin 89 22 111 132 98
Fachmann/-frau im Pisten und rettungsdienst 24 1 25 0 2
Gastro-Betriebsleiter/-in 49 28 77 68 62
schneesportlehrer/-in 92 22 114 133 121
seilbahnfachmann/-frau 12 0 12 41 –
tourismus-assistent/-in 6 38 44 34 47
Wanderleiter/-in 2 3 5 46 22
federal diplomas
Manager/-in öffentlicher Verkehr 0 0 0 17 15
Gastro-unternehmer/-in 12 5 17 12 13
Küchenchef/-in 4 0 4 31 6
leiter/-in Gemeinschaftsgastronomie 1 0 1 7 –
leiter/-in hotellerie – hauswirtschaft 0 0 0 3 –
restaurationsleiter/-in 0 0 0 4 1
Manager/-in Gesundheitstourismus und Bewegung 1 0 1 10 –
seilbahnmanager/-in 3 0 3 – –
diploma of colleges
hauswirtschaftliche Betriebsleitung 2 31 33 23 31
hotellerie + Gastronomie 172 245 417 462 436
tourismus 39 134 173 206 220
diploma of universities of applied services 1 Men2014
Women Total2013Total
2012 Total
hotel sector – certificates issued 216 288 504 450 383
tourism sector (since 2008 Bachelor) – certificates issued 31 133 164 200 173
1 the figures for 2015 from the universities of applied services were not available at the time of printing.source: swiss Federal statistical office

49
internationaltourist arrivals
International tourist arrivals grew by 4.4% in 2015 to reach a total of 1,184 million in 2015, according
to the latest UNWTO World Tourism Barometer. Some 50 million more tourists (overnight visitors)
travelled to international destinations around the world last year as compared to 2014.
By region, Europe, the Americas and Asia and the Pacific all recorded around 5% growth in 2015. Ar-
rivals to the Middle East increased by 3% while in Africa, limited data available, points to an estimated
3% decrease, mostly due to weak results in North Africa, which accounts for over one third of arrivals
in the region.
International arrivals in million2015 1 2014
Change in %2015 1/14 2014 /13
europe 609.1 580.3 5.0 2.4
northern europe 75.3 70.8 6.3 5.3
Western europe 180.9 174.5 3.7 2.2
central / eastern europe 127.8 120.1 6.4 -6.0
southern / Mediter. europe 225.1 214.9 4.8 6.9
asia and pacific 277.0 264.4 4.8 5.8
north-east asia 142.3 136.3 4.4 7.3
south-east asia 102.2 97.3 5.1 3.0
oceania 14.2 13.2 7.3 6.0
south asia 18.3 17.6 4.2 10.1
americas 190.7 181.7 4.9 8.4
north america 126.2 120.9 4.4 9.7
caribbean 23.8 22.2 7.4 5.0
central america 10.3 9.6 7.1 5.6
south america 30.3 29.1 4.3 7.1
africa 53.1 54.9 −3.3 0.3
north africa 18.8 20.4 −7.8 −1.4
subsaharan africa 34.2 34.4 −0.6 1.4
middle east 54.1 52.4 3.1 6.7
world 1 184.0 1 134.0 4.4 4.2
1 estimatesource: World tourism organization (unWto)

50 international
Rank Country of destinationInternational arrivals in million
2014 2013Change in %
2014 1/13 2013/12
1 France 83.8 83.6 0.2 2.0
2 united states 75.0 70.0 7.2 5.0
3 spain 65.0 60.7 7.1 5.6
4 china 55.6 55.7 −0.1 −3.5
5 italy 48.6 47.7 1.8 2.9
6 turkey 39.8 37.8 5.3 5.9
7 Germany 33.0 31.5 4.6 3.7
8 united Kingdom 32.6 31.1 5.0 6.1
9 russia 29.8 28.4 5.3 10.2
10 Mexico 29.3 24.2 21.5 3.2
37 switzerland 9.2 9.0 2.1 4.7
Rank Country of destination
International tourism receipts in billion US-$
2014 2013
Change in %based on local currency
2014 1/13 2013/12
1 united states 177.2 172.9 2.5 7.0
2 spain 65.1 62.6 3.9 4.2
3 France 57.4 56.6 1.5 2.0
4 china 56.9 51.7 10.2 3.3
5 Macao (china) 50.8 51.8 −1.9 18.1
6 united Kingdom 46.6 41.8 6.1 15.2
7 italy 45.5 43.9 3.7 3.1
8 Germany 43.3 41.3 4.9 4.7
9 thailand 38.4 41.8 −2.7 22.1
10 hong Kong (china) 38.4 38.9 −1.5 17.7
21 switzerland 17.4 16.8 2.7 3.0
1 estimatesource: World tourism organization (unWto)
top destinations

51
Quality promotionQuality programme of swiss tourism
The Quality Programme enables businesses engaged in the tourism sector to examine,
secure and specifically optimise the quality of services. The three-level programme is
supported by eleven industry organisations.
Quality labels awarded
0
100
200
300
400
500
600
201520142013201220112010
Level IIILevel IILevel I Total
Since 1998 a total of 11 615 individuals have been trained and 8 149 quality labels have
been awarded. As compared to 2014, Valais marks the largest increase in current Q-
labels (+5.9 %). With a plus of 5 % the tourism organisations show the biggest increase
within Switzerland.
labels per industry
Industry Labels in % Industry Labels in %
hotel industry 184 38.10 supplementary accommodation 47 9.73
Gastronomy 77 15.94 snow schools 24 4.97
tourism organisations 61 12.63 other 90 18.63
total 483 100.00
labels per region
source: swiss tourism Federation, status as of 31.12.2015
0 – 2021– 5051– 75
76 – 100
67
18
61
34
48
88 45
30
12
3
1219
7
6
13
2
2
10

52 quality ProMotion
Since 1996 Swiss holiday destinations addressing their services to the needs and wishes
of families can apply for the Family Destination quality label. In 2015, 21 destiations
were bearing the label.
Since 2008 the Swiss Tourism Federation has been awarding a Wellness Destination
quality label to Swiss holiday destinations specialising in wellness services. In 2015 this
quality label was awarded to 9 destinations.
destinations carrying the label
FaMily destination 2013 – 2015
Bernese oberland 1 diemtigtal 2 lenk simmental 3 haslital with hasliberg and Meiringen
Valais 4 nendaz 5 leukerbad 6 Zermatt-Matterhorn 7 aletsch arena with riederalp, Bettmeralp, eggishorn 8 saas-Fee / saastal 9 Bellwald 10 Grächen
lucerne / lake lucerne 11 engelberg-titlis 12 unesco Biosphere entlebuch
eastern switzerland / liechtenstein
13 toggenburg 14 Braunwald-Klausenpass 15 triesenberg Malbun steg
Graubünden 16 Flims, laax, Falera mit trin und sagogn 17 arosa 18 davos Klosters19 savognin 20 lenzerheide
ticino 21 ascona – locarno
Wellness destination 2015 – 2017
Fribourg region a charmey Zurich region F city of Baden
Bernese oberland B Gstaad saanenland lucerne / lake lucerne G Weggis Vitznau rigi
Valais c leukerbad ticino h ascona – locarno
aargau region d rheinfelden Graubünden i engadin scuol
e Bad Zurzach
source: swiss tourism Federation
family destination / wellness destination
4
2
20
17
13
3
5 9
8
7
1418
19
21
1
6
1112
15
16
10
G
F
I
A
B
C
E
H
D
Wellness Destination
Family Destination

53 quality ProMotion
classification of holiday apartmentsand guest rooms
The Swiss Tourism Federation classifications are aimed at providing an idea about the
quality and services of holiday apartments and guest rooms in Switzerland. This results in
a high level of transparency and therefore comparability between the different providers.
awarded certificates 2015
11 213
1465
6983
619
12
909199
3188
1223
122
34
4
525
0 – 100 101 – 10001001 – 3000
3001 – 12 000
4
a detailed overview of the regional distribution is found on page 23 of this brochure.source: swiss tourism Federation
other labels
ibex fairstay
‘ibex fairstay’ is a Swiss national certification label for sustainable lodging operations in
the areas of ecology, social awareness, regionalism, economic efficiency and manage-
ment, and granted at the bronze, silver, gold or platinum level. The better the perfor-
mance, the higher the level of distinction. ‘ibex basic’ is a new simplified, professionally
supported test module for sustainable management designed for newcomers and smaller
operations. The Quality Programme of Swiss Tourism can be achieved or renewed simul-
taneously at all levels with ‘ibex basic’ or ‘ibex fairstay’.
Year 2015 2014 2013 2012 2011
certified companies 57 55 53 59 61
source: ibex fairstay

54 quality ProMotion
safety in adventures
The Safety in Adventures foundation has defined objectives to set a standard for outdoor
and adventure activities. Commercial Providers develop and implement their own safety
concept according to the management system of Safety in Adventures. This forms the
basis for the certification and the awarding of the label by an independent body. Since
2014 certification is legally required for bungee, canyoning and rafting.
Year 2015 2014 2013 2012 2011
certified companies 45 41 44 46 46
source: safety in adventures
eu environmental label for lodging establishments
The EU environmental label for lodging establishments is the only environmental cer-
tificate for hotel and non-hotel lodging operations recognized throughout Europe. It
communicates to the guests that the management is concerned with issues of ecology.
Compliance with the required criteria is ensured by on-site inspections.
The purpose of the label is to encourage lodging establishments to consider the ecol-
ogy in their operations. In the medium- to long-term, the certified establishments are
expected to decrease energy usage, reduce water consumption, lessen the amount of
waste, increasingly use regional products and foster the environmental awareness of
both staff and guests.
Year 2015 2014 2013 2012 2011
certified companies 49 56 56 52 45
source: saladino umweltprojekte
55
tourism associations and institutions
Tourism interest groups and professional associations
agritourism switzerland
Brunnmattstrasse 21, 3007 Bern, phone +41 (0)31 359 50 30, www.agrotourismus.ch, [email protected].
umbrella organisation for the marketing and coordination of agritourist services in switzerland with over 400 members.
association of postgraduate hoteliers-restaurateurs shv/hotelmanager hf-nds
secretariat, P.o. Box 42, 8880 Walenstadt, phone +41 (0)79 833 81 75, www.vdh.ch, [email protected].
networking, further education and friendship care for students of the postdiploma course ‘unternehmensführung resp.
nachdiplomstudium hF-nds’ of hotelleriesuisse.
association of swiss tourism managers (astm)
c/o Fst, P.o. Box, 3001 Bern, phone +41 (0)31 307 47 43, fax +41 (0)31 307 47 48, www.vstm.ch, [email protected].
representation of the professional interests of tourist office managers. Professional development, advisory service, lobbying.
association of the swiss navigation companies
Mythenquai 333, 8038 Zurich, phone +41 (0)43 243 16 57, fax +41 (0)43 243 16 58, www.vssu.ch, [email protected].
safeguarding the interests of the 16 member shipping companies.
bed and breakfast switzerland
sonnenweg 3, 4144 arlesheim, phone +41 (0)61 703 00 83, fax +41 (0)61 703 96 76, www.bnb.ch, [email protected].
organisation of swiss BnB host families. information, promotion (internet / app), quality assurance, official institution for the
classification of all swiss BnBs.
community of interest of the higher schools of tourism management switzerland
c/o internationale schule für touristik aG (ist), Josefstrasse 59, 8005 Zürich, phone +41 (0)44 440 30 90, fax +41 (0)44 271 71 17,
www.ist-zurich.ch, [email protected]. safeguarding common interests towards the public authorities, associations and the general
public, promotion of tourism management education and training in switzerland.
contact groups.ch – hotels and holiday homes for groups
spitzackerstrasse 19, 4410 liestal, phone +41 (0)61 926 60 00, fax +41 (0)61 911 88 88, www.groups.ch,
www.seminar-groups.ch, [email protected]. organisation of the hotels and holiday homes for groups in switzerland.
services: rental agency (commission-free), worldwide marketing, consultation and settlement services, quality management,
travel insurance specifically for groups, booking software www.groupsoffice.com.
gastrosuisse
Blumenfeldstrasse 20, P.o. Box, 8046 Zurich, phone +41 (0)848 377 111, fax +41 (0)848 377 112, www.gastrosuisse.ch,
[email protected]. Gastrosuisse is the association for hotels and restaurants in switzerland. around 20 000 members organised in
26 cantonal sections and 4 specialist groups belong to switzerland’s largest employers’ association in the hospitality industry.
hotelleriesuisse
Monbijoustrasse 130, P.o. Box, 3001 Bern, phone +41 (0)31 370 41 11, fax +41 (0)31 370 44 44, www.hotelleriesuisse.ch,
[email protected]. hotelleriesuisse is the centre of excellence for the swiss hotel industry and the trade association
which represents the interests of the nationally and internationally oriented hotel establishments. the association is a member of the
european hotelstars union.
hotel & gastro union
adligenswilerstrasse 29/22, P.o. Box 4870, 6002 lucerne, phone +41 (0)41 418 22 22, fax +41 (0)41 412 03 72,
www.hotelgastrounion.ch, [email protected]. union of employees, professionals and management staff of the
hotel / restaurant trade of bakers and confectioners.

56 tourisM associations and institutions
interhome ag
sägereistrasse 27, 8152 Glattbrugg, phone +41 (0)43 810 91 91, www.interhome.ch/en, [email protected].
rental specialist for individual holiday houses and apartments in the most popular regions in switzerland and internationally.
interhome’s services include the management of the properties as well as the handling of the complete booking process and
fulfillment while ensuring high quality standards.
parahotellerie switzerland
schaffhauserstrasse 14, P.o. Box, 8042 Zurich, phone +41 (0)44 360 14 31, fax +41 (0)44 360 14 25, [email protected].
representation of the interests of quality-conscious swiss non-hotel establishments regarding tourism policy matters and the
promotion of meaningful partnerships and activities. Members ensure direct quality definition / quality control and operate their own
online reservation platforms. the current members are Bed and Breakfast switzerland, interhome aG, swiss travel Fund (reka),
swiss youth hostels and tcs camping.
snow sport initiative switzerland
Finkenhubelweg 11, P.o. Box, 3001 Bern, phone +41 (0)31 307 47 52, www.gosnow.ch, [email protected]. association for the
promotion of snow sports for children and adolescents at the national level through organised low-cost arrangements for schools.
swiss association of public transport
dählhölzliweg 12, 3000 Bern 6, phone +41 (0)31 359 23 23, fax +41 (0)31 359 23 10, www.voev.ch, [email protected].
Protection of interests. Promotion of collaboration amongst the members. information and consultation activities. Professional
formation and further education.
swiss cableways
dählhölzliweg 12, 3000 Bern 6, phone +41 (0)31 359 23 33, fax +41 (0)31 359 23 10, www.seilbahnen.org, [email protected].
representation of the common interests of the cableways vis-à-vis the authorities and the government, information of the media and
the public regarding industry concerns, fundamental training, continuing education and training offered to employees at all levels,
consultation for members regarding legal, financial, operational, technical, and administrative issues, periodic surveys regarding the
industry’s financial position.
swisscamps – swiss camping association
Bahnhofstrasse 5, 3322 schönbühl, phone +41 (0)31 852 06 26, fax +41 (0)31 852 06 27, www.swisscamps.ch, [email protected].
Promotion of camping vacations and classification of camp sites.
swiss centre for mountain regions (sab)
seilerstrasse 4, P.o. Box 7836, 3001 Bern, phone +41 (0)31 382 10 10, www.sab.ch, [email protected]. created in 1943. lobbying for
mountain regions and advisory services for projects in regional development.
swiss hiking trail federation
Monbijoustrasse 61, P.o. Box, 3000 Bern, phone +41 (0)31 370 10 20, fax +41 (0)31 370 10 21, www.wandern.ch, [email protected].
umbrella organisation of 26 cantonal hiking associations. Promotes hiking trails and hiking in switzerland.
swiss hostels
alpenstrasse 16, 3800 interlaken, phone +41 (0)33 823 46 46, fax +41 (0)33 823 46 47, www.swisshostels.com, [email protected].
industry organisation for independent hostels in switzerland. Joint marketing, joint purchase, network and exchange, and strengthen
the position of swiss hostels in the swiss accommodation industry.

57 tourisM associations and institutions
swiss parks network
Monbijoustrasse 61, 3007 Bern, phone +41 (0)31 381 10 71, [email protected], www.paerke.ch/en.
the network is the umbrella organisation of all swiss parks which administers the interests of its members and assists them in
establishing and operating the parks, as well as in ensuring their quality in the long-term. the 20 parks characterize themselves by
their natural and cultural landscapes. they are engaged to protect and to valorize them.
swiss snowsports
hühnerhubelstrasse 95, 3123 Belp, phone +41 (0)31 810 41 11, fax +41 (0)31 810 41 12, www.snowsports.ch, www.schweizer-
skischule.ch, [email protected], [email protected]. alliance of tourism sector institutions interested in joint promotion of
the swiss ski school system. education of ski, snowboard, telemark and cross-country teachers.
swiss tourism federation (stf)
Finkenhubelweg 11, P.o. Box, 3001 Bern, phone +41 (0)31 307 47 47, fax +41 (0)31 307 47 48, www.swisstourfed.ch,
[email protected]. to safeguard the interests of those responsible for tourism in switzerland and to participate in all tourism policy
decisions; to provide information about the importance of tourism and to contribute to tourism research.
swiss travel savings fund (reka) cooperative
neuengasse 15, 3001 Bern, phone +41 (0)31 329 66 33, fax +41 (0)31 329 66 01, www.reka.ch, [email protected].
an organisation that promotes social tourism and the promotion of holidays, travel and leisure-time activities, particularly in
switzerland. it‘s core business is the issuance of payment instruments and the provision of holiday offerings.
swiss youth hostels (syh)
schaffhauserstrasse 14, P.o. Box, 8042 Zurich, phone +41 (0)44 360 14 14, fax +41 (0)44 360 14 60, www.youthhostel.ch,
[email protected]. Promotion of youth and family travel, accommodation for young travellers, youth groups, schools, families etc.
switzerlandmobility
spitalgasse 34, 3011 Bern, phone +41 (0)31 318 01 28, fax +41 (0)31 318 01 29, www.switzerlandmobility.ch,
[email protected]. quality assurance, information, development of national, regional and local offers for hiking, cycling,
mountain biking, skating and canoeing.
thermal spas and health hotels switzerland
Bahnhofstrasse 2, 9100 herisau, phone +41 (0)71 350 14 14, fax +41 (0)71 350 14 18, www.kuren.ch, [email protected].
representing the interests of thermal spas, convalescent homes, clinics of rehabilitation and health hotels.
touring club switzerland (tcs)
ch. de Blandonnet 4, 1214 Vernier, phone +41 (0)58 827 27 27, fax +41 (0)58 527 50 05, www.tcs.ch.
assistance to persons in case of emergency all around the world, emergency road service in europe, tourist service, to safeguard the
interests of the motorists, legal counseling and support.
Public corporations
swiss association for hotel credit (sgh)
uetlibergstrasse 134b, P.o. Box, 8027 Zurich, phone +41 (0)44 209 16 16, fax +41 (0)44 209 16 17, www.sgh.ch, [email protected].
Financing, appraisals, consulting.
switzerland tourism (st)
tödistrasse 7, 8027 Zurich, phone +41 (0)44 288 11 11, fax +41 (0)44 288 12 05, www.Myswitzerland.com, [email protected].
offices in 26 countries. increase the demand for switzerland as a travel, holiday and congress destination.

58 tourisM associations and institutions
Federal institutes
state secretariat for economic affairs seco
tourism policy, holzikofenweg 36, 3003 Bern, phone +41 (0)58 462 27 58, fax +41 (0)58 463 12 12, www.seco.admin.ch.
central federal authority for national and international tourism policies.
swiss federal statistical office (fso)
tourism section, espace de l‘europe 10, 2010 neuchâtel, phone +41 (0)58 467 24 40, fax +41 (0)58 463 62 15,
www.tourismus.bfs.admin.ch, [email protected]. to provide statistics on swiss tourism (surveys on infrastructure,
arrivals and overnight stays in hotels, camping places and youth hostels, tourism balance of payments, tourism satellite account
and travel behavior).
Institutes of higher education
institute of systemic management and public governance at the university of st. gall (imp-hsg)
dufourstrasse 40a, 9000 st. Gall, phone +41 (0)71 224 25 25, fax +41 (0)71 224 25 36, www.imp.unisg.ch.
university lecturing, research, market research, consulting and expertising in the competence fields of tourism and transportation,
regional science, public management and integrative management.
institute of tourism itw (lucerne university of applied sciences and arts)
rösslimatte 48, P.o. Box 2940, 6002 lucerne, phone +41 (0)41 228 41 45, fax +41 (0)41 228 41 44, www.hslu.ch/itw, [email protected].
study programmes and further education, applied research and consultation in the fields of destination management, sports & events,
wellness and health, sustainability, e-tourism, leisure and tourism-related traffic and public transportation.
institute for tourism (ito), hes-so valais (university of applied sciences and arts western switzerland)
technoPôle 3, 3960 sierre, phone +41 (0)27 606 90 01, fax +41 (0)27 606 90 00, www.hevs.ch, [email protected].
Bsc study programmes and further education, applied research and consulting especially in etourism, monitoring and management
tools in tourism, destination management, sustainable tourism, market research as well as feasibility and impact studies.
institute for tourism and leisure (itf) at the university of applied sciences htw chur
comercialstrasse 22, 7000 chur, phone +41 (0)81 286 39 16, fax +41 (0)81 286 39 49, www.itf.ch, [email protected].
Bsc and Msc study programmes and further education (cas, das, Mas, eMBa) in tourism and leisure management.
applied research and consultancy, taking into account sustainable development in the areas of destination management and
development, tourist infrastructure and e-tourism.
research unit tourism (cred-t) in the center for regional economic development, university of bern
schanzeneckstrasse 1, P.o. Box, 3001 Bern, phone +41 (0)31 631 37 11, www.cred-t.unibe.ch, [email protected].
teaching, research and services, in particular concerning regional-economics, impact research, sustainable development in tourism,
quality of services and experience economy in tourism, macroeconomic questions.

59 tourisM associations and institutions
International Tourism Organisations
european travel commission (etc)
rue du Marché aux herbes 61, 1000 Brussels, Belgium, phone +32 2 502 01 13, fax +32 2 514 18 43, www.etc-corporate.org,
eurostat
Joseph Bech Building, 5, rue alphonse Weicker, 2721 luxembourg, phone +35 2 4301 33444, fax +35 2 4301 35349,
www.ec.europa.eu/eurostat, [email protected].
hotels, restaurants & cafés in europe (hotrec)
111, Boulevard anspach, P.o. Box 4, 1000 Brussels, Belgium, phone +32 2 548 90 00, fax +32 2 502 41 73, www.hotrec.eu,
world tourism organization (unwto)
capitán haya 42, 28020 Madrid, spain, phone +34 91 567 81 00, fax +34 91 571 37 33, www.unwto.org, [email protected].

Fsc-label