TOURISM, CONSERVATION & SUSTAINABLE DEVELOPMENT … · 3 Executive Summary Purpose The comparative...
98
TOURISM, CONSERVATION & SUSTAINABLE DEVELOPMENT VOLUME I COMPARATIVE REPORT Final Report to the Department for International Development Principal Authors: Goodwin, H.J., Kent, I.J., Parker, K.T., & Walpole, M.J. Project Managers: Goodwin, H.J.(Project Director), Swingland, I.R., Sinclair, M.T.(to August 1995), Parker, K.T.(from August 1995) Durrell Institute of Conservation and Ecology (DICE), Institute of Mathematics and Statistics (IMS), University Of Kent April 1997 This is one of four final reports produced at the end of a three year, Department for International Development funded project. Three case study reports (Vols II-IV) present the research findings from the individual research sites (Keoladeo NP, India, Komodo
Transcript of TOURISM, CONSERVATION & SUSTAINABLE DEVELOPMENT … · 3 Executive Summary Purpose The comparative...

TOURISM, CONSERVATION & SUSTAINABLEDEVELOPMENT
VOLUME I
COMPARATIVE REPORT
Final Report to the Department for International Development
Principal Authors:Goodwin, H.J., Kent, I.J., Parker, K.T., & Walpole, M.J.
Project Managers:Goodwin, H.J.(Project Director), Swingland, I.R.,
Sinclair, M.T.(to August 1995), Parker, K.T.(from August 1995)
Durrell Institute of Conservation and Ecology (DICE),Institute of Mathematics and Statistics (IMS),
University Of Kent
April 1997
This is one of four final reports produced at the end of a three year, Department forInternational Development funded project. Three case study reports (Vols II-IV) presentthe research findings from the individual research sites (Keoladeo NP, India, Komodo

2
NP, Indonesia, and the south east Lowveld, Zimbabwe). The fourth report (Vol. I)contains a comparison of the findings from each site. Contextual data reports for eachsite, and methodological reports, were compiled at the end of the first and second yearsof the project respectively.
The funding for this research was announced to the University of Kent by the ODA inDecember 1993. The original management team for the project consisted of, Goodwin,H.J., (Project Director), Swingland, I.R. and Sinclair, M.T. In August 1995, Sinclair wasreplaced by Parker, K.T.
Principal Authors:
• Dr Harold Goodwin (Project Director, DICE)• Mr Ivan Kent (DICE)• Dr Kim Parker (IMS)• Mr Matt Walpole (DICE)
Many people in India, Indonesia and Zimbabwe, and in the UK, contributed to thisresearch. They are acknowledged in the three country reports.
Suggested Citation Format:
Goodwin, H.J., Kent, I.J., Parker, K.T., & Walpole, M.J. (1997) Tourism, Conservation& Sustainable Development: Volume I, Comparative Report ..(1 of 4 Volumes),Unpublished, April 1997.
The contents of this report and the views expressed in it are the responsibility of theauthors, and do not necessarily reflect the views of the Department for InternationalDevelopment
Dr Harold Goodwin,Durrell Institute of Conservation and Ecology,University of Kent,Canterbury CT2 7NJ, UK

3
Executive Summary
PurposeThe comparative research proposal submitted to ERP was designed to identify andquantify the nature of the relationships between tourists and the tourism industry,local communities and three national parks. Recognising that the rate of growth intourist arrivals to national parks represented both a threat and an opportunity, theproject sought to determine the current situation and addressed four basic questions:
1. How could the revenues going directly to conservation through national parks forreinvestment in species and habitats be maximised?
2. How could the incomes of local communities from tourism associated withnational parks be raised from this non-consumptive use?
3. To what extent does the process of visiting a national park increase awareness ofbiodiversity and conservation issues?
4. What were the ecological implications for national parks of increased visitornumbers and of changes in the forms of those visits?
Relationship to DFID’s development goals
The project addressed several ERP goals.• Biodiversity Conservation: by identifying ways in which loss of biodiversity can be
reduced through monitoring and managing visitor impact and through thedevelopment of forms of tourism capable of generating significant incomes forlocal people through sustainable non-consumptive use, such that local peoplevalue their patrimony in the protected area.
• Poverty alleviation: by identifying the opportunities, and the constraints to beovercome, for employment and small business development which would offerlocal people sustainable opportunities for diversified economic development andan enhanced standard of living.
• Environmentally Sensitive Habitats: the world’s largest industry is impacting moreand more aggressively on the world’s fragile environments. National parks attractrapidly increasing numbers of visitors. This project sought to assess visitor impactand identify current problems in national parks consequent on increasing visitornumbers.
• Methodologies Component: to develop methodologies which enable localinstitutions to monitor the relationships between tourism, local communities andparks and to adaptively manage these processes to enhance incomes and maintainhabitats.
Research ActivitiesIn the first year of the project extensive secondary research was conducted in order toascertain the historical context and to determine what was already known about thedynamics of tourism in the three case studies. This was followed by eighteen monthsof primary research using a range of survey techniques. There was no opportunity forexperimentation.

4
Outputs of the ProjectMethodologies for the analysis of the relationships between protected or conservationareas, local communities and the tourism industry have been developed and detailedstudies of three sites have been completed. These methodologies are transferable andcould, with moderate amounts of training, be applied at relatively low cost, therebyenabling adaptive management of tourism to be applied in and around national parksand other areas of conservation value.
The case studies show that the relationships are complex and that adaptivemanagement needs to be applied on the basis of information collected locally. Theextensive baseline studies have created the opportunity for action research with localpartners to be undertaken in order to determine the consequences of particularchanges in policy and management. In each area, “desirable” changes have beenidentified with local people. These changes could raise local people’s incomes orrevenues to the parks and to conservation. These ideas remain to be tested. Theproject has not addressed the issue of which adaptive management strategies havewhich effects in what circumstances, but it has established the baseline data whichwould enable such research to be conducted by “experiment”. Whilst we workedextensively with local collaborators, much work remains to be done in establishing thelocal institutional capacity to take control of the tourism industry in and aroundnational parks (and other areas of conservation value) and to build local capacity forimplementation. This was a research project, not an implementation project.
Policy Implications
Visitor Patterns1. National parks operate in an environment of rapidly growing world tourism.2. All three countries display rates of growth of tourism greater than the world
average (and are particularly high in Indonesia and Zimbabwe).3. There are no obvious limits on growth of visitor numbers in the immediate future to
the three countries we have analysed.4. Growth of visitor numbers to the three sites is comparable to the growth of foreign
tourism to the country as a whole, but is slightly lower in Keoladeo.5. Current rates of growth in tourist numbers will increasingly impact on park habitats.6. Visitor patterns to particular parks vary greatly in terms of seasonality and the mix
of domestic and foreign visitors. These factors are specific to individual parks.
Visitor Impact and Management1. Monitoring of impacts within parks has been very limited; there is little base-line
data with which to make comparisons.2. Visitor impact is not perceived as a significant problem by park management,
especially in comparison with the issue of relations with local people.3. Unregulated guiding can seriously exacerbate problems of disturbance.4. Park-management policy needs to be based on a clear strategy which is informed
by the aims and objectives of the parks.5. Research and monitoring must be consonant with the management objectives of
the parks.

5
6. An adaptive management strategy should be adopted based, for example, on theLAC system of Stankey et al.1
Contribution of Tourism to Park Finances1. Traditionally, decisions about the entrance fees and other park charges have been
made by government departments; this remains the case in the three countriesincluded in this study. There is no direct relationship between park revenues andpark budgets.
2. Parks have a number of purposes, the most important of which is the maintenanceof the ecological integrity of the park and the conservation of habitat and species.Visitor fees income should be supplementary rather than core income, themaintenance of biodiversity for future generations could be considered as properlya government responsibility.
3. Entrance and other fees need to be structured to ensure that the host population isable to have access to its national parks for recreational, spiritual, artistic andeducational purposes; national parks are their national heritage. There is a goodcase to be made for dual pricing systems.
4. Parks departments have traditionally been regulators of use rather than operators.The two roles should not be confused.
5. In the pursuit of increased revenues from tourism park managers need to considerthe purposes of the park(s) for which they are responsible and to balance a numberof competing management goals, arguably the first of which is conservation. Parkfees can be manipulated to achieve specific management objectives including:
• controlling over-crowding• raising funds for habitat and species management• improving visitor facilities• maximisation of revenue to the national park and local people• raising money for reinvestment in the park• management of the mix of visitors who have access to, and use of, the park• managing visitor use of the park
6. The setting of park entrance fees is one aspect of the total management of nationalparks. The setting of park entrance fees is a complex policy issue involving anumber of ‘trade-offs’.
7. These decisions need to be made within the framework of the park managementobjectives. The pricing of entrance fees and other services and facilities can reflectmultiple management goals.
8. Tour operators and individual tourists often made two points to us• Increases in entrance fees and other charges should be staged (and tourists’
expectations of charges are influenced by out-of-date guide books)• The reasons for increased fees and charges should be explained
9. There is clearly some scope to increase entrance fees to national parks and toincrease revenue; however the consequences of raising fees and charges need to becarefully considered.
1 Stankey, G.H., Cole, D.N., Lucas, R.C., Petersen, M.E. and Frissell, S.S. (1985) The Limits of Acceptable Change (LAC) System for Wilderness Planning.
USDA Forest Service. intermountain Forest and Range Experiment Station. General Technical Report INT-176. Ogden, Utah.

6
10. Revenue maximisation may lead to increased conflict with local communities iftourism revenues in the local community are reduced or lead to forms ofdevelopment within the park which undermine the conservation purpose of theprotected area.
11. The best way in which to test the market is through market based 2reactivemanagement of park entrance fees and other charges, through raising feesincrementally.
12. Periodic surveying of tourists and tour operators can assist in the determination ofprices for services and facilities and monitoring visitor satisfaction to identifyopportunities for increasing revenues.
Tourism and Local Development 1. Focus assistance to non-capital intensive enterprises. Local involvement in the
tourism industry depends largely on access to the market. In many cases localbenefits are maximised in the informal sector. Local skills and services are oftenmaximised where the scale of capital investment is low. This aspect is sometimesneglected in tourism planning and access to tourists by the informal sector isrestricted. Training in market research, understanding consumer tastes and productpromotion may increase sales for small traders.
2. Maximise tourism based on local technology. Transferability of skills and hencelocal involvement is largest where existing capital and know-how can be utilised.Tourism developers should be encouraged, wherever possible, to use and promoteexisting local modes of transport, accommodation and art and handicrafts, foodproduction and preparations.
3. Discourage enclave practices. Resist the tendency of some tour operators tobypass local business opportunities by regulating traffic (for example through thejudicious location of parking spaces and entry restrictions) and ensure local accessto centres of leisure and accommodation.
4. Encourage flexible partnerships between public and private sectors. Despite thewishes of protected areas to increase rural support, efforts are sometimesfrustrated by emergent monopoly practices within the local private sector. LocalNature Guide training and selection should be based upon a clear agreement ofrecruitment practices with participation from existing guides, protected areamanagers, and rural development associations.
5. Create and strengthen appropriate institutions. Local concerns regarding tourismdevelopment and attempts to retain some of the revenues from tourism are oftenhampered by the lack of local representation at an institutional level. Naturetourism, conservation and income generation often fall between the jurisdiction ofseveral institutions. Local government and donor agencies should explore meansof establishing an appropriate forum for the articulation of local concerns with
2 For concessions and other contracted-out services this can be achieved through auctions and sealed bids
.

7
representation from, and managed engagement of, all stakeholders (parkmanagement, tour companies, hotel developers and small businesses).
6. Developing Revenue Sharing Policies. Some park directors are considering the
introduction of local development levies on entrance fees. Collaborative policiesmay be pursued in order to raise the total revenue for both local people and parks.
7. Incorporate tourism development as a component of a wider strategy. Research inat least two of the study sites suggests that while protected area managers, tourismprofessionals and researchers prefer to make a clear distinction between thetourism and conservation objectives of national parks, the views of localinhabitants often combine them. Greater participation in the tourism industry isnot always a prime concern of local populations. Tourism should form onecomponent of development strategies for protected areas, but should not over-ridealternative suggestions for raising local benefits such as joint resource managementinitiatives.
Integration into the International Market1. As parks and the local economy adapt to incorporate tourism as a significant
income, their dependency on the international tourism market increases. Theinternational tourism market is a competitive and volatile one. This makes parksand the local economy vulnerable to changes in the international market and toloss of confidence by tour operators and individual travellers.
2. The decisions which determine the volume and character of tourism to a particularsite are not made locally. These decisions are made in the tourist originatingcountries and by the domestic tour operators based in the tourism centres remotefrom the parks.
3. Foreign tour operators generally have a low level of commitment to particulardestinations.
4. The local destination remains relatively isolated from the international market,receiving tourists but not understanding or playing any part in controlling the termson which, and the processes by which, they arrive.
5. International tourists choose to visit countries for many reasons but experiencingthe culture and seeing the wildlife are prominent.
6. There is evidence that some tour operators are sympathetic to ideas of localcommunity involvement in tourism and a levy on park admissions for localdevelopment.
Visitor Education and Awareness1. Tourists expressed more interest in information boards, vegetation labels and hides
than in relatively expensive visitor interpretation centres.2. There is potential for more sales of literature (books, maps and postcards) in
national parks.3. Significant numbers of tourists at Keoladeo choose to engage a guide. The park
guide is an important part of the experience and the primary source of learning atKeoladeo.
4. Systems of guide training which establish high quality standards may beinappropriate for the needs and interests of many tourists and the regulations mayfunction to prevent local people earning a living by guiding.

8
5. Conversely, where there is no regulation of guides, standards may be so low as tocause dissatisfaction.
6. It is necessary to train guides in languages, natural history, interpretive skills andvisitor management

9
1. .INTRODUCTION ......................................................................................................................... 11
1.1 TOURISM AND CONSERVATION................................................................................................. 131.2 NATURE TOURISM..................................................................................................................... 151.3 ECOTOURISM............................................................................................................................ 161.4 TURNING NATURE TOURISM INTO ECOTOURISM......................................................................... 181.5 COLLABORATIVE RESEARCH..................................................................................................... 191.6 RESEARCH SITES....................................................................................................................... 20
2. VISITOR PATTERNS................................................................................................................... 22
2.1 INTRODUCTION......................................................................................................................... 222.2 TOTAL VISITOR NUMBERS.......................................................................................................... 222.3 SEASONAL VISITOR PATTERNS................................................................................................... 272.4 CONCLUSIONS.......................................................................................................................... 292.5 POLICY IMPLICATIONS .............................................................................................................. 30
3. VISITOR IMPACTS AND MANAGEMENT .............................................................................. 31
3.1 INTRODUCTION......................................................................................................................... 313.2 THE LIMITATIONS OF RESEARCH INTO THE ENVIRONMENTAL IMPACTS OF TOURISM................... 323.3 VISITOR IMPACT MANAGEMENT STRATEGIES.............................................................................. 343.4 COMPARISON OF THREE COUNTRY CASE STUDIES...................................................................... 353.5 VISITOR ACTIVITIES AND THEIR ENVIRONMENTAL IMPLICATIONS............................................... 363.6 ENVIRONMENTAL IMPACTS IN CONTEXT: OTHER PROBLEMS.................................................... 403.7 MONITORING AND MANAGEMENT OF VISITOR IMPACTS............................................................ 413.8 CONCLUSION AND RECOMMENDATIONS................................................................................... 423.9 POLICY IMPLICATIONS .............................................................................................................. 44
4. CONTRIBUTION OF TOURISM TO PARK FINANCES ......................................................... 45
4.1 INTRODUCTION......................................................................................................................... 454.2 PARK REVENUES....................................................................................................................... 494.3 PARK EXPENDITURES................................................................................................................ 504.4 REVENUE AND EXPENDITURE COMPARED.................................................................................. 514.5 INCREASING PARK REVENUES................................................................................................... 52
4.5.1 Entrance Fees................................................................................................................. 524.5.2 Entrance Fees: Willingness to Pay............................................................................... 534.5.3 Entrance Fees: Tour Operators..................................................................................... 554.5.4 Revenue Maximisation?................................................................................................. 564.5.5 Other Sources of Fee Income to Parks......................................................................... 574.5.6 Policy Considerations..................................................................................................... 584.5.7 Policy Implications......................................................................................................... 58
5. TOURISM AND LOCAL DEVELOPMENT .............................................................................. 60
5.1 INTRODUCTION......................................................................................................................... 605.2 TOURISM AS A STRATEGY FOR DEVELOPMENT.......................................................................... 60
5.2.1 National Strategies......................................................................................................... 605.2.2 Local Strategies.............................................................................................................. 61
5.3 TOURISM AND LOCAL DEVELOPMENT....................................................................................... 615.4 KEY QUESTIONS....................................................................................................................... 625.5 THE CASE STUDIES.................................................................................................................... 63
5.5.1 Transferability of Existing Skills and Capital.............................................................. 645.5.2 Mode of Tourist Arrival................................................................................................. 655.5.3 Geographical accessibility ............................................................................................. 665.5.4 Patterns of Land Ownership.......................................................................................... 665.5.5 Local Social Structures.................................................................................................. 675.5.6 Local Institutions ........................................................................................................... 675.5.7 Conclusions.................................................................................................................... 68
5.6 POLICY IMPLICATIONS.............................................................................................................. 68

10
6. INTEGRATION INTO THE INTERNATIONAL MARKET .................................................... 70
6.1 INTRODUCTION......................................................................................................................... 706.2 MARKET VOLATILITY ................................................................................................................ 71
6.2.1 Changes in international market trends....................................................................... 716.2.2 Tourist Confidence......................................................................................................... 72
6.3 INTERNATIONAL TOURISTS....................................................................................................... 726.4 INTERNATIONAL TOUR OPERATORS.......................................................................................... 736.5 POLICY IMPLICATIONS.............................................................................................................. 77
7. VISITOR EDUCATION AND AWARENESS ............................................................................. 78
7.1 INTRODUCTION......................................................................................................................... 787.2 INTERPRETATION AND EDUCATION SERVICES............................................................................ 79
7.2.1 Guides............................................................................................................................. 797.2.2 Facilities ......................................................................................................................... 80
7.3 THE KEOLADEO SURVEY OF BIODIVERSITY AWARENESS AND LEARNING.................................. 817.4 POLICY IMPLICATIONS.............................................................................................................. 84
8. BIBLIOGRAPHY ............................................................................................................................ 86
9. APPENDIX 1: RESEARCH AND SCIENTIFIC/TECHNICAL OBJECTIVES ....................... 90
10. APPENDIX 2: DATA REQUIREMENTS FOR FUTURE MONITORING.......................... 91
11. APPENDIX 3: EXCHANGE RATES ....................................................................................... 97

11
1. Introduction
At the Royal Geographical Society conference on ecotourism3 in September 1992 theMinister for Overseas Development announced research funding from within theglobal Environmental Research Programme for research into tourism and nationalparks. The Minister suggested a range of tourism-related issues which needed to beaddressed and invited research proposals.4
This Comparative Report draws together the main findings of the three country studieswhich have been submitted to the ODA in April 1997. Three base line studies onIndia, Indonesia and Zimbabwe were submitted to the ODA in March 1995 andinterim reports dealing in detail with the methodologies employed were submitted inMarch 1996. The content of these earlier reports is referred to, where relevant, in thisComparative Report.
The Minister argued that all forms of tourism, not just ecotourism, needed to besustainable and concluded
“If the development of tourism is to avoid some of the most damaging effectsthat have been observed on the natural and human resources of developingcountries, it needs to be seen as part of the whole process of moving towardssustainable development”.
The research programme, which was approved by the ODA, addressed the issue ofinternational tourism to national parks from a range of perspectives in order tounderstand the nature of the tourism processes in and around national parks and tosuggest what needs to be done in order to increase tourism revenues to conservationand local people. This research project has spawned a training programme at theDurrell Institute of Conservation and Ecology in Tourism and Conservation for thispurpose. There is also considerable scope for implementation projects and furtherresearch.
This was a collaborative research project based upon a partnership with institutions inthe host countries.5 One of the primary focuses of this research was on the extent towhich nature-based tourism from the international tourist originating countriescontributes to the maintenance of biodiversity in, and tourism to, national parks inhost countries. Domestic visitors to Keoladeo National Park currently constitute 70per cent of total. Research in Bharatpur has shown that in comparison to foreigntourists, the total spending of domestic tourists is relatively low. However, domestictourists make a substantial contribution to small scale businesses, whereas much of thespending by foreign tourists circumvents the local economy. Many of the touristenterprises aim to cater for the foreign market due to the relatively high spend, and thestatus attached to such sales. Domestic tourism could make a substantial contributionto the development of the low-season market, and offer opportunities for less capital
3 The definitions of nature tourism and ecotourism are considered in sections 1.2 & 1.3.4 Baroness Chalker (1994)5 For full details see the country reports.

12
intensive tourism enterprises, at comparatively low risk. In Indonesia domestic touristnumbers have been static in recent years and amount to only 10% of total visits. Inthese circumstances the development of enterprises to meet domestic tourism demandis an unattractive option. In Zimbabwe the domestic tourism market is significant outof season and it could offer entrepreneurial opportunities for new entrants into theindustry. However, the primary focus is on international tourists.
The latest figures from the WTO record 592 million international tourist arrivals in1996; an increase of 4.55% on 1995. The average year on year increase in arrivalsover the period 1990-1996 has been 4.4%, with receipts rising at 8% per year. Overthe next 25 years the WTO will be forecasting a threefold increase in internationaltourist arrivals to 1.5bn.6 This growth in international tourism presents both a threatand an opportunity. Nature tourism constitutes only a fraction of the industry, butmany tourists who would not define themselves as nature tourists also visit a nationalpark or protected area as part of their trip. Although the three sites which form thebasis of this study are all designated national parks, the methodologies and policyimplications also apply to other forms of protected area.
Jenner and Smith7 have produced some estimates and forecasts of environmentallysensitive tourism. They define environmentally sensitive tourism as mass market travelwhich is dependent on the quality of the environment, where for example a touristmay choose the Pyrenees in preference to the Alps because they consider the Alpsoverdeveloped. Jenner and Smith define ecotourism as travel to unspoilt naturalenvironments where travel is for the specific purpose of experiencing that naturalenvironment. They further identify minimum impact ecotourism. Jenner and Smith'sfigures suggest a dramatic growth, with environmentally sensitive tourism andecotourism doubling between 1995 and the turn of the century.
Table 1.1 The value of environmentally sensitive tourism and ecotourism world-wide1980 - 2000
1980e 1985e 1989e 1995f 2000fEnvironmentally sensitive tourism $ 10bn $ 20bn $ 50bn $150bn $300bnEcotourism $ 4bn $ 5bn $ 10bn $ 25bn $ 50bnMinimum impact ecotourism $ 25mn $ 35mn $100mn $250mn $500mn
Excludes transport. e = Estimate f = ForecastAdapted from Jenner and Smith, 1992
It is clear that minimum impact ecotourism is a fragment of the total market, althoughthere is considerable scope for conservation to benefit from the demand forenvironmentally sensitive tourism and ecotourism.
6 Robert Cleverdon (pers.comm.)7 Jenner & Smith (1992)

13
1.1 Tourism and Conservation8
Given the strength of consumer demand for “ecotourism” products, and dramaticgrowth forecasts for this sector of the world's largest industry, it is not surprising thatsome governments9 are now beginning to develop national ecotourism strategies. Themanagement of visitors to national parks and other areas of conservation importancewill be a major challenge over the next twenty five years and there has beensurprisingly little research into these issues. The growth of tourism also presentsopportunities for securing funding for conservation if the process can be managed sothat conservation benefits from the industry in a significant way, whilst the integrity ofthe conserved ecosystems is maintained or enhanced.
Sustainable tourism requires that the host population achieves rising living standards,that the tourist 'guests' are satisfied with the product and continue to arrive each year.It also requires that the natural environment is maintained for the continuedenjoyment of the hosts and guests, all of which requires careful management. Ifnature-based tourism is to benefit conservation, there must be a clear link between thetourist destination choice and locally protected nature. Local people and the industryneed to appreciate the economic value of the protected area as a tourist destination.
The development goal is to attract 'visitors to natural areas and use the revenues tofund local conservation and economic development'.10 The impetus for ecotourismdevelopment often comes from the major tourist originating countries and it behovesconservationists, development experts and the tourism industry to be aware of theconflicts between the immediate interests of the rich tourists and the local people. Iftourism is to make any adequate recompense for the non-development of relativelypristine sites it will need to generate significant revenue for the benefit of thoseexpected to sacrifice these potential sources of income.
The IVth World Congress on National Parks and Protected Areas (1992) acceptedthat part of the purpose of a national park was to 'provide a foundation for spiritual,scientific, educational, recreational' use for visitors. This modification of the IUCN'sProtected Areas Categories clearly accepted and recognised the value of tourism as ause of national parks, provided that it was 'environmentally and culturally' compatiblewith the maintenance of its 'ecological integrity'.11
McNeely reflects the changing attitudes of protected area managers when he arguesthat long-established human activity embracing 'cultural identity, spirituality, andsubsistence practices' has contributed to the maintenance of biological diversity.12
Cultural diversity and biological diversity are often inextricably linked, defining themanagement context for the protected area manager and the 'product' for the tourist.Tourism is one of the forms of sustainable use which potentially enables protectedarea managers to allow local people to derive economic benefit from the park and to 8 This section draws on work previously published in Goodwin (1996)9 Including Australia, Mexico and New Zealand10 Ziffer (1989)11 McNeely (1994).12 McNeely (1993).

14
encourage local support for the maintenance of natural heritage in national parks andother protected areas.
Tourism, if carefully managed, may offer diversified low-impact development andcounter the danger of agricultural mono-culture which threatens biodiversity. But noform of tourism is without environmental, economic and social impacts. Largenumbers of ecotourists will quickly constitute a mass and begin to impact on the localphysical and cultural environment. If tourism is not carefully controlled and managedit will be incompatible with diversified rural development and conservation objectives.Not all forms of nature tourism support conservation.
In1972 Myers13 argued that tourism provided the incentive for conservation throughthe establishment of national parks. Budowski14 argued that there could be a symbiosisbetween conservation and tourism. Where tourism is wholly or partly based on valuesderived from nature and its resources, it could provide an economic value forconservation of species and habitats. Others argued that the risk was too great and thattourism caused pollution and inflicted damage on flora and fauna15. The IUCN in 1982affirmed that the 'tourist potential' of an area is an important factor in the selection ofnational parks and other protected areas, but recognised that many areas of importantconservation value have little appeal for tourists and that the pursuit of tourismrevenue may result in inappropriate development.16 Philips argued that tourismprovides conservation with an economic justification, a means of building support forconservation and a source of revenue.17
The 1992 IVth World Congress on National Parks and Protected Areas declared thattourism associated with protected areas ‘must serve as a tool to advance protectedareas’ objectives for maintaining ecosystem integrity, biodiversity, public awareness,and enhancement of local people's quality of life.'18 Revenue generated from tourismin protected areas should be reinvested in protection and management.Recommendation 9, dealing with tourism and protected areas, significantly makes noparticular reference to ecotourism, dealing rather with tourism as a whole..
Tourism to national parks and other protected areas is emerging as a developmentstrategy. The IUCN's World Conservation Strategy (1980) endorsed the sustainableutilisation of species and ecosystems. Over the last ten years there have been a seriesof initiatives to implement projects which enable local economic development whilstmaintaining or furthering conservation objectives. In 1990 Zebu and Bush producedclear survey evidence that park authorities had realised that local populations could nolonger be ignored in the establishment, planning and management of national parksand other protected landscapes. The same survey reported that tourism formed part ofthe management strategy of 75% of respondents19.
13 Myers (1972).14 Budowsk (1976).15 Crittenden (1975).; Goldsmith (1974); Liddle (1975).16 MacKinnon et al (1986)17 Then Director General of the British Countryside Commission. Philips (1985)18 IUCN (1993)19 Zebu & Bush (1990).

15
Wells and Brandon (1992) in their study of Integrated Conservation DevelopmentProjects (ICDPs) reported that many of the projects had promoted nature tourism inorder to provide funds for protected area management and to generate income gainsfor local communities. However, they report that the results had been disappointing,with all visitor spending in the parks going directly to the central treasury or toconcession holding private corporate interests. Although, at some popular sites,revenues may exceed local protected area operating budgets, it is unusual for any ofthe additional revenues to be returned to park management 'and extremely rare for arevenue share to go to local people'. Wells and Brandon reported that localemployment opportunities linked to tourism were 'insufficient to attract much popularlocal support for the parks.' In any event 'only a small minority of protected areasattract significant numbers of visitors' .20
Tourism also presents an opportunity for increasing awareness of the importance ofthe maintenance of biodiversity to tourists and local visitors. Graham Child argues thatthe 'challenge is to determine how protected areas can be transformed from thebastions of conservation to the bridgeheads from which to spread more sustainableland use'.21
Consumptive and non-consumptive tourist-use both provide potential sources ofsustainable revenue derived from protected areas if carefully regulated. Conservationof both species and habitat is essential to sustainable use as is economic viability forparks and tourism enterprises. The tension between the preservation of the ecologicalintegrity of a park and recreational and tourist use will require careful managementand long-term monitoring of the impact of tourists on parks.
1.2 Nature TourismIt is important to distinguish between ecotourism and nature tourism. Nature, ornature-based, tourism encompasses all forms of tourism - mass tourism, adventuretourism, low impact tourism, ecotourism - which use natural resources in a wild orundeveloped form - including species, habitat, landscape, scenery and salt and fresh-water features. Nature tourism is travel for the purpose of enjoying undevelopednatural areas or wildlife. Most of the tourism to national parks is nature tourism. Notall forms of nature tourism are compatible; trekking, mountain biking and white-waterrafting may not be compatible with birdwatching or photo-safaris.
Nature tourism involves the marketing of natural landscapes and wildlife to tourists. Ithas the potential to provide developing countries with the finance and motivationrequired to boost conservation efforts. National parks and protected areas are one ofthe primary resources for nature tourism, which is of increasing economic importance,providing foreign exchange and an economic return for the preservation of naturalhabitats and their dependent species.
Nature tourism includes a wide range of activities from relatively passive scenery andwildlife viewing to physically exerting 'adventure tourism' activities (mountaineering
20 Wells, M & Brandon (1992.)21 Child (1994).

16
or white-water rafting) often involving elements of risk. Nature tourism may beconsumptive (sport hunting) or non-consumptive and it may or may not besustainable. Nature tourism may be the primary focus of a tourism activity or part of apackage of leisure, recreational or cultural tourism activities. However, only someforms of nature tourism make a positive contribution to conservation. It is these formsof nature tourism which constitute ecotourism.
1.3 EcotourismMany of the contributors to the Royal Geographical Society Conference, including theMinister for Overseas Development, pointed to the many competing definitions ofecotourism which are in use for a range of purposes from marketing toimplementation. A critical approach to ecotourism is essential if it is to be harnessedfor the conservation of habitats and species. Ecotourism will not be significantlydifferent from conventional tourism unless it is carefully managed and controlled.Protected area managers and conservationists need to take more control over thedefinition and use of the concept and over the supervision of its practice.
There is an urgent need to 'put the ecology back into ecotourism' 22 in order toestablish a symbiotic relationship between nature based tourism and conservation. Forgovernments and development agencies ecotourism has much to offer in diversifyingrural economies in LDC's in urgent need of foreign exchange. Tour operators willcontinue to use the term “ecotourism” as a marketing tool. It is difficult for consumersto get accurate information about the tours which they are offered and about theoperators who claim the mantle of ecotourism.
If ecotourism is to become a means of harnessing part of the tourism industry forconservation of habitats and species, it is essential to focus on the activity rather thanthe motivation of the ecotourists. It is what they do, rather than what they say (orthink) they do that impacts on conservation and ecosystems. It is easier to determinewhether individual activities and tours meet ecotourism criteria, by contributingdirectly or indirectly to conservation, than it is to determine whether or not individualsare ecotourists or not.
Only conservationists and protected area managers are in a position, or have theexpertise, to credibly assert a more useful definition of ecotourism. Ecologists andconservationists need to 'take control of the language being used in the name of“ecotourism”' 23and use it to benefit conservation and the maintenance of protectedareas. It is protected area managers and conservationists, working with local people,who are best placed to manage nature tourism to ensure that its environmental impact does not jeopardisethe integrity of the ecosystem and that both local people and the park gain significantly from ecotourism.
Nature tourism and ecotourism need to be distinguished. Nature tourism is concernedwith the enjoyment of nature. Ecotourism additionally requires a contribution toconservation. Hence the following definition of ecotourism is offered:
22 Valentine (1993).23 Ibid.
17
low impact nature tourism which contributes to the maintenance of species andhabitats either directly through a contribution to conservation and/orindirectly by providing revenue to the local community sufficient for localpeople to value, and therefore protect, their wildlife heritage area as a sourceof income. 24
According to this definition, ecotourism makes a direct or indirect measurablecontribution to the continued protection and management of natural habitats and theirspecies. Generally this contribution is likely to be financial, but the work ofcommercial and 'not-for-profit' organisations which enable tourists to make a practicalcontribution should not be ignored. However, the claims of such organisations alsoneed to be carefully assessed by conservationists.
Ecotourism is too powerful a force, driven by producers and consumers in the world'slargest industry, for conservationists and protected area managers to allow it to becontrolled and developed by that industry. It is the form and impact of nature tourismwhich must be managed to fulfil ecotourism criteria. It is essential that ecotourism islow impact and that this is ensured through careful extensive and intensive visitormanagement. Protected area managers and conservationists have an opportunity tomanage nature tourism and turn it into ecotourism at the point of consumption,whatever the motivation of the tourist. It is the activity of tourism itself which needsto be controlled and used for conservation. If control is inadequate, pollution, habitatdestruction, wildlife disturbance and a host of other negative impacts will result.Carrying capacity analysis and limits of acceptable change (LAC) management toolswill need to be applied if tourism is to be harnessed for conservation. It is essentialthat protected area managers continue to see their role as being responsible for theconservation of habitats and species. The regulators of human activity in the parksshould not become the tourism operators.
Ecotourism can benefit national parks and other protected areas in three ways.
I Direct
Ecotourism is one of the most important ways in which money can begenerated to manage and protect the world's natural habitats and species.Ecotourism can contribute directly to conservation through park admissionfees and payments for guiding, accommodation and interpretation centres.Central to the definition of ecotourism is reinvestment by the industry in themaintenance of habitats and species.
II Indirect
Ecotourism can enable local people to gain economically from the protectedarea with which they live. Protected areas cannot coexist in the long term withcommunities which are hostile to them. Local people are important
24 Boo defined ecotourism in similar terms as 'nature travel that advances conservation and sustainabledevelopment efforts', integrating conservation with economic development and providing increased fundsto parks, new jobs for local residents and environmental education for visitors. Boo (1992).

18
stakeholders with whom protected area managers must co-operate. More ofthe benefits of conservation need to be delivered to local people by enablingthem to benefit from the protection of the park - their use of which is nowregulated. If local people secure a sustainable income (a tangible economicbenefit) from tourism to these protected areas, they will be less likely toexploit them in other less sustainable ways - obvious examples are over-fishing, poaching or coral blasting. If local people gain from the sustainable useof, for example, a coral reef or wild animals through tourism, they will protecttheir asset and may invest further resources into it
III Education
Ecotourism can offer a means by which people's awareness of the importanceof conservation and ecological literacy can be raised, whether those touristsare domestic or international. The clients on whom the ecotourism section ofthe tourism industry depends are potential voters, taxpayers and leaders whomay help to build constituencies of support to lobby for conservation.25
The Tourism, Conservation and Sustainable Development Research Project wasdesigned to explore, quantitatively and qualitatively, using natural and social sciencemethodologies, the relationships between tourists, the “host” communities, the touristindustry and the protected areas which are the focus of tourism.
1.4 Turning nature tourism into ecotourism
A range of issues need to be addressed in order to empower local people and parkmanagers and to enable them to turn nature tourism into ecotourism.
• Tourism Impact on Conservation
securing sufficient revenue to ensure re-investment in conservation andecological restoration
changing the commercial and regulatory conditions to increase thecontribution of tourism to conservation
improving visitor management to minimise the adverse ecological impact oftourism
• Potential for Increased Revenues for Local People
increasing local people’s incomes from protected areas and the additionalincomes which could be generated from tourism for their benefit
25 US OTA (1993).

19
removing the barriers which currently prevent local people from gaining fromtourism to protected areas and to identify the changes which would enablethem to secure the benefits of employment and ownership
• Opportunities for raising Conservation Awareness
increasing the contribution which visits to protected areas make to the raisingof conservation awareness.
• Opportunities and Problems of Integration into the International Tourism Market
assessing international and national perceptions of protected areas and tourismto the research sites in order to improve marketing and visitation profiles,maximising revenue benefits.
1.5 Collaborative ResearchTourism to national parks involves both national and international visitors. The mainfocus of our research was on international visitors, as this is the group thought mostlikely to make a significant direct or indirect contribution to conservation. 80% ofinternational travel is undertaken by nationals of 20 countries. 50% is undertaken byAmerican, British, French, German and Japanese nationals. Collaborative researchbetween an institution from a major tourist originating country and researchers in hostcountries was appropriate.
As the process of turning nature tourism into ecotourism is one of management andregulation, it is important that the management skills and methodologies forcontinuous monitoring of the tourism processes in and around national parks should bedeveloped in the host countries. This research was predicated on the importance ofcollaborative research involving researchers from tourist originating and destinationcountries. Within the parameters of a comparative study, local research design hasreflected the concerns of local people, conservationists and people from the travelindustry in the host countries. The research was designed to maximise the benefit tothe countries of the south of receiving comparable reports about nature tourism intheir own country and two others.
The research at all three sites was conducted in partnership: in India, with the WorldNature Conservation Society of Bharatpur, a local NGO, and with the park staff; inIndonesia, with the Wallacea Development Institute and the PHPA26, both in Komodoand Bogor; in Zimbabwe, with the Geography Department of the University ofZimbabwe.
26 Directorate General of Forest Protection and Nature Conservation.

20
1.6 Research SitesThe three countries were chosen from amongst five put to the ODA27. Two sites werechosen in Asia and one in Africa. India and Indonesia are predominantly culturaltourism destinations but both have significant wildlife components in their tourismprofiles. Zimbabwe’s tourism, aside from the Victoria Falls, is overwhelmingly wildlifeorientated.
In India, Keoladeo National Park was chosen because of its high level of foreign anddomestic visitation, its situation on the Golden Triangle and its importance as aninternational bird site. This park contains no dangerous animals and many visitors areunescorted. The park offers unusually large numbers of local employmentopportunities for non-parks staff. Keoladeo, also called Bharatpur, is a wellestablished tourist destination.
Komodo National Park in Indonesia was chosen because of its relative remoteness andits dependence on one species of charismatic megafauna; the large monitor lizardVaranus komodoensis, the national animal of Indonesia, popularly known as Ora orthe Komodo Dragon. Komodo National Park is accessible to tourists from Lombokand Bali and is on a rapidly developing backpackers and independent traveller routethrough the eastern part of Indonesia to Australia. Komodo is a maturing touristdestination.
We had originally intended to undertake our research in Zimbabwe at HwangeNational Park; an established mature destination. Our research partner and theMinistry of Environment and Tourism argued that we should research tourism in thesouth-east lowveld in and around Gonarezhou National Park. Gonarezhou reopened toforeign tourists in 1994. The lowveld has a wide range of institutional forms of wildlifetourism; a major National Park, three conservancies, a charitable trust, a commerciallease farm and a major hotel company development within a CAMPFIRE jointventure. There is a case study of each of these in the Zimbabwe report. There is anadditional chapter on the conservancies which describes their original aspirations andidentifies some of the policy issues which have arisen as implementation hadproceeded. The lowveld is now opening to international tourism and the area providesan excellent opportunity to compare a number of institutional models.
The primary focus of this research project was on tourism to formally protected areas.However, the Zimbabwe case studies included a wide range of other sites andpotential sites being put to conservation use in order to secure revenue from tourism.At present, Keoladeo National Park is the only nature-based tourist attraction inBharatpur. At the workshop there was some discussion of the possibility of developingan alternative natural site near the national park providing additional wetland habitatfor birds and a picnic site for primarily domestic tourists, many participants suggestedthat the local economy would benefit from alternative attractions. This developmentwould offer an additional natural attraction and relieve pressure on the KeoladeoNational Park. In the rural areas, economic trends such as the shift from buffalograzing to agricultural livelihoods has increased the price of land, and encouraged a
27 The two other countries were Madagascar and Ecuador. We were unable to establish a suitable partnerin Madagascar. A major French study of tourism at Galapagos pre-empted our working there.

21
progressively more intensive agriculture. Further land speculation will limit access tothe land by poorer groups. While tourism to the rural areas of Keoladeo National Parkoffers the potential of economic benefits through village stays and handicraft sales,land intensive tourist schemes may be best avoided, unless land is made available bythe state or international donor aid..
Each chapter of this comparative report focuses on a different aspect of therelationship between tourism, local people and the protected areas. The chaptersconclude with the policy implications arising from the research findings. Appendix 1contains the research objectives. Appendix 2 discusses the data requirements forfuture monitoring and the means by which the data may best be collected.

22
2. VISITOR PATTERNS
2.1 IntroductionIn this chapter we shall describe the most important aspects of tourist visitor patterns,and present comparisons between the three sites. Since the three parks are completelyunconnected, there is no guarantee that strictly comparable statistics will have beencollected by the authorities, both in terms of the actual data collected and the timeperiod for which it is available. However, there is a basic level of commonality whichdoes allow useful comparisons to be made, particularly in relation to total visitornumbers, proportions of foreign visitors and seasonal patterns.
2.2 Total visitor numbers
The three sites were chosen to represent a wide range of tourist experience. Keoladeobird reserve is small, easily accessible and well provided with a range of hotels in theimmediate vicinity. It is also on a well frequented tourist route and a visit can beincluded in other itineraries with very little effort or additional expense. Conversely,Komodo is an island, and thus accessibility is limited. Furthermore, although there issome accommodation on the island, the main hotel provision is to be found at LabuanBajo and Sape on adjacent islands. Its attraction is also very much focused on oneparticular species. Gonarezhou is much larger than either of the other two sites andprovides the opportunity to see a wide range of African wildlife over a longer periodof time. It is also relatively remote and tourist infrastructure is at a less developedstage.
The annual visitor numbers for all tourists (home and foreign) are shown in Figure 2.1.As can be seen, there are great differences in the levels of visitors, the visitor numbersat Keoladeo being some fifteen times greater than those at Gonarezhou. The reasonsfor such differences are largely those described above. In addition, however, it shouldbe remembered that these figures are based on the numbers passing through theentrances. They thus do not take account of how long visitors remain within the park.Whereas Keoladeo is primarily a day-trip experience, Gonarezhou requires longer tosee and offers varied possibilities for staying within the park. For a given level ofentrance figures, there will be more visitors within the park the longer the length ofstay. On the other hand, Keoladeo has several hotels close to the park and, as a result,there are many tourists who stay for several nights and make multiple visits to the birdreserve. Consequently, there are fewer tourist visitors to Bharatpur than immediatelyconveyed by the entrance figures.

23
Annual Visitor Numbers
010,00020,00030,00040,00050,00060,00070,00080,00090,000
100,00019
82
1983
1984
1985
1986
1987
1988
1989
1990
1991
1992
1993
1994
1995
1996
Keoladeo
Komodo
Gonarezhou
Figure 2.1. Annual Visitor Numbers
There is clearly an upward trend in recent years, but comparisons are difficult becauseof the differences in absolute size. The visitor numbers have, therefore, beenconverted to index form, with 1991 being set at 100, so that direct comparisons can bemade. The results are presented in Figure 2.2. One must first comment on the veryvolatile performance of Gonarezhou during the 1980’s, including a two-year gap in thedata. The reasons are related to the security situation and were described in greaterdetail in the interim report for Zimbabwe.28
Index of Visitor Numbers(All visitors: 1991=100)
0
20
40
60
80
100
120
140
160
180
1982 1984 1986 1988 1990 1992 1994 1996
Keoladeo
Komodo
Gonarezhou
Figure 2.2. Index of Visitor Numbers
28 Goodwin et al (1995)

24
During the 1990s, the curves lie within a band showing a clear upward trend. Theannualised growth rates between 1991 and 1995 are 7% for Keoladeo, 15% forKomodo and 10% for Gonarezhou. Keoladeo is growing more slowly than the others,possibly a reflection of its well developed status. As explained in the individualcountry report, the reasons for Indians visiting Keoladeo are dependent on personaland family motives and are thus not related to growth in world tourism nor specificallyto nature-based tourism.
Komodo demonstrates a very strong, continuous increase in numbers. Greateraccessibility and growth in tourism to Indonesia as a whole have almost certainlyplayed their part. Visitor numbers to Gonarezhou have also shown strong growth overthe 1990s, albeit with appreciable fluctuations.
Foreign tourism is an issue of great importance; it can be a substantial invisible exportbut, in contrast, can also have less welcome cultural impacts. These issues areaddressed elsewhere in the reports. Figures 2.3 and 2.4 show the annual numbers offoreign visitors, both as absolute figures and as percentages of the total.
Foreign Visitors: Annual Totals
0
5,000
10,000
15,000
20,000
25,000
30,000
1983 1984 1985 1986 1987 1988 1989 1990 1991 1992 1993 1994 1995
Keoladeo
Komodo
Gonarezhou
Figure 2.3. Annual Totals of Foreign Visitors

25
Foreign Visitors: % of Total
01020
3040506070
8090
100
1983 1984 1985 1986 1987 1988 1989 1990 1991 1992 1993 1994 1995
%KeoladeoKomodo
Gonarezhou
Figure 2.4. % of Foreign Visitors
Unfortunately, there is limited information about foreign visitors to Gonarezhou butthe one year of data does give a useful reference point. These graphs bear out manyof the points mentioned before. There is a very large base of domestic visitors toKeoladeo, with the proportion of foreign visitors showing very little change; thegrowth of total visitor numbers is balanced evenly between domestic and foreigntourists. Komodo presents much more striking figures; the growth in foreign visitorshas been spectacular (an annualised growth rate of 38% over the decade 1985-95).Furthermore, it outweighs the growth in numbers of Indonesian visitors with the resultthat tourism to Komodo is currently dominated by foreigners who make up over 90%of visitors to the island.
We also need to investigate how visitor numbers to the three chosen sites relate to thegrowth of tourism in those countries, in particular to the growth in the number offoreign tourists to the country as a whole. Such relationships are demonstrated inFigures 2.5-2.8 which are based on WTO figures.
As with the visitor numbers to the individual sites, there is a need to use index figuresto allow comparisons between the countries. Figure 2.5 shows the growth in foreignvisitors to the three countries. (To compare absolute levels, the total numbers ofvisitors in 1995 were 1.8, 4.3 and 1.3 million for India, Indonesia and Zimbabwerespectively.) The increases are very similar for Indonesia and Zimbabwe, with abouta doubling in visitors over the five-year period. India has shown a steady growth since1991, but at a lower percentage rate than the other two countries; the annualisedgrowth rates over the period 1990-1995 are India 6.0%, Indonesia 14.7% andZimbabwe 16.0%.

26
Growth of Tourism by CountryIndex: 1991=100
020406080
100
120140160180200
1990 1991 1992 1993 1994 1995
India
Indonesia
Zimbabwe
Figure 2.5. The Growth of Tourism by Country
Given the background figures for foreign visitors to each country as a whole, havevisitor numbers to the three national parks grown at comparable rates? Since we arelooking at foreign visitors to the country, the best comparison would be with foreignvisitors to the parks. However, since these figures are not available for Gonarezhou,we have also calculated an index of relative growth for all visitors to the parks(domestic and foreign); this can be seen in Figure 2.6. The indices can be calculatedfor foreign visitors to Keoladeo and Komodo, and these are shown in Figure 2.7.
As has been found elsewhere, the figures for Gonarezhou can be volatile. However,apart from 1994, it would appear that Gonarezhou has not been as successful inattracting visitors as has Zimbabwe as a whole. On the other hand, the total numbersvisiting Keoladeo and Komodo have kept pace with the growth of foreign tourism toIndia and Indonesia. When we look specifically at foreign visitors to the two sites forwhich we have figures, there is a relatively small, but quite noticeable, difference.Even though foreign tourism to Indonesia has been growing very rapidly, visitornumbers to Komodo have grown at a comparable rate. In contrast, Figure 2.7 showsthat the proportion of foreign tourists to India who also visit Keoladeo has fallen; inother words, the growth in foreign visitors to Keoladeo has not been as great as thegrowth of tourism to India. One possible explanation is that Keoladeo lies in an areawhere foreign tourism is most developed (the Golden Triangle of Delhi, Agra andJaipur). Other parts of India have greater scope for tourism development and thusmay have experienced relatively higher growth rates in recent years.

27
Annual Visitors to Site Compared w ith V isitors to Country (1991=100)
0
20
40
60
80
100
120
1991 1992 1993 1994 1995
Keoladeo
Komodo
Gonarezhou
Figure 2.6. Annual Visitors to Site Compared with Visitors to Country
Annual Forei gn Visitors to Site Com pared with Visitors to Countr y
0
20
40
60
80
100
120
1991 1992 1993 1994 1995
Keoladeo
Komodo
Figure 2.7. Annual Foreign Visitors to Site Compared with Visitors to Country.
2.3 Seasonal visitor patterns
Tourism is a seasonally varying phenomenon. It is driven by climate in both the homecountry and destination of the tourist. Furthermore it is affected by social, culturaland industrial factors, for example the timing of festivals and the organisation ofvacation leave by employers and employees. With so many potential influencing

28
factors, it is to be expected that many different seasonal patterns of visits will beobserved in different tourist attractions. Our three sites are no exception.
Comparison of Seasonal Visitor PatternsAll Visitors
0.00
0.50
1.00
1.50
2.00
2.50
Jan Feb Mar Apr May Jun Jul Aug Sep Oct Nov Dec
ratio
to a
nnua
l ave
rage
Keoladeo
Komodo
Gonarezhou
Figure 2.8. Comparison of Seasonal Visitor Patterns- All Visitors
Figure 2.8 shows the seasonal patterns for all visitors. These figures represent theratio of visitor numbers in any particular month to the monthly visitor numbersaveraged over a complete year.29 The graphs are based on most recent data but, evenwhere a longer time series is available, only the most recent five years has been usedbecause we wish to avoid any confusion due to possible long-run secular changes inseasonality. Komodo and Gonarezhou show clear peaks in August. For Komodo, thisis probably explained by the fact that most visitors are from the Northern Hemisphere(83% in 1995/96) where August is the conventional month for taking the main annualholiday. In Gonarezhou, the visitor patterns are very much affected by the local dryand rainy seasons. The very different pattern for Keoladeo is also readily explicable.The plains of Northern India are extremely hot in the months of May to August,making outdoor activities very uncomfortable. Furthermore, migratory birds are themain attraction of Keoladeo, and they arrive in greatest numbers during the coolermonths.
The data on seasonal visitation patterns by foreign visitors are less reliable; they arenot available for Komodo and are based on only fourteen months’ data forGonarezhou. However, since most visitors to Komodo are from overseas, the seasonalpatterns for all visitors will be a good indication of the seasonal pattern for foreigners.Finally, data for Keoladeo are complete. The results of the seasonal analysis areshown in Figure 2.9.
29 The seasonal factors were calculated using seasonal decomposition based on multiplicative, centredmoving average model (Anderson D.R., Sweeney D.J. and Williams T.A. Statistics for Business andEconomics 4th ed. West, St. Paul Minn., 1989).

29
Comparison of Seasonal Visitor PatternsForeign nationals
0.00
0.50
1.00
1.50
2.00
2.50
3.00
Jan Feb Mar Apr May Jun Jul Aug Sep Oct Nov Dec
Keoladeo
Gonarezhou
Figure 2.9. Comparison of Seasonal Visitor Patterns- Foreign Nationals
The pattern for Gonarezhou is broadly similar to that for all visitors, but with apronounced trough in September. Given the limited information on which thesecalculations are based, it is probably unsafe to draw any strong conclusions. ForKeoladeo, the pattern has the same broad shape, with relatively few visitors in thesummer months. However, their range of variation is less than for all visitors, thepeak in November and December being noticeably diminished. This result is due tothe pattern of visits by Indian nationals who show a very great propensity to visit inDecember.
These results support the contention made at the beginning of this section that thereare many influences on seasonal visit patterns and that these influences are specific tothe site being investigated. Management of any park will have to take into accountseasonal fluctuations and the associated problems of utilisation rates of facilities andin organising labour to cope with the extreme slack and busy times.
2.4 Conclusions
The growth of foreign tourism to the three countries is striking. Although one mustexercise caution when extrapolating exponential increases, the annual rates of growthof 15-16% for Indonesia and Zimbabwe imply a doubling period of just under fiveyears. The less spectacular growth rate of 6% per year in India will still result in adoubling of visitors every twelve years and is greater than the figure of 4.4% per yearfor the growth of world tourism as a whole over the period 1990-96 (see Chapter 1).Whether such rates can be sustained is open to question; however, the absolutenumbers of visitors are not yet that high (less that five million per year) when

30
compared with, say, tourist flows into European countries30. The decreasing costs oflong-haul travel, and the increased accessibility of locations previously consideredremote are established trends. Taking all these factors into account, it seems verylikely that visitor numbers to the national parks we have studied will continue toexperience strong growth. The management of the parks will, therefore, have to beprepared for a continued increase in visitors and the implications this has for both thetourists themselves and the impact on wildlife and habitat within the parks.
Although the overall picture may be one of growth, it must still be remembered thatindividual sites have very individual characteristics. We have seen, for example,greatly differing patterns of seasonality in tourism, and considerable variation in thepattern of visits by residents of the home country. The size, accessibility and thenature of the wildlife experience are also very different. It is essential, therefore, forthe park management to be very aware of both local conditions and of the greatchanges that are taking place in the global tourism industry.
2.5 Policy implications
1. National parks operate in an environment of rapidly growing world tourism.2. All three countries display rates of growth of tourism greater than the world
average (and are particularly high in Indonesia and Zimbabwe).3. There are no obvious limits on growth of visitor numbers in the immediate future to
the three countries we have analysed.4. Growth of visitor numbers to the three sites is comparable to the growth of foreign
tourism to the country as a whole, but is slightly lower in Keoladeo.5. Current rates of growth in tourist numbers will increasingly impact on park habitats.6. Visitor patterns to particular parks vary greatly in terms of seasonality and the mix
of domestic and foreign visitors. These factors are specific to individual parks.
30 The total number of tourists entering the countries of Europe in 1994 was 330 million, and into Spainalone was 43 million (WTO).

31
3. VISITOR IMPACTS AND MANAGEMENT
3.1 IntroductionNature-based, alternative, or ecotourism has been a growing subject area in the last25-30 years. The literature, and particularly that regarding tourism in protected areas,has expanded exponentially (figure 3.1). The Centre des Hautes Études Touristiques(CHET) at the Université de Droit, d’Économie et des Sciences d’Aix-Marseille holdsan electronic database of over 59,000 references associated with tourism, of which4,500 relate to tourism and parks, 2,750 to tourism and forests, 2,000 to touristcarrying capacity and 2,000 to ‘ecotourism’ (R.Baretje, 1996, pers. comm.).
0
50
100
150
200
250
300
1965 1970 1975 1980 1985 1990 1995
Figure 3.1. The number of volumes of tourism references compiled by CHET overthe past thirty years.
Recreation ecology has grown as a discipline over the same period of time. Numerousauthors have reviewed the literature concerning the environmental impacts ofrecreation and tourism (Wall & Wright, 1977; Mathieson & Wall, 1982; Edington &Edington, 1986). Each of these has served to provide an overview of the types ofimpact associated with recreation. Some have mentioned the limitations associatedwith visitor impact studies. However, the relevance and value of this area of researchin an applied sense, to wilderness (and particularly protected area) management, hasnot been critically assessed.
Whilst environmental impact assessments are often mandatory prior to thedevelopment of tourist infrastructure, the same cannot be said for the impact of visitoractivities in protected areas, particularly in the developing world. The development oftourism in protected areas is largely demand driven. Hence management plans, wherethey exist, deal primarily with defining the requisite development and necessaryresources to operate the park to the capacity demanded of it, rather than relying onprior surveys and impact assessments to define in advance a sustainable model of park

32
development. Where research is identified as a priority in management plans, thefocus is usually on the need for baseline research and monitoring, rather thanmonitoring anthropogenic disturbance. Where visitor controls are defined inmanagement plans, they are often subjective, rarely based on ecological evidence, andrarely implemented.
Studying visitor impacts in order to identify how to limit or prevent them has becomepopular amongst ecological scientists. But how applicable have the results been, howmuch do they reveal about visitor impacts, and what difference has this research madeto visitor impact management in protected areas? Aside from academic studies whichattempt to answer fundamental questions about visitor impacts, a second approach hasbeen to devise systems of management which take into account the uncertainties of acomplex relationship, acknowledging both the aesthetic implications of visitorimpacts, and the subjective nature of management. But how successfully have thesesystems been implemented in protected areas in developing countries?
This chapter discusses some of the existing research on visitor impact studies31, andconsiders whether the debate over the impact of tourism in protected areas isadequately informed by scientific evidence. Secondly, a brief review of visitormanagement practices, and research-based management systems, is presented. Theapplication of visitor management in protected areas in developing countries isdiscussed, and constraints to effective management identified. Thirdly, the issuesraised are illustrated by reference to the three case studies upon which the Tourism,Conservation and Sustainable Development Project is based, namely KomodoNational Park, Indonesia, Keoladeo National Park, India, and the south-east lowveldof Zimbabwe.
The clear message from this research is that, in order to ‘identify means of improvedvisitor management in order to decrease the adverse ecological effects of tourism’32,the adverse ecological effects of tourism first have to be recognised and measured.This demands the integration of comprehensive, continuous monitoring into protectedarea management, based on a system of quantitative and qualitative indicators uponwhich management can have an effect. Whilst visitor impacts may not appear to besevere in any of the three case studies upon which this project has focused, the rapidrises in visitation which are being witnessed will soon exceed the ability ofmanagement to deal with tourism. If these parks are to react to the potential impactsof increased visitation, those potential impacts must be monitored.
3.2 The limitations of research into the environmental impacts oftourism
The environmental impact of visitors constitutes a form of anthropogenic disturbanceof natural systems. Cayford (1993) defines this as ‘any relatively discrete event in
31 a comprehensive review of visitor impacts and management systems has recently been undertaken byIIED for the ODA (Roe et al 1997)32 principal objective (c) of this project.

33
time that disrupts ecosystems, communities or populations, where disruption refers toa change in behaviour, physiology, numbers or survival’.
A recent report from Australia noted that, despite extensive global research into theenvironmental impacts of tourism (primarily trampling), very little is really knownabout them, and integrated research, monitoring and management should receive highpriority from government funding sources (Preece et al., 1995).
Localised damage to vegetation, by trampling and vehicle tracks, is the most studiedaspect of visitor impact, with a wide range of investigations in different environments(Goldsmith, 1983; Preece et al., 1995). However, whether it warrants this attentionhas been questioned by some (Brotherton, 1981).
Studies in the UK have revealed marked effects of trampling at heavily visited beautyspots, and have shown that the amount of damage and extent of alteration of thenatural vegetation is dependent upon the intensity of trampling (Goldsmith, 1983). Thesensitivity of a site will also influence the extent of damage from trampling, so thatgeneral trends are difficult to establish. Soil fertility, drainage, relief, vegetation type,individual species tolerance and season will all affect the susceptibility of site todamage (Edington & Edington, 1986; Goldsmith, 1983).
The Maasai Mara National Reserve in Kenya is one of the most heavily visited inAfrica, with almost 200,000 recorded visitors in 1989, over 27% of all visitors toKenya (Koikai, 1992; Muthee, 1992). These visitors brought almost 24,000 vehiclesinto the park, for an average of 2.5 days each, leading to great concern over thepotential impacts on the landscape. A study by Wildlife Conservation Internationalrevealed that increased vehicle densities and increased speed correlated with a greaterloss of vegetation cover and increased soil compaction on the grasslands, that mostdamage occurred in the wet season, and that plant species composition changed withlong term vehicle disturbance. However, damage was localised along vehicle tracks,and limited to 15.3% of the area of the reserve. In addition, recovery of vegetation inexperimental plots was swift, taking around three weeks once vehicles were excluded(Muthee, 1992). An earlier study showed similar results (Onyeanusi, 1986).
Trampling effects appear to be generally understood. However, in surveying a rangeof trampling studies, Goldsmith (1983) complains that many are superficial oranecdotal, and that no framework for monitoring and evaluating disturbance is everprovided.
The same can be said for animal disturbance. Human impact on wildlife populationscan cause direct mortality or disturbance, the latter resulting in reduced feedingefficiency or reduced reproductive success (Pierce et al., 1993). However, it isdifficult to quantify animal disturbance, and even more so to show a significant impacton population dynamics. Chambers et al (1983) spent 67 hours over a twelve monthperiod searching for leopards in Ruhuna NP, Sri Lanka, in which time they made 16sightings. ‘Alarm’ was observed in 75% of sightings. Diurnal and seasonal activitypatterns were inferred to have been influenced by tourist vehicle densities, but nosupporting data was offered. Similarly, a study of the effect of baiting upon tigers inRoyal Chitwan NP, Nepal, was based purely on anecdotal evidence (McDougal, 1980)

34
Where quantitative data has been collected (primarily for birds), it is often so specificas to be of little relevance to understanding the wider consequences for the species.Whilst conceding that the reactions of migratory and wintering waterfowl todisturbance has been well studied and documented, Madsen (1994) criticises theapparent focus on local effects. Little is known about the wider significance oflocalised disturbance in terms of bird distribution, reproduction and populationdynamics.
Part of this lack of attention and understanding can be attributed to the problem ofisolating key variables. ‘So far, most studies of [bird] disturbance have beenobservational, with the associated problems of controlling for confounding effects anddetermining causal relationships’ (Madsen, 1994, p.68). This statement sums up thegeneral situation regarding studies of the recreational impact on wildlife. Very fewexperimental studies have been carried out, since manipulating and controlling fieldconditions is difficult (see Gutzwiller, 1991).
Cayford (1993) suggests that, whilst it is relatively easy to detect responses todisturbance (in wading birds), it is difficult to determine the impact this has onpopulation dynamics, partly because of the difficulty of isolating variables. Headvocates a comparative theoretical approach, based upon an understanding of thebehaviour and ecology of species in particular environments, but comprehensivebaseline data encompassing the range of natural variation in a particular situation israrely available. Cayford (1993) concludes that experimental manipulations may offerthe best method for studying disturbance and its ultimate implications. Madsen (1994)describes the establishment of experimental reserves to examine the impact ofrecreational hunting on wildfowl.
Experimental manipulation may not be practical in national parks. However, theimplementation of simple monitoring procedures based upon indicators ofenvironmental change would provide valuable data not only for adaptive management,but for fundamental understanding of the interaction of tourists with fragile andprotected ecosystems.
3.3 Visitor impact management strategiesThe concept of carrying capacity as a tool for defining the upper limit of visitor usebeyond which environmental degradation would occur was discussed widely in the1960s and ‘70s. However, in practice, carrying capacity proved very difficult toestablish, principally because of the difficulty of defining maximum limits in naturallydynamic systems; ‘it became evident that [carrying capacity] was simply notgenerating technically effective and politically viable solutions to visitor managementproblems’ (McCool, 1990).
In response to the practical difficulties of defining carrying capacity, a number ofresearch-based management planning systems were developed as alternative strategiesfor visitor management. Perhaps the most well known of these is the Limits ofAcceptable Change (LAC) system (Stankey et al., 1985). However, a number of othersystems exist, including Recreational Opportunity Spectrum (ROS), Visitor Impact

35
Management (VIM) and Visitor Activity Management Process (VAMP) (Graefe et al.,1990; Giongo et al., 1993). Each of these shares four principal planning steps:
• Determining the current situation• Deciding what situation is desired• Establishing how to get from the current to the desired situation• Monitoring and evaluating progress or success in attaining the desired situation33
In comparison with carrying capacity, the emphasis in these systems has moved fromdefining limits to the number of visitors, to defining the degree of change which isacceptable within the system. This refers to social as well as ecological factors, and isbased on evaluating the state of the system by reference to a number of suitableindicators.
Once indicator limits have been defined, direct and indirect site and visitormanagement strategies can be implemented. Direct tactics for limiting use includecontrolling overall volume of visitation, dispersing use patterns away from heavilyused areas, concentrating use patterns in designated areas away from fragile areas,seasonal closures at sensitive times of year, and spatial zoning by level and form ofuse. Indirect tactics include visitor education and raising awareness of impacts.
A questionnaire study was made of the implementation of visitor managementstrategies in 319 national parks around the world (Giongo et al., 1993). This revealedthat monitoring of biophysical impacts were only occurring in 50% of parks indeveloped countries, and in 35% of parks in developing countries. Direct managementtactics are employed in less than 50% of parks overall.
The conclusion reached by the authors of this study was that, in parks in developingcountries, ‘an adequate level of basic infrastructure, information exchange, andtraining must still be reached before visitor and resource management issues becomethe focus of attention.’ (Giongo et al., 1993, p.104).
3.4 Comparison of three country case studies
The following sections compare visitor impacts, and the monitoring and managementof these impacts, within each of the study sites. They draw on the three individualchapters in the individual country reports (Goodwin et al., 1997a,b,c,). Each of thesechapters attempts to assess the environmental implications of tourism within thecontext of the conservation priorities of the protected area in question, and theadditional environmental threats posed by external factors.
In the absence of comprehensive data sets spanning several years, and baselineinformation against which to compare the current situation, a fully quantitativeanalysis of the environmental impacts of tourism is difficult. A prolonged period ofecological fieldwork was beyond the scope of this project, and so an alternativeapproach was employed. 33 quoted from Giongo et al., 1993.

36
Information regarding visitor activities, impacts, monitoring and management wascollected using a questionnaire, administered as semi-structured interviews with keypersonnel, i.e. park rangers and managers.34 The format was adapted from theinstrument used by Giongo et al (1993) to examine visitor management in protectedareas globally. In addition, a rapid environmental appraisal of site and visitormanagement was carried out. This was conducted as a modified form of field transectwhereby a park ranger or other key personnel travelled around a site with aninterviewer and relayed details of management, impacts and mitigation in response tothe visual prompts of his surroundings. The interviewer also made personalobservations whilst undertaking these transects.
Besides the collection of factual information on the management and monitoring ofvisitor activities and impacts, the principal objective of the survey was to establish therelationship between tourism and the environment, and the relative importance oftourism impacts within the broader environmental context of the park and itssurroundings. To this end, interviews focused on the following series of questions.
• What are the conservation priorities, and other values, of the park?• What environmental problems does tourism present, and is it in
conflict with the conservation priorities of the park?• What are the other environmental threats to the park, how
important are tourism impacts in relation to other threats, and whatrelationships exist between tourism and other impacts?
• What would you change about tourism in the park, and why?
This discussion attempts to compare the results from each of the three individual studysites, and to draw broad conclusions where possible. For a fuller discussion of eachsite, see the individual country reports (Goodwin et al., 1997,a,b,c).
3.5 Visitor activities and their environmental implications
An overview of visitation patterns, activities, their environmental implications, foreach of the three national parks studied, is presented in Table 3.1.
There is a wide variation in annual visitation to each park, and in the level ofseasonality. Over 20 times as many people visited Keoladeo in December 1996 as didin June 1996. The seasonal difference in Gonarezhou is only a factor of 6, whilst inKomodo it is only three. There is also a substantial difference in the size of each park,with the smallest (Keoladeo) receiving the greatest number of visitors, and vice versa.Further details can be seen in Chapter 2.
However, the spatial distribution of visitors is concentrated into small areas of theparks, particularly Keoladeo and Komodo. In Keoladeo, the majority of visitors(c.60%) are local day-trippers who come to the park to picnic and remain on the tarroad and in the grounds of the temple. Foreign visitors include birdwatchers who 34 see Methodology report, Goodwin et al., 1996.

37
disperse more widely through the park. However, they are restricted to paths on thedykes separating the water bodies, and they rarely travel to the extremities of thepark. On Komodo Island, almost 98% of visitors remain within the intensive use zonebetween the visitor camp and the viewing site. On Rinca Island, distribution is morewidespread, but is still restricted to guided trails.
Gonarezhou is different from the other two parks. Visitation is primarily by vehicle,whereas visitation to Komodo and Keoladeo is primarily on foot, or onbicycle/rickshaw for the latter. In addition, access for visitors is more widespread,although still confined to roads. However, given the large size of the park and thesmall number of visitors, much of the park receives very little or no visitation.
Tourism infrastructure is minimal in all three parks. In Keoladeo, there is a lodge and apicnic area/kiosk, but both are in association with the tarred road running through thepark to the temple. Both Komodo and Rinca Islands, in Komodo National Park, havea coastal visitor camp and on the former there is a partially developed viewing area2km from the camp. In Gonarezhou, development is somewhat more widespread.There are two visitor centres, at Chipinda Pools and Mabalauta, and a number ofcampsites along the Runde River. There are also numerous platforms at pans forgame-viewing, but again, given the size of the park, this development is fairlyinsignificant in terms of its impact on the environment.
The environmental implications of tourism in each park show both similarities anddifferences. The difference in size and type of visitation to Gonarezhou separates itfrom the other two sites in a number of ways.
• In Komodo, visitors can only walk, whilst in Keoladeo they may also use cycles orrickshaws. The visitor trails are flat and predominantly dry in both. As a result,trail/road damage and soil erosion is minimal. The use of vehicles in Gonarezhou,and the more rugged terrain, is likely to result in much greater trail damage andsoil erosion at significantly lower visitation levels. Damage will be particularlysevere in the wet season when roads become muddy and rutted.
• In smaller parks with high visitation rates and restricted distribution, litter becomesa more visible problem. In both Komodo and Keoladeo the park authoritiesrecognise litter to be a source of environmental impact and a wildlife health riskwhich needs to be addressed. In Gonarezhou, there are fewer visitors, mostly daytrippers in vehicles who are more widely distributed. The reduced density ofvisitors means that litter is not perceived as a problem, but there is no evidence toshow whether it is accumulating or not. There is a risk of litter pollution atcampsites, which the park management is addressing.
• The impact of vehicles is naturally of more significance in Gonarezhou whichallows entry to cars. However, vehicle associated pollution is cause for concernfor the marine environment in Komodo, due to the increasing number of motorboats using the waters of the park.

38
• Consumptive use of wildlife by tourists only occurs in Gonarezhou, namelyfreshwater fishing. The unregulated offtake by recreational fishermen is a causefor concern, and some data suggests that current levels of offtake are affecting thepopulation dynamics of certain species. In addition, although not within the park,the removal of mahogany and other hardwoods for the production of handicraftsfor sale to tourists has virtually eliminated these species from local areas aroundcraft markets in the lowveld. The consumption of fresh water on Komodo Island isa constraint on the development of tourism, and may have as yet unforeseenenvironmental implications.
• Although the presence of vehicles can cause disturbance of wildlife, the restrictionof visitors to vehicles and platforms in Gonarezhou probably limits this. Also, thefocus of visitors on general game-viewing and the wilderness experience, ratherthan on a specific, sensitive species, probably limits wildlife disturbance in thepark. In Komodo, the focus on the dragon has resulted in some habituation anddisturbance of the species, but it is confined to a small proportion of thepopulation. Breeding and nesting is not disturbed. In Keoladeo, a market hasdeveloped for the disturbance of sensitive animals, notably pythons and tree-nesting birds.
Terrestrial habitat disturbance due to tourism is considered insignificant in all threeparks. However, in Komodo there is concern over damage to fringing coral reefsystems caused by boat anchors and snorkellers trampling on coral in shallow water.Whilst the former cause is being addressed, the latter has yet to be.

39
Keoladeo NP Komodo NP Gonarezhou NP
Area (km2) 29 75035 5,033Annual Visitation36 122,628 28,991 6,670Mean daily high season 883.2 130.3 38.3Mean daily low season 38.3 43.1 6.0Spatial distribution Widespread access, but
concentrated useConcentrated Widespread access, but
fairly concentrated useConfined to trails (y/n) Yes Yes Yes (mostly)Mode of transport Foot/
Cycle Rickshaw/Bicycle
Foot Motor vehicle/Foot
Roads Tarred/Graded None GradedAccommodation 1 hotel and 1 lodge 2 visitor camps with
cafeteriasNumerous campsites
Other infrastructure Kiosk, picnic areas Viewing enclosure Viewing platforms
ENVIRONMENTAL IMPLICATIONSTrail/road damage low low highHabitat damage low localised coral damage low, probably
associated withartificial waterholes
Wildlife disturbance python disturbance,nesting birds, Siberian
Cranes
dragon habituation unknown, considered tobe low
Litter problem perceived as high high, from boats restricted to campsitesVehicle pollution low, restricted from boats potential problemConsumptive use none freshwater fishing, firewood,
mahogany37
Non-tourismenvironmental problems
Considerable Considerable Considerable
Table 3.1 Visitation patterns, activities and their environmental implications foreach of the three national parks studied.
35 this refers primarily to the terrestrial part of the park. With the expanded marine area added to the parkin 1984, the total area is 2,193km2.36 April 1995-March 1996 figures37 outside of the park, but associated with tourism - see text.

40
3.6 Environmental Impacts in Context: Other Problems
In each of the three parks, there are other environmental concerns which to someextent outweigh those associated with tourism. In light of these additional problems, itis not surprising that visitor impact monitoring and management have not beenpriorities for park authorities. Tourism is seen as relatively benign in all three cases.However, a lack of monitoring and quantitative data lead to difficulties insubstantiating any claims that tourism is or is not having a significant impact.
In Keoladeo NP, the major factor influencing the ecology of the park is themanagement of flooding levels. In addition, changes to the regulations concerningusufruct rights have resulted in habitat changes, particularly in the wetland areas.Dryland areas appear to be declining as a result of increased flooding, and particularspecies are being displaced by alien competitors and as a result of overbrowsing. Somemanagement-related activities in the park (bulldozing, collecting of aquatic grasses)may be causing wildlife disturbance. Also, the presence of pollutants in the floodwaterwhich drains into the park is a severe health risk for aquatic bird species. Finally, theproblem of litter needs to be reiterated, since it is caused not only by tourists but byvillagers, forest guards and rickshaw drivers. Tourism does not appear to be rankedhighly as an environmental problem in the park.
In Komodo NP, the major environmental impacts within the park are associated withthe marine environment and the apparent over-exploitation of marine stocks byfishermen. Associated with this are the illegal practices of coral bombing andpoisoning of fish with cyanide. For the terrestrial environment, and the dragons inparticular, there are two related threats. One is the poaching of dragon prey species(principally deer) and the associated release of hunting dogs onto the islands whichturn feral. The other is the deliberate burning of the grasslands on the island bypoachers to flush out deer. Although fire is a natural phenomenon to which theenvironment is somewhat adapted, the increased frequency of man-induced firesposes a threat to the wildlife and the habitat of the park. Tourism is an added drain onmanagement resources, but in terms of its environmental impacts it is perceived asrelatively benign.
In Gonarezhou NP, the three major problems are drought, poaching and fire. The 1992drought resulted in massive wildlife mortality. The additional pressure of poaching bylocal people and Moçambiquean trespassers has resulted in a paucity of wildlife in thepark. Fire, sometimes started deliberately by poachers, tends to spread uncontrolledover large areas of the park. In addition to these problems, habitat management is aserious issue, with implications for the control of the elephant population which canseriously affect vegetation. Tourism is currently at a fairly low level and, althoughincreasing over recent years, is not perceived as a serious threat to the environment ofthe park. However, the park management are concerned at the extra resources whichwill be needed to deal with visitor impacts, particularly the restoration of roadsassociated with the opening of the park in the wet season.

41
3.7 Monitoring and Management of Visitor Impacts
Current levels of monitoring and management of tourism and its impacts for each ofthe three parks are shown in Figure 3.2. It is clear that no monitoring of environmentalimpacts of tourism is carried out at any of the three sites. Varying levels of detail arerecorded in the compilation of visitor statistics: for example, Komodo NP collectsdetailed information on nationality and more comprehensive visitor statistics foraccounting purposes, whereas Keoladeo NP records numbers in three categories(home, foreign and student).
Keoladeo NP Komodo NP Gonarezhou NP
Monitoring Visitor arrivals figures(home/domestic/
students)
Visitor use patterns,Dragon numbers at
viewing site
Visitor arrivals,overnight figures
Zoning Picnicking(infrastructure),
Birdwatching (natural)
Intensive use(infrastructure),
Wilderness (trails),Sanctuary (restricted)
Proposed but not yetimplemented
Controlling numbers No No NoAccess restrictions None Guide compulsory,
limited trail network.4WD necessary in wet
season, confined toroads.
Table 3.2 Monitoring and Management of Visitor Impacts in Each of the ThreeNational Parks Studied.
Whilst there is some form of zoning in place, in that visitors tend to be restricted tocertain areas of each park, there is no real control of visitor numbers or access. InKomodo NP, visitors must be accompanied by a guide whilst on the islands, but thereis no control over the volume of arrivals at any particular time. In the other two parks,visitors are free to move around by themselves, and again there is no control over thevolume of entry at any time.
It is unsurprising that little control is exerted over the volume and distribution ofvisitors in these parks. Tactics can only be implemented once a management strategyhas been defined, goals set and the system evaluated. In Keoladeo and Gonarezhouthere is an emphasis on revenue generation from tourism, not on sustainablemanagement. The former has revenue quotas to fulfil from tourism each year. Thelatter, whilst only recently re-opened for tourism, faces the probability of having tobecome self funded. This will place more pressure on revenue generation than onother concerns such as environmental management.

42
3.8 Conclusion and Recommendations
The environmental impacts of tourism in protected areas are recognised, but not wellunderstood. Much of the available information is descriptive/anecdotal, with little harddata and analysis. Most studies are of a short term nature, and long term impacts arerarely addressed. Where impacts are recognised, it is difficult to evaluate their widersignificance to species distribution, reproduction, population dynamics, andecosystem functioning.
The monitoring of environmental impacts of tourism is not carried out in the majorityof protected areas in developing countries. There is rarely any baseline data withwhich to compare current situations, and neither is time-series data available foranalysing trends. There is a lack of integrated monitoring and management, and nodefinition of indicators by which to evaluate the environmental performance ofprotected area tourism.
These general observations are all pertinent to the three national parks studied in thisproject. Whilst it is recognised that tourism may not currently be the principalenvironmental concern of protected area managers in these sites, and that tourismimpacts may be minimal or localised, there are specific areas of concern in each whichneed to be addressed. It is recommended that simple social and environmental impactmonitoring strategies be implemented, and controls on certain aspects of visitor use beenforced. However, it is also recognised that monitoring is unlikely to be implementedand maintained without the provision of staff, training and financial resources toundertake it successfully. It also needs to be part of an integrated monitoring andmanagement framework within which the adaptive management of tourism, withinsocial and environmental parameters, is seen as a priority.
These issues are similar to those identified by Bell (1984) in relation to researchpriorities in terrestrial protected areas. Bell noted the following;
• ‘Research is expensive in money and manpower and must, therefore, concentrateon questions for which answers are needed by management to achieve its goals;
• However, there is a logical difficulty in identifying research priorities, the researchpriority paradox, due to the fact that, if one does not understand a system, onecannot identify priority components for study;
• Research cannot be separated from management; these two types of work form acontinuum of activities operating together in a system of adaptive management;conservation agencies should be formally structured to operate with integratedadaptive management teams as the basic functional unit.’38
Bell goes on to state that monitoring is a basic feature of adaptive management, butthat it is only valuable where: 38 Bell, 1984, p.81.

43
• ‘the data are actually being used, and;
• the [management] objective[s] of an area [are] specified (as they should be) interms of the states of components of the system.’39
The latter point is the principal upon which the LAC system of wilderness planning isbased (Stankey et al., 1985). Bell concludes with a call for increased and improvedstaff training in order to establish adaptive management strategies in protected areas;
‘To discuss research priorities for wildlife management and conservationis to sculpture the tip of iceberg. What is needed, in my view, is a generalre-education of conservation agencies as a whole to the concept ofadaptive management.’40
39 Bell, 1984, p.86.40 Bell, 1984, p.90. Giongo et al., 1993, p104.

44
3.9 Policy implications
1. Monitoring of impacts within parks has been very limited; there is little base-linedata with which to make comparisons.
2. Visitor impact is not perceived as a significant problem by park management,especially in comparison with the issue of relations with local people.
3. Unregulated guiding can seriously exacerbate problems of disturbance.
4. Park-management policy needs to be based on a clear strategy which is informedby the aims and objectives of the parks.
5. Research and monitoring must be consonant with the management objectives of theparks.
6. An adaptive management strategy should be adopted based, for example, on theLAC system of Stankey et al. (1985).

45
4. CONTRIBUTION OF TOURISM TO PARK FINANCES
4.1 IntroductionProtected areas have a number of purposes, the most important of which is theconservation of habitat and species. Myers41 argued, in 1972, that tourism providedan incentive for conservation through the establishment of national parks andBudowski42 argued that a symbiosis could be created between conservation andtourism. Since tourism is in part based on values derived from nature it could providean economic value for the conservation of habitats and their species. In 1982 theIUCN accepted that the tourist potential of an area is one consideration in theselection of protected areas. Philips43 argued that tourism provides conservation withan economic justification , a means of building support for conservation and a sourceof revenue. However, the IUCN44 has cautioned that many areas of importantconservation value have little appeal for tourists and that the pursuit of tourismrevenue may result in inappropriate development.
Demand for nature tourism has been expanding rapidly, and it has been argued thatnature tourism can be turned into ecotourism by securing both direct and indirectrevenue for conservation.45 This section focuses on direct revenues, money whichflows from park visitors directly to the park authorities. However, a direct revenuemaximisation strategy may have a serious negative impact on indirect revenues, thoseaccruing to local people. Protected area managers and policy makers need to considerthe maximisation of both direct and indirect revenue together and to remember thatnational parks have important other (non-financial ) functions including theconservation of biodiversity.
Our purpose was not to establish the value of parks46 nor the value of tourism to thenational economy, nor can our data be used for that purpose. For example, we havemade no effort to calculate the foreign exchange earnings accruing to the nationaleconomy,47 nor to identify the costs of travel nor of revenues and margins accruing tonationals living away from the immediate area of the national park. We have notsought to measure the economic impact of tourism but rather to identify the immediatedirect benefits and costs of tourism to conservation, in and around the three nationalpark case studies in terms of entrance fees and other revenues accruing to the parkauthorities from tourism.
This section deals with the finances of the three case study national parks and thecontribution of tourism to them.
41 Myers (1972).42 Budowski (1976) .43 Philips (1985).44 MacKinnon et al (1986).45 See above Chapter 1 and Goodwin (1996)46 No attempt was made to determine non-use values (existence, future use or bequest values)47 There are a number of strategies available to governments which could be used to increase revenuesincluding a tourism tax, a development of the bed levy which some countries already charge to fundtourism promotion. A tourism tax would ensure that visitors made an appropriate contribution for theiruse of the country.

46
objectives a) and b)“identify methods of providing sustainable revenues from tourism for conservation ..”and of providing “increased revenues whilst conserving local ecology andbiodiversity.”
scientific and technical objective c):“identify the net contribution of tourism development to conservation and restoration,and assess the commercial and regulatory conditions necessary for increasing thatcontribution.”
Protected areas are regarded in all three countries as important national assets butthey are coming under increasing pressure to finance themselves. Governmentexpenditure is limited and there are competing demands on national treasuries. Thesepressures increase where the primary users, and therefore the principal userbeneficiaries, of the parks are foreign tourists and the domestic tourism industry,rather than local people.
Gonarezhou,Chipinda Pools, 1995-6
Keoladeo Komodo
% domestic visitors 53.4 70 7% foreign visitors 46.6 30 93
Table 4.1 Domestic and foreign visitors to the national parks (%)
Charges for access to national parks, and for the use of the accommodation facilitiesin the parks, has traditionally been based upon the philosophy that the nationalheritage should be available free, or at a nominal charge. National parks have beenpriced as merit goods. Income maximisation has not been an objective ofgovernment policy and entrance charges have been set by governments often withsocial or educational objectives in mind. Park revenues are generally below parkoperating budgets and entrance (and other) fees are often below what visitors wouldbe willing to pay. In Zimbabwe, at peak periods, the allocation of chalets has beendecided by a bureaucratic rationing system, graphically demonstrating the existence ofexcess demand at current prices. In India there is considerable crowding at weekendsand public holidays.
The increase in international tourism has raised the issue of whether nationalgovernments should be subsidising the use of its natural heritage by more affluentforeign tourists. In a developing country with limited budgets should parks “beviewed as a public amenity or as a more or less self-supporting enterprise contributingas much as possible to rural development.” “This raises the moral question as towhether the state can afford to support the leisure of its more affluent citizens andforeign visitors.”48 Undercharging increases the cost to the national treasury ofmaintaining the parks estate and fails to maximise revenue, much of it in the form ofbadly needed foreign exchange.
48 Child G & Heath (1990).
47
However, with national independence and the consequent democratisation of policy-making processes, money available for the maintenance of protected areas has beensqueezed by the pressure for increased expenditure on health, welfare anddevelopment amongst other government priorities. In the 1980’s the constraints ongovernment expenditure became more severe and in Zimbabwe, for example, theEconomic Structural Adjustment Programme (ESAP) was introduced in 1990.Increasingly Protected Area Managers (PAMs) have looked to nature tourism as apotential source of revenue for conservation and as a means of enabling local peopleto gain sustainable economic advantage from their proximity to the national park.These two objectives are not incompatible, but they are mutually self-limiting and, fora given total revenue, inversely related.
A merit goods pricing strategy may also undercut private sector entrepreneurs. InZimbabwe, where there are initiatives on both communal and commercial farm land,the issue of the undercutting by government of other providers has been raised. It isargued that low admission charges for national parks distort the market and constrainwhat can be charged for other non-consumptive wildlife enterprises on communal andcommercial land.
It is not yet possible to identify a net financial contribution to conservation for theconservancies which form a major part of the south-east lowveld case study.Currently all three conservancies are financially dependent upon inward investmentand all are some way from achieving a sustainable economic position. However, theconservancies have been successful, through a change of land use, in investingsubstantial capital sums into biodiversity and through direct purchase into a broadrange of game.
National parks exist to conserve national heritage and in all three countries it isconsidered important that pricing structures in national parks do not lead to theexclusion of citizens. If fees are raised significantly a system of dual pricing may benecessary to ensure that nationals continue to have access to their heritage. This canbe provided either by dual pricing or by single tier pricing with a substantial discountfor citizens. Whilst some foreigners will take offence, the argument that nationalparks are maintained at the expense of the nation’s citizens needs to be put.
In India and Zimbabwe there is dual pricing, recognising that nationals alreadycontribute to the maintenance of parks through the national treasury and that theybear the opportunity costs of the land use decision. Foreign tourists and day visitorsare also considered to be able to pay higher entrance fees than local people. AtKeoladeo foreign tourists49 were asked whether they agreed that “foreigners shouldpay more at the entrance than Indian taxpayers”. Over half (57.2%) said that theyshould.
49 Sample: 786 respondents.

48
Gonarezhou Keoladeo KomodoZ$ US$ Rupee US$ Rupiah US$
National 10 0.90 5 0.14 2000 0.83International - 5 25 0.70 2000 0.83
Table 4.2. 1997 Daily Park Entrance Fees at March 7 1997 exchange rates
The national contexts vary significantly and the purchased experiences are not readilycomparable, nonetheless it is clear that entry charges vary considerably. Aninternational tourist at Keoladeo pays less than a national at Gonarezhou.
In none of the three national parks which form the focus of this study was there anydirect linkage between the revenues collected by the national park and its operatingbudgets. Gonarezhou, Keoladeo and Komodo were all run, and financed, bygovernment departments50 during the period of this study. Presently decisions aboutthe pricing of admission to national parks are made by government for the national,provincial or state system of parks. India sets its entrance fees at the state level andthey are of the same order of magnitude at all parks in the same state. In Indonesiathere is variation in entrance fees between parks, but as they do not operate a dualpricing , or two tier system, fees are uniformly low. In none of these countries areentrance fees subject to market forces.
Zimbabwe has two fee structures for category I and II parks but the entrance fees arethe same for Hwange, Victoria Falls and Gonarezhou. There is no relationshipbetween demand and entrance charge. There were substantial increases at the end of1996 as the DNPWLM became a fund-holding parastatal and had its funding capped.However, park entry charges are still set centrally and bureaucratically rather thanbeing set locally and in response to market forces. The price rises announced inOctober were reduced in January, although the increases were still significant,51 and itis clear that the DNPWLM is moving towards a revenue maximisation strategy. Theimpact of these changes is difficult to predict and they fall wholly outside our surveyperiod.
As administrative units, the three parks are very different in size, staffing levels andbudgets.
Gonarezhou,Chipinda Pools, 1995-96
Keoladeo1995-96
Komodo1994-95
Area of the Park 505,300 ha 2,873 ha 219,322 haTotal visitors 6,179 122,628 28,991Full-time Staffing 51 123 90Tourist Staff 9.5 30 21Park Budget US$ 110,522 295,426 372,285
Table 4.3. Comparative table of size, staffing and park operating budgets,
50 In Zimbabwe by the national government, in India by the national and state governments and inIndonesia by the national, provincial and district authorities.51 See Chapter 4 in the Zimbabwe report.

49
4.2 Park RevenuesFor the period of this study52 all revenues to the national parks were remitted to thecentral treasury. There was no direct linkage between earnings and budgets, althoughKeoladeo has income targets. Tourism is not the only source of non-grant revenue toparks, although it is the most significant (Table 4.4). In all the comparative tableswhich follow the “block fee tour operator” revenues at Gonarezhou are excluded.Until the end of 1996 tour operators at Gonarezhou paid a block fee for eachregistered vehicle which also covered entrances for passengers. Passengers did notcount in admission figures and they made no contribution to the park revenues on aper visit basis.
Gonarezhou,Chipinda Pools, 1995-6
Keoladeo Komodo53
Tourism Revenue 90.48% 89.7% 100%Non-tourismRevenue
9.52% 10.3%
Table 4.4. Tourism and Non-tourism Revenue.
The three parks earn revenue from tourism in significantly different ways. Table 4.5 isincomplete because it has not been possible to find, or disaggregate, data for all therelevant forms of tourism expenditure in the three parks. In Komodo the tourismservices are provided by the Koperasi54 and only the entrance fees accrue directly tothe park. In Keoladeo the services are provided by concessions or by individualsoperating in the park under permit and the revenue does not accrue to the parkdirectly. However, it is clear from Table 4.5 that revenues from entrance fees varybetween 38% and 48% of total tourism revenues. Accommodation varies between5% at Keoladeo and 49% at Chipinda Pools, Gonarezhou. This is a function of visitorpatterns (number of people staying overnight in the park) and the organisation oftourism. At Keoladeo the park authorities receive concession fees from the ForestLodge, at Chipinda Pools the DNPWLM provides camping, at Komodoaccommodation is provided by the Koperasi but significant numbers of tourists stayovernight because of the remoteness of the park, although many stay on boatsoffshore. For a full discussion of these issues see the case studies.
52 The situation changed in Zimbabwe on 1st January 1997 when DNPWLM became a parastatal.53 For the purposes of these comparisons the Komodo Koperasi has been treated as part of KNP.54 The staff co-operative at Komodo National Park.

50
1995-6 Gonarezhou,ChipindaPools,
Keoladeo Komodo
Sales 3.5 Concession KoperasiVehicle Hire n/a 8 n/aTrails/guiding 0.7 Individuals 24.0Concessions andPermits
1.6 7 n/a
Other n/a 32 KoperasiAccommodation 49.0 5 37.5Entrance Fees 45.2 48 38.5
Table 4.5. Tourism revenues excluding tour operator fees (%), figures in boldaccrue directly to the park authorities. 55.
Different types of tourists spend different amounts in the park and purchase differentservices. For example in Komodo National Park foreign tourists arriving on the ferryfrom Sape are estimated to spend an average of US$6.2 per visitor on entrance fees,guiding and accommodation. This compares with US$2.1 for those arriving on acharter boat from Sape, and US$1.33 for those arriving on a cruise boat.56
The differences in the purchase of services is marked. For example at Keoladeo over80% of the backpackers hire a bicycle, compared to about 10% of the packagetourists. Just under 30% of the package tourists pay for a boat trip, compared to 20%of the backpackers. 80% of the package tourists hire a cycle rickshaw, compared withabout 40% of the independents and 20% of the backpackers. 50% of package touristshire a guide, while less than 20% of the backpackers do.57
4.3 Park Expe nditures
Gonarezhou,Chipinda Pools, 1995-6
Keoladeo1995-96
Komodo1994-5
Park Budget US$ 110,522 295,426 372,285Tourism Related US$ 14,042 36,177 24,485Non-Tourism Related US$ 96,480 259,249 347,800Tourism Related % 12.7% 12.2% 6.5%
Table 4.6. Comparative Table of Park Expenditures, Tourism and Non Tourismin US$
It is very difficult to estimate and allow for repairs and renewals (there are norecorded budgets for this), so these figures can be regarded only as indicative of the
55 Fees paid by tour operators at Gonarezhou have been excluded because they distort the comparisons,see Chapter 4 in the Gonarezhou Report for details.56 For full details see Chapter 4 of the Komodo Report.57 For full details see Chapter 4 in the Keoladeo Report.

51
proportions of the operating budgets being spent on tourism in the parks. It is clearthat the tourism related park expenditures are a relatively small part, between 6.5%and 12.7%, of the total cost of maintaining the parks.
4.4 Revenue and Expe nditure Comp aredWith mounting pressure on parks to become more reliant on their own earnings, if notyet fully self-financing, it is necessary to consider the relationship between tourismincome and both tourism related expenditure and total park expenditures. At thebeginning of 1997 the DNPWLM in Zimbabwe became a fund-holding parastatal andis at the beginning of a transitional period to self-sufficiency. There is discussion atKeoladeo and Komodo about the possibility of becoming more self-reliant, althoughcurrently at both these parks revenue is remitted to the treasury and they receivefunding as grant from government.
One perspective holds that a national park is maintained solely for the benefit oftourists, whether those tourists are foreign, national, or local. Those who hold thisview argue that the parks are designed to meet the needs of visitors, whether they areholiday makers or visiting scientists. All the direct costs of the park are thereforeincurred for tourism. Table 4.7 presents the park finances from this perspective.From this point of view each visit is subsidised by between US$.1.84 or US$15.78.
Gonarezhou,
Chipinda Pools, 1995-6
Keoladeo
1995-96
Komodo
1994-5
Park Budget US$ 110,522 295,426 372,285
Tourism Revenue US$ 12,988 69,659 26,701
Net Expenditure US$ 97,355 225,767 345,584
% “deficit” 88.2% 76.4% 92.8%
Subsidy per visit US$15.78 US$1.84 US$13.40
Table 4.7. Tourism Revenue as a Percentage of Total Park Expenditure
The second perspective is of those who recognise that the parks have a range ofpurposes other than tourism, and argue that it is the tourism related costs which shouldbe covered by tourism revenues - there are of course a range of views which can beheld between these two positions.

52
Gonarezhou,
Chipinda Pools, 1995-6
Keoladeo
1995-96
Komodo
1994-5
Tourism RelatedExpenditure US$
14,042 36,177 24,484
Tourism Revenue US$ 12,988 69,659 23,446
Net Expenditure US$ +1,054 -33,482 +1038
Net Expenditure per visit +US$0.17
(subsidy)
-US$0.27
(contribution)
+US$0.04
(subsidy)
Table 4.8. Tourism Revenue as a Percentage of Estimated Tourism Related ParkExpenditure
The results displayed in the two tables (4.7 and 4.8) show the extremes generated bythese two points of view. If all costs are deemed to provide benefit for the visitor,then what the tourist pays only covers a very small part of those costs. As a result, alarge subsidy can appear. If a strict definition of tourism-related expenditure isadopted, the calculated subsidies for Gonarezhou and Komodo decrease greatly, andvisitors to Keoladeo now appear to be making a net contribution to park costs.However, it should be remembered that this is an extreme interpretation. Visitors toKeoladeo do not visit the park in order to enjoy only those facilities provided as aresult of tourism-related expenditure (staffing of the gates, administration of ticketsales, provision of picnic area etc.). Their prime interest is in viewing the birdlife, andthat birdlife would not be at Keoladeo were it not for the fixed, non-tourist-relatedcosts concerned with the provision and maintenance of the habitat itself. Theapportionment of fixed costs to different users is always a problem in accounting, andnational parks are no exception. The calculations presented here draw attention to theissue, but cannot offer any clear-cut choice of which is the better approach.
4.5 Increasing Park Revenues
4.5.1 Entrance FeesEntrance or admission fees set the price of access to the park and may be used toprovide revenue and control the numbers of people entering the parks. To the extentthat they can be used to control the numbers and types of tourists entering the park,entrance fees are one of the management mechanisms available to managers inseeking to maintain the ecological integrity of conserved areas58.
The entrance charges to national parks are not set by markets, and for this reasoneconomists have to use a range of substitute mechanisms for making judgements aboutthe economic value of national parks. All such techniques have considerable
58 Laarman and Gregersen (1996) question the viability of such management mechanisms.

53
methodological weaknesses. Two non-market valuation methods were considered:Contingent Valuation and Travel Cost. We decided not to use the Travel Costmethod. For most tourists the case-study national park was only one amongst anumber of sites to be visited during their trip and tourists were travelling with a rangeof motivations.59 For many of the independent and backpacker travellers, decisionsabout whether or not to visit are made in-country rather than prior to departure; atboth Keoladeo and Komodo a significant number of travellers stopped as they passedby. Keoladeo is on the “golden triangle” between Agra and Jaipur, and Komodo is onthe route east of Bali to Australia.
There is limited market evidence of the value of national parks. The average cost of atwo night trip to Komodo National Park from Lombok or Bali is US$30060, althoughthe park entrance fee is less than US$161. A major UK package tour operator wasoffering a 7 night tour from April to October 1997, including room, breakfast and localexcursions with guides at a cost of £495. Keoladeo was available as an optional half-day excursion, including transport and lunch for £29; the park entrance fee was 25Rupees (£0.4362). For comparative purposes a half day tour to Sikandra (Akbar’sMausoleum) with no lunch was priced at £18, Fatehpur Sikri (Akbar’s abandonedcity) with no lunch was priced at £24. The operator has placed comparative marketvalues on these excursions and in so doing has demonstrated that for this group oftourists the entrance charge for the park is an insignificant element of the cost of thetour.
4.5.2 Entrance Fees: Willingn ess to PayThe price of entrance to the parks has not been traditionally set by the market, and itis likely that visitors would be willing to pay considerably more to visit. Themagnitude of this ‘user surplus’ has been examined using contingent valuation, aneconomic valuation technique which constructs a hypothetical market by exploringthe response of visitors to hypothetical rises in entrance fee. We have not attemptedto calculate user surplus per se, since the figure itself is of little practical use. We usethe method purely to demonstrate the capacity for increased revenue generation byincreasing fees and to illustrate the differential effects which arise from the impact ofentrance fee increases on different types of tourists.
The Contingent Valuation method was used to test the response of visitors tohypothetical entrance fee increases. In each park a series of questions aboutwillingness to pay were included in the tourist surveys. Details of the questions askedand of the results are to be found in the country reports along with a discussion of theresults in the local context.
It is clear from both the Komodo and the Keoladeo data that there is significantvariation in willingness to pay amongst different types of tourists and that the impact 59 The motivation data is considered in section VII. The primary motivation for travel was culture inIndia and Indonesia, wildlife was the primary motivation in Zimbabwe, in India it came second toculture, in Indonesia it came third after culture and landscape.60 Approximately £20061 Approximately £0.6762 At 7 March 1997 exchange rate 57.5318Rp to £1.
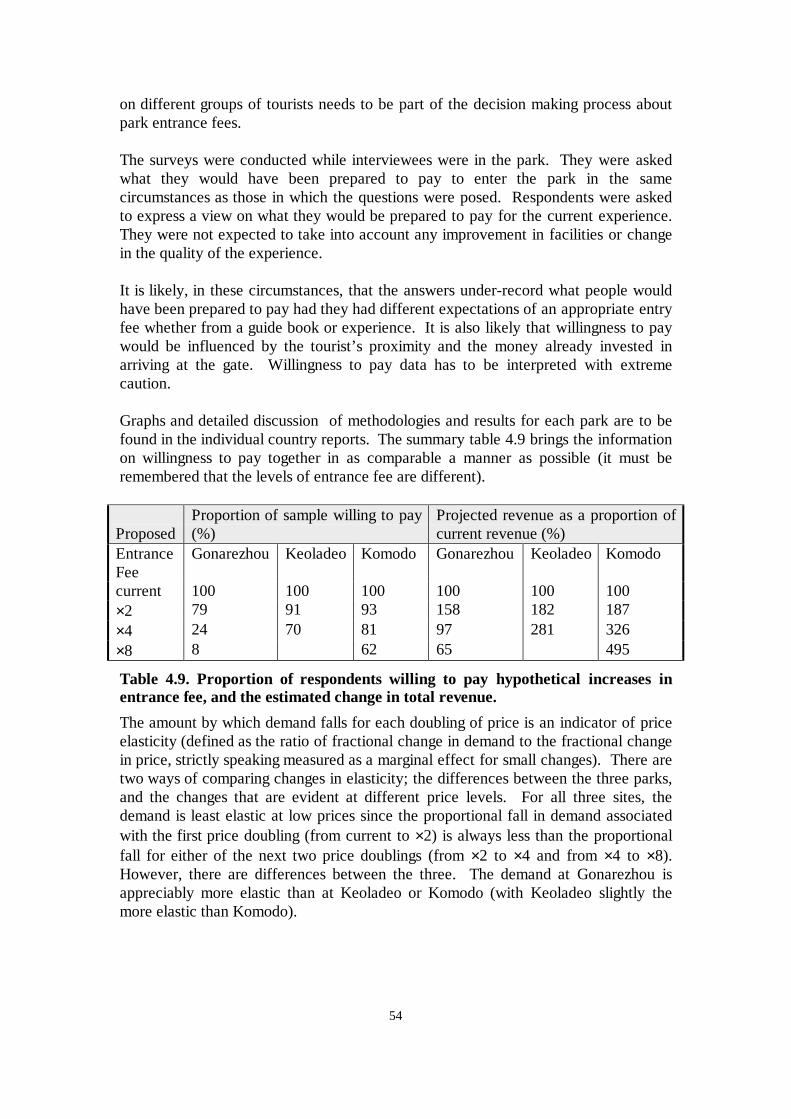
54
on different groups of tourists needs to be part of the decision making process aboutpark entrance fees.
The surveys were conducted while interviewees were in the park. They were askedwhat they would have been prepared to pay to enter the park in the samecircumstances as those in which the questions were posed. Respondents were askedto express a view on what they would be prepared to pay for the current experience.They were not expected to take into account any improvement in facilities or changein the quality of the experience.
It is likely, in these circumstances, that the answers under-record what people wouldhave been prepared to pay had they had different expectations of an appropriate entryfee whether from a guide book or experience. It is also likely that willingness to paywould be influenced by the tourist’s proximity and the money already invested inarriving at the gate. Willingness to pay data has to be interpreted with extremecaution.
Graphs and detailed discussion of methodologies and results for each park are to befound in the individual country reports. The summary table 4.9 brings the informationon willingness to pay together in as comparable a manner as possible (it must beremembered that the levels of entrance fee are different).
ProposedProportion of sample willing to pay(%)
Projected revenue as a proportion ofcurrent revenue (%)
EntranceFee
Gonarezhou Keoladeo Komodo Gonarezhou Keoladeo Komodo
current 100 100 100 100 100 100×2 79 91 93 158 182 187×4 24 70 81 97 281 326×8 8 62 65 495
Table 4.9. Proportion of respondents willing to pay hypothetical increases inentrance fee, and the estimated change in total revenue.
The amount by which demand falls for each doubling of price is an indicator of priceelasticity (defined as the ratio of fractional change in demand to the fractional changein price, strictly speaking measured as a marginal effect for small changes). There aretwo ways of comparing changes in elasticity; the differences between the three parks,and the changes that are evident at different price levels. For all three sites, thedemand is least elastic at low prices since the proportional fall in demand associatedwith the first price doubling (from current to ×2) is always less than the proportionalfall for either of the next two price doublings (from ×2 to ×4 and from ×4 to ×8).However, there are differences between the three. The demand at Gonarezhou isappreciably more elastic than at Keoladeo or Komodo (with Keoladeo slightly themore elastic than Komodo).

55
At all three parks, a doubling of price leads to an estimated fall in demand of no morethan 21% (at Gonarezhou63). However, the figures suggest that a four-fold increasewould lead to a much greater reduction in visitor numbers in Zimbabwe than in theother two parks, dropping to around one quarter of its original level. Such figuresshould not be judged in isolation from the current absolute level of entrance fees (seeTable 4.2). It is clear that visitors to Gonarezhou are paying five to seven times asmuch as visitors to Keoladeo and Komodo, though it must be remembered that thelength of stay is longer. It is not surprising, therefore, that a four-fold rise in entrancefee (to around US$20) would have greater impact than a four-fold increase at theother parks (to around US$4-6).
For Komodo National Park the demand is relatively insensitive to a four-foldhypothetical increase in entrance fee. Analysis of the data suggests that members ofconservation organisations, older people, and those who had seen a significantlyhigher number of ‘dragons’ were all more likely to be willing to pay higher entrancefees. Those willing to pay higher entrance fees were also those who were paying morefor their trip to Indonesia (and staying for a shorter time in Indonesia) and those with asignificantly longer stay in the park.
For Keoladeo the demand for entrance is relatively inelastic for a doubling in entrancefees, but more elastic than Komodo for a four-fold increase. A discussion on thedifferential impacts of entrance fee increases at Keoladeo follows in 4.5.4.
There is anecdotal evidence that the response of tourists to increases in parkadmission fees would be more favourable if rises were incremental and if it was clearthat the money raised would be
• reinvested in parks for conservation• reinvested in visitor facilities to raise the quality of the experience• used to offset costs• used to the benefit of people living in, or near, the park.
4.5.3 Entrance Fees: Tour Op eratorsFor travellers entering the parks as part of a ‘package trip’, whether the package waspurchased in the originating or destination country, the cost of the park entrance ismarginal to the total cost of the park visit. Decisions about the content of the tourpackage will be made by the local or international tour operator on behalf of the parkvisitor.
At the workshop in Bharatpur in September 1996 incoming operators in India wereasked what they felt would be a reasonable entrance fee. The average figure from thetour operator survey was Rs82/- (US$ 2.3). Their comments included ‘would notaffect our business’, ‘fee is not so important’, ‘raising the fee to Rs100/- (US$2.8)would not affect the price of the tour’ and ‘the rise in fees …. should beproportionate to the enhancement of the product experience.’ They felt strongly thatany increase ought to be staged and that it ought to be made clear what the increasedrevenue was being used for. A notice at the main gate and elsewhere making clear
63 Based on the cost normally incurred by small groups travelling together in a private vehicle andintending to camp.

56
that the increased revenue was being used for conservation measures in the park or forlocal development projects would, in their view, significantly reduce the hostilitylikely to be engendered by entrance fee increase.
Indonesian operators were also asked how a five fold increase in entrance fee wouldaffect their business. A five fold increase in fee was not considered a problem,although the feeling amongst some respondents was that the price itself was not asimportant as the way that the revenue was used. According to one operator, structuraladjustments should be made to allow the park to retain its entrance fee revenue. 80%of respondents said that a fee of Rp10,000 (US$4.33) would not affect their business,since this only represented 1-2% of the cost of a typical package. This suggests thatdemand is even less elastic for package tourists than it is for independents.
At Gonarezhou tour operators are charged a “block fee” for operating in the park.This makes a significant difference to the park finances, Chapter 4 of the GonarezhouReport includes a discussion of tour operator revenue to the park, particularly in thecontext of the increase in fees introduced in January 1997.
4.5.4 Revenue Maximisat ion?This data must be interpreted with extreme caution and each park must be consideredindividually. There is a detailed discussion of each of the parks included in thisproject in the country reports.
There are considerable uncertainties attached to the methodology and inherent in thehypothetical nature of the inquiry. People are asked how their behaviour wouldchange in response to one hypothetical change. They may behave otherwise, and inany event it is unlikely that other changes would not have taken place by the time feeswere raised.
We do not advocate a rise in entrance fees to maximise revenue to a particular park.We present the data only to indicate that there is potential to raise revenue by raisingfees. The pursuit of self-interest by a park should be tempered by the likely effects onthose who make all or part of their living from tourism to the park locally ornationally, and on the local and national economy. There is considerable potential forexacerbating conflicts between parks and their local communities through price rises.The detailed figures from the Keoladeo research can be used to illustrate the point.

57
Self Ascribed Category Visits made
Rs /- US$ AllVisitors
PackageTourists
Independent.Travellers
Backpacker 3 orless
4 ormore
50 1.43 91% 97% 89% 87% 91% 91%
75 2.14 81% 94% 78% 70% 82% 76%
100 2.85 70% 87% 69% 52% 72% 52%
Table 4.10. Keoladeo National Park proportion of respondents prepared to payhypothetical increases in entrance fee by self-ascribed category of tourist andnumber of visits made
The comparative data in table 4.10 shows the impact of increases in park entrancefees on different types of tourists. It indicates that the impact on package tourists islimited; entrance fees are invisible in the overall price of the tour. For theindependent and backpacker tourists the anticipated effects are more marked. Thedifference between them is probably attributable to the planned daily budgets withinwhich they operate. Those who make more visits to the park, mainly the keen birders,would be more affected than those who make fewer visits to the park. By contrast atKomodo visitors pay a single entrance fee for up to 7 days. Those staying longer areless affected by hypothetical increased entrance fees (see Table 4.9).
The consequence of Keoladeo following a revenue maximisation strategy would be tochange the profile of visitors to the park. Reductions in the number of independenttravellers and backpackers would have significant effects on the local tourismindustry, on the hotels, restaurants and other enterprises which service the tourists64.The impact of entrance fee increases on the rickshaw operators and the guides wouldbe to adversely affect their incomes. There would also be secondary revenue effectsin the park itself, particularly on bicycle hire and use of the boat. There is a detaileddiscussion of these effects in Chapter 4 of the Keoladeo case study.
4.5.5 Other Sources of Fee Income to ParksThere are a range of services and facilities for the use of which tourists are preparedto pay during their visits to national parks, each of which may provide an opportunityto improve the quality of the visitor experience and generate additional resources forthe park. The individual case studies deal with a range of these. They includeaccommodation and camping fees, guide services, boat trips, and cycle hire. In somecircumstances it may be possible to rent out platforms and hides, as at Gonarezhouwhere fees are charged for their overnight use. At Keoladeo revenue is earned fromthe permits required by the rickshaws, and Gonarezhou issues fishing permits and sellsfirewood. There are also opportunities to let concessions and to sell souvenirs andliterature about the parks.
64 The package tourists are least likely to stay in Bharatpur.
58
4.5.6 Policy Considerat ions.A number of considerations need to be taken into account in the process of decidingon park admission fees.
1. What is the appropriate revenue goal2. Is the objective income maximisation?3. Is the objective to raise revenue to share with local communities?4. Is the objective to cover the costs of tourism to the park?5. Is the objective to improve visitor facilities?6. Is the objective to make national parks self-financing?7. Is the objective to reduce subsidies to foreign visitors?8. Should the visits of particular host population groups be subsidised?9. To what extent is it appropriate to have national charges?10. Should decisions about fees be decentralised and set site by site?11. To what extent is it important that national parks show their use value (or
their lack of use value) through demonstrating people’s willingness to payto enter and use the park?
12. What are the implications for local communities, and for park-peoplerelations, of any projected changes in visitation patterns which would resultfrom changes in admission charges?.
13. Will changes in park visitation patterns adversely impact on particularsections of the host community, causing hardship and adversely impactingon the already strained relationships between parks and local people?
4.5.7 Policy Implications
1. Traditionally, decisions about the entrance fees and other park charges have beenmade by government departments; this remains the case in the three countriesincluded in this study. There is no direct relationship between park revenues andpark budgets.
2. Parks have a number of purposes, the most important of which is the maintenanceof the ecological integrity of the park and the conservation of habitat and species.Visitor fees income should be supplementary rather than core income, themaintenance of biodiversity for future generations could be considered as properlya government responsibility.
3. Entrance and other fees need to be structured to ensure that the host population is
able to have access to its national parks for recreational, spiritual, artistic andeducational purposes; national parks are their national heritage. There is a goodcase to be made for dual pricing systems.
4. Parks departments have traditionally been regulators of use rather than operators.The two roles should not be confused.

59
5. In the pursuit of increased revenues from tourism park managers need to considerthe purposes of the park(s) for which they are responsible and to balance a numberof competing management goals, arguably the first of which is conservation.
6. The setting of park entrance fees is one aspect of the total management of nationalparks. The setting of park entrance fees is a complex policy issue involving anumber of ‘trade-offs’.
7. These decisions need to be made within the framework of the park managementobjectives. The pricing of entrance fees and other services and facilities can reflectmultiple management goals.
8. Tour operators and individual tourists often made two points to us• Increases in entrance fees and other charges should be staged (and tourists’
expectations of charges are influenced by out-of-date guide books)• The reasons for increased fees and charges should be explained
9. There is clearly some scope to increase entrance fees to national parks and to
increase revenue; however the consequences of raising fees and charges need tobe carefully considered.
10. Revenue maximisation may lead to increased conflict with local communities iftourism revenues in the local community are reduced or lead to forms ofdevelopment within the park which undermine the conservation purpose of theprotected area.
11. The best way in which to test the market is through market based 65reactive
management of park entrance fees and other charges, through raising feesincrementally, to achieve specific management objectives including
• controlling over-crowding• raising funds for habitat and species management• improving visitor facilities• maximisation of revenue to the national park and local people• raising money for reinvestment in the park• management of the mix of visitors who have access to, and use of, the park• managing visitor use of the park
12. Periodic surveying of tourists and tour operators can assist in the determination ofprices for services and facilities and monitoring visitor satisfaction surveying toidentify opportunities.
65 For concessions and other contracted-out services this can be achieved through auctions and sealedbids.
60
5. TOURISM AND LOCAL DEVELOPMENT
5.1 Introduction
Despite the diversity of local histories, cultures and social forms encountered duringthe course of this research project, broadly similar trends of local economicadjustment66 were discernible in each of the principal research sites. From andexamination of the contrasts and similarities between each site, this chapter attemptsto establish some general patterns of the impact of nature tourism development onlocal employment and incomes. The chapter proceeds by setting the principalconcerns of local tourism development within the context of national and localstrategies for export-oriented growth. It then goes on to discuss the terms of referencefor the research project and finally outlines some general determinants of localparticipation in tourism development.
5.2 Tourism as a Strategy for Development
5.2.1 National StrategiesAs a rapidly growing sector of many less industrialised countries, international tourismhas emerged as an important component of export-oriented development programmes.For each of the three countries featured as case studies, tourism is experiencingsubstantial growth as a ‘non-traditional export’, along with, for example, newagricultural products (Zimbabwe) and information services (India). Since the late1980s, import substitution policies in all three countries have been replaced bystrategies based on neo-classical theories of comparative advantage, and in terms ofgrowth, the tourism industry has been a major beneficiary. In the 1990s, internationaltourism was one of the fastest growing industries world-wide, and was identified as asector ripe for foreign investment. The Indonesian government declared 1991‘VisitIndonesia Year’ which attracted a 24% increased in annual visitor arrivals67. In 1993,the Indian Government relaxed the restrictions on the foreign ownership of hotelbusinesses. Equity participation in foreign exchange was permitted up to 51 per centof the total equity of the proposed company, and the foreign investor was now free torepatriate dividends after payment of Indian taxes.
The promotion of international tourism as a component of national development istherefore consistent with economic adjustments taking place in each of the threecountries under study. Tourism development is a response to market opportunitiespresented by the emergence of a large international leisure market, declining long-haultravel costs and changing demographics68 in more industrialised countries. As acomponent of national development, proponents hope that tourism will:
• maximise foreign exchange earnings• increase employment opportunities
66 as far as national park legislation and subsequent tourism growth are concerned.67 DGT, Indonesia (1993)68 Principally an ageing population with increased leisure time

61
• improve socio-economic development and the quality of life• aid the preservation of natural history and environment
Critics suggest that tourism is vulnerable to problems which are common to otheroutward-oriented patterns of growth such as excessive foreign dependency, thecreation of separate enclaves, the re-enforcement of socio-economic and spatialinequalities and rising cultural alienation (Brohman, 1996). In particular, they suggestthat tourism development is susceptible to:
• fluctuations of demand in the global tourism market,• international and regional leakage of revenue (where there are insufficient links to
existing production)• spatial polarisation at regional and national scales• social polarisation (poor income distribution)
Some of these issues are discussed in the next chapter. These processes are repeatedat a local scale, and the extent to which the local benefits from tourism may bemaximised is largely dependent on the ability of the host population to minimise therisks outlined above.
5.2.2 Local StrategiesNature tourism69 is a major growth area within the emerging international tourismmarkets; and on a local scale, the development of tourism in rural areas may beinterpreted as a response to new (export) market opportunities. Reductions inagricultural subsidies and constraints on state financial support for protected areashave further precipitated an interest in rural tourism. In addition, protected areasadministrators are under increasing pressure to provide local economic benefits tomarginalised populations70. Further, the antagonism of local populations toneighbouring protected areas has been regarded as a principal cause of illegal huntingand environmental degradation.71 Advocates of nature tourism development hope thatthe local benefits of tourism revenues and employment will eventually create politicalsupport among local populations who otherwise feel aggrieved by exclusion policies,thereby reducing local environmental destruction. This last point is dependent onensuring that the benefits accrue to the same group of people that bear the costs ofexclusion from areas set aside for tourism use.
5.3 Tourism and Local Development
In the light of the above debate concerning the benefits and costs of tourismdevelopment, this research project has investigated the phenomenon of nature tourismat a local level in three countries. The relationship between tourism and localdevelopment was investigated with a particular emphasis on the magnitude of local
69Synonymous throughout this chapter with tourism to protected areas70 Balakrishnan, M. and Ndhlovu, D.E. (1992), McShane, T.O. (1990), Makombe, K (1994)71 Nepal, S.K. and Weber, K.E. (1995)
62
revenues and employment opportunities directly associated with tourism The specificresearch objectives for this section of the research project were to:
• identify the local indigenous people’s incomes from the sites and identify theadditional economic benefit which could accrue to them from biodiversity andconservation.
• identify methods of providing sustainable revenues from tourism for...development• raise the income and related benefits which local people gain from tourism based
on biodiversity
5.4 Key Questions
Various approaches and allied methodologies were employed in each site in order toassess the scale of economic development from tourism and the associatedemployment and other benefits which accrue to local populations. In each case aworking definition of the ‘local population’ was cautiously applied. It was recognisedat an early stage in the research that any definition of a local population is easilycontested, but in most cases, conditions of residency and ethnicity were employed todistinguish between local and non-local actors. It should be noted that the researchmade no attempt to investigate the impact of tourism at the household level, nor toconsider the relative size of the tourism economy in comparison to other sectors.
The extent to which local tourism development contributes to local developmentdepends in part on the ability of the local population to maximise benefits andmaintain control of the pace and form of development processes. An appropriaterealisation of benefits therefore depends upon:
• the creation of employment (at all skill levels and where there is existing capacity)• the extent of linkages to existing domestic economy• the extent of local/non-local ownership of tourist enterprises
During the research project various indicators were used to assess the magnitude oflocal benefits. Patterns of tourist spending were traced to suppliers of goods andservices, and surveys conducted in order to establish the magnitude of revenues andemployment. At each site, the research followed three principal avenues of enquiry:
• What is the size and form of the local tourism economy?• What is the magnitude of local employment generation?• To what extent do the benefits of employment and revenue from tourism accrue to
the local population?
The magnitude of tourism was significantly different at all sites of investigation. Inaddition to the above components, research was undertaken on the attitudes of thehost population towards tourism employment in areas at the early stages of tourismdevelopment (Gonarezhou, Zimbabwe) and in transitional stages (Komodo,Indonesia). Although the magnitude of direct employment from tourism wascalculated there was a only a limited assessment of the opportunity costs of tourism,

63
although some consideration was given to the spatial distribution of revenue andemployment benefits.
5.5 The case studies
Each of the local communities included in this study have undergone a substantialeconomic transformation as a result of protected area legislation. At all three sites, thedevelopment of a local tourism industry is a relatively recent phenomenon. Hotelconstruction around Komodo, Keoladeo, and Gonarezhou National Parks72 has largelytaken place within the last decade. In this respect the growth of tourism is but oneevent in a long history of changing economic relationships between the localpopulations and the local environment. While earlier economic uses have declineddue to exclusion policies, tourism has emerged to become the principal economicactivity associated with each protected area.
Tourism infrastructure has developed to a different degree at each site. Situated onthe one of the most heavily visited tourist trails in Asia, Bharatpur now has a relativelywell established tourism economy, whereas Komodo is fairly distant from the principalIndonesian tourist centres of Bali and Lombok. The southeast lowveld in Zimbabweremains largely undeveloped as a tourist destination, and tourism at Gonarezhou is yetto be established. However, in all three locations, national park legislation has had theeffect of curtailing alternative economies based on the extraction of natural resources.Both the Shangaan in Mahenye and the Gujjars in Bharatpur turned to agriculturewhen hunting and grazing economies were disrupted by the creation of national parks.Tourism development is a potential source of local employment and revenue, but theopportunities it presents must be considered against alternative uses.
Each of the national parks investigated during the course of this study is situated in arural location. The local economies and skills are therefore generally concerned withsmall scale primary production. Livelihoods in the Zimbabwean lowveld and thevillages around Keoladeo National Park are predominantly dependent on agriculture.Fishing is the primary occupation of villagers on the edge of Komodo National Park.Where existing income opportunities are low, the potential exists for a high degree oflocal involvement in tourism. The Beitbridge Road handicraft study in Zimbabwesuggests that participation in the informal tourism sector is low in areas with a highagricultural potential. The decision of local people to invest in tourism is alsodependent on the degree to which new forms of employment are accommodatedwithin existing livelihood patterns. Calculation of risk in all activities is a keydeterminant of involvement, and where the benefits are unknown, participation is low.Informants from one of the villages adjacent to Keoladeo National Park stated thatalthough they possessed appropriate handicraft skills, much of their labour time wasalready taken up by cutting grass for cattle fodder for which the benefits are largelyguaranteed. However, where populations have had little experience of tourism
72 The three principal sites considered in this chapter are Komodo National Park, Indonesia, KeoladeoNational Park, India and Gonarezhou National Park, Zimbabwe. Associated tourism development hastaken place at Sape and Labuan Bajo, Bharatpur, and Mahenye respectively.

64
development73, expectations of the benefits from tourism are relatively high. Thesurvey evidence from the lowveld suggests that communities with very infrequentcontact are interested in developing enterprises. In addition, a comparative surveybetween the two gateway towns to Komodo National Park suggests that the residentsof Sape, the relatively undeveloped town, have a more positive attitude towardstourism than the residents of Labuan Bajo.
Where the potential opportunities for tourism incomes are high, the degree to whichthe local population can capture the benefits is largely a function of access. In theIndian and Indonesian study sites, those populations who reside nearest to theprotected areas and who have therefore borne most of the costs of exclusion appear toparticipate least in the tourism industry. At Mahenye, the tourism industry is still inthe initial stages of development. However, the local population has been able tocapture a proportion of revenue through special leasing arrangements. For ruralpopulations, participation in the emerging tourist industry more often takes place inthe form of low grade employment in the formal sector or entrepreneurial activities inthe informal sector.
The degree of local involvement in the tourism industry, and access to the financialbenefits, is therefore due to a range of factors, in particular the transferability ofexisting skills, patterns of land ownership and the mode of tourist arrival. Thesedeterminants are discussed in the following sections.
5.5.1 Transferability of Existing Skills and Capital Many of the employment opportunities offered by tourism belong primarily to anurban entrepreneurial culture. The difficulty of transferring rural primary sector skillsin order to fit tertiary sector jobs is evident in all three countries. Leakage from thelocal economy is minimised where existing resources, skills and capital can be utilised.In the predominantly rural areas, where nature tourism takes place, this usually occursin those services which are dependent on labour, and primary produce (or smallcapital outlay). In the Indian and Indonesian sites, local participation is relativelylarge in the local transport sector. Many of the rickshaw pullers working in KeoladeoNational Park held the same job in the domestic/non-tourist market before joining thetourist sector. The charter-boats of Sape and Labuan Bajo have close links with theexisting fishing industry, and small fishing boats are easily adapted for use withtourists.
Participation in the tourism industry is not, however, synonymous with ownership orcontrol. Although charter-boats operating to Komodo National Park utilise existingtransport skills, many of the owners are Javanese. The capital cost associated withpurchasing transport of this type is beyond the reach of many of those employed. InIndia, rickshaws are comparatively less expensive, and local government has, onoccasion, assisted with start-up costs. An additional barrier to local involvement is theneed to acquire specifically tourist-related marketing skills. Training in the informal 73 And have not been adversely affected by protected areas

65
sector is largely acquired ‘on the job’ but sufficient inertia often exists to deternewcomers. Training in marketing techniques would make a considerable impact onhandicraft sales alongside Beitbridge Road in Zimbabwe. In India, initial training forrickshaw pullers and guides is provided by the Forest Department and localinvolvement in this sector is high.
As a result of the general difficulty of transferring rural resource extraction and artisanskills to tertiary employment based on urban entrepreneurial skills, local involvementin tourism largely takes place through subordinate and semi-skilled jobs. For example,while the construction phase for tourist lodges in Zimbabwe has provided a significantnumbers of jobs, these skills are unlikely to contribute to permanent employmentwhen the construction phase is over (other than where those skills are transferable tomaintenance). In Bharatpur, the majority of hotel staff from local villages hold menialjobs, while managerial positions are in the main reserved for members of an urbanclass. Survey results from the southeast lowveld in Zimbabwe suggest thatexpectations are highest for handicraft business opportunities than they are forparticipation in more formal sectors of the tourist economy, such as accommodation.
Local knowledge is, however, a skill that is marketed at all three sites. In Bharatpur,nature guiding probably offers the greatest opportunity for the development of localskills, although the necessary language skills have until recently restricted employmentto wealthier individuals. In terms of skill transfer, guiding has the advantage ofsustained tourist contact and nature guides have the opportunity to study the marketthoroughly. Early guides at Keoladeo National Park were mostly urban, but even thefew from rural backgrounds have been able to make connections within the nationaltourism industry. With the development of the lowveld in Zimbabwe, local guides atthe Save Valley Conservancy also have good prospects for employment, although theprocess of indigenisation is slow.
5.5.2 Mode of Tourist ArrivalTourism development is more likely to marginalise rural populations where transport,accommodation and guiding are vertically integrated by tour companies. Coachparties visiting Keoladeo National Park for lunch are a particular example. Thebrevity of visits and their tendency to bypass the small group of businesses at theentrance to the park, reduces their local spend. In Indonesia, cruise ships represent thebiggest source of tourist revenue leakage from the local economy. These allow Bali-based operators to combine transport, accommodation, food and guiding into a singlepackage so that the only local spend is in the form of park entrance fees andoccasional handicraft sales. An estimated 85% of tourist expenditure on a visit toKomodo National Park bypasses the local economy due to the dominance of non-localcarriers and package tour operators in the market. Through package transport of thiskind, nature tourism assumes all the negative impacts of enclave developments moreusually associated with beach tourism.74
74 For a discussion of these, see Freitag, T.G. (1994)

66
5.5.3 Geographical access ibilityGeographical accessibility plays an important role in the involvement of the localpopulation, even though this variable is mediated by local structures of land ownershipIn the case of Komodo and Keoladeo National Parks, the location and pace of tourismdevelopment has been dependent on the existence of arterial transport networks.Development has been swift at Labuan Bajo and Sape; both situated on the trans-Indonesian highway and traditional gateways to Komodo island. In Bharatpur,infrastructural development has taken place close to the junction between the Agraand Jaipur roads, and within walking distance of the entrance to the park. In this case,the creation of Keoladeo National Park truncated existing arterial links to rural areasthrough the closure of a principal access road. As a result, infrastructuraldevelopment has been entirely absent from the rural areas, and participation inemployment by members of the rural population has been confined to those resident inthe two villages close to the hotels. In addition, the relative contribution of tourismrevenue to the various sectors of the industry is also dependent on the geographicallocation of the site. Apart from accommodation owned by the park authority itself,hotels are necessarily distant from Komodo island itself. Lengthy transport by boat istherefore a requirement of the visit and as a consequence charter boats receive anestimated 44% of tourism revenue. In contrast, most of the accommodation inBharatpur is within walking distance of the park and the local transport sectorconsequently receives a much smaller proportion of total tourist revenue.
To some extent, lack of permanent access to prime sites can be overcome by mobility;a strategy adopted by informal businesses trading at the entrance to KeoladeoNational Park. This is in part a contributing factor to the general pattern thatperipheral services (e.g. snacks and handicrafts) generally have a higher degree oflocal participation than core sectors (such as accommodation). However, theactivities of informal enterprises at two of the sites are constrained by the lack ofsufficient trading space. At Bharatpur, the operation of small businesses at the parkgate is dependent upon the unofficial sanction of park staff, which may be revoked forany reason. In Komodo, the Koperasi75 has a monopoly on the marketing of productscrafted by island communities since they lack a feasible trading site of their own.
The geographical site of tourist locations also plays an important role in determiningthe degree of linkage and articulation with the existing economy. Keoladeo NationalPark is exceptional in that it lies close to a relatively large urban centre and regionalmarket place. The ready availability of goods and supplies for the tourism industrywithin Bharatpur City reduces regional economic leakage, but the urban bias creates ahigh level of rural dislocation. The presence of Bharatpur city also allows thedomination of the industry by an urban elite with the necessary skills to participate inthe industry and with existing connections overseas.
5.5.4 Patterns of Land OwnershipPatterns of land ownership have profound implications for the distribution of costs andbenefits of tourism within particular regions. The organisation of land also has aconsiderable effect on the ability of local communities gain access to tourists. In the
75 The staff co-operative at Komodo National Park

67
case of Mahenye in Zimbabwe, particular rules preventing the sale of communal landhave prevented the sale of prime tourism sites to non-local entrepreneurs and havefostered potentially profitable lease agreements for local people under theCAMPFIRE scheme. The land upon which the local Shangaan people are settledcannot be sold, and opportunities have arisen for them to maintain a share of tourismrevenue. In contrast, tourism development on private land in Zimbabwe has largelycircumvented local populations, so that conservancies have developed in an enclaveform. Similarly, beach fronts in Labuan Bajo have been purchased by Javaneseentrepreneurs at the expense of the indigenous population. In Bharatpur, India, themost lucrative sites in terms of access to tourists are held by a single community, whoare also members of the ruling caste.
5.5.5 Local Social StructuresMuch of this chapter has been concerned with the relative levels of local and non-local ownership of tourism enterprises. However, orienting benefits towards the localpopulation does not necessarily ensure that the majority of local people benefit. Insocieties where existing social structures are highly skewed, local elites with urbanskills and international connections dominate operations, and hamper widespread localcontrol. The pattern of enterprise ownership in both the Indian case study, and amongthe private conservancies of Zimbabwe tends to perpetuate structural inequalities.However, traditional hierarchies based on age are often challenged by the process oftourism development. Problems of wage disparity have been raised as a particularissue of concern by the local population in Mahenye, where younger workers earnmore than their elders. In all three sites, employment opportunities in the tourismindustry are biased towards younger members of the community. In contrast, thevisible employment of women is low. However, the impact on women in thehousehold is unknown. The level of participation by women is to a large degreedependent on existing cultural norms but is thought to be high in small scaleenterprises where family labour is the general mode of production. Women play amore active role in the hotels, restaurants and shops in Indonesia, but whether this is acontribution to financial independence, or an additional burden requires detailedinvestigation.
5.5.6 Local InstitutionsIn some cases, a higher degree of local involvement in the tourism industry occurswhere an appropriate institution is able to mobilise participation of communitymembers in decision making. From the case studies, the clearest example of thisoccurs under the Mahenye CAMPFIRE programme in Zimbabwe. However, theestablishment of this institution was not without its problems. Conservation, revenuegeneration and infrastructural planning decisions usually fall between different localinstitutions. Revenue distribution at Mahenye was achieved through the revision oflocal institutions under the concerted effort of a few individuals. In India, proposalsput forward for the establishment of a community tourism fund have been met with adegree of scepticism by some local people who question the accountability of existinglocal political institutions, and their ability to distribute funds according to thecollective wish of the community.
68
5.5.7 ConclusionsMany of the points discussed above refer to general concerns which are raised duringall processes of rapid economic change. The case studies from the three countrieseach reveal a degree of local involvement in the local tourism industry, and some ofthe key determinants for this have been suggested. Despite the temptation to seekgeneral trends in the forms of local involvement, change can only be understoodwithin the context of particular social and economic systems. However, the level ofincome and employment opportunities arising from tourism at protected areas dependslargely on the form of tourism development (enclave or dispersed), and thearticulation of particular social structures in the host population. Histories of landownership, political representation and engagement by the state have a specialrelevance.
5.6 Policy Implications
Programmes for increasing the degree of local control over tourism development canonly proceed from techniques and approaches which seek to articulate local concerns.Where tourism is identified as an appropriate area for growth, the following principlesmay be useful in guiding development.
1. Focus assistance to non-capital intensive enterprisesLocal involvement in the tourism industry depends largely on access to the market. Inmany cases local benefits are maximised in the informal sector. Local skills andservices are often maximised where the scale of capital investment is low. This aspectis sometimes neglected in tourism planning and access to tourists by the informalsector is restricted. Training in market research, understanding consumer tastes andproduct promotion may increase sales for small traders. 2. Maximise tourism based on local technologyTransferability of skills and hence local involvement is largest where existing capitaland know-how can be utilised. Tourism developers should be encouraged, whereverpossible, to use and promote existing local modes of transport, accommodation and artand handicrafts, food production and preparations.
3. Discourage enclave practicesResist the tendency of some tour operators to bypass local business opportunities byregulating traffic (for example through the judicious location of parking spaces andentry restrictions) and ensure local access to centres of leisure and accommodation.
4. Encourage flexible partnerships between public and private sectorsDespite the wishes of protected areas to increase rural support, efforts are sometimesfrustrated by emergent monopoly practices within the local private sector. LocalNature Guide training and selection should be based upon a clear agreement of

69
recruitment practices with participation from existing guides, protected area managers,and rural development associations.
5. Create and strengthen appropriate institutionsLocal concerns regarding tourism development and attempts to retain some of therevenues from tourism are often hampered by the lack of local representation at aninstitutional level. Nature tourism, conservation and income generation often fallbetween the jurisdiction of several institutions. Local government and donor agenciesshould explore means of establishing an appropriate forum for the articulation of localconcerns with representation from, and managed engagement of, all stakeholders(park management, tour companies, hotel developers and small businesses).
6. Developing Revenue Sharing PoliciesSome park directors are considering the introduction of local development levies onentrance fees. Collaborative policies may be pursued in order to raise the totalrevenue for both local people and parks.
7. Incorporate tourism development as a component of a wider strategyResearch in at least two of the study sites suggests that while protected area managers,tourism professionals and researchers prefer to make a clear distinction between thetourism and conservation objectives of national parks, the views of local inhabitantsoften combine them. Greater participation in the tourism industry is not always aprime concern of local populations. Tourism should form one component ofdevelopment strategies for protected areas, but should not over-ride alternativesuggestions for raising local benefits such as joint resource management initiatives.

70
6. INTEGRATION INTO THE INTERNATIONAL MARKET
6.1 IntroductionOne of the purposes of this project was to “identify and quantify the benefits andproblems created by integration into the international market.”76 With current rates ofgrowth in international tourist arrivals, national parks are increasingly visited byforeign tourists. The comparative rates of growth in tourist arrivals were considered inChapter 2 and the impacts of this growth on the habitats and species were consideredin Chapter 3. Chapter 4 focused on the economic value to the parks of the touristswho use them. In this chapter the focus is on the implications for the park of beingmarketed in the tourist originating countries.
There is considerable further work to be done on the marketing of national parks bothwithin the tourism industry and to the end consumer, the individual tourist. Theinternational marketing aspect of parks was not a central focus of this researchproject. The data on the nature of the parks’ integration into the international marketwas collected through the survey of international tourists in the parks and throughadditional surveys of UK and German tour operators undertaken by Jordan (1996) andMetcalfe (1996).
An analysis of tour operator brochure content relating to Zimbabwe and a detailedsurvey of tour operators by Pirie (1996) is reported in detail in the Zimbabwe report.Pirie’s work shows that the visual image of Zimbabwe presented in the brochures ofUK tour operators is dominated by wildlife and landscape, to the virtual exclusion ofpeople and culture. This contrasts with National Tourist Office publications whichplace a stronger emphasis on the social and cultural facets of Zimbabwe. It is the touroperators who “showcase” the destinations and construct their image. Analysis of thepostal survey of UK tour operators revealed that their main reasons for not featuringGonarezhou were the difficulty of access and the lack of client awareness of the park,rather than the quality of the game viewing. By contrast Hwange, Zimbabwe’s mostvisited game park, is popular with tour operators because it is easily accessible, hasgood wildlife viewing and tourists want to go there. UK tour operators prefer tomarket destinations which are both established and accessible.
Workshops and meetings were held with host country tour operators in all threecountries in the final phase of the project.77. The host country tour operators operatingto the parks were often relatively geographically remote from them. For Keoladeomost of the operators are based in Delhi, Agra or Jaipur and they operate from there.Most of the host country tour operators featuring Komodo are based in Bali, as well asa few with offices in Sape and Labuan Bajo. Many of the Bali based operators hadnever visited the park. Few of the host country operators are located adjacent to the
76 Scientific/technical objective e.77 This group was particularly difficult to survey by postal questionnaire. They did not respond torepeated mailings even when the questionnaires were organised by their own trade associations

71
parks and relatively few of them have detailed knowledge of the parks or commitmentto the parks and their environs. In Indonesia and India there are very few links ofownership between the domestic tour operators and the hotels. The major domestictour operators do not own accommodation or transport which is committed to theparks and their environs.
The situation in the lowveld is different. As the operators are based in the lodges, theyhave fixed investments in the area and the commercial viability of their businesses isdependent upon marketing the lowveld and wildlife assets.
All three parks are, in different ways, characterised by being at the periphery of thecentres of tourism organisation and control in their domestic tourism industries.Komodo is either a side-trip from Bali or a stop-over on the overland route east.Keoladeo is a lunch stop or stop-over on the road between the major tourist centres ofAgra and Jaipur. The lowveld is simply remote.
All three parks are relatively isolated from other tourist attractions. At none of theparks has there been any significant development of additional attractions whichwould encourage tourists to stay longer and explore the vicinity of the park. At thetour operators’ workshop in Keoladeo there was some discussion of the ways inwhich, through the addition of cultural tourism, Bharatpur might become a tourismcentre. In Labuan Bajo the acquisition of land by developers suggests that it may beabout to develop further. There are plans for the development of tourism in thelowveld, but these are still far from being implemented.
Decisions about the development of the industry locally and its linkages into theinternational market are made elsewhere. The local industry does not negotiate its ownrelationship with the international market. There is considerable concern about thenature of the structural relationship between the domestic industry and theinternational market. This was not the focus of this research project but it is an issueof particular concern in Zimbabwe.
The Zimbabwe Association of Tour and Safari Operators (ZATSO) is concerned at thedominance of international companies in the tourism industry, particularly theinternational wholesalers. In 1993 ZATSO wrote to DNPWLM expressing concernthat the bulk of international tourists were handled and controlled by two internationalcompanies.78 This dependence upon a limited number of companies in theinternational marketplace exacerbates the vulnerability of a local tourism industry tochanges in the international market.
6.2 Market Volat ility
6.2.1 Changes in international market trendsChanges in international market trends are largely beyond the control of nationalindustries although they do react to these changes. No longer viewed as being quitesuch an exotic destination as it was, India has responded to the changing trends bydeveloping beach tourism in Goa and developing new heritage products; one of the 78 cf. Geckoconsult (1994):36

72
hotels in Bharatpur is a beneficiary of this marketing initiative. Indonesia has gainedas South East Asia has become fashionable with tourists, although it should also berecognised that Indonesia has invested heavily in marketing itself, and is nowbeginning to market Komodo as part of its East of Bali campaign.
Domestic industries struggle to respond to these changes in the international market. Itis very difficult for the local industry to respond except through regional or nationalbodies.
6.2.2 Tourist ConfidenceIndia has been particularly vulnerable to events which have caused short termproblems for the Indian travel industry. In 1990 the Gulf War, the Indian Airline’sA329 crash in February and student protests all contributed to a reduction in tourism.In the period 1992/93 tourist numbers were adversely affected by the incidence ofcommunal violence and in the winter of 1994 the industry was hit by outbreaks ofpneumonic plague, cerebral malaria and tourist kidnappings. The earthquake in Flores,adjacent to Komodo National Park, may have affected the tourism industry and parkvisitor numbers in 1992.
6.3 International TouristsFrom the responses in visitor surveys to the standard questions on motivation fortravel, it is possible to compare the motivations for travel of tourists interviewed at thethree research sites.
Landscape, wildlife and culture rank as the top three motivations for travel amongstinternational tourists interviewed in all three parks. Markets and shopping is leastimportant in all three samples. Wildlife is most important at Gonarezhou for 66% ofrespondents. At Keoladeo wildlife is second to culture with 30% of respondents ratingwildlife as their primary motivation for travel. At Komodo wildlife ranked third, withonly 7.4% of respondents rating it as their most important reason for travel.
Culture was the most important motivation for travel at Keoladeo with a mean scoreof 4.3 (out of a maximum of 5) and 45% of respondents rating it the single mostimportant reason for travel. At Komodo the rankings are contradictory, culture isranked second in terms of the mean scores, but 57% of respondents say that it is theirmost important reason for travel. At Gonarezhou culture is ranked third with arelatively low mean score and only 9% citing it as their main motivation for travel.This is disappointing for a country rich in cultural interest. It is important to rememberthat these ratings were collected in national parks and that they can be expected toshow higher wildlife values than would be found in the general population of touriststo the destination countries.79
79 cf Tables 6.4 and 6.5 below.

73
Gonarezhou Keoladeo KomodoLandscape 4.5 3.9 4.5Wildlife 4.8 4.1 4.1Culture 3.7 4.3 4.4History & Archaeology 3.3 3.7 3.2Art & Architecture 2.5 3.8 3.3Marine - 2.7 3.8Markets and Shopping 2.5 2.6 2.7
Table 6.1. Foreign Tourists Motivation for Travel, Mean Scores on a 1 to 5 scale
Gonarezhou Keoladeo KomodoCulture 3 9% 1 45% 2 57%Wildlife 1 66% 2 30% 3 7.4%Landscape 2 20% 3 1 19%Art & Architecture 5 4 5History & Archaeology 4 5 6Marine - 6 4 7.4%Markets and Shopping 6 7 7
Table 6.2. Foreign Tourists Motivation for Travel, ranked and with % rating“most important”.
6.4 International Tour Operators 80
Jordan and Metcalfe asked the same set of questions to UK and German touroperators to explore their views about nature tourism and to see if there were notabledifferences between the two groups. Both groups of tour operators felt strongly thatlocal people should not be excluded from national parks and both felt strongly thatnational parks are part of the world’s heritage and should be protected at all costs.81
When asked whether or not they agreed that national parks are important touristattractions the mean scores were 3.7 for German tour operators and 4.5 for Britishtour operators. The operators were asked to express their views on a scale from 1 to 5and the spread is different between the two groups. For the UK operators in the surveynational parks are markedly more important as tourist attractions than they are forGerman operators.
80 This section is based on work by Jordan (1996) and Metcalfe (1996)81 Mean rankings on a 1 to 5 scale: UK 4.4; Germany 4.1.

74
0%
10%
20%
30%
40%
50%
60%
70%
80%
1 2 3 4 5
Germany
UK
Strongly disagree Strongly agree
Figure 6.1. UK and German Tour Operators’ Perceptions of the importance ofnational parks as tourist attractions.
When asked whether local people should be helped to earn money from tourism byestablishing their own businesses there was strong support from British tour operators(mean score 4.3) and support from the German operators (mean score 3.2). Over 60%of British tour operators strongly agreed that local people should be assisted todevelop tourism related businesses.
0%
10%
20%
30%
40%
50%
60%
70%
1 2 3 4 5
Germany
UK
Strongly disagree Strongly agree
Figure 6.2. UK and German Tour Operators’ support for local peopleestablishing tourism enterprises.

75
When asked whether tourists visiting national parks should be charged a levy for arural development fund the British operators were supportive (mean score 3.7), theGerman operators were less so (mean score 2.9). Of the British operators 65% agreed,compared with 36% of German operators.
0%
5%
10%
15%
20%
25%
30%
35%
1 2 3 4 5
Germany
UK
Strongly disagree Strongly agree
Figure 6.3. UK and German Tour Operators’ support for a national parksentrance charge levy for a rural development fund.
The tour operators were asked how important each of the countries was to theirbusiness. The UK companies responding to this survey had relatively low proportions(all< 20%) of their total business committed to the three destination countries. This isreflected in mean scores, with only Zimbabwe scoring above the neutral 3 at 3.7. TheGerman operators had larger proportions of their business committed to thedestination countries, but their mean scores were all below 3. The survey evidencesupports the view that tour operators are fluid in their commitment to particulardestinations.
UK Germany
OperatetoDestination
MeanScore
Average %of businesstodestination
Operate toDestination
MeanScore
Average %of businesstodestination
India 26 2.8 12.1% 8 1.9 75.38%
Indonesia 13 1.8 1.8% 20 2.0 25.7%
Zimbabwe 33 3.7 16.9% 10 1.7 35.74%
Table 6.3. Importance of countries to UK and German tour operators.
.

76
When asked about their clients’ motivation to travel, UK operators to Zimbabweattributed most importance to wildlife, landscape, and culture. For India they rankedtheir clients’ interests as culture, followed by landscape; art and architecture, historyand archaeology and wildlife had very similar values. The operators were being askedfor their views about the country. By contrast the tourists were being interviewed in anational park. For Indonesia, wildlife was ranked last, with culture and people,landscape and marine as the top three.
UK Zimbabwe India IndonesiaWildlife 4.8 3.7 3.0History & Archaeology 2.7 3.6 3.1Markets and Shopping 2.3 2.6 3.1Art & Architecture 2.1 3.7 3.2Marine - 3.6Landscape 4.1 3.9 3.7Culture 3.5 4.0 4.0
Table 6.4. UK Tour Operators views of their clients motivation to travel.
For Zimbabwe, the German tour operators attached most importance to culture,landscape and wildlife which is significantly different from the British operators. ForIndia they similarly attached most importance to its cultural tourist values, withwildlife scoring the same as shopping. For Indonesia the German operators rate thecultural interest markedly lower, placing the greatest, importance on markets andwildlife.
German Zimbabwe India IndonesiaArt & Architecture 3.3 3.0 2.7Culture 3.9 3.7 3.3History & Archaeology 3.1 2.2 2.8Landscape 3.9 3.1 3.0Marine - - 3.4Markets and Shopping 2.9 2.7 3.6Wildlife 3.5 2.7 3.6
Table 6.5. German Tour Operators views of their clients motivation to travel
German and UK tour operators were asked to rate the tourist interest and marketingvalue82 of each of the parks on a scale of 1 to 5. The tourist interest of the parks isconsistently rated higher than the marketing value. This reflects the generic nature ofmuch marketing of wildlife and culture.
82 Tour operators were asked “How important is the park to your marketing of the country? Answerrecorded on a scale from not very important (1) to very important (5).

77
Tour Operators Tourist Interest Marketing ValueKeoladeo German 3.6 2.3
UK 4.1 2.9Gonarezhou German 3.7 1.6
UK 3.6 1.8Komodo German 3.8 2.2
UK 3.4 1.6
Table 6.6. German and UK Operators Opinions on the Parks’ Tourist andMarketing Value
6.5 Policy Implications1. As parks and the local economy adapt to incorporate tourism as a significant
source of income, their dependency on the international tourism market increases.The international tourism market is a competitive and volatile one. This makesparks and the local economy vulnerable to changes in the international market andto loss of confidence by tour operators and individual travellers.
2. The decisions which determine the volume and character of tourism to a particularsite are not made locally. These decisions are made in the tourist originatingcountries and by the domestic tour operators based in the tourism centres remotefrom the parks.
3. Foreign tour operators generally have a low level of commitment to particulardestinations.
4. The local destination remains relatively isolated from the international market,receiving tourists but not understanding or playing any part in controlling the termson which, and the processes by which, they arrive.
5. International tourists choose to visit countries for many reasons but experiencingthe culture and seeing the wildlife are prominent.
6. There is evidence that some tour operators are sympathetic to ideas of localcommunity involvement in tourism and a levy on park admissions for localdevelopment.
78
7. Visitor Education and Awareness
7.1 IntroductionThis chapter addresses scientific/technical objective c), to
“identify and assess the qualitative contribution of tourism to conservationthrough visitor education and increased awareness.”
In the debate about nature tourism, considerable emphasis has been placed on theimportance of the educational and interpretive components of the protected areaexperience. It is assumed that during their visit, tourists “will almost always learnsomething” about the protected area system, conservation or “humankind’s role in theenvironment”. Optimism has been expressed that protected area managers “are in aunique position to influence and shape this learning process” and that the “visitors’understanding and appreciation of what they are experiencing” can be increased.Educational and interpretive components can also enable visitors of protected areas“to increase their commitment to the preservation of natural resources.”83
National protected area policies frequently contain mention of the importance ofvisitor information and education. For example, in Zimbabwe the Policy for Wildlife(1992)84 refers to “.. public education and the advancement of scientific knowledge”and to encouraging “public use related to the enjoyment and appreciation of theseareas.” The DNPWLM is expected to provide “.. interpretive and educationalmaterial”.
Visitor education and awareness is in the interest of the parks, and is an essential partof creating a national constituency of support for national parks and protected areas.
This research did not address what a carefully planned and resourced visitor educationand interpretation programme could achieve. None of the sites at which research wascarried out had sufficient staff or facilities to undertake such a programme of work.
• Gonarezhou had no interpretation centre. There are two illustrated sketch mapswhich contained some very limited information about the park. Individual visitorsto the park are not required to have a guide. Tour groups are required to uselicensed guides.
• Komodo has basic interpretive material displayed in a shelter on both Komodo andRinca and there is some basic information at Labuan Bajo. Visitors do have aguide, but their ability to communicate with each other is usually very limited bylanguage difficulties.
83 Ceballos-Lascurain (1996).84 Ministry of the Environment and Tourism

79
• Keoladeo had a small interpretation room at the gate, and now has a much largerroom, purchased by WWF and currently being developed as a visitor centre. Theguiding is provided by a group of guides and by the rickshaw wallahs.
The survey work undertaken for the project addressed two sets of questions:
• What facilities would international tourists like to see in the parks?
This data is drawn from the tourist surveys conducted in each of the parks andfrom other parts of the research.
• What learning can be identified as having resulted from a visit to a protected area?
A detailed postal survey of people who had visited Keoladeo National Parkwas undertaken, full details of which are in chapter 7 of the Keoladeo report.The more salient results are reported here.
This research project was concerned with the relationship between internationaltourists and the parks. Some of what follows may be relevant also to domestic visitors.Komodo National Park has a significant extension programme of work with villages inand around the park and Keoladeo has also undertaken such work at different times.No attempt is made here to assess the value or impact of that work.
7.2 Interpretation and Education Services
7.2.1 GuidesThe survey of UK and German tour operators conducted by Jordan (1996) andMetcalfe (1996) asked whether their clients were willing to pay extra for a “fullytrained local guide around the park”. The tour operator sample was asked for aresponse at each of the parks which the company featured in its programmes85, thusthe results are for different sub-samples.
Gonarezhou Keoladeo KomodoUK Operators 55 73 54.5German Operators 100 77.8 91
Table 7.1. UK and German Tour Operators’ perception of clients’ willingness topay for a trained local guide (%)
It should be noted that at Komodo all tourists are accompanied by a local guide at thesite. The figures probably reflect the number of companies employing local guides inaddition to the park guide.
85 Those who did not respond, but who did send tourists to the park, are counted as not thinking that theirclients would be willing to pay extra for a local guide.

80
The definition of “local” guide is problematical - it may mean a national or local to thepark. This is demonstrated by the responses for Gonarezhou. All tour groups inZimbabwe in the national parks have to be accompanied by a licensed professionalguide who will be a national. The UK operators are using a more local definition whenanswering the question. There is some pressure from the industry in Zimbabwe toabolish the rules requiring a licensed professional hunter/guide on private andcommunal land in favour of the quality of guides being entirely a matter for theoperator. Some operators are arguing that the very high qualification for guides inZimbabwe is unrealistic because it results in a shortage of guides and inflated wages.The point is also made that local people are precluded from undertaking guidingbecause of the licensing requirements.
In Keoladeo, where guides are optional, nearly half of the package tourists, one thirdof the independent travellers and a fifth of the backpackers use the services of aguide. Anecdotal evidence suggests that the quality of the guiding provided by theguide or the rickshaw operator is very important to the tourist’s perception of thepark.
In both Komodo and Keoladeo National Parks there is a case for improving the qualityof guiding in the parks. The training requirement is for
• language skills, particularly English
• natural history and interpretive skills
• visitor management and public relations skills
7.2.2 FacilitiesThe visitor surveys asked tourists what facilities would enhance their visit
Gonarezhou Keoladeo KomodoInformation Boards 44.8 35 59.7Labels for Trees 70.9 39 42.6Hides 62.8 25 27.7Interpretation/VisitorInformation Centre
28.9 20 21.6
Table 7.2. Educational and Interpretive Facilities to enhance the visitorexperience (%)
The visitor responses reflect the different visitor motivations and experiences at eachpark. At Gonarezhou the facilities which would be most appreciated are labelling oftrees, and to a slightly lesser extent, hides for game viewing and bird watching.
Information boards and labelling of trees are the two most frequently cited facilitiesfor visitors to both Keoladeo and Komodo. Both facilities would help to counter thelanguage difficulties which may be experienced. A quarter of respondents cited hidesat Keoladeo, which are facilities also frequently suggested by tour operators.

81
In all three parks, an interpretation/visitor centre was viewed as the least important ofthe suggested facilities. It is worth noting that visitors’ experiences would besignificantly enhanced by relatively small investments of resources in labels, hides andboards. These facilities would not require expensive equipment and could be madewith local renewable resources and by employing local people.
7.2.3 Books and Information
Written information, in the form of books and leaflets, can enhance considerably theimmediate visitor experience, as well as providing a broad awareness of the parks andconservation.
Keoladeo was the only park in the study with a bookshop. Just over 20% of theindependent travellers and backpackers purchased from the bookshop, while thenumber of package tourists doing so was half of this figure. (Many of the packagetourists are present only for a limited time, and often in the middle of the day, whenthe bookshop is often closed.)
Of the visitors surveyed at Komodo about what they were unable to purchase, thegreatest number (20 people) cited books and similar information.
7.3 The Keoladeo Survey of Biodiversity Awareness and Lear ningThis section summarises work done by Ian Bride and presented as Chapter 7 of theIndia Report.
Of the three sites covered by the ODA project, Keoladeo National Park, Bharatpur,India was chosen as the most suitable for the detailed research required to address thequestion of biodiversity awareness and learning. Komodo was rejected on the groundsthat for the great majority of visitors, the visit involved a short trip to see a singlespecies, and there was difficulty in collecting complete names and addresses in thepark. In Zimbabwe there were relatively few foreign tourists and the surveying wastaking place very late in the cycle of the project.
Before the trip, the reading of tour materials and materials from book shops andlibraries were by far the most frequent activities. 65% (42) of respondents who wentwith organised tours (N=64) read the tour materials, and the same proportion (84) ofall visitors (N=128) read materials from shops and libraries.

82
Source No. of respondents %Read materials fromshops/libraries
84 66%
Read tour materials 42 66%(of those with atour)
Watch relevant films/TV 17 13%Go to meetings/talks 12 9%
Table 7.3. Sources of learning prior to the Keoladeo trip.
At Keoladeo, park guides (62%) and personal observation (32%) were identified asthe primary sources of learning by respondents and, perhaps surprisingly, only 19% ofthose with organised tours identified the tour guide as a primary source. However, thedata for this question need to be considered with some caution because they arecompromised by the fact that respondents were asked to indicate the single mostimportant source. Some did this, but many ticked more than one category, and in theevent all categories were recorded in the data set.
Source No. of respondents %Park guide 80 62%Observation 41 32%Tour guide 12 19%
(of those with a tour)Own books 15 12%Fellow travellers 14 11%Visitor centre 3 2%
Table 7.4. Primary sources of learning during the trip to Keoladeo.
Post-trip activities were mainly those of "giving money to wildlife organisations"(52%), "birdwatching" (45%) and "bought a bird book" (41%)86. It should be notedhowever, that none of the post-trip activities were necessarily dependent upon theindividual having visited Keoladeo.
The overall Keoladeo knowledge scores (KKS)87, formed by aggregating those for theindividual questions, were generally quite poor88, with an overall mean of 15, just onepoint above the mid-way mark of 14, which, since the each question was of a yes/noformat, is the mark which might have been expected to have been achieved byguesswork alone. The scores were spread between 10 and 22 inclusive, and 77% (90)lay between 12 and 18. The individual questions on which the visitors performed bestwere those concerning the origin and management of the park, and the mammalspecies present therein. But 42% (51) of respondents failed to identify the site as
86 See Table 6.5 in the Keoladeo Report.87 KKS Keoladeo Knowledge Scores represent an index constructed from responses to questions aboutthe national park.88 See Figure 6.4 in the Keoladeo Report

83
having been artificially created, and the mean number of correct answers for mammalspecies was just under 3 out of a possible maximum score of 5.
Only 31% (39) of respondents correctly identified Keoladeo as a World Heritage Site,just 18% as a Ramsar site and a mere 6% were right in allocating it to the Man andBiosphere Reserve category. Knowledge of threats to the park was also rather limited,averaging less than 6 correct answers from 12. Most notable of these were the 95%(115) of respondents who failed to identify Juliflora as a threat, the 89% (108) whodid the same for amphibious grasses, and the 65% (42) who did the same both for thewater hyacinth and feral cattle. Finally, just 33% (40) identified tourism as a threat tothe park.
The Keoladeo knowledge scores (KKS) were disappointing in that they had an overallmean (15.3), which was not much higher than that which might have been expected tohave occurred by chance (i.e. 14.0). The obvious immediate inference to draw is thatamongst the respondent group, very little learning had occurred at the park. A closerexamination of the data relating to sources of learning about wildlife, about Keoladeo,and of the relationship between variables, leads to some rather more optimisticconclusions.
The correlation between "reading materials from books and libraries" and higherscores for the overall KKS, points to the importance of preparation in relation tolearning about Keoladeo. This is a finding which may seem to be rather obvious, but ithelps explain the relatively better KKS performance of some respondents. Similarly,the relationship suggested between higher Keoladeo knowledge scores and theutilisation of park guides, points to some learning occurring at the park in associationwith the activities of these guides. The picture becomes clearer when the relationshipsbetween the "sources of learning" are considered. The positive correlations theypresent suggest that those individuals who prepared most for the trip were those whotended to be the most active bird enthusiasts afterwards. It might be tempting toassume that the Keoladeo trip had such a profound effect on visitors as to turn manyof them in to avid birders. However, it seems rather more likely that those involved inpost-Keoladeo birding activities were committed birders to begin with. This contentionis strongly supported by the fact that 93% (28) of the visitors who went with"birder/wildlifer" tour operators declared having been a member of the RSPB duringthe past 5 years, as opposed to about 20% of the rest of the respondents. Althoughsome of these memberships may have been taken up after the trip, this seemsgenerally unlikely, given the highly specialist nature of the operators concerned. Areasonably strong correlation was also found between RSPB membership and the pre-departure reading both of relevant materials from libraries/book shops
This survey revealed low levels of general knowledge about biodiversity and did notproduce much evidence in support of the view that Keoladeo in itself provides apowerful educational experience. However, in regard to the latter point, it should beremembered that the questionnaire did not include any questions about birds. Perhapsif it had done so, the results would have been much better and the conclusions as tothe educational value of the park, rather more optimistic. Because of the strongornithological focus of many of those visiting the site, the measures of non-bird relatedknowledge might be misleading. Put simply, "birders" may be very much more

84
interested in birds than anything else. This group did however, perform significantlybetter than the "generalist" and "independent" visitors on the Keoladeo knowledgequestions, which suggests that those more interested specifically tended to know moregenerally.
Although the findings are inconclusive, the learning which seems to have taken placein connection with the respondents' trips to Keoladeo, appeared to be associated withthe context of preparatory study by the visitors prior to the trip. It may also have beeninfluenced by the activities of park guides during the trip and, was perhapscomplemented by subsequent study. This observation reveals nothing new, in thatcountless educational studies have found that the learning experience during a visit ofsome kind (e.g. to zoos and museums) is more effective when contextualised withinsome sort of educational programme. The question is, how much of the learning whichgoes on is influenced by each source? Clearly, a much more intensive investigation isneeded if an answer to this question is to be found, perhaps one which comparesvisitor cohorts which are exposed to different educational programmes at the park.
It should also be stressed that any learning found to be associated with Keoladeo doesnot necessarily imply a connection between this learning and participation in wildlife-friendly behaviour. Indeed, Finger (1994) has found that environmental knowledgeand awareness predict little of the variability in most forms of environmentalbehaviour, and that the main factors are experiences in and with the environment.This bodes well for nature tourism, and 45% of questionnaire respondents did indeedreturn the enclosed form expressing interest in becoming a "Friend of Keoladeo".However, receiving newsletters and/or giving money do not constitute very high levelsof ecological activism. In fact, nearly all of the wildlife-related activities recorded inthis survey could be carried out with scant regard to the interests of any wildlifeconcerned. The only exception was "practical conservation work", and it is worthremembering that respondents who most frequently participated in such activitiestended to be less well formally educated, a group also under-represented in therespondent sample.
7.4 Policy Implications
1. Tourists expressed more interest in information boards, vegetation labels and hidesthan in relatively expensive visitor interpretation centres.
2. There is potential for more sales of literature (books, maps and postcards) innational parks.
3. Significant numbers of tourists at Keoladeo choose to engage a guide. The parkguide is an important part of the experience and the primary source of learning atKeoladeo.

85
4. Systems of guide training which establish high quality standards may beinappropriate for the needs and interests of many tourists and the regulations mayfunction to prevent local people earning a living by guiding.
5. Conversely, where there is no regulation of guides, standards may be so low as tocause dissatisfaction.
6. It is necessary to train guides in languages, natural history, interpretive skills andvisitor management.

86
8. BIBLIOGRAPHY
Anderson D.R., Sweeney D.J. & Williams T.A. (1989).Statistics for Business and Economics 4th ed.West, St. Paul Minn. USA.
Balakrishan, M and Ndhlovu, D.E. (1992) ‘Wildlife Utilization and Local People: A Case-study inUpper Lupande Game Management Area, Zambia’, Environmental Conservation. (19):2
Bell, R.H.V. (1984) Research Priorities: What Does Management Need to Know? In, Bell, R.H.V. andMcShane-Caluzi, E. (eds.) Conservation and Wildlife Management in Africa. The Proceddings of aWorkshop Organised by the U.S. Peace Corps at kasungu National Park, Malawi. Office of Trainingand Program Support, Forestry and Natural Resources Sector, U.S. peace Corps.
Boo, E. (1992) The Ecotourism Boom WHN Technical Paper 2, WWF Washington DC:
Brotherton, D.I. (1981) Habitat restoration: why has not more been done? In E.Duffey (ed), HabitatRecovery and Restoration, RERG Report No.7:1-8.
Budowski, G. (1976) Tourism and conservation: conflict, coexistence or symbiosis? EnvironmentalConservation 3(1):27-31.
Cayford, J. (1993) Wader disturbance: a theoretical overview. Wader Study Group Bull. 68:3-5.
Ceballos-Lascurain H. (1996) Tourism, ecotourism and protected areas: The state of nature-basedtourism around the world and guidelines for its development IUCN, Gland, Switzerland, andCambridge, UK.
Baroness Chalker, (1994) Ecotourism on the Trail of Destruction or Sustainability? A Minister’s View inCater, E. and Lowman, G. (eds.) Ecotourism: a sustainable option? Wiley, London.
Chambers, M.R., Santiapillai, C. & Ishwaran, N. (1983) Tourist activity and behaviour of the leopardPanthera pardus fusca (Meyer 1794) in the Ruhuna National Park, Sri Lanka. J.Bombay Nat.Hist.Soc.81:42-48.
Child, G. (1994) Strengthening protected-area management: a focus for the 1990s, a platform for thefuture. Biodiversity and Conservation 3:459-463.
Child, G. & Heath, R. Underselling National Parks in Zimbabwe: The Implications for RuralSustainability. Society and Natural Resources 3 215-227.
Crittenden, A. (1975) Tourism's terrible toll. International Wildlife 5(3):4-12.
Edington, J.M. & Edington, M.A.(1986) Ecology, recreation and tourism. Cambridge University Press,Cambridge, England.
Freitag, T.G. (1994) Enclave tourism development: for whom the benefits role? Annals of TourismResearch, (21):3
Giongo, F., Bosco-Nizeye, J., & Wallace, G.N. (1994) A Study of Visitor Management in the World’sNational Parks and Protected Areas. Colorado State University, the Ecotourism Society, IUCN, andWCMC.
Goldsmith, E. (1974) Pollution by tourism. The Ecologist 48(1):47-48
Goldsmith, F.B. (1983) Ecological effects of visitors and the restoration of damaged areas. In A.Warren& F.B.Goldsmith (eds), Conservation in Perspective, J.Wiley & Sons Ltd, London.

87
Goodwin, H. (1996) In pursuit of ecotourism. Biodiversity and Conservation 5:277-291
Goodwin, H..J., Kent, I.J., Parker, K.T. & Walpole, M.J. (1996) Tourism, Conservation andSustainable Development: Methodology Report. An interim report to the ODA. Three volumes,unpublished, April 1996.
Goodwin, H..J., Kent, I.J., Parker, K.T. & Walpole, M.J. (1997a) Tourism, Conservation andSustainable Development: Volume II, Keoladeo National Park, India. Internal Report to the ODA.,(one of four volumes), unpublished, April 1997.
Goodwin, H..J., Kent, I.J., Parker, K.T. & Walpole, M.J. (1997b) Tourism, Conservation andSustainable Development: Volume III, Komodo National Park, Indonesia. Internal Report to the ODA.,(one of four volumes), unpublished, April 1997.
Goodwin, H..J., Kent, I.J., Parker, K.T. & Walpole, M.J. (1997c) Tourism, Conservation andSustainable Development: Volume IV, The South East lowveld, Zimbabwe. Internal Report to the ODA.,(one of four volumes), unpublished, April 1997.
Government of India (1981). Census of India. Series 18, Rajasthan, Parts XIII A&B
Graefe, A.R., Kuss, F.R. & Vaske, J.J. (1990) Visitor Impact Management: The Planning Framework.National Parks and Conservation Association, Washington DC.
Gutzwiller, K.J. (1991) Assessing recreational impacts on wildlife: the value and design of experiments.Trans.56th North Am.Wildl.Nat.Res.Conf.:248-255.
Indonesia Directorate General of Tourism (1993) Analisa Pasar Wisatawan Mancanegara 1992/3Government of Indonesia.
IUCN (1993) Parks for Life: Report of the IVth World Congress on National Parks and Protected AreasIUCN, Gland, Switzerland
Jenner, P. & Smith, C. (1992) The Tourism Industry and the Environment Special Report 2453.Economist Intelligence Unit, London.
Jordan, C (1996) An Investigation into the Opinions of UK Tour Operators Towards SustainableTourism Development at Keoladeo, Komodo and Gonarezhou. Institute of Mathematics and Statistics,UKC. Unpublished thesis.
Laarman, J.G., & Gregerson, H M.(1996) Pricing policy in nature-based tourism. Tourism Management,17(4):247-254.
Liddle, M. J. (1975) A selective review of the ecological effects of human trampling on naturalecosystems. Biological Conservation 7:17-36.
Koikai, M.K. (1992) Why Maasai Mara is the most visited reserve in East Africa. In C.G.Gakahu (ed),Tourist attitudes and use impacts in Maasai Mara National Reserve, Proceedings of a workshop atMaasai Mara National Reserve, March 1991. Wildlife Conservation International, Nairobi, Kenya.
Makombe, K. (ed) (1994) Sharing the Land: Wildlife, People and Development in Africa, IUCN/ROSAEnvironmental Issues Series No. 1, IUCN/ROSA, Harare, Zimbabwe and IUCN/SUWP, Washington,USA.
Mathieson, A. & Wall, G. (1982) Tourism: Economic, physical and social impacts. Longman, Harlow.
McCool, S.F. (1990) Limits of Acceptable Change: Evolution and Future. In, Towards serving Visitorsand Managing Our Resources. Proceedings of a North American Workshop on Visitor Management inParks and Protected Areas. Tourism Research and Education Centre, University of Waterloo: 185-194.

88
McDougal, C. (1980) Some observations on tiger behaviour in the context of baiting. J.BombayNat.Hist.Soc. 77:476-485.
McNeely, J. A. (1994) Protected Areas for the 21st century: working to provide benefits to societyBiodiversity and Conservation 3:390-405.
McShane, T.O. (1990) Wildlands and Human Needs: Resource Use in and African Protected Area.Landscape and Urban Planning 19.
Madsen, J. (1994) Impacts of disturbance on migratory waterfowl. IBIS 137:67-74.
Metcalfe, D (1996) Questioning and Analysing German Tour Operators and Tourists with Referenceto DICE’s Tourism, Conservation and Sustainable Development’s Unit’s Projects in India, Indonesiaand Zimbabwe. Institute of Mathematics and Statistics, UKC. Unpublished thesis.
Muthee, L.W. (1992) Ecological impacts of tourist use on habitats and pressure-point species. InC.G.Gakahu (ed), Tourist attitudes and use impacts in Maasai Mara National Reserve, Proceedings ofa workshop at Maasai Mara National Reserve, March 1991. Wildlife Conservation International,Nairobi, Kenya.
Myers, N. (1972) National parks in savannah Africa. Science 178:1255-63
Nepal, S.K. and Weber, K.E. (1995) Managing resources and resolving conflicts: national parks andlocal people Int. J. Sustain. Dev. World Ecol. 2.
Onyeanusi, A.E. (1986) Measurements of inpact of off-road driving on grasslands in Maasai Maranational Reserve, Kenya: a simulation approach. Env.Cons. 13(4):325-329.
Philips, A. (1985) Tourism, Recreation and Conservation in National Parks and Equivalent Reserves.Derbyshire: Peak Park Joint Planning Board.
Pierce, G.J., Spray, C.J. & Stuart, E. (1993) The effect of fishing on the distribution and behaviour ofwaterbirds in the Kukut area of Lake Songkla, Southern Thailand. Biol.Cons. 66:23-34.
Pirie, F. (1996) The Promotion of Zimbabwe’s National Parks in the Brochures of UK TourOperators, Unpubl. MSc thesis. Durrell Institute of Conservation and Ecology, UKC.
Preece, N., van Oosterzee, P. & James, D. (1995) Biodiversity Conservation and Ecotourism: aninvestigation of linkages, mutual benefits and future opportunities. Biodiversity Series, Paper No.5,Biodiversity Unit, Department of the Environment, Sport and Territories, Canberra, Australia.
Roe, D., Dalal-Clayton, B., Leader-Williams, N. (1997) The Environmental Impact of WildlifeTourism, A| Review of the Literature DFID/IIED, London.
Stankey, G.H., Cole, D.N., Lucas, R.C., Petersen, M.E. and Frissell, S.S. (1985) The Limits ofAcceptable Change (LAC) System for Wilderness Planning. USDA Forest Service. intermountain Forestand Range Experiment Station. General Technical Report INT-176. Ogden, Utah.
US OTA (1993) Science and technology issues in coastal ecotourism. Tourism Management 14(4):307-316.
Valentine, P. S. (1993) Ecotourism and nature conservation: a definition with some recent developmentsin Micronesia. Tourism Management 24(2):107-116.
Wall, G. & Wright, C. (1977) The environmental impact of outdoor recreation. Department ofGeography Series No.11, University of Waterloo, Waterloo, Canada.

89
Wells, M. and Brandon, K. (1992) People and Parks - Linking Protected Area Management withLocal Communities World Bank. Washington DC.
Zebu, E. H. and Bush, M. L. (1990) Park-People Relationships: an international review. Landscape andUrban Planning 19: 117-131.
Ziffer, K. A. (1989) Ecotourism the Uneasy Alliance. Conservation International,Washington DC:

9. APPENDIX 1: Research and Scientific/Technical Objectives
Research Objectives
Over a three year period the project will provide comparative case studies of sites, inthree developing countries, in order to:
a) identify methods of providing sustainable revenues from tourism forconservation and development.
b) examine means of improved site management providing increased revenueswhilst conserving the local ecology.
c) identify means of improved visitor management in order to decrease theadverse ecological effects of tourism.
d) raise the income and related benefits which local people gain from tourismbased on biodiversity.
e) provide a methodology which will enable local researchers to continue tomonitor the survey sites, and to provide research reports, which will enablesimilar and comparable work on the compatibility of tourism development andconservation to be undertaken in other developing countries.
Scientific/technical objectives
The project will develop and test a methodology for assessing the relationships betweentourism development and conservation which can be applied by local institutions indeveloping countries.
The project will determine and measure, using a standardised survey of comparativesites, the ecological, economic and social relationships, including gender, betweentourism development and conservation and the regulatory framework within which theytake place, in order to:
a) quantify the visitor numbers and assess the forms of tourist visits which areconsistent with sustainability.
b) identify the local indigenous people's incomes from the sites and identify theadditional economic benefit which could accrue to them from tourism andbiodiversity.
c) identify the net contribution of tourism development to conservation andrestoration, and to assess the commercial and regulatory conditions necessaryfor increasing the contribution.
d) identify and assess the qualitative contribution of tourism to conservationthrough visitor education and increased awareness.
e) identify and quantify the benefits and problems created by integration into theinternational market.
10. APPENDIX 2: Data Requirements For Future Monitoring
Introduction
Research objective (e) is
to provide a methodology which will enable local researchers to continue tomonitor the survey sites, and to provide research reports, which will enablesimilar and comparable work on the compatibility of tourism development andconservation to be undertaken in other developing countries.
In this appendix we shall consider some of the issues that this raises. The mainemphasis will be on what data it is practicable to collect, together with discussion onthe sources of information and what methods might be used to collect such data.
Firstly, it must be emphasised that data collection and monitoring must be carried outfor clearly defined reasons. The collection of data for its own sake will not only usescarce resources, but may also demoralise the surveyors. In such circumstances,sustained effort is very difficult to maintain. Each chapter of this report relates toparticular analyses that we have performed and explains why it was necessary toobtain certain information. Since it would be difficult for such thorough analyses tobe continued on a permanent basis, in this appendix a more manageable data-collection task is described, on a chapter by chapter basis. Once this has been done, itwill be possible to summarise the recommendations in terms of who will be surveyedand how the survey might be performed.
Data required, by area of analysis
Chapter 2: Visitor PatternsAlmost any aspect of park management will require a knowledge of how many touristsare visiting the site. As we have seen, this information is collected, but in varyingdetail (particularly in terms of country of origin). With dual pricing already inexistence, or as a possible policy option, the very minimum information required iswhether each visitor is a national of the country or from abroad. However, it will infuture be relatively straightforward to continue analyses such as those in Chapter 2since most of the necessary data are already collected. In summary, the followinginformation is required.
• Total visitor numbers, by month and by nationality (at least to the level ofdomestic/foreign).
Chapter 3: Visitor Impacts and ManagementImpact does need to be measured since it is essential to identify any activity that couldbe deleterious to conservation. It is debatable whether such information has to bequantitative; in some cases it is useful to have numerical measures, but in othersdescriptive indicators would serve well. This is an area where park employees who

have intimate local knowledge would be the best informants. Data to be collectedinclude the following.
• Visitor numbers by time of year (monthly).• Identification of where tourists go within the park, and in what numbers at what
time of year, and with what mode of transport.• Identification of any events salient for conservation, for example destruction of
habitat and disturbance of animals.• Indicators of conservation, for example species counts.
Chapter 4: Contribution of Tourism to Park FinancesMuch of the information necessary for the analysis of park finances has been definedwith reference to Chapter 2. Knowing how many people are entering the park andhow much they are paying does give an immediate figure for current revenues.However, planning is an essential part of management and future revenues aredependent on continued demand and on entrance fees that could be changed as part ofpark policy. It is necessary, therefore, to know the degree to which tourists aresatisfied with the experience of visiting the parks, whether they feel they haveobtained value for money, and whether they would be prepared to pay a higherentrance fee. The essential data to collect are
• Visitor numbers and fees paid, including any differential fees.• Attitudes of visitors to the entrance fee they were charged and the quality of visit
experienced. Additional questions on whether visitors would have been preparedto pay more could be included.
Chapter 5: Tourism and Local DevelopmentIt is a very difficult task to produce a comprehensive assessment of the impact of theparks on local development. Some income, such as wages paid to locally resident parkemployees, could be calculated from the park accounts. However, to account for allmonetary flows into the local economy would, in practice, almost certainly beimpossible. Counting the numbers of people employed in tourism-related activitiescould be done. However, there are many who do not work full-time on activitiesrelated to tourism. It would be very difficult to estimate the proportion of timededicated exclusively to those activities which can unequivocally be classed as“tourist related”? Notwithstanding this problem, it should be possible to estimate thenumbers of people whose activities are involved with tourism and tourists (and gender,age, occupation, wage and origin89), perhaps in broad classes such as “definitelyrelated”, “partially related” and “marginally related”.
Another desirable form of survey would be to monitor in a qualitative way changes inthe provision of services connected with tourism. Questions that could be askedinclude the following.
89 A key issue is the proportion of employment going to local people.

• Are village-made products now on sale that used not to be?• Have any hotels opened, closed, expanded or changed the quality of
accommodation offered?• Are any new transport facilities available?• Has the training and quality-control of guides changed in any way?
In addition, it would be sensible to monitor the opportunities for new services. Thiscould be achieved through the visitor survey which would include questions such as:
• Are there any products they would like to buy that are unavailable?• Would they take the opportunity to visit a “tourist village” if there were one in the
vicinity?
This part of the survey could be modified on a regular basis to reflect changedconditions and new ideas.
Data also needs to be collected on visitor expenditure in the local economy.
Finally, it is clear that having a national park in the vicinity affects the lives of localpeople in many, complicated ways. There are undoubtedly both benefits anddrawbacks and it is important that those responsible for policies affecting the parkshould be aware of the impacts such policies have on local people. It is thereforeadvisable that there is some form of continuing survey into local experiences andattitudes.
Chapter 6: Integration into the International MarketThere are two aspects to monitoring integration into the international market: theforeign tourists themselves and the tour operators. As far as the tourists areconcerned, much relates, as in other chapters, to their reasons for visiting the countryand the national park, and their satisfaction with the visit. Such information can beobtained from a visitor survey. In particular this would have to elicit the followingdata
• nationality of visitor• where visiting in the country• length of stay in country• reasons for visiting country• reasons for visiting site• assessment of satisfaction of visit to site
It is more difficult to monitor tour operators since these are located in many countriesof the world. It may be possible to investigate what services their local agents areproviding, but it is difficult to see how a comprehensive picture could be drawn andkept up to date. It would be preferable to approach the problem via the visitor survey.An essential question within the survey would be whether the visitor was a packagetourist or not and, if he or she was travelling on a package deal, one could ask what
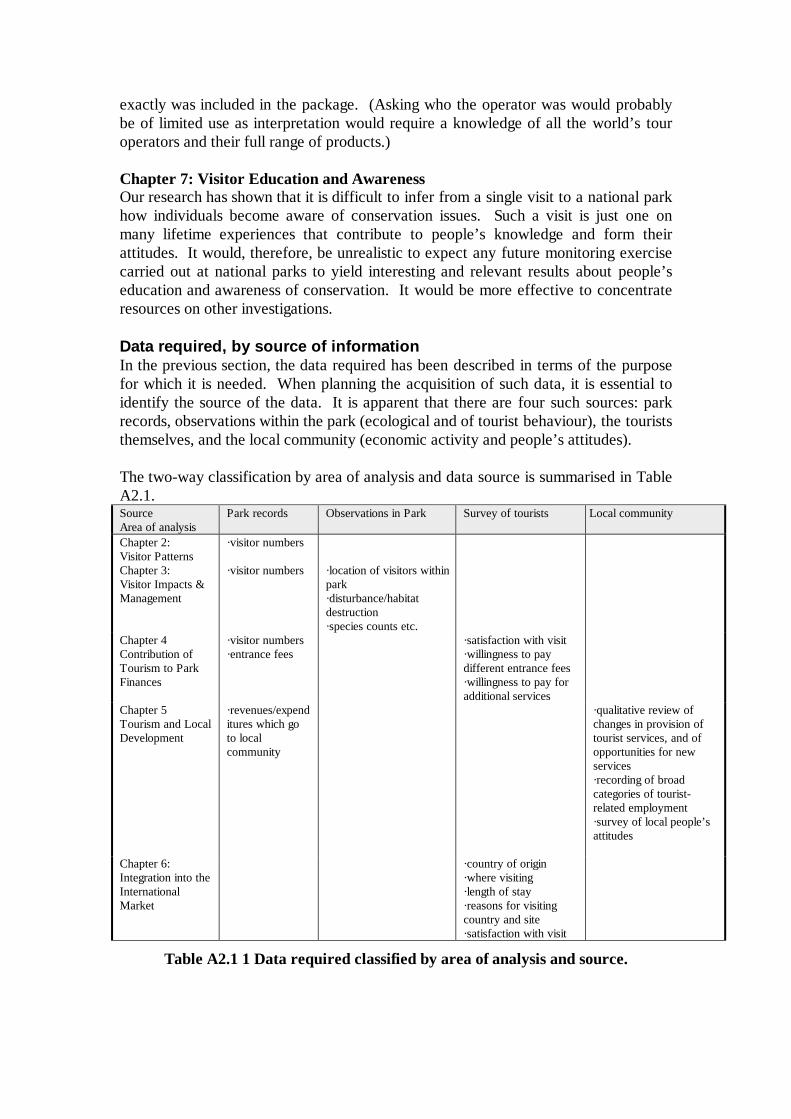
exactly was included in the package. (Asking who the operator was would probablybe of limited use as interpretation would require a knowledge of all the world’s touroperators and their full range of products.)
Chapter 7: Visitor Education and AwarenessOur research has shown that it is difficult to infer from a single visit to a national parkhow individuals become aware of conservation issues. Such a visit is just one onmany lifetime experiences that contribute to people’s knowledge and form theirattitudes. It would, therefore, be unrealistic to expect any future monitoring exercisecarried out at national parks to yield interesting and relevant results about people’seducation and awareness of conservation. It would be more effective to concentrateresources on other investigations.
Data required, by source of informationIn the previous section, the data required has been described in terms of the purposefor which it is needed. When planning the acquisition of such data, it is essential toidentify the source of the data. It is apparent that there are four such sources: parkrecords, observations within the park (ecological and of tourist behaviour), the touriststhemselves, and the local community (economic activity and people’s attitudes).
The two-way classification by area of analysis and data source is summarised in TableA2.1.SourceArea of analysis
Park records Observations in Park Survey of tourists Local community
Chapter 2:Visitor Patterns
·visitor numbers
Chapter 3:Visitor Impacts &Management
·visitor numbers ·location of visitors withinpark·disturbance/habitatdestruction·species counts etc.
Chapter 4Contribution ofTourism to ParkFinances
·visitor numbers·entrance fees
·satisfaction with visit·willingness to paydifferent entrance fees·willingness to pay foradditional services
Chapter 5Tourism and LocalDevelopment
·revenues/expenditures which goto localcommunity
·qualitative review ofchanges in provision oftourist services, and ofopportunities for newservices·recording of broadcategories of tourist-related employment·survey of local people’sattitudes
Chapter 6:Integration into theInternationalMarket
·country of origin·where visiting·length of stay·reasons for visitingcountry and site·satisfaction with visit
Table A2.1 1 Data required classified by area of analysis and source.

Data collection
There is much that can be said about the methods of data collection. The principles ofdesigning and implementing surveys are well covered in the literature90. What will beconsidered here is a brief appraisal of the needs and practicalities of the requiredsurveys. Each source will be considered in turn.
Obtaining information from the park records is straightforward since the data arealready recorded. There could be issues of confidentiality, for example relating towage costs, but the purpose of any future monitoring is to aid in the management ofthe park. Unless the park is closely involved and fully co-operating, the wholeexercise would be fruitless.
The types of observation required within the park are covered in detail in Chapter 3.Again, it is assumed that the park management would be fully involved and so theexpertise and co-operation of their staff would be available. Since local conditionsvary greatly from one park to the next, it would not be wise to set down detailedprocedures here.
The tourist survey is the source of information where some advance specification ispossible. The sorts of questions to be asked have already been described, butdiscussion of how they should be asked would be valuable. There are two approachesthat could be employed: interviewing and unsupervised questionnaires.91 It is notadvisable to give an absolute recommendation since the group actually performing thesurvey would have to be involved in the decision. Practicability is the most importantconcern. It is difficult to maintain motivation in a long, drawn-out exercise. Thoseinvolved need to see the fruits of their labour, and if they do not, it is likely that othermore pressing tasks will supplant the survey activities. Although one would like tohave a sample that is representative of visitors over the whole year, for motivationalreasons it would seem better to concentrate the surveying effort. In our experience itis possible to perform a short survey very productively by means of face-to-faceinterviews. One possibility would be to dedicate a few days once every quarter to anintensive series of visitor interviews. The effort would be concentrated, there wouldbe a clear end, and, if data-processing facilities are available, results could be soonproduced (the time required would decrease with training and experience).
The information that could be obtained from the local community has been discussedabove. At this stage, it is not clear which agency would perform the survey and whowould be their client. It would not be appropriate for park staff to be involved withthis work as it is not related to their competencies. The work could be suitable for anNGO; for example, WWF have been involved with such surveys.
90 See, for example, Moser C.A. and Kalton G., Survey Methods in Social Investigation, 2nd edition,Gower, Aldershot, 1971.91 Discussion of their relative merits can be found in the interim report Goodwin et al (1996).

Conclusions
The data that it would be practicable to collect have been described both in terms ofthe area of analysis to which they are relevant, and of the sources of information. It ismore difficult to make definitive recommendations about the best means of collectingthe data since the precise nature of the local collaborators cannot be known.Nevertheless, some tentative suggestions and broad principles have been put forward.

11. APPENDIX 3: Exchange Rates
End of period (December) US$ exchange rates as published by the IMF.
IndiaYear 1990 1991 1992 1993 1994 1995Rs/$ 18.1 25.8 26.2 31.4 31.4 35.2
Indonesia
Year 1990 1991 1992 1993 1994 1995Rp/$ 1901.0 1992.0 2062.0 2109.9 2199.9 2308.0
Zimbabwe
Year 1990 1991 1992 1993 1994 1995Z$/ $ 2.6 5.1 5.5 6.9 8.4 9.3
Real effective exchange rate indices (1990=100), based on relative wholesale prices.IMF financial statistics, January 1997.
Year 1990 1991 1992 1993 1994 19951996 (firstquarter)
US$ 100 98 95.4 98.6 96.7 90.4 94.9