
TOU Pilot Strategies and Lessons - e21 Initiative
69
TOU Pilot Strategies and Lessons Lon Huber, Senior Director
Transcript of TOU Pilot Strategies and Lessons - e21 Initiative

TOU Pilot Strategies and LessonsLon Huber, Senior Director

Topics Covered Today
• TOU Pilot Best Practices
• Findings from Pilots and TOU Programs Across North America
• Recommendations
2
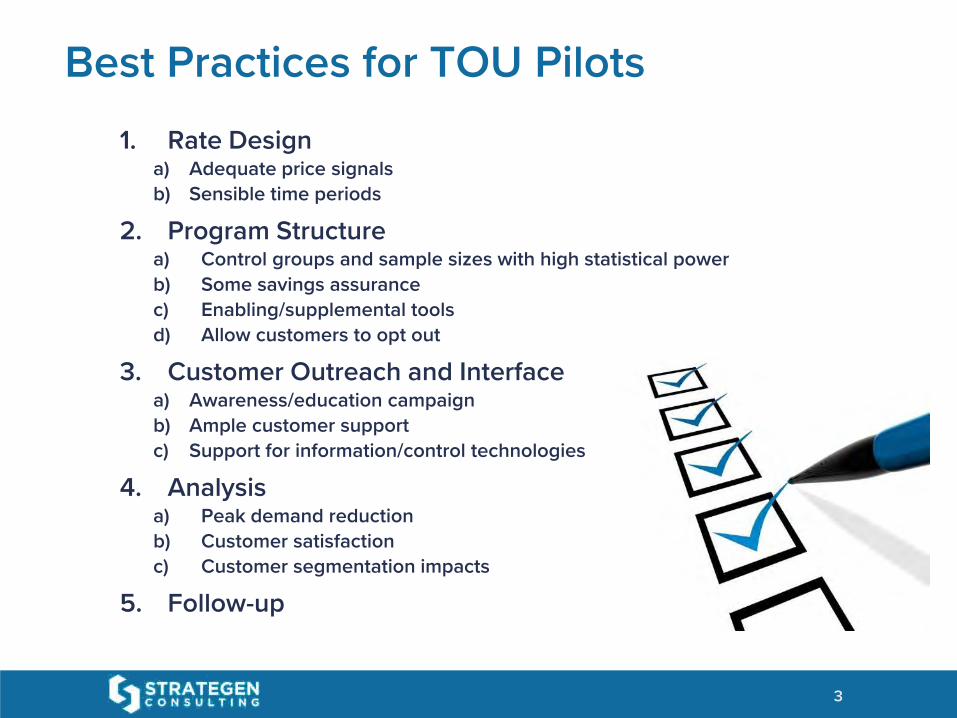
1. Rate Designa) Adequate price signals
b) Sensible time periods
2. Program Structurea) Control groups and sample sizes with high statistical power
b) Some savings assurance
c) Enabling/supplemental tools
d) Allow customers to opt out
3. Customer Outreach and Interfacea) Awareness/education campaign
b) Ample customer support
c) Support for information/control technologies
4. Analysisa) Peak demand reduction
b) Customer satisfaction
c) Customer segmentation impacts
5. Follow-up
3
Best Practices for TOU Pilots

▪▪
▪▪
▪▪
Common Pitfalls
4

▪ Best practices based on Strategen’s first hand experience and review of over a dozen studies on TOU pricing
▪ Several recent studies conducted under DOE’s Smart Grid Investment Grant Program:
▪ 11 studies at 10 utilities across the country,
▪ Many types sizes, and regions
▪ Over 100,000 customers
▪ Randomized controlled trials to measure customer response
▪ Additional DOE funded studies conducted for several northeast utilities (e.g. NSTAR, Unitil)
5
Learnings from Across the Country

0%
2%
4%
6%
8%
10%
12%
14%
16%
Basic TOU Advanced TOU
Peak Demand Reduction
6
••
••
¢/kWh
Strategy 1: Advanced TOU Rate Design

0%
5%
10%
15%
20%
25%
Advanced TOU CPP/CPR Event Days
Peak Demand Reduction
7
••
¢/kWh
Strategy 2: Critical Peak Pricing/Rebates

0%
5%
10%
15%
20%
25%
Basic TOU Basic TOU + Programmable CommunicatingThermostat
Peak Demand Reduction
8
••
Strategy 3: Customer Control Technologies

0%
5%
10%
15%
20%
25%
30%
35%
40%
Basic TOU Advanced TOU Advanced TOU +CPP/CPR
Advanced TOU +CPP/CPR + PCT
Peak Demand Reduction
9
¢/kWh
¢/kWh
¢/kWh
Combined Approach

Topics Covered Today
• Best Practices
• Findings from Pilots and TOU Programs Across North America
• Recommendations
10

11
Pilots and Programs Across North America

12
Time of Use EZ-3 Rate Plan
Salt River Project - Time of Use
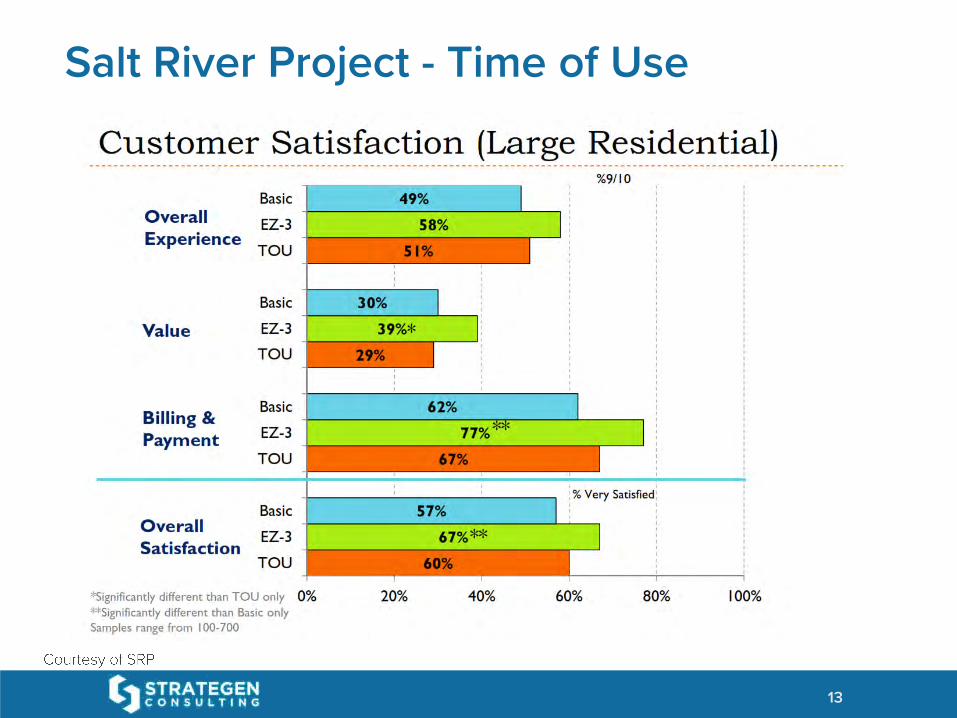
Salt River Project - Time of Use
13
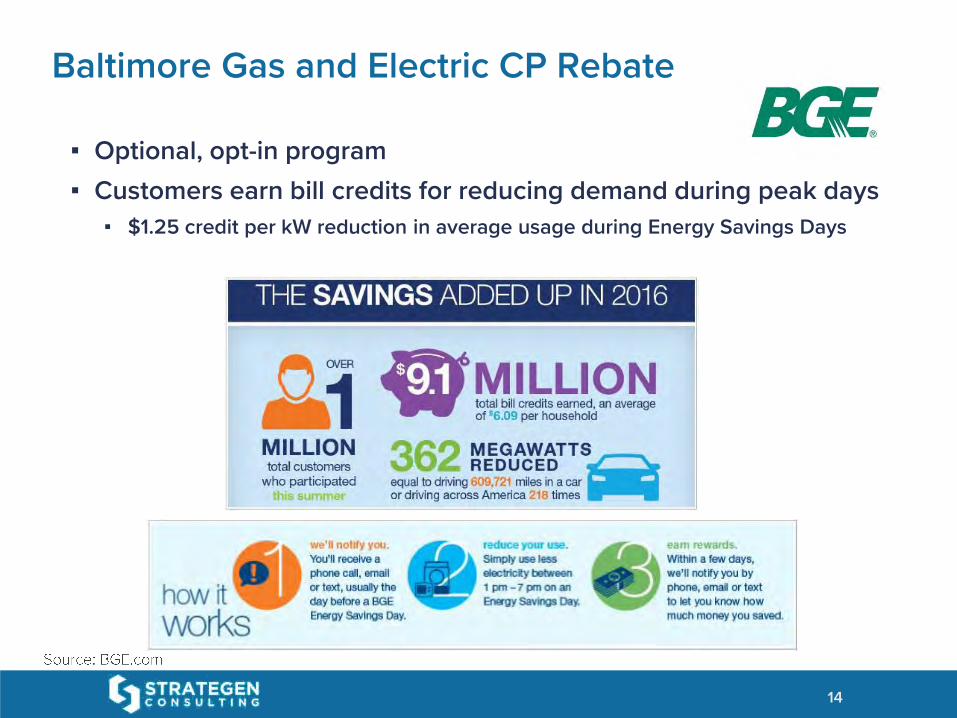
▪ Optional, opt-in program
▪ Customers earn bill credits for reducing demand during peak days
▪ $1.25 credit per kW reduction in average usage during Energy Savings Days
Baltimore Gas and Electric CP Rebate
14

NV Energy – PowerShift Program
▪ Controlled thermostat and energy optimization service for residential customers
▪ 1.8 kW average per customer demand reduction per event
▪ ~35,000 customers enrolled
▪ 85% of NV Energy's customers enrolled in the program have positive attitudes towards the program
15

16
National Grid Worcester Pilot
▪ Opt-out
▪ Early deployment of 15,000 AMI meters in Worcester, MA
▪ 10% received in home technologies
▪ 95% on TOU with CPP, 5% on PTR
▪ Goal to reduce active participants’ peak and average loads by at least 5% - Energy and demand targets with wide peak

17
National Grid Worcester Pilot Interim Results
▪ Active Customers reduced their average peak demand during peak events 4x more than other customers
▪ Active Customers are participants who opted into enabling technologies and customers that logged into the pilot portal at least once
Active participants + active technologies = high demand reductions

18
National Grid Worcester Pilot Interim Results
▪ Active customers load reductions ranged from 10% to 31% on Peak Conservation Days
▪ Customers with PCTs saw greatest load reductions, up to 31% on CPP
▪ Average customer annual savings of $109
▪ 98% customer retention in year 1 (2015)
▪ 72% customer satisfaction rate
The goal is to turn passive customers into active customers

Three main initiatives:
▪ 1) Statewide Pricing Pilot 2003 – 2004
▪ 2) Sacramento Municipal Utility District (SMUD) SmartPricing Pilot 2010 – 2014
▪ 3) Interim TOU Pilots (D. 15-07-001) 2016 – 2018
▪ Intend to inform default residential TOU rates in 2019
19
California TOU Pilots and Study Timeline

▪ Response to 2000 – 2001 energy crisis
▪ All three CA IOUs conducted TOU pilot
▪ Goals
▪ Estimate average impact of TOU rates to predict impacts of alternative pricing plans
▪ Determine customer preferences for Time Varying Rates (TVR)
▪ Evaluate effectiveness and customer perceptions about TVR
▪ 2,500 customers from July 2003 to December 2004
▪ Found savings from TOU and CPP
Small sample size made many findings statistically insignificant
20
California Statewide Pricing Pilot

SMUD – SmartPricing Pilot
SmartPricing Options pilot
▪ Project ran Aug 2010 – Jun 2014
▪ ~7,000 customers at project start
▪ Rates effective June 2012
▪ Pilot end Jan 2014
▪ Final evaluation Jun 2014
▪ $9.9 million total budget
▪ Five different rate offerings
▪ Positive results were cited in CPUC decision to default all CA IOU residential customers to TOU rates in 2019
▪ SMUD is outside of CPUC jurisdiction. This allowed SMUD to design an opt-out program
21

SMUD – SmartPricing Pilot
22
Opt-out TOU rates with CPP (no IHD) would be very cost effective and yield high demand savings

Opt-in vs Opt-out
▪ Four types of customers:
▪ Always adopters (would always opt-in)
▪ Complacents (do not opt-out of default rates)
▪ Opt-out
▪ Unaware
▪ Default rates with an opt-out option have much higher overall enrollment; approximately 5x
▪ Default rates yield much higher aggregate load impacts due to some complacents response to the tariff
▪ SMUD SmartPricing: 20% always adopters, 50% complacents, and 30% likely unaware
23
Opt-in rates may more effectively reduce demand per customer, however, results from opt-in pilots are not likely to predict system-wide demand savings

California Interim TOU pilots
▪ High renewable generation has increased the need for peak demand reductions late in the day – ‘Head of Duck’
▪ ‘Interim’ because these studies are being performed in the period before Time of Use rate will be default for all CA residential customers
▪ In 2019, all residential customers in CA IOUs territory will be defaulted onto a Time of Use tariff with the option to opt out.
▪ Each IOU is currently performing studies
▪ $23 million budget over 2015 – 2018 study period
24
Results from this pilot study will inform the defaultTOU rates for all California IOU customers in 2019

▪ Randomized Control Trial (RCT) strategy - Participants are randomly assigned to a rate (or control), unlike opt-in strategies.
▪ Pay-to-Play (PTP) recruitment strategy – customers are paid to enroll in the program, rather than a specific rate option
▪ Substantial portion incentives is tied to the completion of customers surveys
▪ Target various climate zones, income levels and usage patterns
▪ Approximately 52,000 customers across all three IOUs
25
Financial incentives can reduce the effect of selection bias
California Interim TOU Design
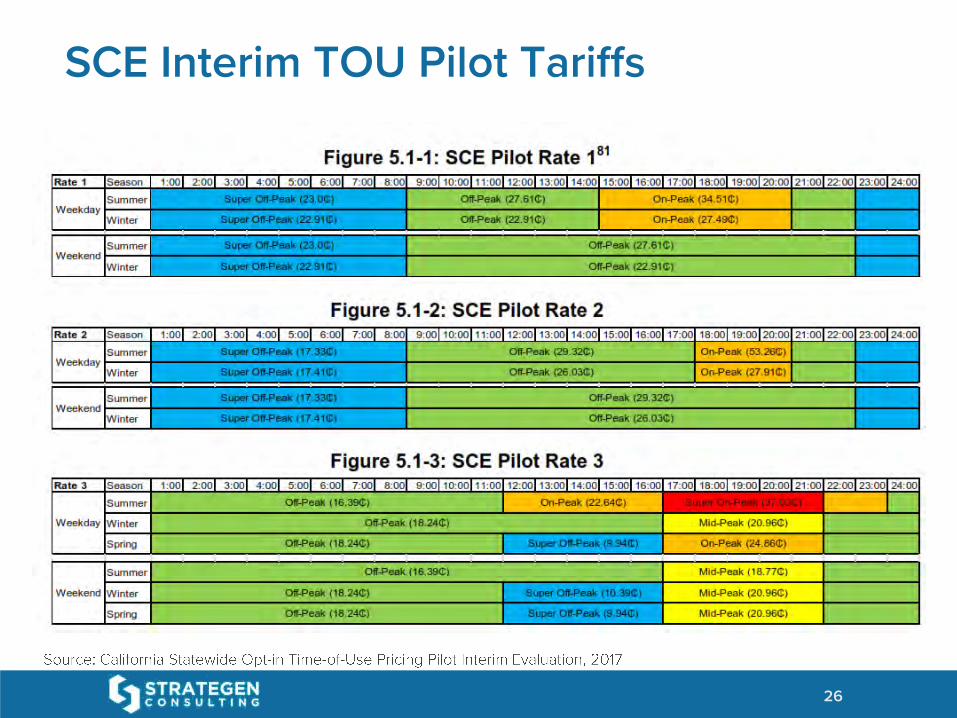
26
SCE Interim TOU Pilot Tariffs

Preliminary results from a few summer months
▪ 4%-6% average savings over all the rate plans
▪ Summer bills slightly increased for almost all participants
▪ Largest demand reductions occurred in hot climates and the lowest reductions occurred in cool climates
▪ CARE/FERA customers had lower average peak reductions
▪ Smart phone app had very few downloads
27
Interim TOU Report Takeaways

▪ Began offering Time of Use rates in 1982
▪ Well marketed and advertised
▪ 568,500 residential customers on time differentiated rates
▪ ~50% opt-in Time of Use rates
28
Customers are happy with Time Varying Rates over the long run
Arizona Public Service

29
The APS Approach

30
The APS Approach

31
TVP Structure TechnologyAverage Impacts
on Peak Load (Daily)
Average Impacts on Peak Load
(Critical Event Day)
• OG&E projected that a widely used VPP rate would be able to avoid a generation investment.
• Successful pilot continues into 2017
• 1.3kW average peak demand reduction per customer
• High customer satisfaction rates
Oklahoma Gas and Electric Pilots
• Well designed price signals can defer or avoid generation investments• Successful pilots can be extended into full programs

32
• Two rates for residential and small commercial:
• Time of Use
• Variable Peak Pricing with Critical Pricing component
• Customers with central air are offered a free PCT preprogrammed to respond to OG&E’s dynamic pricing signal – Non-PCT customers bring 1/3 the load reduction.
• 2015 program cost was $15 million
• Over ~170 MW of demand response
• OG&E has received very high customer satisfaction
• Currently over 120,000 customers are enrolled in VPP rate
Oklahoma Gas and Electric Pilots
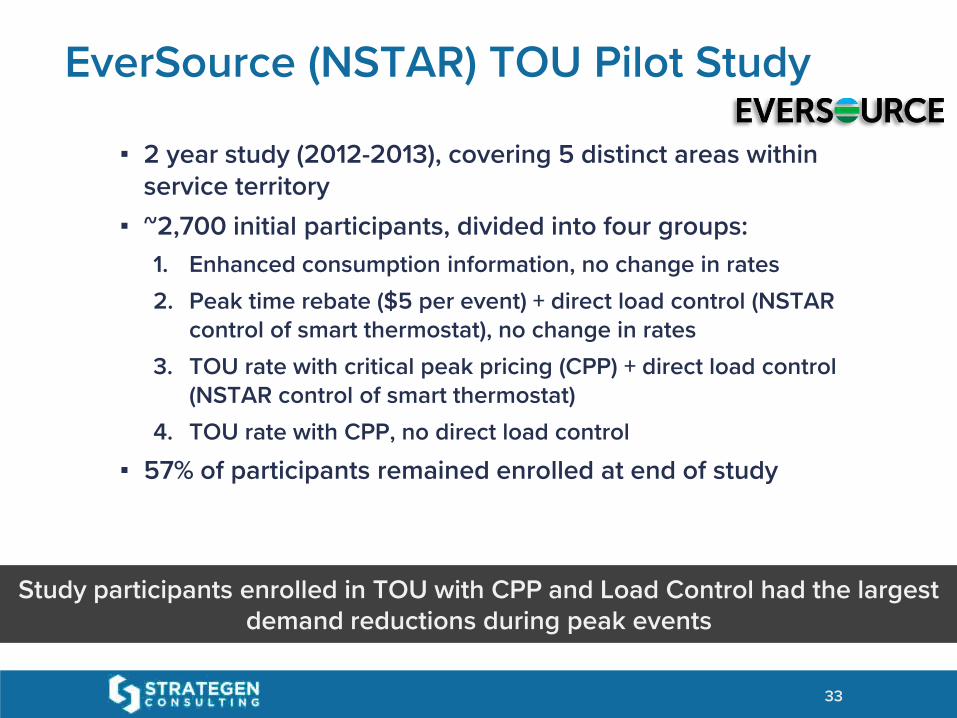
▪ 2 year study (2012-2013), covering 5 distinct areas within service territory
▪ ~2,700 initial participants, divided into four groups:
1. Enhanced consumption information, no change in rates
2. Peak time rebate ($5 per event) + direct load control (NSTAR control of smart thermostat), no change in rates
3. TOU rate with critical peak pricing (CPP) + direct load control (NSTAR control of smart thermostat)
4. TOU rate with CPP, no direct load control
▪ 57% of participants remained enrolled at end of study
33
Study participants enrolled in TOU with CPP and Load Control had the largest demand reductions during peak events
EverSource (NSTAR) TOU Pilot Study

34
Average Peak Load Reductions

35
Event Day Load Reductions

36
• 100% AMI and default TOU for all customers with opt-out option
• ~90% enrollment
• 103,000 qualified customers involved in study
• Very long summer peak period; 11am to 5pm
• Extremely modest results
• Declining results year over year
Cautionary Tale: Ontario TOU

37
• Customers may struggle to respond to Time of Use rates withvery long peak periods
• Customer response may fatigue year to year if bill savings are not sufficient
• Province-wide summer peak residential demand reductions
• 3.26% pre-2012
• 2.27% in 2012
• 2.00% in 2013
• 1.18% in 2014
Cautionary Tale: Ontario TOU

▪ TOU Pricing Pilot launched in 2001 with 300,000 customers.
▪ 4 daily meter reads using AMR technology.
▪ Customer charge of $1.25/month to cover the automated meter reading costs
▪ Rate differential too small?
▪ Customers did respond and conserve, but…
▪ Shifting 200 kWh per month saved <$2.00. Often not enough to cover meter fee!
▪ Customer backlash:
▪ 94% of participants ended up paying higher bills.
▪ Cancellations soared after customers began receiving quarterly reports on bill savings.
▪ Program cancelled one year ahead of schedule:
▪ Commission analysis: “Not only have TOU (time of use) customers been paying higher bills than they would have paid under non-TOU rates, but, in addition, PSE apparently has experienced net lost revenue.”
38
Cautionary Tale: Puget Sound Energy

Topics Covered Today
• Best Practices
• Findings from Pilots and TOU Programs Across North America
• Recommendations
39

Time of UsePlatform

Time of UsePlatform
Advanced Metering

CustomerWeb Portal
CustomerChoice$
CostSavings
Mobile App Customer Communication
Critical PeakPricing
Time of UsePlatform
Advanced Metering

43
Electric Vehicles
CustomerWeb Portal
Distributed Generation
72
SmartThermostats
CustomerChoice
EnergyEfficiency
$Cost
Savings
Mobile App Customer Communication
Smart Water Heaters
Critical PeakPricing
Time of UsePlatform
Advanced Metering

Program Design Choices
44
Enrollment
Education
Incentives
Participant Types
Technology

▪ Set objectives and metrics first
▪ What are you trying to get customers to do?
▪ Engagement is important
▪ Without education and outreach, TOU price signals alone will not achieve program goals.
▪ Outreach must extend beyond ‘welcome package’
▪ Understand customers are not utility-focused
▪ Most customers do not want to know complex energy information, even if it can save them money
▪ Instead, use data for better marketing
45
Recommendations for TOU Design

▪ TOU rates can be customer friendly and reduce peak period loads.
▪ Peak day programs and technology enhance impact, particularly during event days.
▪ Without ongoing efforts, customers lose interest over time.
▪ Aggressive marketing and education is important for sustaining impact over time.
▪ Technology does not always function as designed and customers must play a role in maintaining operability
46
Key Findings

▪ Set realistic expectations
▪ There are always tradeoffs
▪ Rate design and implementation strategy are equally important to a successful pilot
▪ Opt-out pilots are more cost effective and more representative of the customer base
▪ Segmenting to understand group impacts can be helpful
▪ Make the pilot useful and do something based on the findings after its conclusion
47
Recommendations for TOU Design

Thank you!
Lon HuberStrategen Consulting, LLC
Email: [email protected] Phone: 928-380-5540
48
More Information

49
Appendix

• Low Income Access
• Marginal Cost-based
• Cost Causation-based
• Utility Revenue Stability
• Encourage Conservation
• Reduce System Peak
• Stable and Understandable
• Economically Efficient
• Aligned with Wholesale Prices
Minnesota Principles and Objectives
50

The Importance of a Good Implementation Plan

▪ Customers tend to:
▪ Like flat kWh rates
▪ Be risk adverse
▪ Be reluctant to change
▪ Research lacking around peak demand charges vs. TOU
▪ Knowledge Gap
▪ Studies currently show that customers have very little idea about
how their current rates work, let alone how alternative rate
structures would impact them.
▪ 75% of customers reported they have attempted to save money on
their bill by shifting their usage to different times of the day,
despite less than 5% of customers actually enrolled in TOU rate
plans.
52
Facts on the Ground

▪ Opt-in, default, or transition
▪ Should all customers be required to be on the new rate?
▪ How should utilities transition customers to a new default rate?
▪ How long must they stay on the rate?
▪ Education
▪ Rate impacts will not be the same for all customer segments
▪ Targeted and personalized communications
▪ Customers are interested to know how bills will be affected.
▪ “Try-Before-You-Buy” - Bill protection
▪ Utility Preparation
▪ Identification of most impacted customers (e.g. load profile analysis, etc.)
▪ Investment in analytics and software solutions (bill calculators)
▪ Metrics for new rate rollouts
▪ Technology Availability
Considerations: Transitioning to New Rate Designs
53

▪ Enrollment rates were 5 times higher under the default enrollment approach vis-à-vis a voluntary TOU rate offering, with drop-out rates that were nearly identical (less than 5%)
Implementation Strategies
54

▪ Smart and connected thermostats▪ Allow customers wireless control of HVAC use
▪ Smart appliances▪ Appliances that are able to operate at optimal times to reduce
demand or when rates are lower due to time of use rates
▪ Demand limiter▪ Hardware that prevents high demand
devices from operating simultaneously
▪ Behavioral and Data Services▪ Currently available only to C&I customers. Providers
could offer programs to residential customers
Enabling Technologies with Rate Design Roll Out
55

▪ Bill inserts, brochures, telephone marketing▪ Low-tech but effective means of customer education
▪ Shadow billing▪ Customers receive two bills, one under their current rate, the
other under the new rate - Customer only pays new rate bill
▪ Usage portal▪ A web-based portal where customers can usually
access monthly, daily, and hourly historical usage data
▪ In home display▪ Allows customers to monitor current consumption without requiring a log in
Implementation Strategies
56
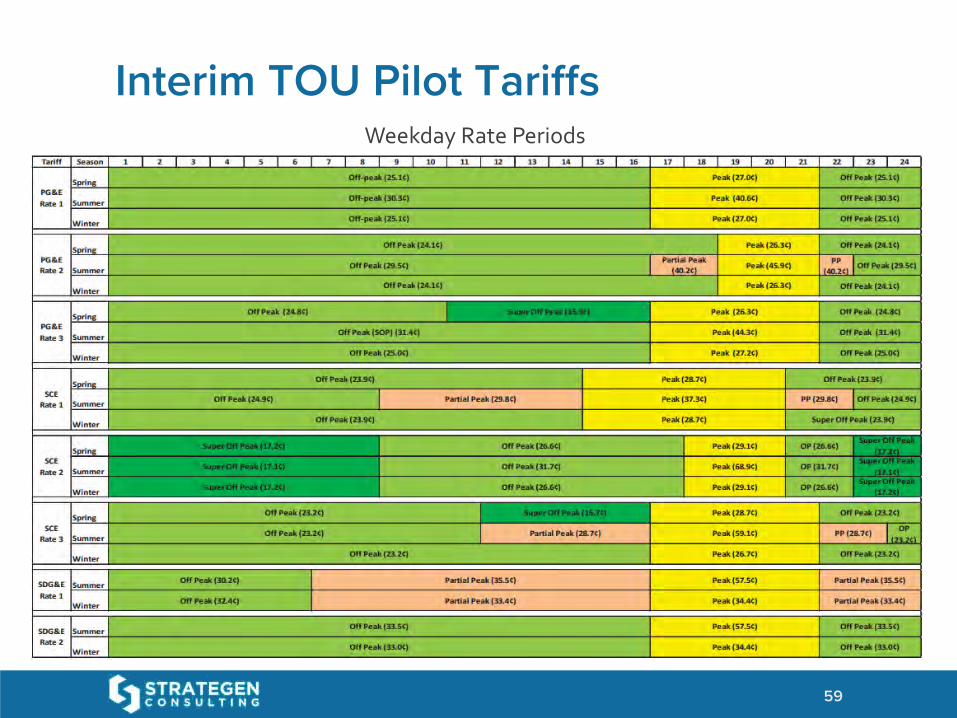
Interim TOU Pilot Tariffs
59
Weekday Rate Periods

60
SDG&E Interim TOU Pilot Tariffs

▪ Limited to 5,000 residential customers across five islands▪ Began enrollment in September 2016
▪ Optional opt-in
▪ No-penalty opt-out at any time
▪ Three periods
▪ Mid-day
▪ Peak
▪ Off-peak
▪ No AMI technology
61
Source: Hawaiianelectric.com
HECO Time of Use Pilot

62
Marblehead Municipal Lighting District
▪ Marblehead Municipal Lighting District in Massachusetts
▪ Summer of 2011
▪ 500 residential customers
▪ 37% peak reduction on event days
▪ 85% customer satisfaction
▪ 0.74 kW average peak demand reduction per customer during events
▪ First year offered 100% bill protection, second year protection was removed
▪ Standard rate for the control group was 14.25¢ per kWh
CPP rates can deliver very high system peak demand reductions without severe negative customer impacts

10,00012,00014,00016,00018,00020,00022,00024,00026,00028,00030,00032,000
1 2 3 4 5 6 7 8 9 101112131415161718192021222324
Jan 2021 --- Load vs. Net Load
10,00012,00014,00016,00018,00020,00022,00024,00026,00028,00030,00032,000
1 2 3 4 5 6 7 8 9 101112131415161718192021222324
Feb 2021 --- Load vs. Net Load
10,00012,00014,00016,00018,00020,00022,00024,00026,00028,00030,000
1 2 3 4 5 6 7 8 9 101112131415161718192021222324
Mar 2021 --- Load vs. Net Load
10,00012,00014,00016,00018,00020,00022,00024,00026,00028,00030,00032,00034,000
1 2 3 4 5 6 7 8 9 101112131415161718192021222324
Apr 2021 --- Load vs. Net Load
10,00012,00014,00016,00018,00020,00022,00024,00026,00028,00030,00032,000
1 2 3 4 5 6 7 8 9 101112131415161718192021222324
May 2021 --- Load vs. Net Load
10,00012,00014,00016,00018,00020,00022,00024,00026,00028,00030,00032,00034,000
1 2 3 4 5 6 7 8 9 101112131415161718192021222324
Jun 2021 --- Load vs. Net Load
10,00012,00014,00016,00018,00020,00022,00024,00026,00028,00030,00032,00034,000
1 2 3 4 5 6 7 8 9 101112131415161718192021222324
Jul 2021 --- Load vs. Net Load
10,00012,00014,00016,00018,00020,00022,00024,00026,00028,00030,00032,00034,00036,00038,00040,000
1 2 3 4 5 6 7 8 9 101112131415161718192021222324
Aug 2021 --- Load vs. Net Load
10,00012,00014,00016,00018,00020,00022,00024,00026,00028,00030,00032,00034,000
1 2 3 4 5 6 7 8 9 101112131415161718192021222324
Oct 2021 --- Load vs. Net Load
10,00012,00014,00016,00018,00020,00022,00024,00026,00028,00030,000
1 2 3 4 5 6 7 8 9 101112131415161718192021222324
Nov 2021 --- Load vs. Net Load
10,00012,00014,00016,00018,00020,00022,00024,00026,00028,00030,000
1 2 3 4 5 6 7 8 9 101112131415161718192021222324
Nov 2021 --- Load vs. Net Load
10,00012,00014,00016,00018,00020,00022,00024,00026,00028,00030,00032,000
1 2 3 4 5 6 7 8 9 101112131415161718192021222324
Dec 2021 --- Load vs. Net Load
Source: CPUC presentation to TOU OIR Workshop, May 2015
2021 Monthly Load vs. Net Load profiles --- weekdays
63

Source: CPUC presentation to TOU OIR Workshop, May 2015
CAISO Proposed TOU Periods for Supplemental Analysis
64

Off-Peak Peak Super PeakSuper Off-Peak
Source: CPUC presentation to TOU OIR Workshop, May 2015
2021 Monthly Net Load Distribution - Weekdays
65

Interim TOU pilot – PG&E
▪ $8.4 million total budget from 2015 – 2018
▪ Intended to enroll 18,500 but 20,713 accepted the ‘pay to play’ offer
▪ Three rates
▪ 1) Simple TOU with 5 hour peak from 4pm to 9pm year-round using hourly generation data
▪ 2) Addition of partial peak for summer season and higher Peak-to-Off Peak ratio
▪ 3) Addition of Super-Off-Peak period in spring season
▪ Pay-to-Play strategy
▪ $75 after enrollment, $50 for first survey, $75 for final survey
66

67
PG&E Interim TOU Pilot Tariffs

Interim TOU pilot – SCE
▪ $10.0 million total budget from 2015 – 2018
▪ 21,000 customers
▪ Three Rates
▪ 1) Six hour peak period with super off peak periods
▪ 2) Shorter year round peak periods and same Super Off-Peak periods
▪ 3) No baseline credit and addition of a summer Super On-Peak and Mid Peak periods
▪ Pay-to-Play strategy
▪ $100 at enrollment $50 for each two surveys
69
Interim TOU pilot – SDG&E
▪ $5.1 million total budget from 2015 – 2018
▪ 15,000 customers
▪ Three rates
▪ 1) Relatively simple TOU with super off-peak period
▪ 2) Similar structure to Rate 1 with no super-off peak period
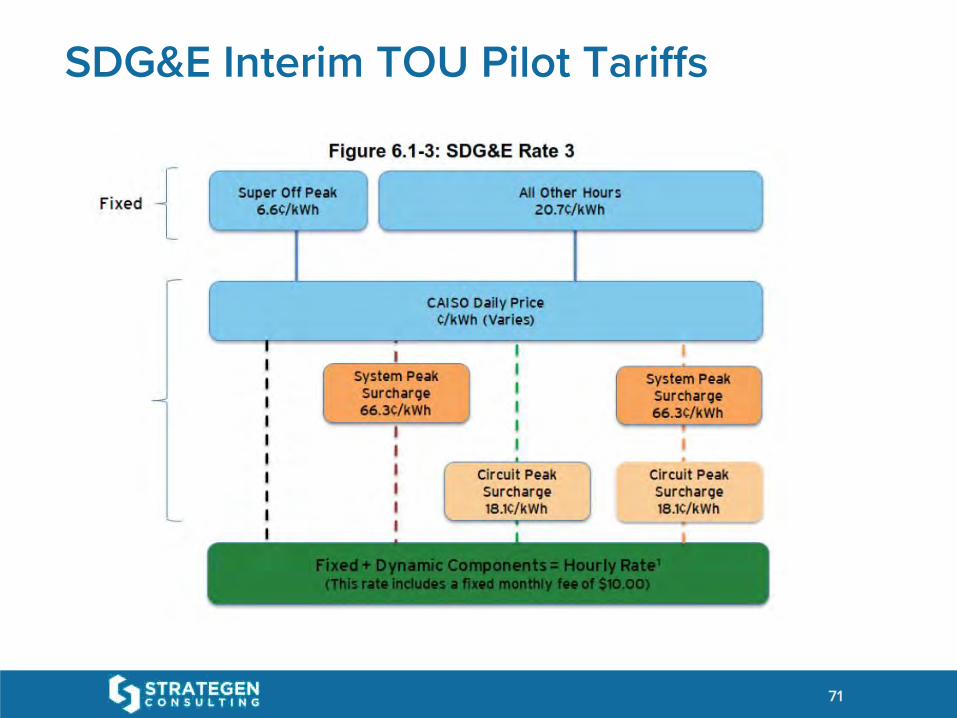
▪ 3) Unique complex dynamic rate available to only 200 customers that have adopted innovative technology and have an understanding of their usage.
▪ Hourly prices tied to CAISO wholesale market, system peak and local system peak
70
71
SDG&E Interim TOU Pilot Tariffs

TOU Examples Across the US