PARAFC analysis of fluorescence spectra measured in turbid and non- hydrolyzable media

Flow Solution 30001
Part #A002060
Publication 16131100
TKN, USEPA by FIA
����������
Total Kjeldahl Nitrogen (TKN), USEPAby Flow Injection Analysis (FIA)
(Cartridge Part #A002054)
1.0 Scope and Application
1.1 This method is used for the determination of Total Kjeldahl Nitrogen (TKN) in drinking water,surface water, saline water, and domestic and industrial wastes according to USEPAMethod 351.2 (Reference 15.4).
1.2 During digestion, amino acids, proteins, peptides, and other nitrogen compounds of biologicalorigin are converted to ammonium sulfate. Nitrogenous compounds of some industrial wastes,such as amines, nitro compounds, hydrazones, oximes, semicarbazones, and some tertiaryamines, may not be converted.
1.3 The Method Detection Limit (MDL) of this method is 0.013 mg/L TKN. The applicable range ofthe method is 0.05–20 mg/L TKN. The range may be extended to analyze higher concentrationsby sample dilution.
2.0 Summary of Method
2.1 The sample is digested prior to analysis in the presence of sulfuric acid, potassium sulfate, and amercury catalyst at a final temperature of 380°C. Free ammonia and organic nitrogen compoundsare converted to ammonium sulfate under these conditions.
2.2 The ammonium reacts with salicylate and hypochlorite in a buffered alkaline solution in thepresence of sodium nitroferricyanide (pH 12.8–13) to form the salicylic acid analog of indophe-nol blue. The blue-green color produced is measured at 660 nm (Reference 15.4).
2.3 The quality of the analysis is assured through reproducible calibration and testing of the FlowInjection Analysis (FIA) system.

Flow Solution 30002
Part #A002060
Publication 16131100
TKN, USEPA by FIA
2.4 A general flow diagram of the FIA system is shown below (see Section 17.0 for a detailed flowdiagram).
3.0 Definitions
Definitions for terms used in this method are provided in Section 16.0, “Glossary of Definitions andPurposes.”
4.0 Interferences
4.1 Precipitation of calcium and magnesium hydroxides is eliminated by potassium sodium tartrate inthe working buffer.
4.2 Filter or centrifuge turbid digestates prior to the analysis.
4.3 Digestates with background absorbances at the analytical wavelength may interfere with theanalysis.
5.0 Safety
5.1 The toxicity or carcinogenicity of each compound or reagent used in this method has not beenfully established. Each chemical should be treated as a potential health hazard. Exposure to thesechemicals should be reduced to the lowest possible level.
5.2 For reference purposes, a file of Material Safety Data Sheets (MSDS) for each chemical used inthis method should be available to all personnel involved in this chemical analysis. The prepara-tion of a formal safety plan is also advisable.
5.3 The following chemicals used in this method may be highly toxic or hazardous and should behandled with extreme caution at all times. Consult the appropriate MSDS before handling.
5.3.1 Ammonium Sulfate, (NH4)
2SO
4 (FW 132.15)
5.3.2 Chloroform, CHCl3 (FW 119.38)
������
������
��� ������
��� ��������
�������� ��� � �����
��������� ��
� !"

Flow Solution 30003
Part #A002060
Publication 16131100
TKN, USEPA by FIA
5.3.3 Potassium Sodium Tartrate Tetrahydrate, KNaC4H
4O
6•4H
2O (FW 282.23)
5.3.4 Potassium Sulfate, K2SO
4 (FW 174.26)
5.3.5 Red Mercuric Oxide, HgO (FW 216.61)
5.3.6 Sodium Hydroxide, NaOH (FW 40.00)
5.3.7 Sodium Hypochlorite, 5.25% available chlorine (household bleach), NaOCl (FW 74.44)
5.3.8 Sodium Nitroferricyanide Dihydrate, Na2Fe(CN)
5NO•2H
2O (FW 297.95)
5.3.9 Sodium Phosphate Dibasic Anhydrous, Na2HPO
4 (FW 141.96)
5.3.10 Sodium Salicylate, NaC7H
5O
3 (FW 98.08)
5.3.11 Sulfuric Acid, concentrated, H2SO
4 (FW 98.08)
5.4 Unknown samples may be potentially hazardous and should be handled with extreme caution atall times.
5.5 Proper personal protective equipment (PPE) should be used when handling or working in thepresence of chemicals.
5.6 This method does not address all safety issues associated with its use. The laboratory is respon-sible for maintaining a safe work environment and a current awareness file of OSHA regulationsregarding the safe handling of the chemicals specified in this method.
6.0 Apparatus, Equipment, and Supplies
6.1 Flow Injection Analysis (FIA) System (OI Analytical Flow Solution® 3000) consisting of thefollowing:
6.1.1 120-Place Autosampler
6.1.2 Extended Range (ER) Photometric Detector with 5-mm path length flowcell and 660-nmoptical filter
6.1.3 Data Acquisition System (PC or Notebook PC) with WinFLOW™ software
6.1.4 TKN, USEPA Cartridge (Part #A002054)
6.2 Sampling equipment—Sample bottle, amber glass, with polytetrafluoroethylene (PTFE)-lined cap.Clean by washing with detergent and water, rinsing with two aliquots of reagent water, and dryingby baking at 110°–150°C for a minimum of one hour.
6.3 Standard laboratory equipment including volumetric flasks, pipettes, syringes, etc. should all becleaned, rinsed, and dried per bottle cleaning procedure in Section 6.2.

Flow Solution 30004
Part #A002060
Publication 16131100
TKN, USEPA by FIA
7.0 Reagents and Calibrants
7.1 Raw Materials
7.1.1 Ammonium Sulfate, (NH4)
2SO
4 (FW 132.15)
7.1.2 Brij®-35, 30% w/v (Part #A21-0110-33)
7.1.3 Chloroform, CHCl3 (FW 119.38)
7.1.4 Deionized Water (ASTM Type I or II)
7.1.5 Potassium Sodium Tartrate Tetrahydrate, KNaC4H
4O
6•4H
2O (FW 282.23)
7.1.6 Potassium Sulfate, K2SO
4 (FW 174.26)
7.1.7 Red Mercuric Oxide, HgO (FW 216.61)
7.1.8 Sodium Hydroxide, NaOH (FW 40.00)
7.1.9 Sodium Hypochlorite, 5.25% available chlorine (household bleach), NaOCl (FW 74.44)
7.1.10 Sodium Nitroferricyanide Dihydrate, Na2Fe(CN)
5NO•2H
2O (FW 297.95)
7.1.11 Sodium Phosphate Dibasic Anhydrous, Na2HPO
4 (FW 141.96)
7.1.12 Sodium Salicylate, NaC7H
5O
3 (FW 98.08)
7.1.13 Sulfuric Acid, concentrated, H2SO
4 (FW 98.08)
7.1.14 Teflon® or glass boiling stones
7.2 Reagent Preparation
Note: For best results, filter and degas all reagents prior to use.
7.2.1 Reagent Water
7.2.1.1 Degassed and deionized reagent water can be prepared in one of the followingmanners:
7.2.1.1.1 Place distilled/deionized water under a strong vacuum for15–20 minutes. Magnetic stirring or sonification will aid in thedegassing process.
7.2.1.1.2 Purge distilled/deionized water with a stream of nitrogen gas (or otherinert gas) through a glass frit for approximately 5 minutes.
Flow Solution 30005
Part #A002060
Publication 16131100
TKN, USEPA by FIA
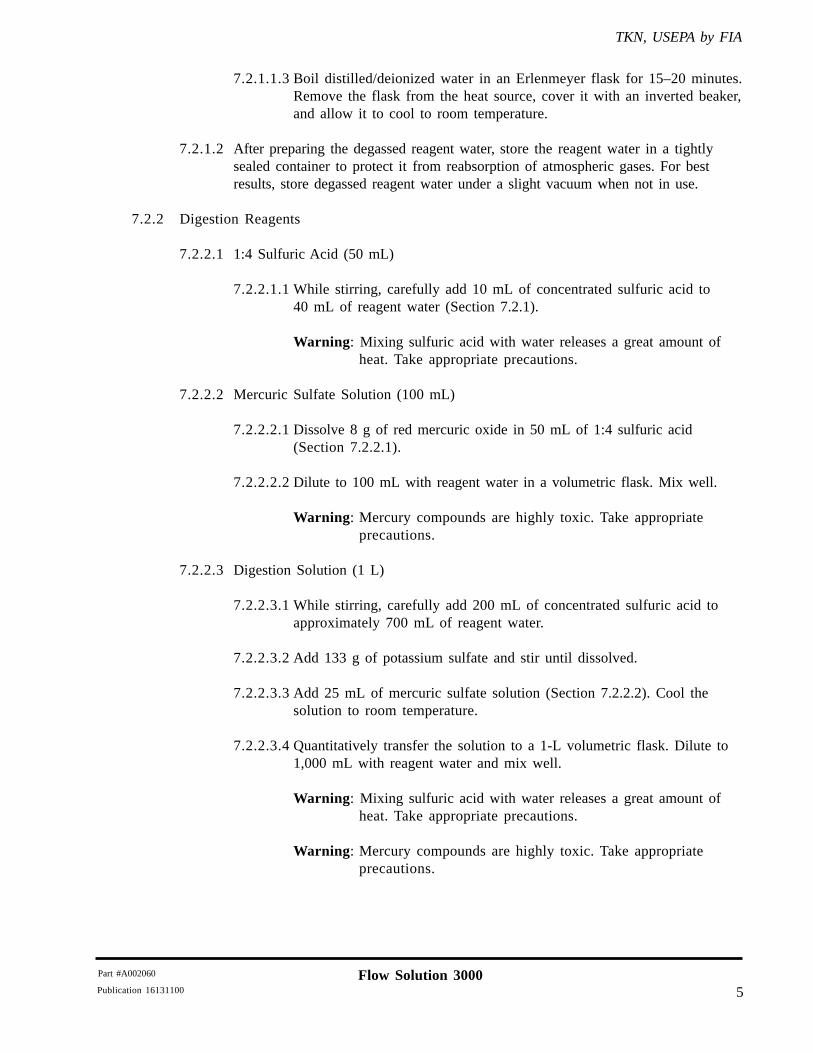
7.2.1.1.3 Boil distilled/deionized water in an Erlenmeyer flask for 15–20 minutes.Remove the flask from the heat source, cover it with an inverted beaker,and allow it to cool to room temperature.
7.2.1.2 After preparing the degassed reagent water, store the reagent water in a tightlysealed container to protect it from reabsorption of atmospheric gases. For bestresults, store degassed reagent water under a slight vacuum when not in use.
7.2.2 Digestion Reagents
7.2.2.1 1:4 Sulfuric Acid (50 mL)
7.2.2.1.1 While stirring, carefully add 10 mL of concentrated sulfuric acid to40 mL of reagent water (Section 7.2.1).
Warning: Mixing sulfuric acid with water releases a great amount ofheat. Take appropriate precautions.
7.2.2.2 Mercuric Sulfate Solution (100 mL)
7.2.2.2.1 Dissolve 8 g of red mercuric oxide in 50 mL of 1:4 sulfuric acid(Section 7.2.2.1).
7.2.2.2.2 Dilute to 100 mL with reagent water in a volumetric flask. Mix well.
Warning: Mercury compounds are highly toxic. Take appropriateprecautions.
7.2.2.3 Digestion Solution (1 L)
7.2.2.3.1 While stirring, carefully add 200 mL of concentrated sulfuric acid toapproximately 700 mL of reagent water.
7.2.2.3.2 Add 133 g of potassium sulfate and stir until dissolved.
7.2.2.3.3 Add 25 mL of mercuric sulfate solution (Section 7.2.2.2). Cool thesolution to room temperature.
7.2.2.3.4 Quantitatively transfer the solution to a 1-L volumetric flask. Dilute to1,000 mL with reagent water and mix well.
Warning: Mixing sulfuric acid with water releases a great amount ofheat. Take appropriate precautions.
Warning: Mercury compounds are highly toxic. Take appropriateprecautions.
Flow Solution 30006
Part #A002060
Publication 16131100
TKN, USEPA by FIA
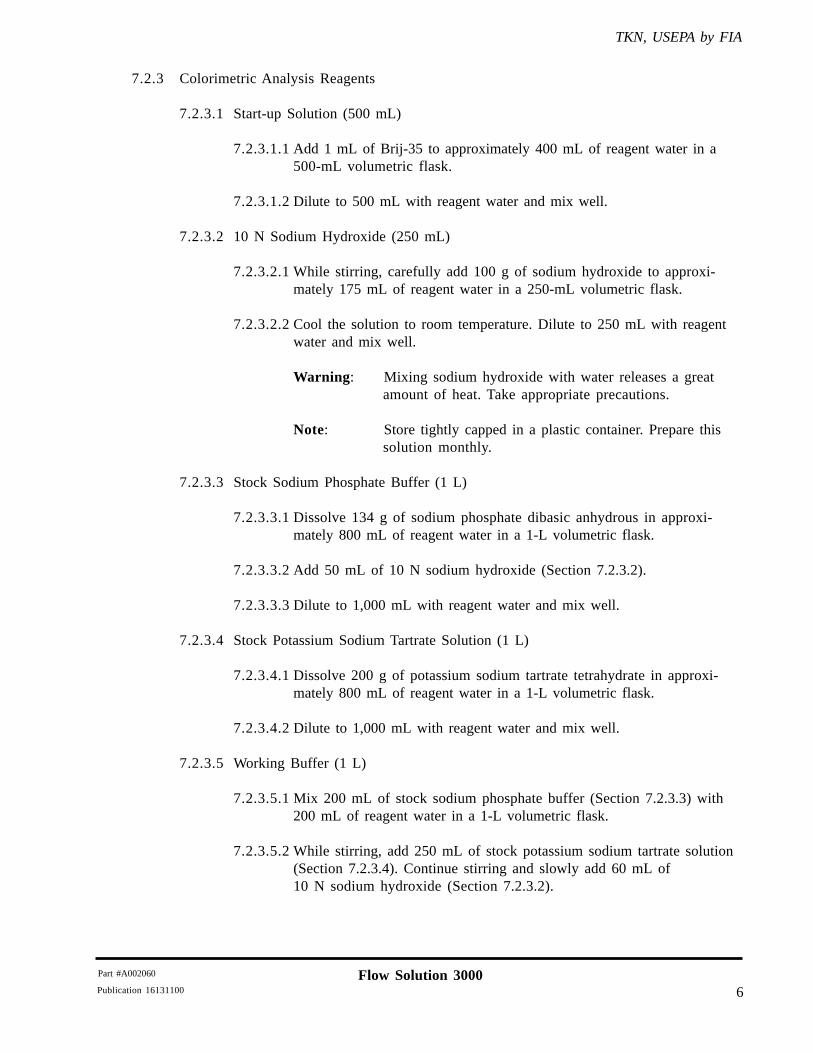
7.2.3 Colorimetric Analysis Reagents
7.2.3.1 Start-up Solution (500 mL)
7.2.3.1.1 Add 1 mL of Brij-35 to approximately 400 mL of reagent water in a500-mL volumetric flask.
7.2.3.1.2 Dilute to 500 mL with reagent water and mix well.
7.2.3.2 10 N Sodium Hydroxide (250 mL)
7.2.3.2.1 While stirring, carefully add 100 g of sodium hydroxide to approxi-mately 175 mL of reagent water in a 250-mL volumetric flask.
7.2.3.2.2 Cool the solution to room temperature. Dilute to 250 mL with reagentwater and mix well.
Warning: Mixing sodium hydroxide with water releases a greatamount of heat. Take appropriate precautions.
Note: Store tightly capped in a plastic container. Prepare thissolution monthly.
7.2.3.3 Stock Sodium Phosphate Buffer (1 L)
7.2.3.3.1 Dissolve 134 g of sodium phosphate dibasic anhydrous in approxi-mately 800 mL of reagent water in a 1-L volumetric flask.
7.2.3.3.2 Add 50 mL of 10 N sodium hydroxide (Section 7.2.3.2).
7.2.3.3.3 Dilute to 1,000 mL with reagent water and mix well.
7.2.3.4 Stock Potassium Sodium Tartrate Solution (1 L)
7.2.3.4.1 Dissolve 200 g of potassium sodium tartrate tetrahydrate in approxi-mately 800 mL of reagent water in a 1-L volumetric flask.
7.2.3.4.2 Dilute to 1,000 mL with reagent water and mix well.
7.2.3.5 Working Buffer (1 L)
7.2.3.5.1 Mix 200 mL of stock sodium phosphate buffer (Section 7.2.3.3) with200 mL of reagent water in a 1-L volumetric flask.
7.2.3.5.2 While stirring, add 250 mL of stock potassium sodium tartrate solution(Section 7.2.3.4). Continue stirring and slowly add 60 mL of10 N sodium hydroxide (Section 7.2.3.2).

Flow Solution 30007
Part #A002060
Publication 16131100
TKN, USEPA by FIA
7.2.3.5.3 Dilute to 1,000 mL with reagent water and mix well.
7.2.3.5.4 Filter the solution through a 0.45-µm filter. Add 0.5 mL of Brij-35 andmix gently to prevent foaming.
Note: Prepare this solution daily.
7.2.3.6 Salicylate/Nitroferricyanide Solution (500 mL)
7.2.3.6.1 Dissolve 150 g of sodium salicylate and 0.3 g of sodiumnitroferricyanide dihydrate in approximately 300 mL of reagent waterin a 500-mL volumetric flask.
7.2.3.6.2 Dilute to 500 mL with reagent water and mix well.
Note: Store in an amber bottle.
7.2.3.7 Sodium Hypochlorite Solution (200 mL)
7.2.3.7.1 Add 12 mL of sodium hypochlorite solution (5.25% available chlorine)to approximately 180 mL of reagent water in a 200-mL volumetricflask.
7.2.3.7.2 Dilute to 200 mL with reagent water and mix well.
Note: Store in an amber bottle. Prepare this solution daily.
7.2.3.8 Carrier/Sampler Wash Solution, 4% Sulfuric Acid (2 L)
7.2.3.8.1 While stirring, carefully add 80 mL of concentrated sulfuric acid toapproximately 1,600 mL of reagent water in a 2-L volumetric flask.
7.2.3.8.2 Cool the solution to room temperature. Dilute to 2,000 mL with reagentwater and mix well.
Warning: Mixing sulfuric acid with water releases a great amountof heat. Take appropriate precautions.
7.2.3.9 1 N Sodium Hydroxide Solution (500 mL)
7.2.3.9.1 Add 50 mL of 10 N sodium hydroxide (Section 7.2.3.2) to approxi-mately 400 mL of reagent water in a 500-mL volumetric flask.
7.2.3.9.2 Dilute to 500 mL with reagent water and mix well.

Flow Solution 30008
Part #A002060
Publication 16131100
TKN, USEPA by FIA
7.3 Calibrant Preparation
7.3.1 Stock 1,000 mg/L Ammonia Nitrogen Solution (1 L)
7.3.1.1 Dissolve 4.717 g of ammonium sulfate (dried at 110°C) in approximately900 mL of reagent water in a 1-L volumetric flask.
7.3.1.2 Dilute to 1,000 mL with reagent water. Preserve the solution by adding 2 drops ofchloroform per liter.
Note: Store the solution at 4°C.
7.3.2 Intermediate Calibrant 20 mg/L Ammonia Nitrogen Solution (100 mL)
7.3.2.1 Use a volumetric pipet to add 2 mL of stock 1,000 mg/L ammonia nitrogensolution (Section 7.3.1) to approximately 80 mL of reagent water in a 100-mLvolumetric flask.
7.3.1.2 Dilute to 100 mL with reagent water and mix well.
Note: Prepare this solution daily.
7.3.3 Working Calibrants
7.3.3.1 Add the designated volumes of stock or intermediate calibrant (see Equation 1) tothe required number of 100-mL volumetric flasks that each contain approxi-mately 80 mL of reagent water.
7.3.3.2 Dilute each solution to the mark with reagent water and mix well.
Flow Solution 30009
Part #A002060
Publication 16131100
TKN, USEPA by FIA
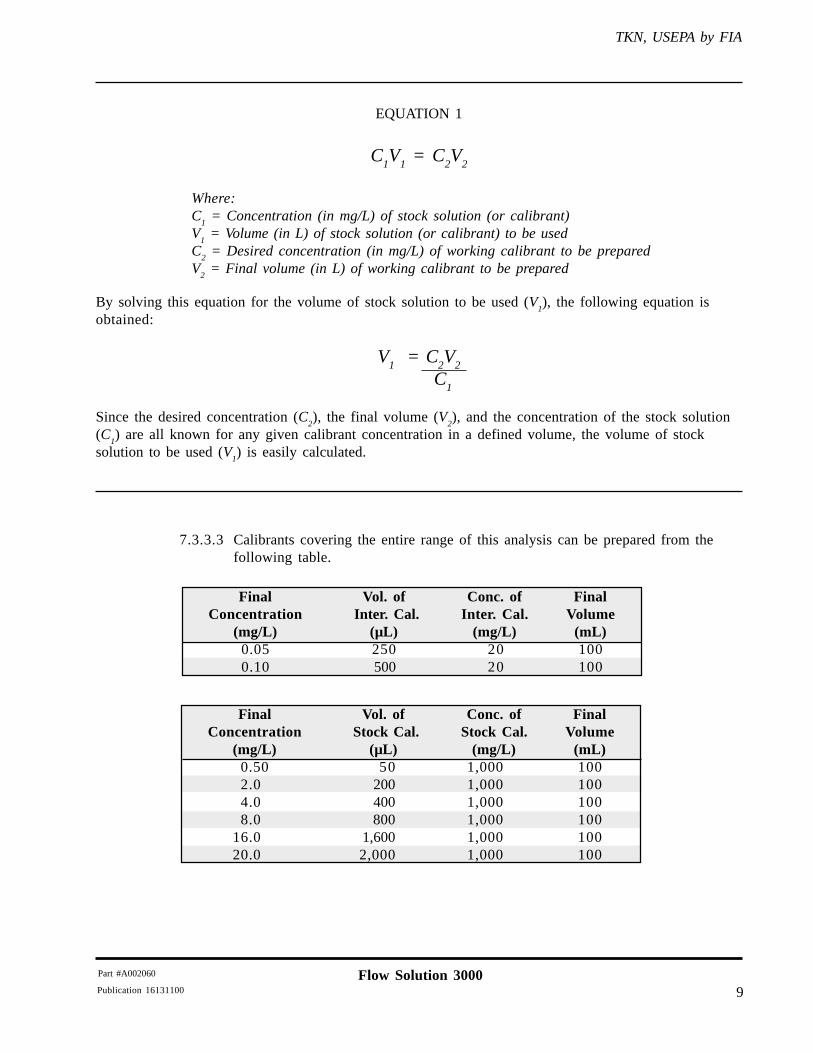
EQUATION 1
C1V
1 = C
2V
2
Where:C
1 = Concentration (in mg/L) of stock solution (or calibrant)
V1 = Volume (in L) of stock solution (or calibrant) to be used
C2 = Desired concentration (in mg/L) of working calibrant to be prepared
V2 = Final volume (in L) of working calibrant to be prepared
By solving this equation for the volume of stock solution to be used (V1), the following equation is
obtained:
V1 = C
2V
2
C
1
Since the desired concentration (C2), the final volume (V
2), and the concentration of the stock solution
(C1) are all known for any given calibrant concentration in a defined volume, the volume of stock
solution to be used (V1) is easily calculated.
7.3.3.3 Calibrants covering the entire range of this analysis can be prepared from thefollowing table.
Final Vol. of Conc. of FinalConcentration Inter. Cal. Inter. Cal. Volume
(mg/L) (µL) (mg/L) (mL)0.05 250 20 1000.10 500 20 100
Final Vol. of Conc. of FinalConcentration Stock Cal. Stock Cal. Volume
(mg/L) (µL) (mg/L) (mL)0.50 50 1,000 1002.0 200 1,000 1004.0 400 1,000 1008.0 800 1,000 100
16.0 1,600 1,000 10020.0 2,000 1,000 100

Flow Solution 300010
Part #A002060
Publication 16131100
TKN, USEPA by FIA
8.0 Sample Collection, Preservation and Storage
8.1 Samples should be collected in plastic or glass bottles that have been thoroughly cleaned andrinsed with reagent water (Section 7.2.1).
8.2 The volume of sample collected should be sufficient to ensure that a representative sample isobtained, replicate analysis is possible, and waste disposal is minimized.
8.3 Samples should be analyzed as soon as possible to reduce loss of analyte.
8.4 Samples may be preserved with 2 mL of concentrated sulfuric acid per liter of sample and refrig-erated at 4°C.
8.5 Holding time for preserved, undigested samples is 28 days from the time of collection(Reference 15.5).
9.0 Quality Control
9.1 Each laboratory that uses this method is required to operate a formal quality assurance program(Reference 15.2). The minimum requirements of this program consist of an initial demonstrationof laboratory capability and the periodic analysis of Laboratory Control Samples (LCSs) andMatrix Spike/Matrix Spike Duplicates (MS/MSDs) as a continuing check on performance. Labora-tory performance is compared to established performance criteria to determine if the results of theanalyses meet the performance characteristics of the method.
9.1.1 The analyst shall make an initial demonstration of the ability to generate acceptableprecision and accuracy with this method. This ability is established as described inSection 9.2.
9.1.2 In recognition of advances that are occurring in analytical technology and to allow theanalyst to overcome sample matrix interferences, the analyst is permitted certain optionsto improve performance or lower the costs of measurements. Alternate determinativetechniques, such as the substitution of spectroscopic or other techniques, and changes thatdegrade method performance are not allowed. If an analytical technique other than thetechniques specified in this method is used, that technique must have a specificity equal toor better than the specificity of the techniques in this method for the analyte(s) of interest.
9.1.2.1 Each time a modification is made to this method, the analyst is required to repeatthe procedure in Section 9.2. If the detection limit of the method will be affectedby the change, the laboratory is required to demonstrate that the MDL is lowerthan one-third the regulatory compliance level or as low as or lower than thatlisted in Section 1.3. If calibration will be affected by the change, the analystmust recalibrate the instrument per Section 10.4.
9.1.2.2 The laboratory is required to maintain records of modifications made to thismethod. These records include the information in this subsection, at a minimum.

Flow Solution 300011
Part #A002060
Publication 16131100
TKN, USEPA by FIA
9.1.2.2.1 The names, titles, addresses, and telephone numbers of the analyst(s)who performed the analyses and modification, and of the qualitycontrol officer who witnessed and will verify the analyses andmodification.
9.1.2.2.2 A narrative stating the reason(s) for the modification.
9.1.2.2.3 Results from all quality control (QC) tests comparing the modifiedmethod to this method including:
a) calibration (Section 10.4)
b) calibration verification (Section 9.5)
c) initial precision and recovery (Section 9.2.2)
d) analysis of blanks (Section 9.4)
e) ongoing precision and recovery (Section 9.6)
f) matrix spike and matrix spike duplicate (Section 9.3)
9.1.2.2.4 Data that will allow an independent reviewer to validate each determi-nation by tracing the instrument output (peak height, area, or othersignal) to the final result. These data are to include:
a) sample numbers and other identifiers
b) analysis dates and times
c) analysis sequence/run chronology
d) sample weight or volume
e) sample volume prior to each cleanup step, if applicable
f) sample volume after each cleanup step, if applicable
g) final sample volume prior to injection
h) injection volume
i) dilution data, differentiating between dilution of a sample ormodified sample
j) instrument and operating conditions
k) other operating conditions
l) detector

Flow Solution 300012
Part #A002060
Publication 16131100
TKN, USEPA by FIA
m) printer tapes, disks, and other recording of raw data
n) quantitation reports, data system outputs, and other data necessaryto link raw data to the results reported
9.1.3 Analyses of MS/MSD samples are required to demonstrate method accuracy and precisionand to monitor matrix interferences (interferences caused by the sample matrix). Theprocedure and QC criteria for spiking are described in Section 9.3.
9.1.4 Analyses of laboratory reagent blanks (LRBs) are required to demonstrate freedom fromcontamination and that the compounds of interest and interfering compounds have notbeen carried over from a previous analysis. The procedures and criteria for analysis of anLRB are described in Section 9.4.
9.1.5 The laboratory shall, on an ongoing basis, demonstrate through the analysis of the LCSthat the analytical system is in control. This procedure is described in Section 9.6.
9.1.6 The laboratory should maintain records to define the quality of data that is generated.Development of accuracy statements is described in Sections 9.3.8 and 9.6.3.
9.1.7 Accompanying QC for the determination of TKN is required per analytical batch. Ananalytical batch is a set of samples analyzed at the same time to a maximum of10 samples. Each analytical batch of 10 or fewer samples must be accompanied by alaboratory reagent blank (LRB, Section 9.4), a laboratory control sample (LCS, Section9.6), and a matrix spike and matrix spike duplicate (MS/MSD, Section 9.3), resulting in aminimum of five analyses (1 sample, 1 LRB, 1 LCS, 1 MS, and 1 MSD) and a maximumof 14 analyses (10 samples, 1 LRB, 1 LCS, 1 MS, and 1 MSD) in the batch. If greater than10 samples are analyzed at one time, the samples must be separated into analyticalbatches of 10 or fewer samples.
9.2 Initial Demonstration of Laboratory Capability
9.2.1 Method Detection Limit (MDL)—To establish the ability to detect TKN at low levels, theanalyst shall determine the MDL per the procedure in 40 CFR 136, Appendix B (Refer-ence 15.1) using the apparatus, reagents, and standards that will be used in the practice ofthis method. An MDL less than or equal to the MDL listed in Section 1.3 must beachieved prior to practice of this method.
9.2.2 Initial Precision and Recovery (IPR)—To establish the ability to generate acceptableprecision and accuracy, the analyst shall perform the following operations:
9.2.2.1 Analyze four samples of the LCS (Section 9.6) according to the procedurebeginning in Section 10.0.
9.2.2.2 Using the results of the set of the four analyses, compute the average percentrecovery (x) and the standard deviation of the percent recovery (s) for TKN. UseEquation 2 for the calculation of the standard deviation of the percentrecovery (s).
Flow Solution 300013
Part #A002060
Publication 16131100
TKN, USEPA by FIA
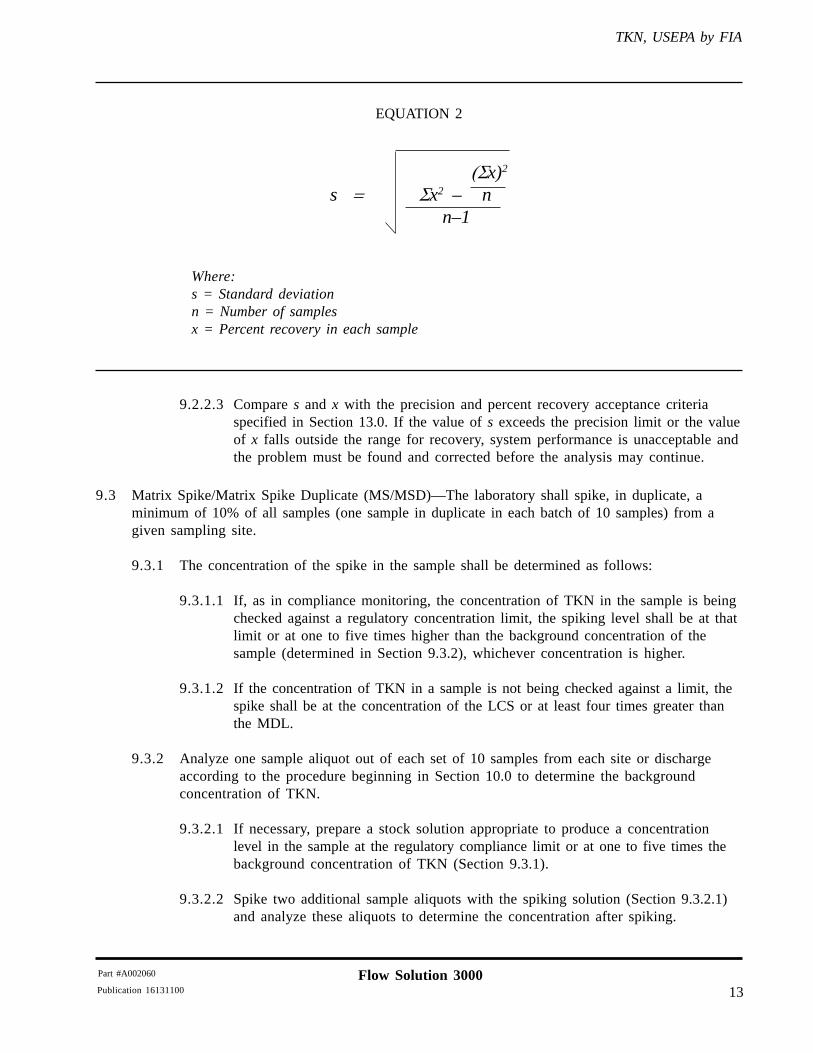
EQUATION 2
Where:s = Standard deviationn = Number of samplesx = Percent recovery in each sample
9.2.2.3 Compare s and x with the precision and percent recovery acceptance criteriaspecified in Section 13.0. If the value of s exceeds the precision limit or the valueof x falls outside the range for recovery, system performance is unacceptable andthe problem must be found and corrected before the analysis may continue.
9.3 Matrix Spike/Matrix Spike Duplicate (MS/MSD)—The laboratory shall spike, in duplicate, aminimum of 10% of all samples (one sample in duplicate in each batch of 10 samples) from agiven sampling site.
9.3.1 The concentration of the spike in the sample shall be determined as follows:
9.3.1.1 If, as in compliance monitoring, the concentration of TKN in the sample is beingchecked against a regulatory concentration limit, the spiking level shall be at thatlimit or at one to five times higher than the background concentration of thesample (determined in Section 9.3.2), whichever concentration is higher.
9.3.1.2 If the concentration of TKN in a sample is not being checked against a limit, thespike shall be at the concentration of the LCS or at least four times greater thanthe MDL.
9.3.2 Analyze one sample aliquot out of each set of 10 samples from each site or dischargeaccording to the procedure beginning in Section 10.0 to determine the backgroundconcentration of TKN.
9.3.2.1 If necessary, prepare a stock solution appropriate to produce a concentrationlevel in the sample at the regulatory compliance limit or at one to five times thebackground concentration of TKN (Section 9.3.1).
9.3.2.2 Spike two additional sample aliquots with the spiking solution (Section 9.3.2.1)and analyze these aliquots to determine the concentration after spiking.
�����������������������������������������x)2
��s ��������������x2 – n n–1

Flow Solution 300014
Part #A002060
Publication 16131100
TKN, USEPA by FIA
9.3.3 Calculate the percent recovery of TKN in each aliquot using Equation 3.
EQUATION 3
P = A – B ��100 T
Where:P = Percent recoveryA = Measured concentration of TKN after spiking (Section 9.3.2.2)B = Measured background concentration of TKN (Section 9.3.2)T = True concentration of the spike
9.3.4 Compare the recovery to the QC acceptance criteria in Section 13.0. If percent recovery isoutside of the acceptance criteria, and the recovery of the LCS in the ongoing precisionand recovery test (Section 9.6) for the analytical batch is within the acceptance criteria, aninterference is present. In this case, the result may not be reported for regulatory compli-ance purposes.
9.3.5 If the results of both the MS/MSD and the LCS test fail the acceptance criteria, the analyti-cal system is judged to be out of control. In this case, the problem shall be identified andcorrected, and the analytical batch must be reanalyzed.
9.3.6 Compute the relative percent difference (RPD) between the two spiked sample results(Section 9.3.2.2, not between the two percent recoveries) using Equation 4.
EQUATION 4
RPD = |D1 – D
2| �� 100
(D1 + D
2)/2
Where:RPD = Relative percent differenceD
1 = Concentration of TKN in the spiked sample
D2 = Concentration of TKN in the spiked duplicate sample
Flow Solution 300015
Part #A002060
Publication 16131100
TKN, USEPA by FIA
9.3.7 If the RPD is greater than 10%, the analytical system is judged to be out of control, andthe problem must be immediately identified and corrected. The analytical batch must bereanalyzed.
9.3.8 As part of the QC program for the laboratory, method precision and accuracy for samplesshould be assessed and records should be maintained. After the analysis of five spikedsamples in which the recovery passes the test in Section 9.3.4, compute the averagepercent recovery (P
a) and the standard deviation of the percent recovery (s
p). Express the
accuracy assessment as a percent recovery interval from Pa–2s
p to P
a+2s
p. For example, if
Pa = 90% and s
p = 10% for five analyses, the accuracy interval is expressed as
70–110%. Update the accuracy assessment on a regular basis (e.g., after each five to 10new accuracy measurements).
9.4 Laboratory Reagent Blanks (LRB)—Laboratory reagent blanks are analyzed to demonstratefreedom from contamination.
9.4.1 Analyze an LRB initially (i.e., with the tests in Section 9.2) and with each analytical batch.The LRB must be subjected to the exact same procedural steps as a sample.
9.4.2 If TKN is detected in the LRB at a concentration greater than the ML, analysis of samplesis halted until the source of contamination is eliminated and consequent analysis ofanother LRB shows no evidence of contamination.
9.5 Calibration Verification—Verify calibration of the analytical equipment before and after eachanalytical batch of 14 or fewer measurements. (The 14 measurements will normally be10 samples, 1 LRB, 1 LCS, 1 MS, and 1 MSD). This can be accomplished by analyzing themidrange calibration standard and verifying that it is within the QC acceptance criteria for recov-ery in Section 13.0. (The concentration of the calibration verification depends on the calibrationrange being used.) Failure to attain recoveries within the acceptance criteria requires recalibrationof the analytical system (Section 10.4).
9.6 Laboratory Control Sample (LCS)—To demonstrate that the analytical system is in control andacceptable precision and accuracy is being maintained with each analytical batch, the analystshall perform the following operations:
9.6.1 Analyze an LCS with each analytical batch according to the procedure in Section 10.0.
9.6.2 If the precision and recovery for the LCS are within the acceptance criteria specified inSection 13.0, analysis of the batch may continue. If, however, the concentration is notwithin this range, the analytical process is not in control. In this event, correct the prob-lem, repeat the LCS test, and reanalyze the batch.
9.6.3 The laboratory should add results that pass the specification in Section 9.6.2 to IPR andprevious LCS data and update QC charts to form a graphic representation of continuedlaboratory performance. The laboratory should also develop a statement of laboratorydata quality for TKN by calculating the average percent recovery (R) and the standarddeviation of the percent recovery (s
r). Express the accuracy as a recovery interval
from R–2sr to R+2s
r. For example, if R = 95% and s
r = 5%, the accuracy is 85–105%.
Flow Solution 300016
Part #A002060
Publication 16131100
TKN, USEPA by FIA
9.7 Reference Sample—To demonstrate that the analytical system is in control, the laboratory maywish to periodically test an external reference sample, such as a Standard Reference Material(SRM) available from the National Institute of Standards and Technology (NIST). Correctiveaction should be taken if the measured concentration significantly differs from the statedconcentration.
10.0 Configuration and Start-up
10.1 Instrument Configuration
10.1.1 Configure the OI Analytical Flow Solution 3000 Analyzer according to the Operator’sManual and verify that each module is properly powered on.
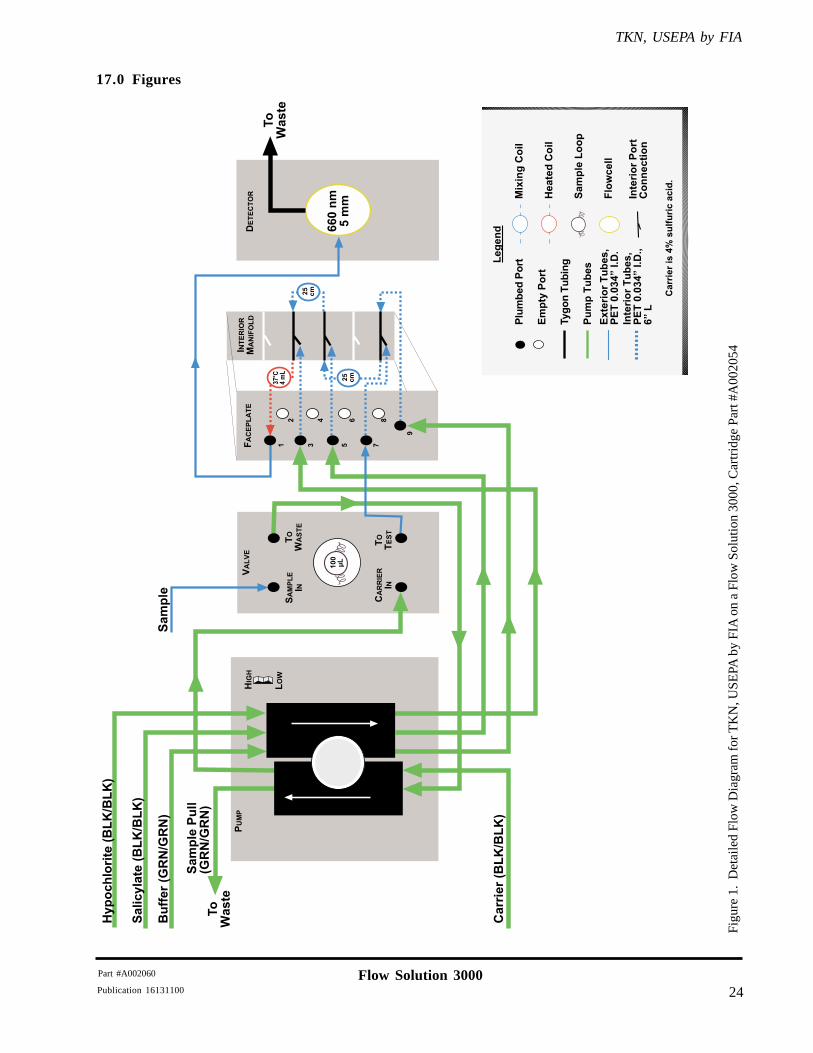
10.1.2 Verify that the TKN, USEPA Cartridge (Part #A002054) is configured as illustrated in theflow diagram shown in Section 17.0.
10.1.3 Connect the appropriate pump tubes to the cartridge and to their appropriate reagentcontainers according to the flow diagram.
10.2 Instrument Stabilization
10.2.1 Connect the reagent pump tubes to a reagent bottle containing the start-up solution(Section 7.2.3.1). Start the pump, allowing the start-up solution to flow through the entiresystem.
10.2.2 Verify that the flowcell of each detector is purged of all bubbles and the flow is stable andfree from surging before proceeding.
10.3 Baseline Verification
10.3.1 Create and save a Method in WinFLOW. Refer to the WinFLOW Operator’s Manual(Reference 15.6) for help on creating a Method.
10.3.2 Create and save a Sample Table in WinFLOW that will be used to generate a calibrationcurve using at least three calibrants that cover the full range of expected concentrations inthe samples to be analyzed. This Sample Table should also be used to analyze all neces-sary QC samples as well as the analytical batch of samples to be analyzed. For help oncreating a Sample Table, refer to the WinFLOW Operator’s Manual (Reference 15.6).
10.3.3 Select Collect Data in the WinFLOW main window, enter the user’s identification, selectthe appropriate Method and Sample Table, and begin to collect baseline data. Very sharpfluctuations in the baseline and/or consistent drifting are typically signs of bubbles in theflowcell. The flowcell must be free of bubbles prior to beginning analysis.

Flow Solution 300017
Part #A002060
Publication 16131100
TKN, USEPA by FIA
10.4 Calibration and Standardization
10.4.1 Prepare a series of at least three working calibrants using the stock solutions (Section 7.3)according to Equation 1, covering the desired analysis range.
10.4.2 Place the calibrants in the autosampler in order of decreasing concentration. Eachcalibrant should be analyzed according to the analytical procedures in Section 11.0. Acalibration curve will be calculated by the WinFLOW software.
10.4.3 Acceptance or control limits for the calibration results should be established using thedifference between the measured value of each calibrant and the corresponding “true”concentration.
10.4.4 Each calibration curve should be verified by analysis of a Laboratory Control Sample(LCS, Section 9.5). Using WinFLOW software, calibration, verification, and sampleanalysis may be performed in one continuous analysis.
11.0 Procedure
11.1 Digestion
11.1.1 Blanks, Calibrants, Samples, and QC Samples
Note: The final diluted volume after digestion will be 25 mL.
11.1.1.1 For blanks, add 25 mL of reagent water to the tube.
11.1.1.2 For calibrants, use a volumetric pipet to add the appropriate amount of stock orintermediate calibrant (Section 7.3) to each tube. Completely rinse the materialdown the side of the tube with reagent water to an approximate volume of25 mL. Mix well with a vortex mixer.
11.1.1.3 For samples, use a volumetric pipet to add 25 mL to the tube and mix well with avortex mixer. If samples are known to be out of range, smaller volumes can beused and the result multiplied by the appropriate dilution factor.
11.1.1.3.1 For example, if 10 mL of sample is digested, multiply the result by 2.5after digestion and analysis. If 5 mL of sample is digested, multiply theresult by 5 after digestion and analysis.
11.1.1.4 For QC samples, prepare the samples according to its instructions and add 25 mLto the tube. Mix well with a vortex mixer.
11.1.2 Use a volumetric pipet to add 5 mL of digestion solution (Section 7.2.2.3) to each tubeand mix well with a vortex mixer.
Note: Measure the digestion solution accurately to ensure uniform acid content in eachtube.
Flow Solution 300018
Part #A002060
Publication 16131100
TKN, USEPA by FIA
11.1.3 Add 4–6 Teflon or glass boiling stones to each tube.
Note: Too many boiling stones will cause the sample to boil over.
11.1.4 Place the tubes in the block digester and set the temperature to 160°C. Allow the volumeof each tube to be reduced to about 5 mL (approximately one hour).
Note: The evaporation step reduces the volume of liquid in the tube before the tempera-ture is increased for digestion.
11.1.5 Increase the temperature to 380°C for 2½ hours. When the digestion is complete, the finalvolume will be about 2–3 mL. The liquid will be clear or straw-colored.
Note: If any amount of liquid boils out of the tube during the digestion, the result willbe in error.
Note: If an exhaust system or scrubber is placed on top of the tubes during the diges-tion, care must be taken not to draw significant amount of fumes during the hightemperature stage. Variable acid concentrations may result. An exhaust system isnot necessary if the digestion apparatus is placed in a properly operating fumehood.
11.1.6 Remove the tubes from the block to cool. Do not allow the digests to crystallize whilecooling. To prevent crystallization, add a few milliliters of reagent water to the digestsafter cooling the tubes for several minutes.
Caution:If the water is added too soon and the acid is still hot, the contents of the tubemay react vigorously and some material may be lost from the tube.
11.1.7 Dilute the digestate to 25 mL with reagent water. The digests must be accurately diluted toa known volume in a calibrated container in order to ensure consistent acid content in thefinal solutions. If the contents of the tubes are removed to calibrated containers during thisstep, ensure that all of the material is transferred.
11.2 Analysis
Note: Pay special attention to Sections 11.2.2 and 11.2.7 to avoid precipitation of the salicylate/nitroferricyanide solution.
11.2.1 Set up the cartridge as shown in Section 17.0. Begin pump flow with the start-up solution(Section 7.2.3.1). Once the heater unit has reached 37°C, verify a stable baseline (Section10.3).
11.2.2 Leave the salicylate line in reagent water while pumping all other reagents for at least 5minutes. Then put the salicylate line into its reagent bottle and pump the salicylate/nitroferricyanide solution through the system.
11.2.3 If precipitate forms after addition of the salicylate/nitroferricyanide solution, it was addedtoo soon or the pH of the stream was too low.
Flow Solution 300019
Part #A002060
Publication 16131100
TKN, USEPA by FIA
11.2.3.1 Immediately stop the pump and disconnect the manifold from the debubbler.
11.2.3.2 Place all reagent lines in 1 N sodium hydroxide (Section 7.2.3.9).
11.2.3.3 Turn on the pump and flush the system for at least 10 minutes or until all of theprecipitate has been removed from the system.
11.2.3.4 Rinse with reagent water for 5 minutes. Return the reagent lines to their bottles,execpt the salicylate. Repeat Section 11.2.2.
11.2.4 When the system has stabilized, allow to pump at least 10–15 minutes and verify there areno bubbles in the flowcell. Obtain a stable baseline at 660 nm and autozero the baselinebefore beginning the analysis.
11.2.5 Load the sampler tray with calibrants, blanks, samples, and QC samples.
Note: The matrix of the working standards, blanks, and QC samples should match thatof the samples being analyzed.
11.2.6 Using the Method and Sample Table created for the analytical batch to be analyzed andwith the baseline verified to be stable, begin the analysis by selecting the “Fast Forward”button on the left side of the Data Analysis window in WinFLOW. This will initiate thesequential analysis of samples as defined in the Sample Table.
11.2.7 When analysis is complete, remove the salicylate line from its reagent bottle and place itin reagent water. Pump the other reagents for at least 5 minutes. Then place the other linesin reagent water and pump for at least 10–15 minutes. Stop the pump, release the tensionon all pump tubes, and power off the system.
11.3 Operating Notes
11.3.1 Variations in acid concentration can cause problems in the analysis of the digests. Titrateseveral aliquots from different tubes (after diluting to volume) to determine that a consis-tent acid content is being achieved.
Note: The final acid concentration of some samples (e.g., those containing high organiccontent, color, substantial amounts of carbonates or bicarbonates, etc.) may notbe 4%.
11.3.1.1 If the acid content determined by titration is consistent but different from thecarrier/sampler wash solution (Section 7.2.3.8), remake the carrier/sampler washsolution to the same concentration.
11.3.1.2 Raise or lower the amount of sodium hydroxide in the working bufferproportionately.
11.3.2 Problems can be isolated to either the cartridge or the digestion by preparing and analyz-ing undigested calibrants in carrier/sampler wash solution.

Flow Solution 300020
Part #A002060
Publication 16131100
TKN, USEPA by FIA
11.3.3 If a stable baseline on reagents cannot be achieved, investigate the following:
11.3.3.1 Filter the working reagents. Make sure the reagent containers are free from dust.
11.3.3.2 Disconnect the debubbler from the flowcell by removing the transmission tubingfrom the debubbler. Use a syringe fitted with a union to flush the flow cell withstart-up solution (Section 7.2.3.1) followed by reagent water. Reconnect thedebubbler.
11.3.3.3 Remove reagents from the cartridge and flush start-up solution through thecartridge using a syringe. Pump start-up solution through the lines until a stablebaseline is achieved.
11.3.3.4 Clean the cartridge with 1 N hydrochloric acid. Remove the salicylate line toreagent water for 5 minutes before placing the reagent lines in the 1 N hydro-chloric acid to prevent precipitation in the cartridge.
11.3.4 If poor peak shape or carryover is observed, investigate the following:
11.3.4.1 Check that the proper sample and wash times are set in the method.
11.3.4.2 Verify that the flow through the cartridge is smooth and consistent. Check forloose fittings.
11.3.4.3 Remake all reagents, including the stock reagents. Sodium hypochlorite solutionmust be fresh.
11.3.5 If high background or blank values are observed, carefully evaluate the source of water,the cleaning procedure for the digestion glassware, and the laboratory environment.
11.3.6 If poor sensitivity or nonlinearity is observed, investigate the following:
11.3.6.1 Check for excessive pump tube wear or a flow restriction. Replace pump tubesand verify that all lines are pumping freely.
11.3.6.2 Verify that the heater unit is on and the temperature is not too low.
11.3.6.3 Remake all reagents, including stock reagents. Sodium hypochlorite solutionmust be fresh.
11.3.6.4 The acid content of the digestates does not match that of the carrier/sampler wash(see Section 11.3.1).
11.3.7 The pH of the stream from the flowcell should be 13 before addition of the salicylate/nitroferricyanide solution.

Flow Solution 300021
Part #A002060
Publication 16131100
TKN, USEPA by FIA
12.0 Data Analysis and Calculations
12.1 The calibration curve allows for accurate quantitation of the concentration in each sample.
12.2 WinFLOW software reports the concentration of each sample relative to the calibration curve.
13.0 Method Performance
14.0 Pollution Prevention and Waste Management
14.1 It is the laboratory’s responsibility to comply with all federal, state, and local regulations govern-ing waste management, particularly the hazardous waste identification rules and land-disposalrestrictions. In addition, it is the laboratory’s responsibility to protect air, water, and land resourcesby minimizing and controlling all releases from fume hoods and bench operations. Also, compli-ance is required with any sewage discharge permits and regulations.
14.2 For further information on waste management, consult Section 13.6 of Less is Better: LaboratoryChemical Management for Waste Reduction (Reference 15.3).
15.0 References
15.1 Code of Federal Regulations, Part 136, Title 40, Appendix B, 1994.
15.2 Handbook for Analytical Quality Control in Water and Wastewater Laboratories; EPA-600/4-79-019; U.S. Environmental Protection Agency, Office of Research and Development, EnvironmentalMonitoring and Support Laboratory: Cincinnati, OH, 1979.
15.3 Less is Better: Laboratory Chemical Management for Waste Reduction. Available from the Ameri-can Chemical Society, Department of Government Regulations and Science Policy, 1155 16th
Street, NW, Washington, DC, 20036.
15.4 Nitrogen, Kjeldahl, Total (Colorimetric, Semi-Automated, Block Digester, AAII). Methods forChemical Analysis of Water and Wastewater; EPA-600/4-79-020; U.S. Environmental ProtectionAgency, Office of Research and Development, Environmental Monitoring and Support Labora-tory: Cincinnati, OH, 1984; Method 351.2.
15.5 Sample Preservation. Methods for Chemical Analysis of Water and Wastes; EPA-600/4-79-020;U.S. Environmental Protection Agency, Office of Research and Development, EnvironmentalMonitoring and Support Laboratory: Cincinnati, OH, 1984; xvii.
Range: 0.05–20 mg/LThroughput: 55 samples/hourPrecision:
2.0 mg/L <1% RSD16.0 mg/L <1% RSD
Method Detection Limit (MDL): 0.013 mg/L
Flow Solution 300022
Part #A002060
Publication 16131100
TKN, USEPA by FIA
15.6 WinFLOW Software and Operator’s Manual (Part #A002877). Available from OI Analytical, P.O.Box 9010, College Station, TX, 77842-9010.
16.0 Glossary of Definitions and Purposes
The definitions and purposes are specific to this method but have been conformed to common usage asmuch as possible.
16.1 Units of weights and measures and their abbreviations
16.1.1 Symbols
�C degrees Celsius% percent± plus or minus� greater than or equal to� less than or equal to
16.1.2 Alphabetical characters
g gramL litermg milligrammg/L milligram per literµg microgramµg/L microgram per litermL milliliterppm parts per millionppb parts per billionM molar solutionN normal solution
16.2 Definitions
16.2.1 Initial Precision and Recovery (IPR)—Four aliquots of the LRB spiked with the analytesof interest and used to establish the ability to generate acceptable precision and accuracy.An IPR is performed the first time this method is used and any time the method or instru-mentation is modified.
16.2.2 Laboratory Control Sample (LCS)—An aliquot of LRB to which a quantity of the analyteof interest is added in the laboratory. The LCS is analyzed like a sample. Its purpose is todetermine whether the methodology is in control and whether the laboratory is capable ofmaking accurate and precise measurements.
16.2.3 Laboratory Reagent Blank (LRB)—An aliquot of reagent water and other blank matrixthat is treated like a sample, including exposure to all glassware, equipment, and reagentsthat are used with other samples. The LRB is used to determine if the method analyte orother interferences are present in the laboratory environment, reagents, or apparatus.

Flow Solution 300023
Part #A002060
Publication 16131100
TKN, USEPA by FIA
16.2.4 Matrix Spike/Matrix Spike Duplicate (MS/MSD)—An aliquot of an environmental sampleto which a quantity of the method analyte is added in the laboratory. The MS/MSD isanalyzed like a sample. Its purpose is to determine whether the sample matrix contributesbias to the analytical results. The background concentration of the analyte in the samplematrix must be determined in a separate aliquot, and the measured values in the MS/MSDmust be corrected for the background concentration.
16.2.5 Method Detection Limit (MDL)—The minimum concentration of a substance that can bemeasured and reported with 99% confidence that the analyte concentration is greater thanzero.
16.2.6 Minimum Level (ML)—The level at which the entire analytical system will give a recog-nizable signal and acceptable calibration point, taking into account method-specificsample and injection volumes.
16.2.7 Ongoing Precision and Recovery (OPR)—See Section 16.2.2, “Laboratory ControlSample.”
Flow Solution 300024
Part #A002060
Publication 16131100
TKN, USEPA by FIA
Figu
re 1
. D
etai
led
Flow
Dia
gram
for
TK
N, U
SEPA
by
FIA
on
a Fl
ow S
olut
ion
3000
, Car
trid
ge P
art #
A00
2054
17.0 Figures
�����
#��
"��� ��$�%&'�%&(
���
���
����
��
����
��
)*+)
,�"-)%��-
.�%.-
���
���)���
$/01'/01(
2-�-"�30
4��
5%
��+)%-
61
�3
�-��
"�006-0
61
�6/�
%3
�3
���-
������$/01'/01(
��� ������$�%&'�%&(
4 � #
7 � � 8
9
61�-0630
+�16,3%2
%��
���
+ : ��"� �
,��;����
���
���%���
����
���
< ��
"��� �� �
�������� ���
�=
)�����<��
-:��� ����<��>
)-��=���?6=2
=
6���� ��)���
"������ ��
)���<�
�)���
-����)���
6���� ����<��>
)-��=���?6=2
=>�?%
���
���
��� ��$�%&'�%&(
������"� �
7# ��
7# ��
� !"
��%
Flow Solution 300025
Part #A002060
Publication 16131100
TKN, USEPA by FIA
P.O. Box 9010College Station, Texas 77842-9010
Tel: (979) 690-1711 · FAX: (979) 690-0440
Results were obtained under optimal operating conditions. Actualresults may vary depending on sample introduction, cleanliness ofsample containers, reagent purity, operator skill, and maintenanceof instruments.
Brij is a registered trademark of ICI Americas.Flow Solution is a registered trademark of OI Analytical.Teflon is a registered trademark of E.I. du Pont de Nemours.WinFLOW is a trademark of OI Analytical.
Copyright 2000, OI Analytical, College Station, TX 77842.