
Total Installed Capacity (as on 30.11.2012) Renewable contributes only @ 5-6% of total Electricity...
62
-
Upload
barry-ferguson -
Category
Documents
-
view
214 -
download
1
Transcript of Total Installed Capacity (as on 30.11.2012) Renewable contributes only @ 5-6% of total Electricity...

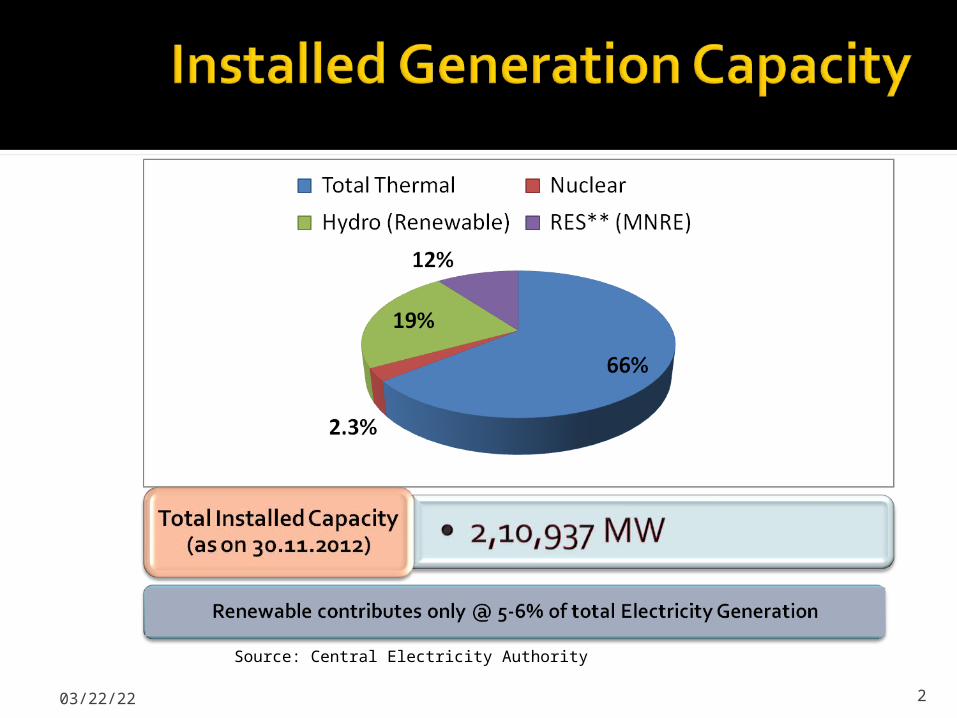
Source: Central Electricity Authority
204/20/23
304/20/23
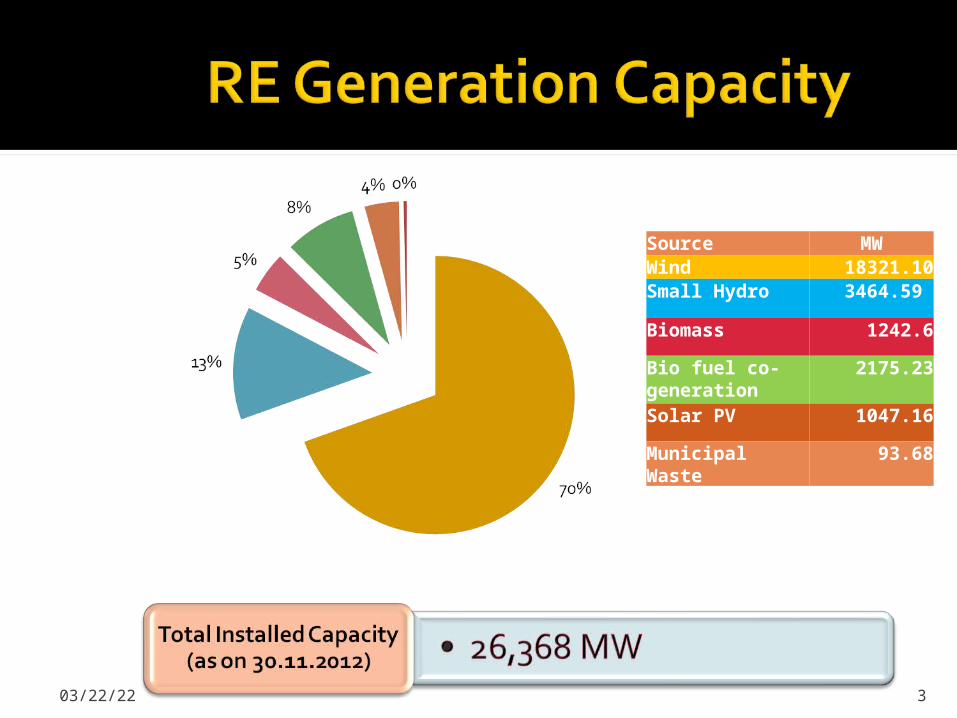
Source MWWind 18321.10Small Hydro 3464.59
Biomass 1242.6
Bio fuel co-generation
2175.23
Solar PV 1047.16
Municipal Waste
93.68

404/20/23
Policy and regulatory intervention is essential to promote renewable energy
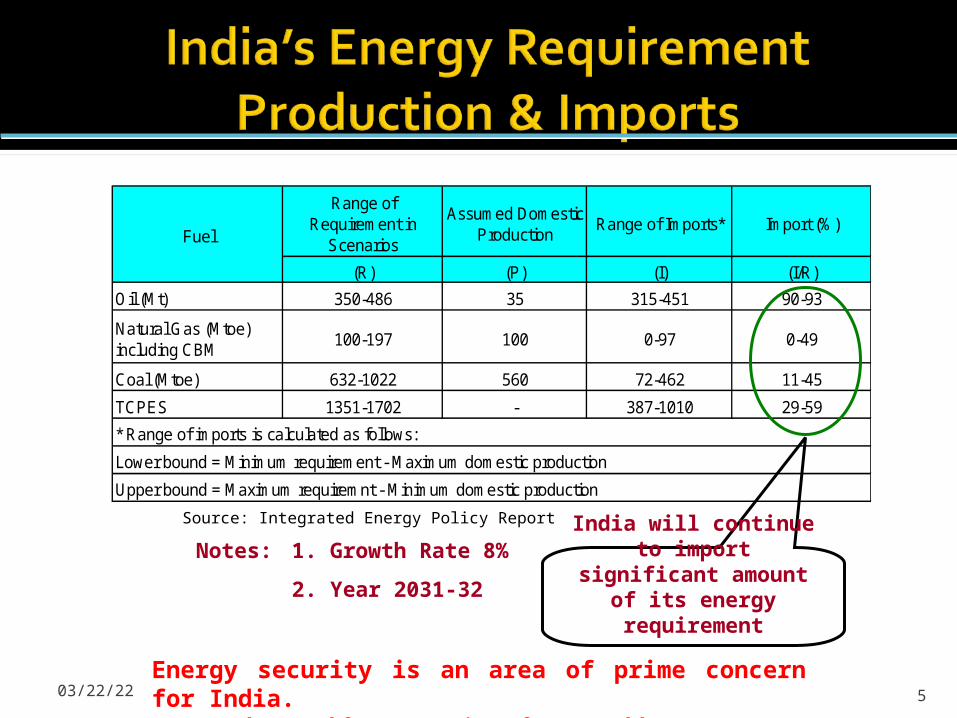
Range of Requirement in
Scenarios
Assumed Domestic Production
Range of Imports* Import (%)
(R) (P) (I) (I/R)
Oil (Mt) 350-486 35 315-451 90-93
Natural Gas (Mtoe) including CBM
100-197 100 0-97 0-49
Coal (Mtoe) 632-1022 560 72-462 11-45
TCPES 1351-1702 - 387-1010 29-59
* Range of imports is calculated as follows:
Lower bound = Minimum requirement - Maximum domestic production
Upper bound = Maximum requiremnt - Minimum domestic production
Fuel
Notes: 1. Growth Rate 8%
2. Year 2031-32India will continue to
import significant amount of its energy requirement
Source: Integrated Energy Policy Report
04/20/23 5
Energy security is an area of prime concern for India.Hence the need for promotion of Renewable Energy

MW
• Wind and Solar are the predominant sources : Actual potential is much higher, A study conducted by the Lawrence Berkley National Laboratories (LBNL, USA indicates a higher wind potential of nearly 6-8 Lakh MW in India
Huge RE potential need to be harnessed604/20/23

Section 86(1)(e): Specify Renewable Purchase Obligation
(RPO), grid connectivity
Section 61(h): Tariff regulations to be guided by promotion
of renewable energy sources
Section 3: National Electricity Policy, Tariff Policy and Plan
Section 4: National Policy permitting stand alone systems
including renewable sources of energy for rural areas
04/20/23 7

The State Commission shall discharge the following
functions, namely:
“promote cogeneration and generation of electricity
from renewable sources of energy by providing
suitable measures for connectivity with the grid and
sale of electricity to any person, and also specify, for
purchase of electricity from such sources, a
percentage of the total consumption of electricity in
the area of a distribution licensee;”
04/20/23 8
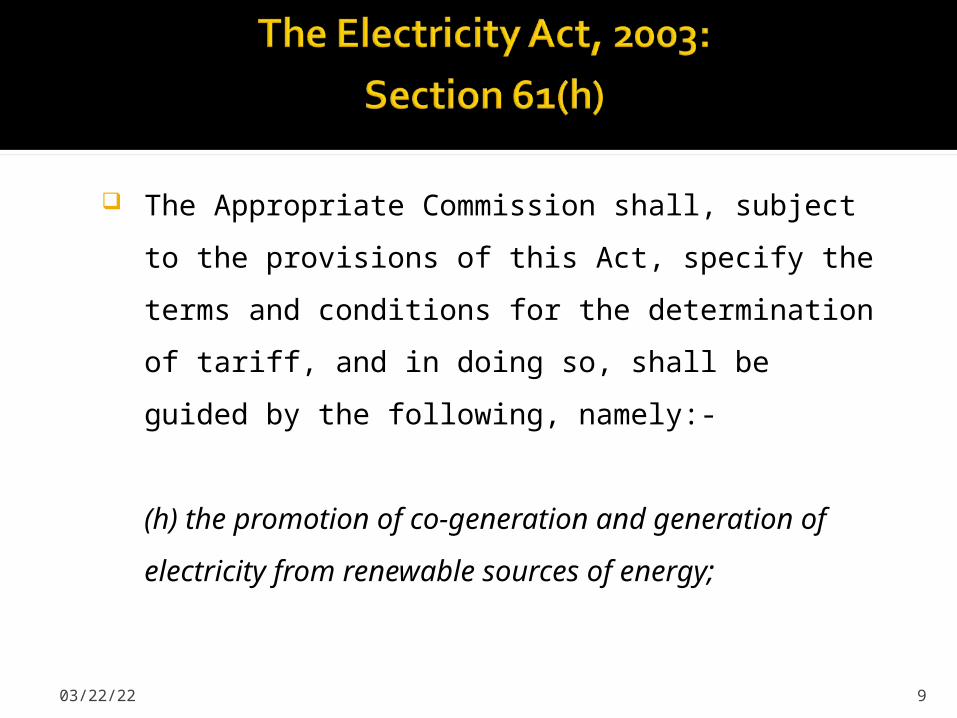
The Appropriate Commission shall, subject to the
provisions of this Act, specify the terms and
conditions for the determination of tariff, and in
doing so, shall be guided by the following, namely:-
(h) the promotion of co-generation and generation
of electricity from renewable sources of energy;
04/20/23 9
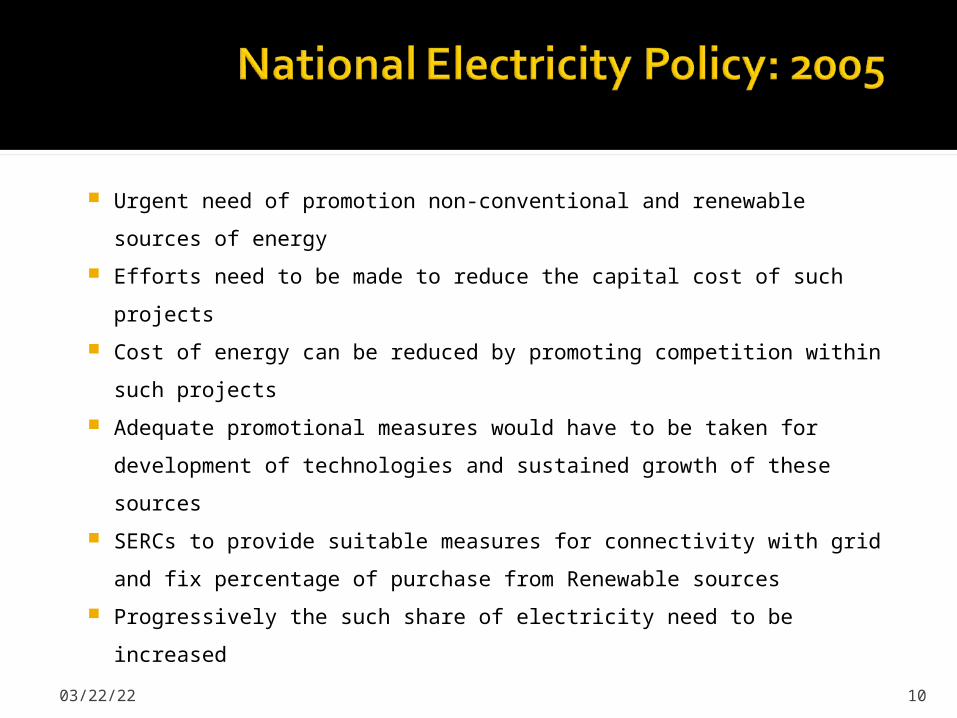
Urgent need of promotion non-conventional and renewable
sources of energy
Efforts need to be made to reduce the capital cost of such
projects
Cost of energy can be reduced by promoting competition within
such projects
Adequate promotional measures would have to be taken for
development of technologies and sustained growth of these
sources
SERCs to provide suitable measures for connectivity with grid and
fix percentage of purchase from Renewable sources
Progressively the such share of electricity need to be increased04/20/23 10
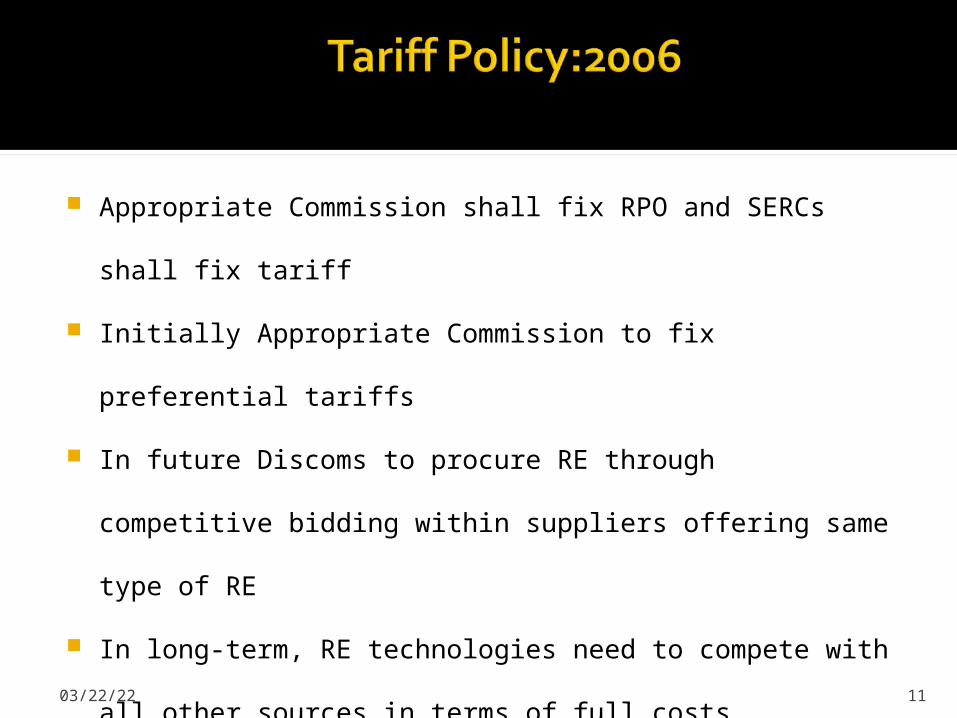
Appropriate Commission shall fix RPO and SERCs shall fix
tariff
Initially Appropriate Commission to fix preferential tariffs
In future Discoms to procure RE through competitive
bidding within suppliers offering same type of RE
In long-term, RE technologies need to compete with all
other sources in terms of full costs
CERC to provide guidelines for pricing non-firm power if RE
procurement is not through competitive bidding04/20/23 11

04/20/23
National level target for RE Purchase 5% of total grid purchase in 2010, to be increased by 1% each
year for 10 years: 15% by 2020
SERCs may set higher target
Appropriate authorities may issue certificates that procure
RE in excess of the national standard Such certificates may be tradable, to enable utilities falling
short to meet their RPO
RE generation capacity needed: From 25000 to 45000 MW by
FY2015
12

Mission aims to achieve grid tariff parity by 2022 through
Bundling of solar power with un-allocated quota of central stations by NVVNL for resale to utilities
To deploy 20 million solar lighting systems for rural areas by
2022 Large scale utilization and rapid
diffusion R&D , Local manufacturing In addition, 100 MW capacity
distributed small grid connected power plants during Phase -1.
04/20/23 13
MW

SERC shall fix a minimum percentage of the total
consumption of electricity in the area of a distribution
licensee Such purchase should takes place more or less in the
same proportion in different States SERCs shall also reserve a minimum percentage for
purchase of solar energy Up to 0.25% by the end of 2012-2013
Further up to 3% by 2022
Renewable Energy Certificate (REC) would need to be
evolved with separate solar specific REC04/20/23 14

Renewable Purchase Obligation (RPO)
Preferential Tariff
Facilitative Framework for Grid Connectivity
Market Development (Tradable Renewable Energy Certificates)
04/20/23 15
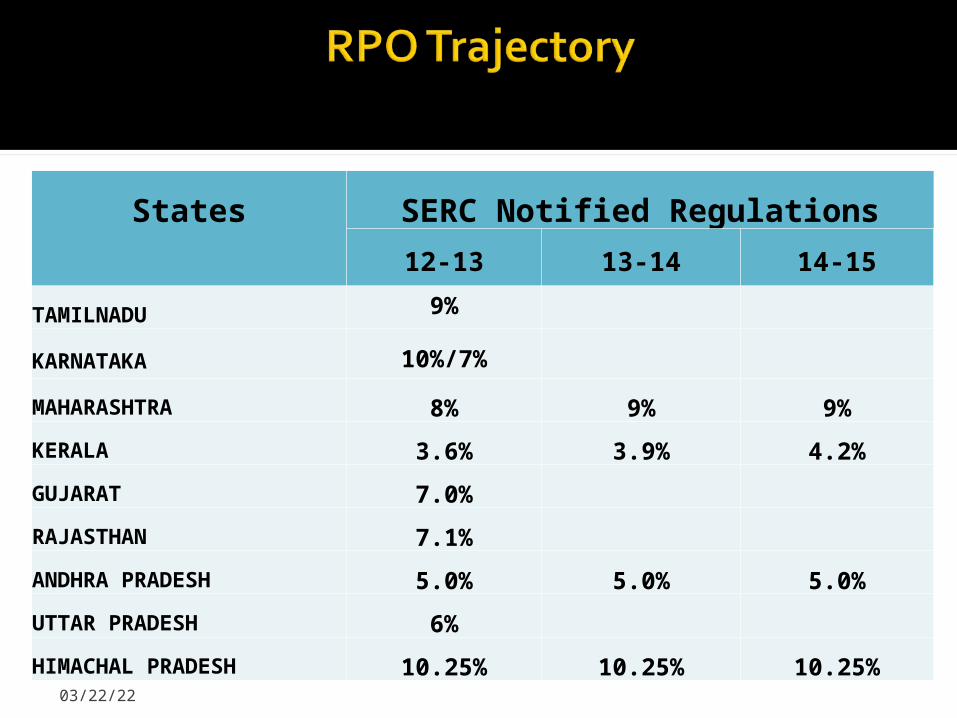
States SERC Notified Regulations
12-13 13-14 14-15
TAMILNADU 9%
KARNATAKA 10%/7%
MAHARASHTRA 8% 9% 9%
KERALA 3.6% 3.9% 4.2%
GUJARAT 7.0%
RAJASTHAN 7.1%
ANDHRA PRADESH 5.0% 5.0% 5.0%
UTTAR PRADESH 6%
HIMACHAL PRADESH 10.25% 10.25% 10.25%
04/20/23

SERC Notified RegulationsSTATE 12-13 13-14 14-15
CHHATISGARH 5.75%
PUNJAB 2.9% 3.5% 4%
UTTARAKHAND 6%
MADHYA PRADESH 4.00% 5.50% 7.00%
WEST BENGAL 4% 5% 6%
HARYANA 2.0% 3.0%
DELHI 3.4% 4.8% 6.2%
BIHAR 4% 4.50% 5%
JHARKHAND 4%04/20/23

SERC Notified Regulations
States 12-13 13-14 14-15JAMMU & KASHMIR 5%
ASSAM 2% 2% 2.50%
MANIPUR 5.00%
MEGHALAYA 1.00%
NAGALAND 8.0%
MIZOROM 7.0%
TRIPURA 2.0%
GOA AND Uts 3%
04/20/23

04/20/23
State 2012-13 2013-14 2014-15 2015-16AP 0.25% 0.25% 0.25% 0.25%
Assam 0.15% 0.20% 0.25%
Bihar 0.75% 1.00% 1.25%
Chhattisgarh 0.5%
Delhi 0.20% 0.25% 0.30% 0.35%
Gujarat 1.00%
Haryana 0.75% 1% 1.25%
Himachal Pradesh 0.25% 0.25% 0.25% 0.25%
J & K 0.25%
Jharkhand 1%
Karnataka 0.25% 0.25% 0.25% 0.25%
Kerala 0.25% 0.25% 0.25% 0.25%
MP 0.6% 0.8% 1.0%

04/20/23
State 2012-13 2013-14 2014-15 2015-16
Maharashtra 0.25% 0.50% 0.50% 0.50%
Rajasthan 0.50% 0.75%
Manipur 0.25%
Meghalaya 0.4%
Mizoram 0.25%
Nagaland 0.25%
Orissa 0.15% 0.20% 0.25% 0.30%
Punjab 0.13% 0.19%
Tripura 0.10%
Tamil Nadu 0.05%
UP 1%
Uttarakhand 0.05%
UTs & Goa 0.40%

Wide Divergence in RPO Specifications across States Varying RPO Trajectories RPO being fixed based on resources
available in the States Different RPO as per RE Technology Differential RPO for Discoms No long term visibility
04/20/23 21

SOLAR WIND
REC – CONTEXT Unevenly Distributed RE
Resources
04/20/23 23
• Resource rich states not willing to purchase high cost RE power beyond RPO• Variability : Inter-state transmission is also difficult
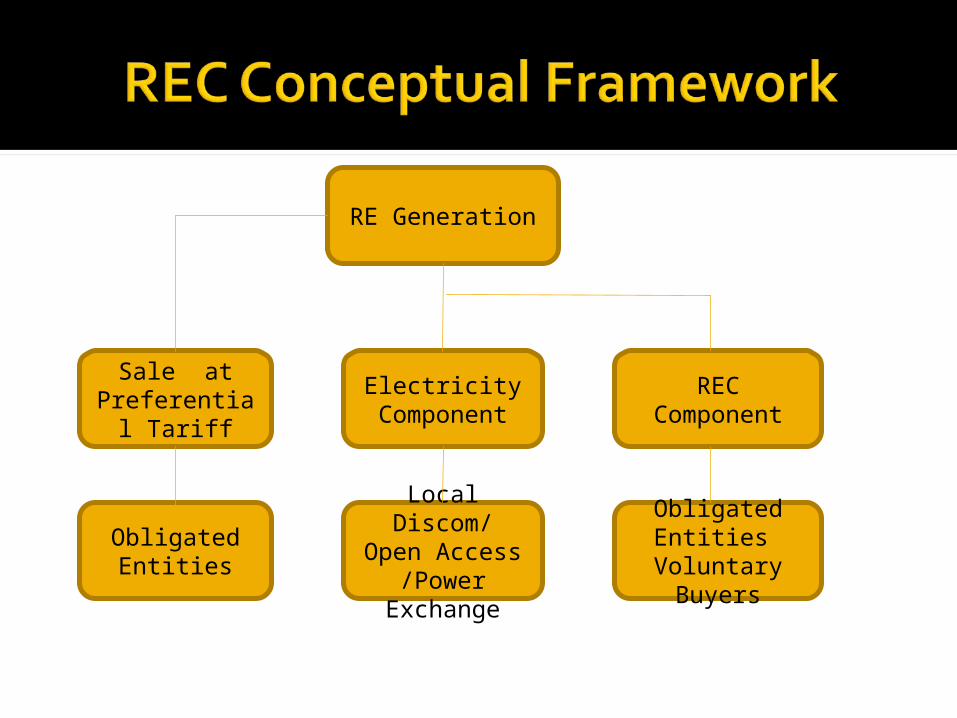
RE Generation
REC Component
Electricity Component
Sale at Preferential
Tariff
Obligated Entities
Local Discom/ Open
Access /Power Exchange
Obligated Entities
Voluntary Buyers

Sale of Electricity at Market Price in open market
Sale of electricity to Obligated Entities at regulated tariff
Preferential Tariff[Regulated Tariff]
REC [Solar & Non-Solar]
Sale of RECs at Power Exchange
* - Weighted Average Pooled Price at which distribution licensee has purchased electricity (including cost of self generation, long-term and short term purchase) in the previous year, but excluding the cost of RE power purchase
Sell to local Discom at ≤ Pooled Cost of Power Purchase*
REC OptionElectricity
Green Attributes
Self Consumption
04/20/23 25


27
Salient features
Accreditation State Agency
Registration Central Agency
Revocation of
Registration
Central Agency
Categories of REC Solar REC & Non-Solar REC
Issuance of REC By Central Agency only based on injection
certificate
REC Denomination 1 MWh = 1 REC
Time limit for claiming
REC
3 Months from injection
Validity of REC 365 days after issuance
Dealing in Certificates Power Exchanges only
REC Price Guarantee Between ‘Floor’ Price and ‘Forbearance’ Price
Monitoring Mechanisms Compliance Auditor
27
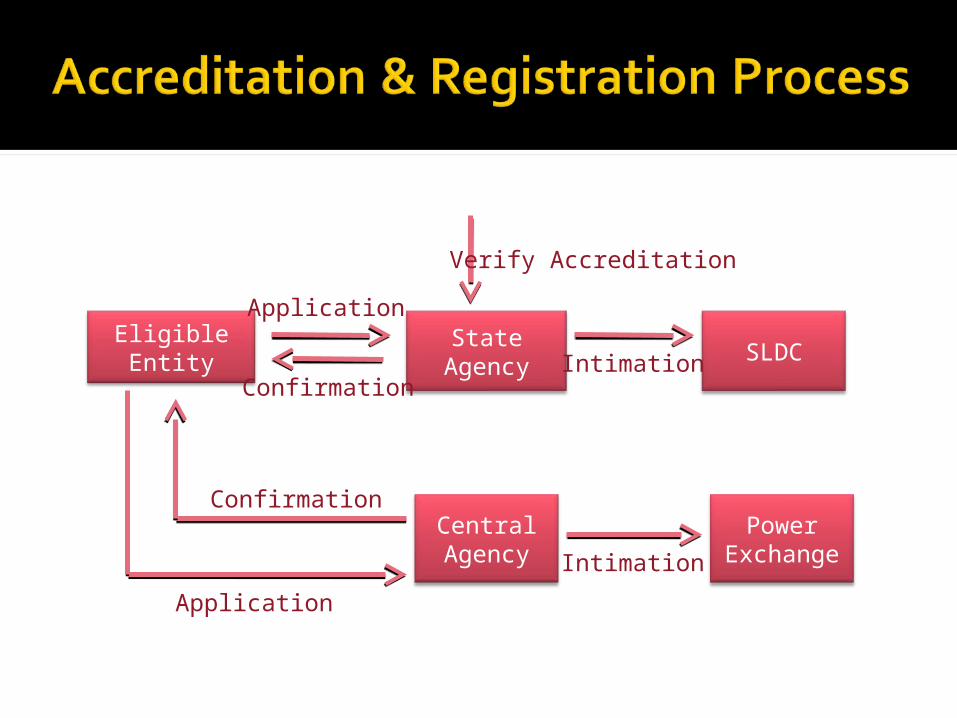
Eligible Entity
State Agency
SLDC
Central Agency
Power Exchange
Verify Accreditation
Application
ConfirmationIntimation
Application
Confirmation
Intimation

SLDC Central Agency
Power Exchange
Eligible Entity
VerificationPre Condition
Regular Injection
Verify before Issuance
Application
Joint Meter Reading
Apply for sale of REC
State Agency
IssuanceIntimation For Meter Reading
SLDC
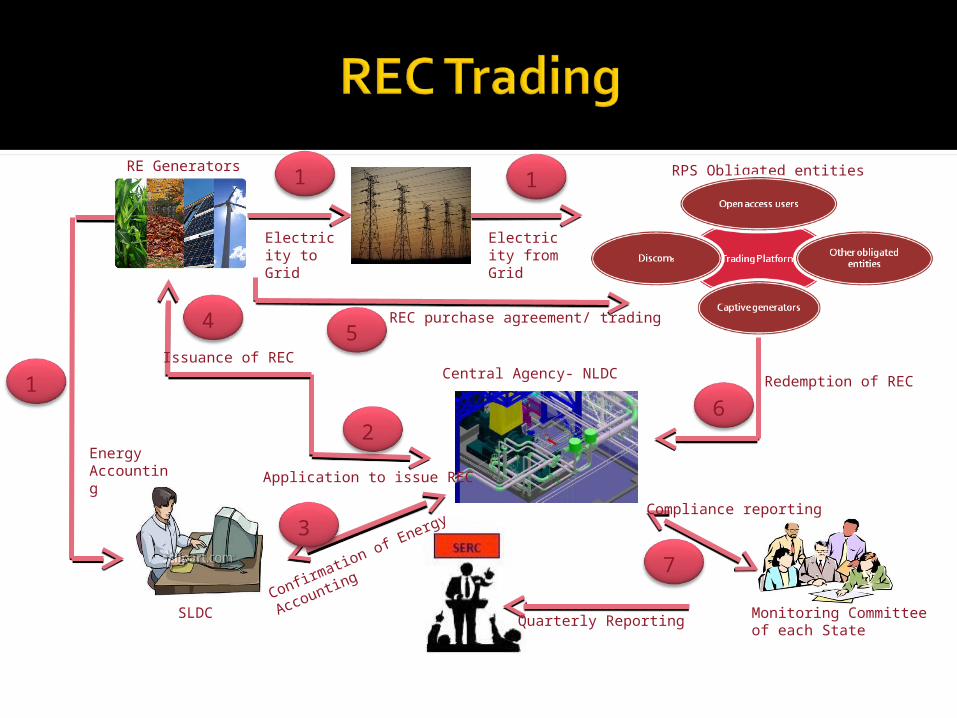
1 1
1
2
3
4
6
7
5
Central Agency- NLDC
Electricity to Grid
Electricity from Grid
RE Generators RPS Obligated entities
Energy Accounting
REC purchase agreement/ trading
Redemption of REC
Application to issue REC
Issuance of REC
SLDCConfirmation of Energy
Accounting
Compliance reporting
Monitoring Committee of each State
Quarterly Reporting

Eligible Entity
Obligated Entity
SERC
Central Agency
Power Exchange
Apply forSale of REC
Purchase RPO
State Agency
Intimation ofSale
Intimation of Sale

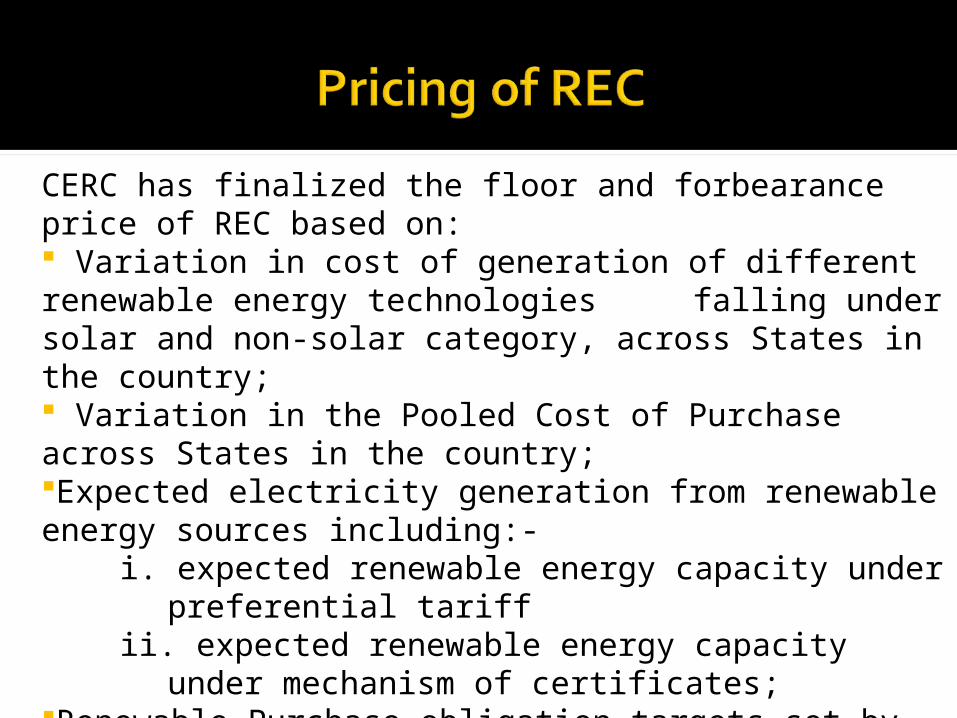
CERC has finalized the floor and forbearance price of REC based on: Variation in cost of generation of different renewable energy technologies falling under solar and non-solar category, across States in the country; Variation in the Pooled Cost of Purchase across States in the country;Expected electricity generation from renewable energy sources including:-
i. expected renewable energy capacity under preferential tariff
ii. expected renewable energy capacity under mechanism of certificates;
Renewable Purchase obligation targets set by State Commissions.
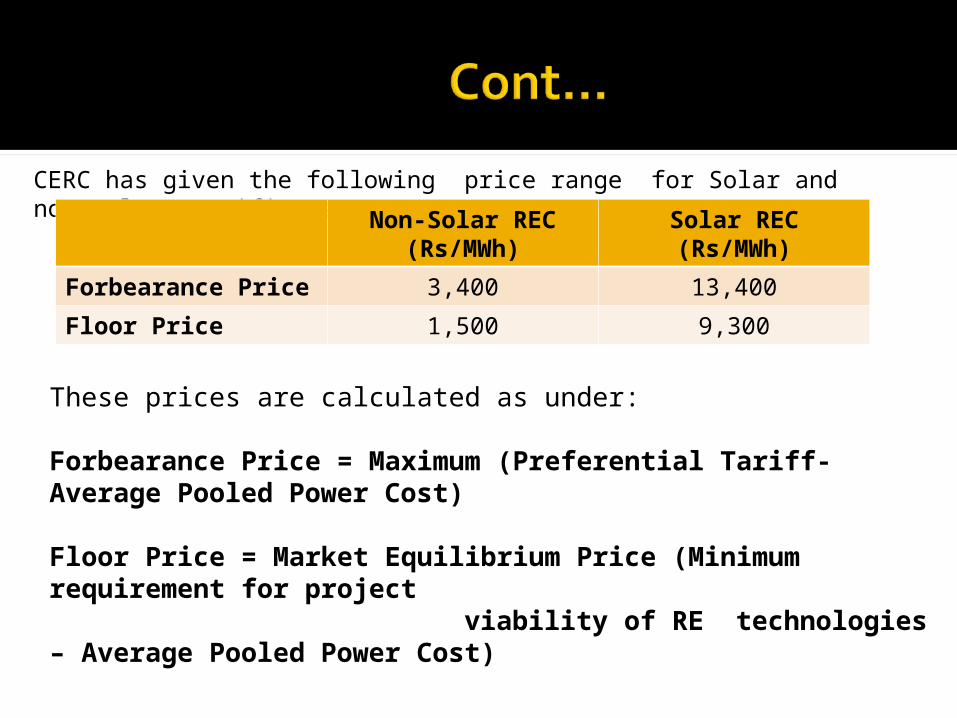
CERC has given the following price range for Solar and non-solar certificates: Non-Solar REC
(Rs/MWh)Solar REC (Rs/MWh)
Forbearance Price 3,400 13,400
Floor Price 1,500 9,300
These prices are calculated as under:
Forbearance Price = Maximum (Preferential Tariff- Average Pooled Power Cost)
Floor Price = Market Equilibrium Price (Minimum requirement for project viability of RE technologies – Average Pooled Power Cost)

Resource Capacity in MW
No. of Projects
Wind 2041.88 533
Small Hydro 184.00 023
Biomass 583.94 062
Bio fuel co-generation
777.27 076
Solar PV 20.91 011
Municipal Waste
16.00 002
Other 1.67 001
Total 3625.67 708

Resource Capacity in MW
No. of Projects
Wind 1879.38 485
Small Hydro 158.70 20
Biomass 566.90 58
Bio fuel co-gen
718.70 70
Solar PV 018.160 007
Municipal Waste
- -
Other 001.668 001
Total 3343.498 641
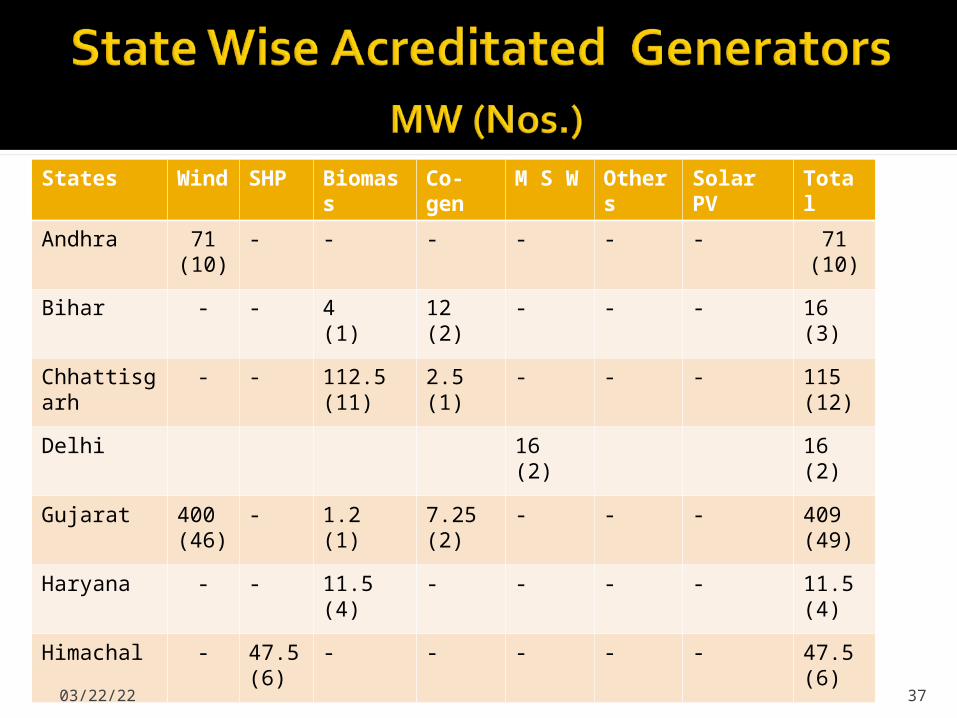
States Wind
SHP Biomass
Co-gen
M S W
Others
Solar PV
Total
Andhra 71(10)
- - - - - - 71(10)
Bihar - - 4(1)
12(2)
- - - 16(3)
Chhattisgarh
- - 112.5(11)
2.5(1)
- - - 115(12)
Delhi 16(2)
16(2)
Gujarat 400(46)
- 1.2(1)
7.25(2)
- - - 409(49)
Haryana - - 11.5(4)
- - - - 11.5(4)
Himachal - 47.5(6)
- - - - - 47.5(6)
04/20/23 37

States Wind
SHP Biomass
Co-gen
M S W Others
Solar PV
Total
Jammu &Kashmir
- 17.5(2)
- - - - - 17.5(2)
Karnataka 150.1
(21)
23(2)
- - - - - 173.19 (23)
Kerala - 21(1)
2.2(1)
- - - - 23.2(2)
Madhya Pradesh
9.02(3)
15.7(2)
34.5(3)
- - 4.105(5)
63.325(13)
Maharashtra
539.6
(259)
35.9(9)
56.27(10)
212(28)
1.7(1)
10.5(3)
855.35(310)
Odisha - - 5.4(1)
- - - - 5.4(1)
Punjab - - 10.775(1)
46(2)
- - - 56.775(2)
04/20/23 38
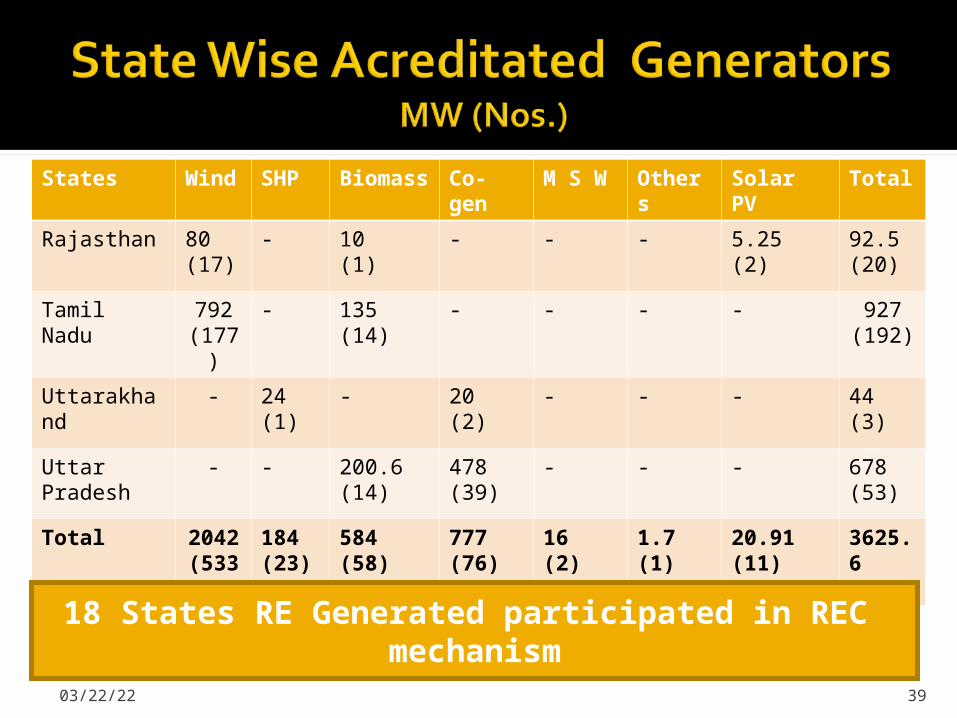
States Wind
SHP Biomass
Co-gen
M S W Others
Solar PV
Total
Rajasthan 80(17)
- 10(1)
- - - 5.25(2)
92.5(20)
Tamil Nadu 792(177
)
- 135(14)
- - - - 927(192)
Uttarakhand
- 24(1)
- 20(2)
- - - 44(3)
Uttar Pradesh
- - 200.6(14)
478(39)
- - - 678(53)
Total 2042
(533)
184(23)
584(58)
777(76)
16(2)
1.7(1)
20.91(11)
3625.6(708)
04/20/23 39
18 States RE Generated participated in REC mechanism

States Wind
SHP Biomass
Co-gen
M S W
Others
Solar PV
Total
Andhra 71.2(10)
- - - - - - 71.2(10)
Bihar - - 4(1)
12(2)
- - - 16(3)
Chhattisgarh
- - 101(9)
2.5(1)
- - - 103.5(10)
Delhi - - - - - - - -
Gujarat 3346(40)
- 1.2(1)
7.25(2)
- - - 354.5(43)
Haryana - - 8.5(3)
- - - - 8.5(3)
Himachal - 47.5(6)
- - - - - 47.5(6)
04/20/23 40

States Wind
SHP Biomass
Co-gen
M S W
Others
Solar PV
Total
Jammu &Kashmir
- 17.5(2)
- - - - - 17.5(2)
Karnataka 127 (13)
5(1)
- - - - - 132 (14)
Kerala - 21(1)
2.2(1)
- - - - 23.2(2)
Madhya Pradesh
3(2)
15.7(2)
34.5(3)
- - 2.605(3)
55.845(10)
Maharashtra
514.2
(242)
28(7)
53.72(9)
130.5(17)
1.7(1)
9.5(2)
761.29(283)
Odisha - - 5.4(1)
- - - - 5.4(1)
Punjab - - 10.8(1)
46(2)
- - - 57(3)04/20/23 41

States Wind
SHP Biomass
Co-gen
M S W
Others
Solar PV
Total
Rajasthan 75.75(15)
- 10(1)
- - - 5(1)
95(19)
Tamil Nadu 737.1
(161)
- 135(14)
- - - - 873.155
(176)
Uttarakhand
- 24(1)
- 20(2)
- - - 44(3)
Uttar Pradesh
- - 200.6(14)
478(39)
- - - 678(53)
Total 1879
(485)
158(20)
567(58)
718.7(70)
- 1.7(1)
18.16(7)
3343.5(641)
04/20/23 42
18 States RE Generated participated in REC mechanism

Month, Year
Opening Balance
REC Issued
REC Redeemed
Closing Balance
Feb, 2012 39915 200736 206188 34463Mar, 2012 34463 203819 199737 38545Apr, 2012 38545 122369 71226 89688May, 2012 89688 230697 168685 151700June, 2012 151700 259125 236827 173998Jul, 2012 173998 382712 158399 398311Aug, 2012 398311 474784 274272 598823Sep, 2012 598823 569567 265606 902784Oct, 2012 902784 621358 224491 1299651Nov, 2012 1299651 394088 133571 1560168Dec, 2012 1560168 383383 274852 1668699Jan, 2013 668699 307663 195645 1780717Total: 4799989 3019272

04/20/23 44
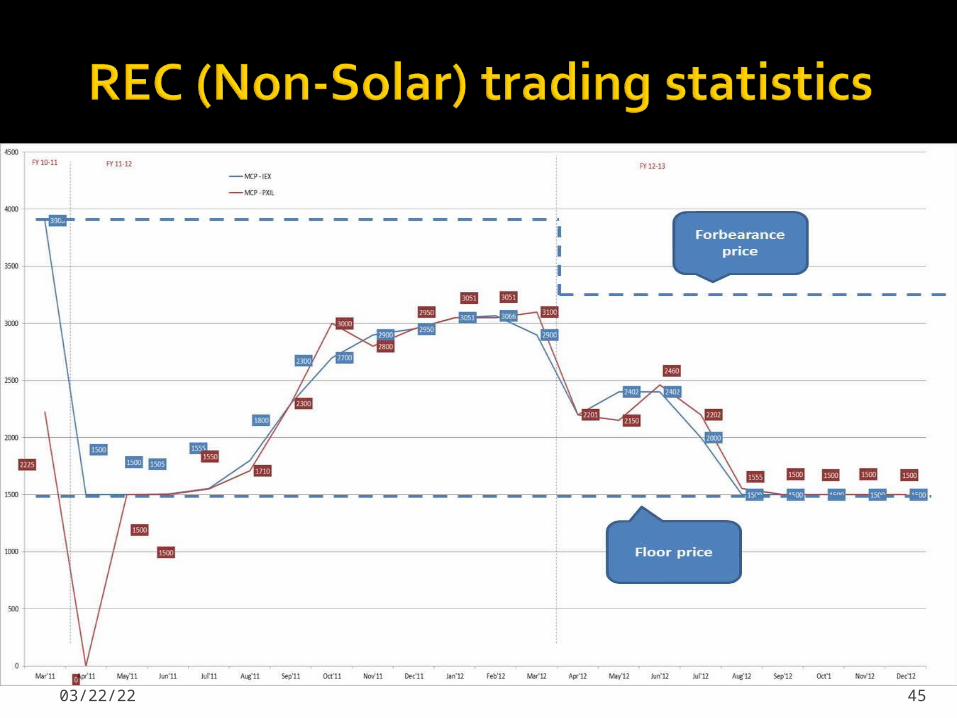
04/20/23 45
04/20/23 46

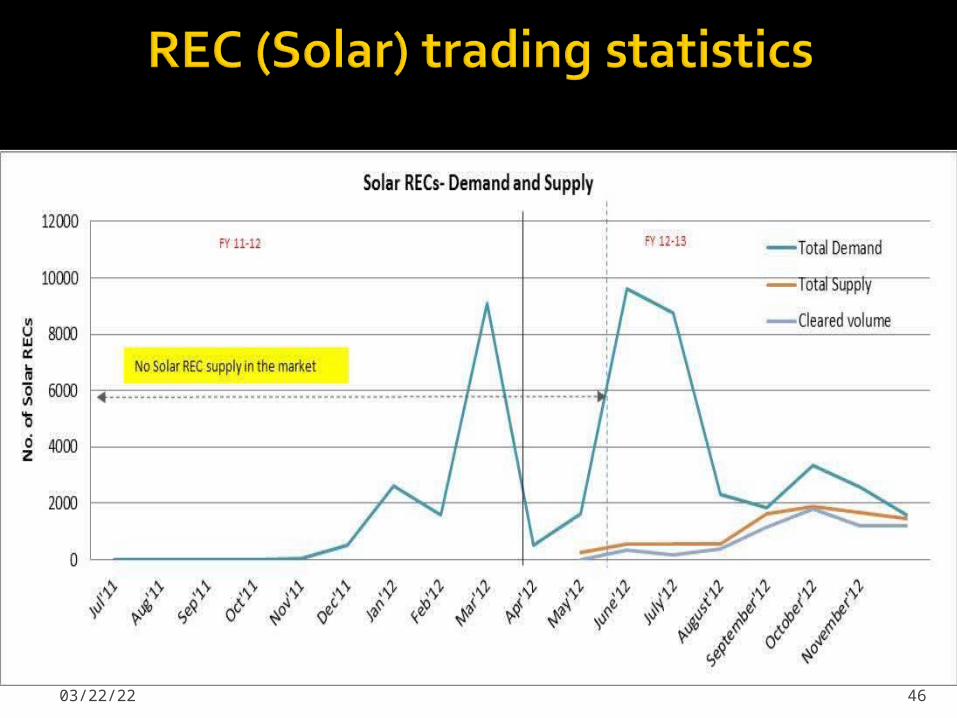
Non-Solar: Not adequate demand
Buyers : Largely CPPs and OA consumers; Very few Discoms
(Torrent, Tata Power, REL, Chandigarh, DDN, JUSCO).
Solar: Inadequate supply and absence of large buyers
Buyers: Largely CPPs and OA consumers; Very few Discoms
(Chandigarh, Tata Steel Power Distribution Licensee), OA
consumers, CPP
4704/20/23


RPO being fixed keeping in mind availability of RE resources in
State instead of availability of RE resources in the country as a
whole Need for National level RPO
Need for specifying RPO as a percentage of “total consumption” of
electricity in the area of a distribution licensee
Need to recognise REC as valid instrument for compliance of RPO
by the obligated entities
Applicability of RPO on Captive user, Open Access users and
captive cogeneration : Regulations challenged in various High
Courts
Lack of Long Term RPO Trajectory Need for Long Term RPO Trajectory: At least for next 5 to 10 years
Lack of enforcement of RPO4904/20/23
Financial conditions of distribution utilities
Higher RPO level leads to higher impact
Section 86(1) (e) of the Act mandates SERCs to promote RE in the State
Traditionally, RPO being fixed based on the resources available in the States
04/20/23 50

Whether NAPCC suggested target is achievable or not?
Whether enough RE sources are available in the
country?
What is the achievable potential for various RE sources
in different states?
How to determine optimum as well as achievable RPO
trajectory for various States
What is the impact of RPO on the power purchase cost
of the state?
04/20/23 51
NAPCC target could be achieved during the 12th plan, if the adequate steps are taken to address the following issues: Infrastructure Barriers:
Transmission and power evacuation infrastructure and grid management
Land approvals (Single window clearance), specially for solar
Policy and Regulatory Barriers: long term perspective on RPO, RE Tariffs (and inter-state
difference in tariffs) Sale of RE power through open access and inter-state sale
Incoherent Resource Assessment Financing Barriers04/20/23 52

39600 MW (grid-connected) could be added during the
12th plan
Based on the micro-level data provided by the SNA, STU and
developers business plan
Insignificant impact on Power Purchase Cost (PPC) on
Pan-India basis:
Incremental impact on the PPC is 1.0 paisa per unit for the first
year, which gradually decreases to negative incremental impact
(to the extent of 0.5 paisa per unit in FY17)
Suggested RPO trajectory for States for 12th Plan period

FOR Model Regulations for REC Mechanism for SERCs
In the event of default the obligated entity have to deposit into
a separate fund, on the basis of the shortfall in the units of RPO
at the forbearance price decided by the Central Commission.
All SERC has specified above provision in the State REC/RPO
Regulations
Issues
Very few SERCs initiated proceeding for Enforcement of RPO
GERC, MERC, JERC, MERC,PSERC and MPERC has initiated suo-motu
proceeding /acted on petition filed by utility for waiver of RPOFOR to develop mechanism for reporting requirement
and institutional mechanism for follow up for enforcement
5404/20/23
Study on Preparing incentive structure for States for fulfilling Renewable Purchase Obligation (RPO) targets
Incentive scheme for resource rich states▪ For specifying RPO up to national level▪ For fulfilment of own RPO▪ For supporting other states for fulfilment of RPO by purchasing
RE at APPC▪ Support for balancing power requirement
Incentive scheme for resource deficit states▪ For specifying RPO up to national level▪ For fulfilment of own RPO
04/20/23 55

CERC has given statutory advice to the Ministry of Power (MOP) for
making specific provisions in the Electricity Act, 2003 for promotion of
RE:
NEP And TP to provide long term RPO trajectory of 5 to 10 years
Act to provide that SERCs to fix RPO as per provisions of NEP and TP
Empowering SERCs to impose penalty (Addition to Sec. 142)
RPO applicability on Open Access and Captive users including Co-gen
Transmission planning with considering RE capacity additionTaking note of it, MOP constituted a Committee for accelerated
development of RE through legislative & policy changes
04/20/23 56

Floor/Forbearance Price: Longer visibility more than 5 years
Vintage based floor price for solar REC Multiplier linked to reduction in floor price: Legal
interpretation Trading of REC
Secondary Market, OTC market, Multiple Trading: Liquidity issueMajor Issue of Tracking and Monitoring of RECs
REC to Buyers Issuance of RECs to Obligated entity for RE purchase
beyond their RPO: Sale RECs to other obligated entities
57
Initiative: CERC recently awarded a study in this regard to strengthen the existing REC framework
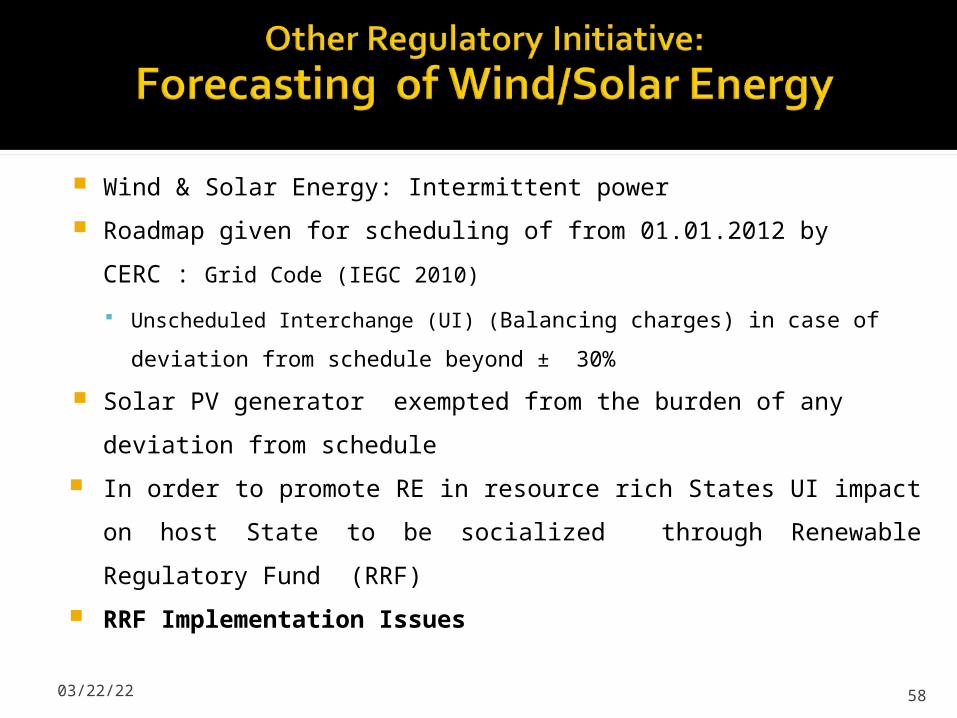
Wind & Solar Energy: Intermittent power
Roadmap given for scheduling of from 01.01.2012 by CERC :
Grid Code (IEGC 2010)
Unscheduled Interchange (UI) (Balancing charges) in case of
deviation from schedule beyond ± 30%
Solar PV generator exempted from the burden of any
deviation from schedule
In order to promote RE in resource rich States UI impact on
host State to be socialized through Renewable Regulatory
Fund (RRF)
RRF Implementation Issues
04/20/23 58

04/20/23
Transmission charges and losses
in regional grid for Solar Projects
CERC waived Inter-State Transmission Charges and Losses
for the entire life for Solar projects to be commissioned in
Phase-I i.e. by FY 2013
59

04/20/23
Amendment in CERC Grid Connectivity Regulations
dated 7.9.2010
Threshold capacity for connecting to inter-State
grid reduced to 50 MW for RE projects
RE projects having capacity less than 50 MW can also
approach collectively with an aggregate installed capacity of
50 MW and above for connectivity with the CTU
60
Provide larger balancing area: Resolve variability and balancing power
requirement issue

Issues
RE Sources remotely located and evacuation
infrastructure is a major bottleneck
Evacuation responsibility of Central or State Transmission
utility under the Act
Huge investment required in evacuation infrastructure
Upstream strengthening in the meshed transmission
system
04/20/23
Initiative: CERC /FOR awarded a study to CTU (Powergrid) on Transmission infrastructure development for the likely capacity addition of RE based power plants in the States rich in RE potential during 12th Plan (FY 2012-2017)
61
04/20/23 62
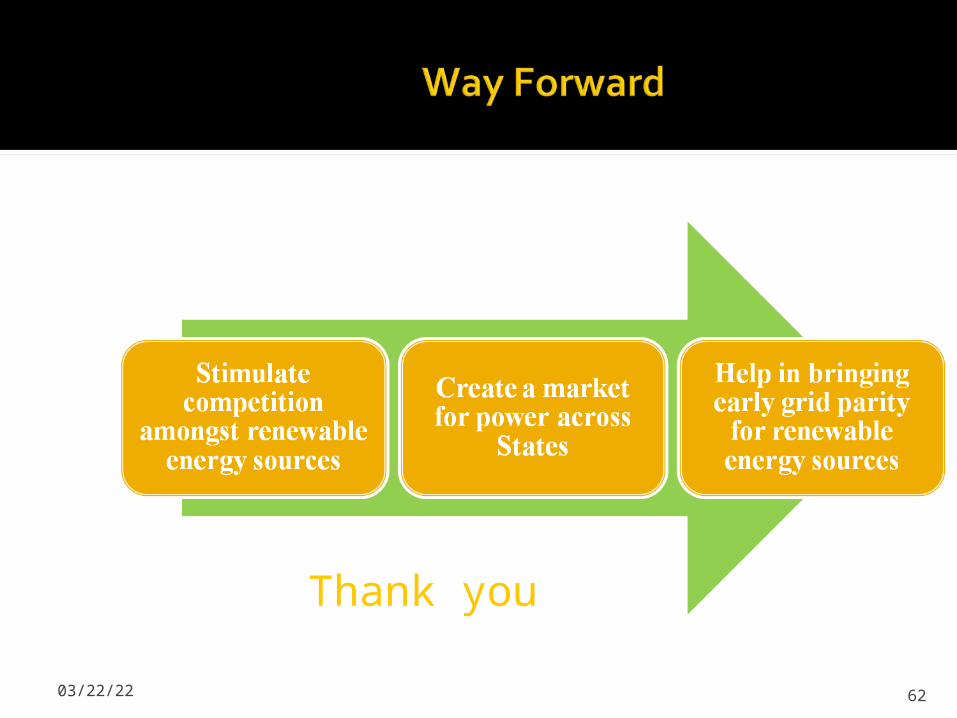
Thank you


![The Factors Affecting Electricity Consumption and the … · 2017. 10. 6. · residential sector accounts for about one third of the total electricity consumption in the world [11],](https://static.fdocuments.in/doc/165x107/6030bdafc7169b04f919b1a0/the-factors-affecting-electricity-consumption-and-the-2017-10-6-residential.jpg)