Total Floor Weather Total GHG ENERGY Source Water …
35
Property Name Address ENERGY STAR Score Primary Property Type Total Floor Area (Buildings & Parking) (ft²) Site EUI (kBtu/ft²) Weather Normalized Site EUI (kBtu/ft²) Source EUI (kBtu/ft²) Weather Normalized Source EUI (kBtu/ft²) Water Use (kgal) Total GHG Emissions (Metric Tons CO2e) DeLaSalle High School 1 DeLaSalle Dr 84 K-12 School 217,000 63.6 61 95.1 92.5 2790 808 Riverplace - One Main 1 Main Street SE 96 Office 97,551 23.5 23.4 65.1 65.1 449.8 375.9 Twins Ballpark LLC 1 Twins Way N/A Other - Entertainment/ Public Assembly 1,311,792 82.6 82.2 186.4 185.9 16204.4 12251.5 Riverplace - East Bridge 10 NE 2nd Street 16 Office 87,703 145.3 139 270 263.5 3501.5 1340.4 3405 10 W Lake Street 91 Retail Store 91,805 42.2 40 89.8 86.2 397 474.6 Butler Square 100 6th St North 86 Office 457,678 52.4 51.1 108.4 106.5 2647 2846.9 Fifth Street Towers 100 South 5th Street 85 Office 1,420,153 58.3 56.7 131.5 129.9 4901.3 8921.7 100 Washington Square 100 Washington Ave S 84 Office 770,894 62.6 61 128.3 126.6 6474.6 4720.6 TMH 1000 LaSalle Avenue N/A College/ University 165,516 71.1 69.5 141.2 139.3 2088.4 1352.8 Target Plaza 1000 Nicollet Mall 87 Office 2,042,785 68.7 67.7 127.9 126.6 11990 14098.6 DCI 1001 Minneapolis Venture LLC 1001 3rd Avenue South 69 Office 541,542 87.6 86 175.5 173.8 4243.8 4428.7 St Joseph's Home for Children 1001 46th St E N/A Other - Lodging/ Residential 123,821 115.4 112.3 176.5 173.2 1306.8 1199.8 Hilton Minneapolis (MSPMH) 1001 S Marquette Ave 49 Hotel 781,000 122.1 120.9 210.1 208.9 38618.9 9186.1
Transcript of Total Floor Weather Total GHG ENERGY Source Water …

Property Name Address
ENERGY
STAR
Score
Primary
Property Type
Total Floor
Area
(Buildings &
Parking) (ft²)
Site EUI
(kBtu/ft²)
Weather
Normalized
Site EUI
(kBtu/ft²)
Source
EUI
(kBtu/ft²)
Weather
Normalized
Source EUI
(kBtu/ft²)
Water
Use
(kgal)
Total GHG
Emissions
(Metric Tons
CO2e)
DeLaSalle High School 1 DeLaSalle Dr 84 K-12 School 217,000 63.6 61 95.1 92.5 2790 808
Riverplace - One Main 1 Main Street SE 96 Office 97,551 23.5 23.4 65.1 65.1 449.8 375.9
Twins Ballpark LLC 1 Twins Way N/A
Other -
Entertainment/
Public Assembly
1,311,792 82.6 82.2 186.4 185.9 16204.4 12251.5
Riverplace - East
Bridge10 NE 2nd Street 16 Office 87,703 145.3 139 270 263.5 3501.5 1340.4
3405 10 W Lake Street 91 Retail Store 91,805 42.2 40 89.8 86.2 397 474.6
Butler Square 100 6th St North 86 Office 457,678 52.4 51.1 108.4 106.5 2647 2846.9
Fifth Street Towers 100 South 5th Street 85 Office 1,420,153 58.3 56.7 131.5 129.9 4901.3 8921.7
100 Washington
Square
100 Washington Ave
S84 Office 770,894 62.6 61 128.3 126.6 6474.6 4720.6
TMH 1000 LaSalle Avenue N/ACollege/
University 165,516 71.1 69.5 141.2 139.3 2088.4 1352.8
Target Plaza 1000 Nicollet Mall 87 Office 2,042,785 68.7 67.7 127.9 126.6 11990 14098.6
DCI 1001 Minneapolis
Venture LLC
1001 3rd Avenue
South69 Office 541,542 87.6 86 175.5 173.8 4243.8 4428.7
St Joseph's Home for
Children1001 46th St E N/A
Other -
Lodging/
Residential
123,821 115.4 112.3 176.5 173.2 1306.8 1199.8
Hilton Minneapolis
(MSPMH)
1001 S Marquette
Ave49 Hotel 781,000 122.1 120.9 210.1 208.9 38618.9 9186.1

Property Name Address
ENERGY
STAR
Score
Primary
Property Type
Total Floor
Area
(Buildings &
Parking) (ft²)
Site EUI
(kBtu/ft²)
Weather
Normalized
Site EUI
(kBtu/ft²)
Source
EUI
(kBtu/ft²)
Weather
Normalized
Source EUI
(kBtu/ft²)
Water
Use
(kgal)
Total GHG
Emissions
(Metric Tons
CO2e)
Salvation Army
Harbor Light Center1010 currie Ave N/A
Residential Care
Facility 91,530 140.8 141 288.5 289.1 7326.3 1513.7
Target Plaza
Commons1011 Nicollet Mall 77 Office 59,479 74.9 73.2 190.7 185.9 595 665.9
Crown Roller Mill 105 5th Ave S 61 Office 115,584 104.4 101.6 189.1 186.1 971.7 955.4
Roanoke Building 109 South 7th Street N/A Office 195,308 39.9 39.9 55 55 1657 624.9
Midtown Parking
Ramp11 4th Street South N/A Parking 200,500 46.7 45.4 130.9 127.1 40.3 158.9
110 Wyman Partridge
Building110 5th Street North 56 Office 205,435 129.6 124.6 215.6 209.7 3578 2528.3
Hilton Garden Inn
Minneapolis
Downtown
1101 4th Avenue
South88 Hotel 151,397 86.7 84.9 162.9 159.6 5141.2 1142.9
MSL 1101 Harmon Place N/ACollege/
University 158,000 68.9 67.3 141.4 139.5 1472.8 1298.6
Doubletree Suites
Minneapolis1101 LaSalle Avenue 98 Hotel 200,390 54.7 54 98.2 97.4 6251.4 1107.7
River Parkway Place1101 W River
Parkway91 Office 203,972 55.2 53 114.1 111.1 525.3 546.6
Barrel House 111 3rd Ave S 65 Office 79,294 79.3 76.9 173.9 171.4 625.2 796.9
Orchestra Hall Ramp
#1
1111 Marquette
Avenue SouthN/A Parking 239,000 21.4 20.3 37.7 36.4 77 505.9
111 Washington
Square
111 Washington Ave
S79 Office 458,877 103.8 103 265.1 264.1 5487.7 7169.1

Property Name Address
ENERGY
STAR
Score
Primary
Property Type
Total Floor
Area
(Buildings &
Parking) (ft²)
Site EUI
(kBtu/ft²)
Weather
Normalized
Site EUI
(kBtu/ft²)
Source
EUI
(kBtu/ft²)
Weather
Normalized
Source EUI
(kBtu/ft²)
Water
Use
(kgal)
Total GHG
Emissions
(Metric Tons
CO2e)
Minnesota Orchestral
Association1111 Nicollet Mall N/A Performing Arts 130,177 71.1 69.1 137 134.5 1390 1031.3
Orchestra Hall Ramp
#2
1120 2nd Avenue
SouthN/A Parking 148,000 6.2 6.1 17.5 17 36.3 153.1
A Chance To Grow 112 19th Ave NE N/A K-12 School 78,450 63.1 58.9 95.9 91.5 914.7 281
YWCA of Minneapolis -
Downtown
1130 Nicollet
AvenueN/A
Mixed Use
Property 119,500 125.7 123.6 227.7 225.2 1951.2 1467.9
Embassy Suites
Minneapolis12 - 6th Street S 86 Hotel 371,120 81.2 78.9 138.2 135.4 6466.4 2917.6
Canadian Pacific Plaza 120 S 6th st. 41 Office 578,831 147 142.3 256 250.4 3275.4 7543
MN Supercomputer
Center
1200 Washington
Avenue S2 Office 198,333 226.3 226.3 631.9 631.9 2552.2 4240.1
Shiloh Temple1201 West
Broadway N23 Worship Facility 84,861 56.7 55.3 115.2 113.8 659.9 361.9
FSP 121 SOUTH
EIGHTH STREET LLC121 S 8th St 44 Office 584,622 134.9 129.6 200 193.5 2114.2 5817.7
Andrew Residence 1215 south 9th st N/AResidential Care
Facility 65,201 144.7 N/A 241 N/A 7988.1 784.7
Minnesota Church
Center
122 Franklin Avenue
West 61 Office 71,756 97.5 N/A 151.5 N/A 622.6 604.7
RSP Architects
Headquarters at the
Historic Grain Belt
Brew House
1220 Marshall ST NE 56 Office 190,482 124.2 122 206.8 204.4 765.5 1161.2
Colwell 123 3rd St. N. 89 Office 195,648 70.2 67.9 120.4 118.1 1533.9 1170.4

Property Name Address
ENERGY
STAR
Score
Primary
Property Type
Total Floor
Area
(Buildings &
Parking) (ft²)
Site EUI
(kBtu/ft²)
Weather
Normalized
Site EUI
(kBtu/ft²)
Source
EUI
(kBtu/ft²)
Weather
Normalized
Source EUI
(kBtu/ft²)
Water
Use
(kgal)
Total GHG
Emissions
(Metric Tons
CO2e)
Broadway Place West1300 Godward St.
NE91 Office 323,180 40.2 39.5 103.2 102.5 1917.2 1050.1
Hyatt Regency
Minneapolis1300 Nicollet Mall 80 Hotel 830,294 73.9 72.9 141.3 140.1 16776.6 6763.6
SEED Daycare1300 Olson
Memorial HwyN/A
Pre-school/
Daycare 140,000 58.2 55.1 99.6 96.3 4478.3 724
Millennium Hotel
Minneapolis1313 Nicollet Mall N/A Hotel 200,101 173.2 166.5 275.3 267.9 9973 3045.2
Delta Hotels
Minneapolis
1330 Industrial
Boulevard NortheastN/A Hotel 162,000 N/A N/A N/A N/A N/A 0
Loring 1330 Nicollet Mall N/A Parking 330,998 83 78.4 143.8 138.3 42.5 247.4
MoZaic Office LLC 1350 Lagoon Ave 6 Office 65,326 135.5 131.4 379.4 367.8 1080.9 1467.9
M on Hennepin 10 2nd Street SE 100Multifamily
Housing 105,635 36.4 35.2 83.2 80.8 1335.2 385.3
Lunds & Byerlys -
Minneapolis Uptown
1450 Lake Street
West80
Supermarket/G
rocery Store 53,070 185.1 182.8 368.9 366.5 1920.1 1118.2
Village Lofts at St.
Anthony
100 2nd St NE/150
2nd Street NE33
Multifamily
Housing 256,958 77.8 75.6 130.7 127.3 4282.5 1872.9
15 Building 15 S 5th Street 50 Office 152,185 110.7 104.5 172.8 166.3 2383 1448.9
Grace Center for
Community Life1500 6th St. NE 62 K-12 School 88,252 84 80.7 128.1 124.8 905.4 364.7
Courtyard
Minneapolis
Downtown
1500 Washington
Ave S77 Hotel 195,000 93.4 91.2 156.2 152.9 5712 1698.1

Property Name Address
ENERGY
STAR
Score
Primary
Property Type
Total Floor
Area
(Buildings &
Parking) (ft²)
Site EUI
(kBtu/ft²)
Weather
Normalized
Site EUI
(kBtu/ft²)
Source
EUI
(kBtu/ft²)
Weather
Normalized
Source EUI
(kBtu/ft²)
Water
Use
(kgal)
Total GHG
Emissions
(Metric Tons
CO2e)
Winslow House 100 2nd Street SE 44Multifamily
Housing 102,924 83.4 79.9 138.9 134.4 2995.6 795.9
The Carlyle 100 3rd Ave S 17Multifamily
Housing 382,989 109.1 103.9 172.3 167 6539.2 3643
Chestnut Service
Center
1518 Chestnut
Avenue33
Mixed Use
Property 205,135 142.8 138.3 250.4 243.6 1541 2499.5
2807 - MINNEAPOLIS
NE
1520 New Brighton
Blvd.68 Retail Store 129,711 71.9 68.7 145.7 142.1 929.1 1082.4
06692-Quarry
(DL31864)
1540 New Brighton
Blvd39
Supermarket/G
rocery Store 64,130 253 251.4 562.8 561.6 1462.3 2089
Basilica of St Mary 1600 Hennepin Ave 63 Worship Facility 56,400 58.7 56.6 62 59.8 1427.5 177
Buzza Lofts (510) 1006 Lake St W 32Multifamily
Housing 113,883 77.2 74 147.5 142.5 4092.7 954.1
Coloplast US 1601 W River Rd 54 Office 139,795 120.6 116 191.3 186.4 547.1 1477.5
Yinghua Academy1616 Buchanan
Street NE53 K-12 School 82,664 74.8 70.5 121.5 117 1256.7 557.3
Fisk Building1621 East Hennepin
Avenue82 Office 125,938 59.5 57.5 105 101.9 503.1 742.6
Soo Line Building City
Apartments101 South 5th Street 51
Multifamily
Housing 250,000 78.4 77.1 139.2 137.8 7387 1957.2
Wahu1016 Washington
Ave SE100
Multifamily
Housing 681,251 33.5 32.2 59.7 57.9 15248.3 1861.7
MINNEAPOLIS NE
(1095)
1650 NEW
BRIGHTON BLVD75 Retail Store 400,335 75.8 73.6 169.1 167 1249 1321.1

Property Name Address
ENERGY
STAR
Score
Primary
Property Type
Total Floor
Area
(Buildings &
Parking) (ft²)
Site EUI
(kBtu/ft²)
Weather
Normalized
Site EUI
(kBtu/ft²)
Source
EUI
(kBtu/ft²)
Weather
Normalized
Source EUI
(kBtu/ft²)
Water
Use
(kgal)
Total GHG
Emissions
(Metric Tons
CO2e)
21st Century Bank17 Washington
Avenue N25 Bank Branch 56,935 108.1 106.6 204.2 202.8 211 659.3
East Side
Neighborhood
Services Inc
1700 2nd St NE 35 Office 104,586 153.7 150.5 222.8 219.7 1815.9 661.4
La Rive 110 Bank St 83Multifamily
Housing 192,356 57.9 55.9 115.8 112.4 4036.5 1272.6
Abbott Apartments 110 E 18th St 84Multifamily
Housing 192,725 59 56.1 101.6 97.6 N/A 745.2
OneTen Grant
Apartments
110 West Grant
StreetN/A
Multifamily
Housing 331,847 N/A N/A N/A N/A N/A N/A
The Knoll1101 University Ave
SE100
Multifamily
Housing 148,478 27.2 27.1 60.1 60 4034.4 470.8
Rock Island Lofts 111 4th Ave N 50Multifamily
Housing 143,843 97.7 94 139.9 136.2 2196.7 1092.5
Churchill Apartments111 Marquette Ave
SouthN/A
Multifamily
Housing 667,902 58.1 56.2 88.3 86.4 16299.3 2612.1
Stonebridge Lofts 1120 2ND St S 97Multifamily
Housing 266,799 69 67.3 87.4 85.6 5859.2 1234.7
Rivergate Apartments 115 2nd Ave South 81Multifamily
Housing 279,778 84.8 81.5 138.4 134.1 8911.2 1422.3
Hennepin Crossing1150 Hennepin
Avenue46
Multifamily
Housing 291,370 93.2 90.6 162.7 158.9 7206.4 1907
120 & 1212 Buildings 120 13th Ave NE 92Multifamily
Housing 135,808 47.8 45.7 92 89.4 5132.9 711
Hampton Inn & Suites
Minneapolis
Downtown
19 N 8th Street 88 Hotel 137,304 72 71.2 133.9 132.9 7437.9 1040.2

Property Name Address
ENERGY
STAR
Score
Primary
Property Type
Total Floor
Area
(Buildings &
Parking) (ft²)
Site EUI
(kBtu/ft²)
Weather
Normalized
Site EUI
(kBtu/ft²)
Source
EUI
(kBtu/ft²)
Weather
Normalized
Source EUI
(kBtu/ft²)
Water
Use
(kgal)
Total GHG
Emissions
(Metric Tons
CO2e)
Maverick - Greystar 120 Hennepin Ave 56Multifamily
Housing 187,497 77.1 76.1 143.2 142.1 7413 1379.9
Plymouth
Congregational
Church
1900 Nicollet Ave 23 Worship Facility 90,000 81.6 79.1 119.2 116.6 492.6 584.6
1200 on the Mall 1200 Nicollet Mall 71Multifamily
Housing 159,933 71.9 69.5 122.9 120.1 4187.4 1124.5
Loring Green East 1201 Yale Place 86Multifamily
Housing 453,294 66.5 63.6 111.2 107.4 7421.4 2879.9
The Crossings121 Washington Ave
S61
Multifamily
Housing 294,276 79 76.2 138.5 135.3 9815.3 2335.6
MN2-8 Elliot Twins1212 South 9th
Street1
Multifamily
Housing 120,210 408 389.7 470.4 451 5238.5 2767.5
Vision Loss Resources1936 LYNDALE AVE
SOUTHN/A
Other -
Education 86,765 66.1 62.6 101.2 97.5 722.1 482.2
1225 LaSalle 1225 Lasalle Ave 84Multifamily
Housing 169,904 64.5 63.3 113.7 112.2 5659.5 1108.8
20 Washington
Square20 Washington Ave 87 Office 212,724 59.3 57.7 123.9 121.7 3015.3 1533.8
U.S. Bank Plaza 200 S. 6th St. 92 Office 1,784,286 40 39 104.5 102.8 13855.5 9048.5
Loring Green West 1235 Yale Pl 72Multifamily
Housing 236,987 79 75.8 131.6 127.8 5420.9 1780.9
AAN Headquarters 201 Chicago Avenue 53 Office 62,400 87 84.9 170.9 168.7 623.6 608.2
Hotel Ivy/ Ivy
Residences
201 South 11th
Street12
Mixed Use
Property 432,000 125.4 122.6 209.4 206.2 6767.5 N/A
Deforest1250 Hennepin
Avenue19
Multifamily
Housing 132,658 84.7 82.7 167.7 164.4 3164.3 759.5

Property Name Address
ENERGY
STAR
Score
Primary
Property Type
Total Floor
Area
(Buildings &
Parking) (ft²)
Site EUI
(kBtu/ft²)
Weather
Normalized
Site EUI
(kBtu/ft²)
Source
EUI
(kBtu/ft²)
Weather
Normalized
Source EUI
(kBtu/ft²)
Water
Use
(kgal)
Total GHG
Emissions
(Metric Tons
CO2e)
Revel1300 West Lake
Street72
Multifamily
Housing 115,895 69.1 66.9 125.1 122.7 2626.3 817.4
Loring Park 1300 Yale Place 79Multifamily
Housing 184,262 61.7 58.3 100.7 96.2 6314.2 1030.4
Anderson Hall 2016 8th Street 75Residence
Hall/Dormitory 89,720 91.2 89.2 137 134.7 2528.9 693.1
Hennepin Square
Office Building
2021 E Hennepin
Ave69 Office 115,000 95.5 93.3 156.3 154.1 928.4 998
Shriners Hospitals for
Children
2025 East River
Parkway72
Hospital
(General
Medical &
Surgical)
103,570 199.1 197.6 322.7 321.1 963.9 1853.2
MN2-37 Hamilton
Manor1314 44th Avenue N 74
Multifamily
Housing 157,392 97.7 94.1 142.1 137.7 4541 1046
MN - Nicollet Towers1350 Nicollet
Avenue South84
Multifamily
Housing 289,617 72.4 70.6 110.3 108 13842.2 1752.8
2101 Tenant Building 2101 Kennedy St NE N/A Office 159,980 60.4 59 87.9 86.5 5267 N/A
2101 Parking Ramp 2101 Summer St NE N/A Parking 190,675 2.5 2.4 6.9 6.6 0 78
Hi-Lake Shopping
Center 2106 Bldg
2106-2210 East Lake
StreetN/A Other - Mall 227,942 105.2 103 224 221.7 2621.9 1209.7
IDC Building211 First Street
North63 Office 75,203 70 67.5 148.3 145.9 1703.7 642.1
Loring Park
Apartments (LPM)1369 Spruce Place 36
Multifamily
Housing 448,006 97.8 95.8 165.1 163 11205.3 3257.4
Colonial Warehouse 212 3rd Avenue N 91 Office 251,465 47.3 45.8 83.5 82 1138 1179.4

Property Name Address
ENERGY
STAR
Score
Primary
Property Type
Total Floor
Area
(Buildings &
Parking) (ft²)
Site EUI
(kBtu/ft²)
Weather
Normalized
Site EUI
(kBtu/ft²)
Source
EUI
(kBtu/ft²)
Weather
Normalized
Source EUI
(kBtu/ft²)
Water
Use
(kgal)
Total GHG
Emissions
(Metric Tons
CO2e)
Wilson Park Tower 1400 Laurel Avenue 48Multifamily
Housing 164,424 90 88 158.2 156.1 6149.9 1460.6
YWCA-Midtown 2121 E Lake St N/A
Fitness
Center/Health
Club/Gym
180,000 98.1 96.8 129.7 128.3 4361.3 935.4
Seven Corners1400 South 2nd
StreetN/A
Multifamily
Housing 297,568 63.3 61.7 87.7 86.1 10726.7 1067.6
St Stephen's- School 2123 Cinton Ave S N/A K-12 School 50,595 N/A N/A N/A N/A N/A N/A
East Village South:
East Village South
1401 11th Avenue
South90
Multifamily
Housing 123,355 64.2 63 97.9 96.6 4582.6 662.7
Hotel Minneapolis215 Fourth Street
South20 Hotel 173,857 144.1 140.4 275 269.2 5361.2 2753.7
Bierman Place 1401 6th Street SE 40Multifamily
Housing 127,011 104 100.8 186.2 180.6 3011.9 875.2
Saint Olaf Catholic
Church215 South 8th Street 28 Worship Facility 88,800 86.5 83.9 127.2 124.4 486.1 485.6
LTI 9500 LLC217 Fifth Ave. N.,
Suite 20057 Office 62,937 68.8 66.9 154.5 150.8 5.7 562.2
Laurel Curve 1414 Laurel Avenue 86Multifamily
Housing 101,458 66.2 63.1 111.7 107.5 2666.4 449.3
Booth Manor 1421 Yale Place 68Multifamily
Housing 136,815 88.3 85.7 132.7 129.4 5186 895.8
River Run-Sherman
Associates1434 Marshall St NE 95
Multifamily
Housing 106,381 58.2 55.7 100.3 96.9 4814.5 430.5
231901 - Two22 222 South 9th Street N/A Office 1,035,692 76.1 74.6 128.7 126.9 2814.5 6742.5
Property Name Address
ENERGY
STAR
Score
Primary
Property Type
Total Floor
Area
(Buildings &
Parking) (ft²)
Site EUI
(kBtu/ft²)
Weather
Normalized
Site EUI
(kBtu/ft²)
Source
EUI
(kBtu/ft²)
Weather
Normalized
Source EUI
(kBtu/ft²)
Water
Use
(kgal)
Total GHG
Emissions
(Metric Tons
CO2e)
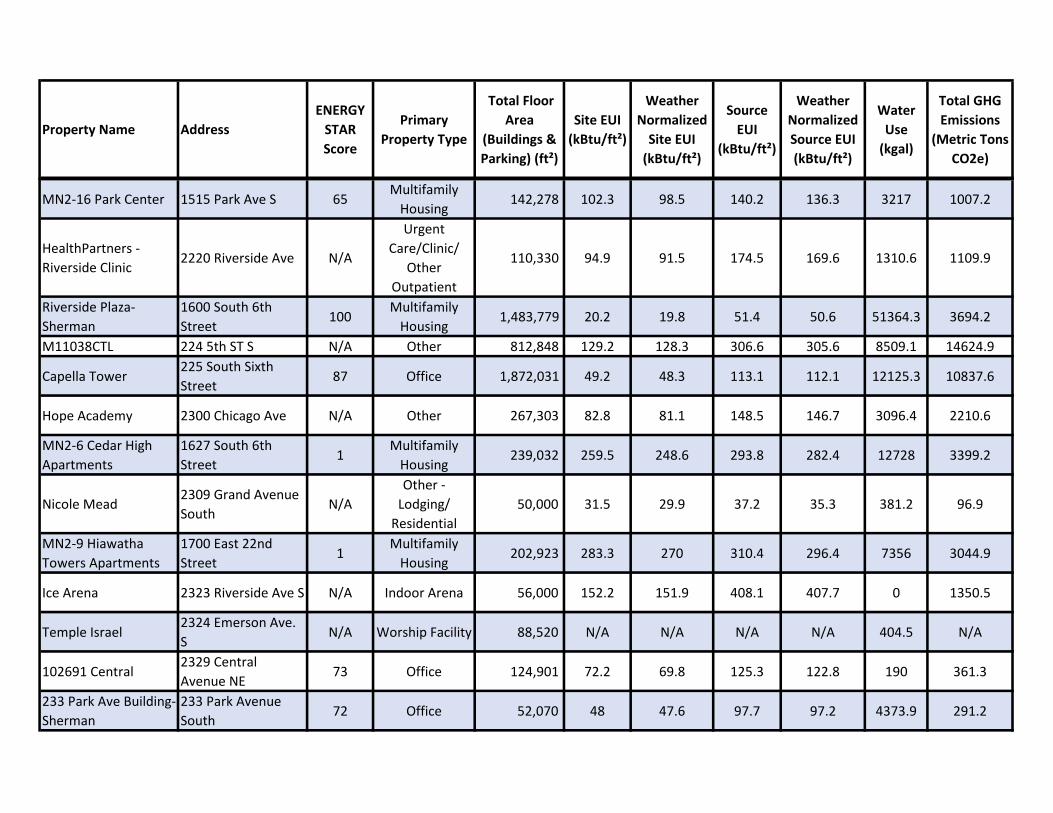
MN2-16 Park Center 1515 Park Ave S 65Multifamily
Housing 142,278 102.3 98.5 140.2 136.3 3217 1007.2
HealthPartners -
Riverside Clinic2220 Riverside Ave N/A
Urgent
Care/Clinic/
Other
Outpatient
110,330 94.9 91.5 174.5 169.6 1310.6 1109.9
Riverside Plaza-
Sherman
1600 South 6th
Street100
Multifamily
Housing 1,483,779 20.2 19.8 51.4 50.6 51364.3 3694.2
M11038CTL 224 5th ST S N/A Other 812,848 129.2 128.3 306.6 305.6 8509.1 14624.9
Capella Tower225 South Sixth
Street87 Office 1,872,031 49.2 48.3 113.1 112.1 12125.3 10837.6
Hope Academy 2300 Chicago Ave N/A Other 267,303 82.8 81.1 148.5 146.7 3096.4 2210.6
MN2-6 Cedar High
Apartments
1627 South 6th
Street1
Multifamily
Housing 239,032 259.5 248.6 293.8 282.4 12728 3399.2
Nicole Mead2309 Grand Avenue
SouthN/A
Other -
Lodging/
Residential
50,000 31.5 29.9 37.2 35.3 381.2 96.9
MN2-9 Hiawatha
Towers Apartments
1700 East 22nd
Street1
Multifamily
Housing 202,923 283.3 270 310.4 296.4 7356 3044.9
Ice Arena 2323 Riverside Ave S N/A Indoor Arena 56,000 152.2 151.9 408.1 407.7 0 1350.5
Temple Israel2324 Emerson Ave.
SN/A Worship Facility 88,520 N/A N/A N/A N/A 404.5 N/A
102691 Central2329 Central
Avenue NE73 Office 124,901 72.2 69.8 125.3 122.8 190 361.3
233 Park Ave Building-
Sherman
233 Park Avenue
South72 Office 52,070 48 47.6 97.7 97.2 4373.9 291.2

Property Name Address
ENERGY
STAR
Score
Primary
Property Type
Total Floor
Area
(Buildings &
Parking) (ft²)
Site EUI
(kBtu/ft²)
Weather
Normalized
Site EUI
(kBtu/ft²)
Source
EUI
(kBtu/ft²)
Weather
Normalized
Source EUI
(kBtu/ft²)
Water
Use
(kgal)
Total GHG
Emissions
(Metric Tons
CO2e)
MN2-24 Third Avenue
Towers1707 3rd Avenue S 86
Multifamily
Housing 161,879 79.9 77.2 116.6 113.7 3584 915.3
MN2-32 Holland Hi
Rise
1717 Washington
Street NE68
Multifamily
Housing 127,462 105.7 101.8 149.9 145.7 3162 889.8
Center for Changing
Lives2400 Park Ave N/A Office 80,894 N/A N/A N/A N/A N/A N/A
7west1800 Washington
Ave S99
Multifamily
Housing 232,938 50.9 49.6 88.6 86.7 4039.3 925.6
Days Hotel2407 University Av
SE5 Hotel 52,866 86.6 84.6 199 193.7 3159.8 611.2
Jerry Gamble Club 2410 Irving Ave N 91 K-12 School 57,000 65.2 63.6 116.6 115 104.9 308.4
West Building 2414 7th St S N/A
Outpatient
Rehabilitation/P
hysical Therapy
294,230 153.8 153 298 297.1 11149.5 5075.2
1800 Lake on Calhoun1800 West Lake
Street100
Multifamily
Housing 123,342 40.2 38.3 64.7 62.2 1234.2 353
Bottineau Commons-
Sherman Associates
1808 University
Avenue NE98
Multifamily
Housing 185,373 52.5 49.9 83.3 80 7646.6 645
MN2-35 Parker
Skyview
1815 Central
Avenue NE34
Multifamily
Housing 251,518 143.8 138.3 185.5 179.3 6139 2054.8
South Building 2450 Riverside ave. 1
Other -
Specialty
Hospital
238,780 526.1 524.9 1208.8 1207.4 16023 16902.8
Hennepin Ramp 25 1st Street N N/A Parking 479,718 1.9 1.8 5.2 5.1 N/A 148.2
Marquette Plaza 250 Marquette Ave N/A Office 666,270 N/A N/A N/A N/A N/A N/A

Property Name Address
ENERGY
STAR
Score
Primary
Property Type
Total Floor
Area
(Buildings &
Parking) (ft²)
Site EUI
(kBtu/ft²)
Weather
Normalized
Site EUI
(kBtu/ft²)
Source
EUI
(kBtu/ft²)
Weather
Normalized
Source EUI
(kBtu/ft²)
Water
Use
(kgal)
Total GHG
Emissions
(Metric Tons
CO2e)
310 - GrandMarc
Seven Corners
1849 Washington
Ave South93
Multifamily
Housing 177,602 63.9 62.2 110.2 107.4 10462 1095.4
St Catherines
University2500 6th St S N/A
College/
University 150,639 168.4 168.4 240.9 240.9 198.2 2043.4
LAKE STREET (0052) 2500 E LAKE ST 61 Retail Store 418,600 89.3 87.2 195.4 193.2 1151 1435.9
2501 Stevens 2501 Stevens Ave N/ACollege/
University 174,525 208.2 205.5 313.2 310 1904.1 2433.5
Minnehaha 941901 Minnehaha
Ave94
Multifamily
Housing 107,469 90.2 88.3 114.8 112.8 73.9 410.7
McKessen Building251 1st Avenue
North17 Office 82,441 183.8 180.3 287.9 284.5 1310 1310
Minnehaha Center
LLC
2510 Lake Street
EastN/A Strip Mall 452,341 83.6 81.4 125 122.7 7394.3 737.9
2512 building 2512 7th St. S N/A
Outpatient
Rehabilitation/P
hysical Therapy
173,722 163.8 160.5 281.1 276.6 6468.8 2797.9
Riverview Tower 1920 1st St S 31Multifamily
Housing 193,781 108.9 106.9 178 175.7 8836.2 1915.3
Rose - Building Data:
Rose - Building Data
1928 Portland
Avenue South63
Multifamily
Housing 111,999 58.8 58.2 120.3 119.6 3158.6 771.9
Falls and Pinnacle 20 2nd St NE 93Multifamily
Housing 264,697 74.5 69.6 98.8 93.7 7406 1398.3
West Broadway: West
Broadway
2000 West
Broadway Avenue100
Multifamily
Housing 101,166 16.7 16.4 39.6 38.8 7783 233.6
Saint Mary's
University2540 Park N/A
Convention
Center 83,721 39.9 37.6 56.9 54.5 201.2 258.2
Property Name Address
ENERGY
STAR
Score
Primary
Property Type
Total Floor
Area
(Buildings &
Parking) (ft²)
Site EUI
(kBtu/ft²)
Weather
Normalized
Site EUI
(kBtu/ft²)
Source
EUI
(kBtu/ft²)
Weather
Normalized
Source EUI
(kBtu/ft²)
Water
Use
(kgal)
Total GHG
Emissions
(Metric Tons
CO2e)
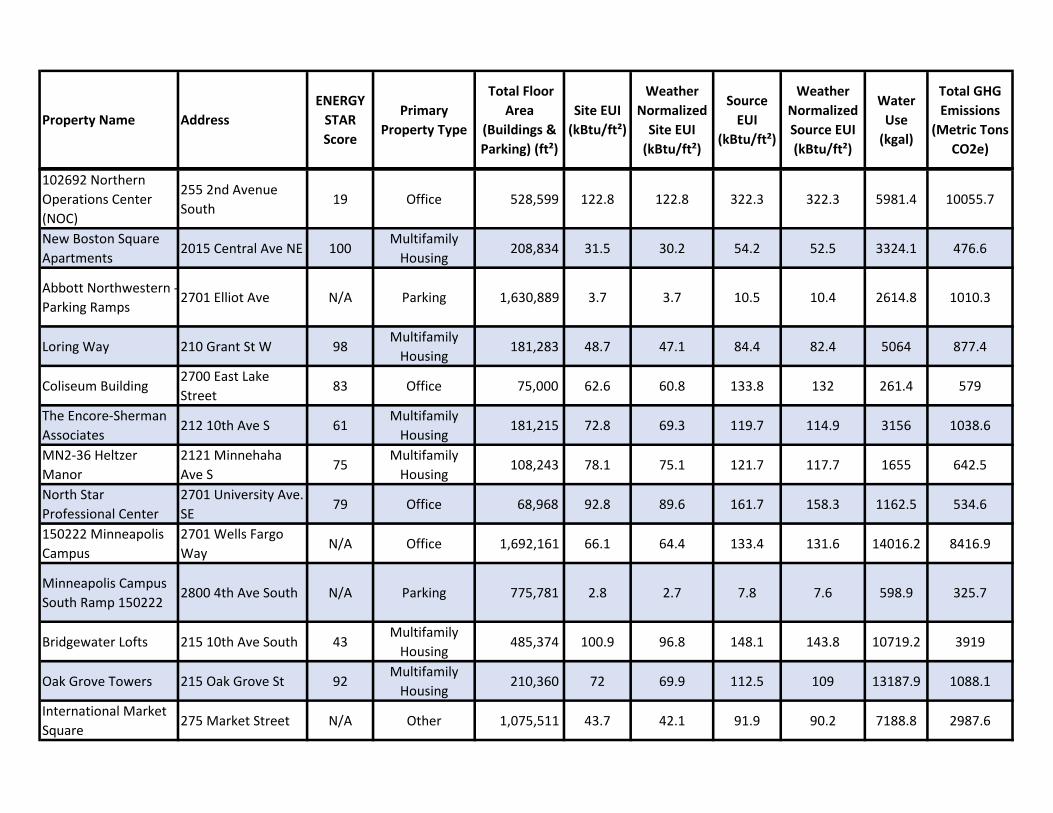
102692 Northern
Operations Center
(NOC)
255 2nd Avenue
South19 Office 528,599 122.8 122.8 322.3 322.3 5981.4 10055.7
New Boston Square
Apartments2015 Central Ave NE 100
Multifamily
Housing 208,834 31.5 30.2 54.2 52.5 3324.1 476.6
Abbott Northwestern -
Parking Ramps2701 Elliot Ave N/A Parking 1,630,889 3.7 3.7 10.5 10.4 2614.8 1010.3
Loring Way 210 Grant St W 98Multifamily
Housing 181,283 48.7 47.1 84.4 82.4 5064 877.4
Coliseum Building2700 East Lake
Street 83 Office 75,000 62.6 60.8 133.8 132 261.4 579
The Encore-Sherman
Associates212 10th Ave S 61
Multifamily
Housing 181,215 72.8 69.3 119.7 114.9 3156 1038.6
MN2-36 Heltzer
Manor
2121 Minnehaha
Ave S75
Multifamily
Housing 108,243 78.1 75.1 121.7 117.7 1655 642.5
North Star
Professional Center
2701 University Ave.
SE79 Office 68,968 92.8 89.6 161.7 158.3 1162.5 534.6
150222 Minneapolis
Campus
2701 Wells Fargo
WayN/A Office 1,692,161 66.1 64.4 133.4 131.6 14016.2 8416.9
Minneapolis Campus
South Ramp 1502222800 4th Ave South N/A Parking 775,781 2.8 2.7 7.8 7.6 598.9 325.7
Bridgewater Lofts 215 10th Ave South 43Multifamily
Housing 485,374 100.9 96.8 148.1 143.8 10719.2 3919
Oak Grove Towers 215 Oak Grove St 92Multifamily
Housing 210,360 72 69.9 112.5 109 13187.9 1088.1
International Market
Square275 Market Street N/A Other 1,075,511 43.7 42.1 91.9 90.2 7188.8 2987.6

Property Name Address
ENERGY
STAR
Score
Primary
Property Type
Total Floor
Area
(Buildings &
Parking) (ft²)
Site EUI
(kBtu/ft²)
Weather
Normalized
Site EUI
(kBtu/ft²)
Source
EUI
(kBtu/ft²)
Weather
Normalized
Source EUI
(kBtu/ft²)
Water
Use
(kgal)
Total GHG
Emissions
(Metric Tons
CO2e)
Twin Cities
International School277 12th Ave N 55 K-12 School 78,098 75.4 71.4 137.5 133.2 0.9 606
2800 Building -
Midtown Med2800 Chicago Ave 100
Hospital
(General
Medical &
Surgical)
53,603 85.4 82.1 144 140.6 675.8 430.6
Phoenix on the River 222 2nd St SE 49Multifamily
Housing 187,247 62.3 61.2 124.3 123.2 3818.5 1330
Minneapolis Campus -
South Building
150222
2801 4th Ave South 88 Office 241,753 50.5 50 119.5 119 2731.3 1683.8
Uptown YWCA2808 Hennepin Ave.
SoN/A
Fitness
Center/Health
Club/Gym
55,000 163.6 162 305.5 303.8 2336.4 951.5
Abubakar As Saddique
Islamic Center2824 13th Ave S 35 Worship Facility 86,124 60.6 57.8 98.7 95.1 828.6 362.6
2828 Building -
Midtown Med2828 Chicago Ave 70
Hospital
(General
Medical &
Surgical)
56,239 172.2 172.2 477 477 932.2 1587.3
222 Hennepin
Apartments222 Hennepin Ave S 100
Multifamily
Housing 365,607 48.5 46 70.8 68.2 9469.5 1139.5
Cedars 94 Apartments2220 E. Franklin
Avenue90
Multifamily
Housing 194,044 70.8 69 93.6 91.7 6704 970.8
Franklin Housing
Cooperative2300 E Franklin Ave 100
Multifamily
Housing 170,136 41.8 40.8 57.2 56 8424.9 523.7
Blue Line Flats2340 East 32nd
Street99
Multifamily
Housing 176,700 44.6 43 75.9 73.6 6328.1 597.7

Property Name Address
ENERGY
STAR
Score
Primary
Property Type
Total Floor
Area
(Buildings &
Parking) (ft²)
Site EUI
(kBtu/ft²)
Weather
Normalized
Site EUI
(kBtu/ft²)
Source
EUI
(kBtu/ft²)
Weather
Normalized
Source EUI
(kBtu/ft²)
Water
Use
(kgal)
Total GHG
Emissions
(Metric Tons
CO2e)
East End Apartments-
Sherman240 Chicago Avenue 69
Multifamily
Housing 373,793 58.3 57.5 134.7 133.8 3892.1 1590.7
Cub Foods - Lake St 2850 26th Ave S. 17Supermarket/G
rocery Store 65,130 255.7 250.9 579 574 2392.5 2187
Minneapolis Grand
Apartments2401 Chicago Ave. N/A
Multifamily
Housing 189,828 31.8 31.1 66.3 64.7 3343.1 508.8
MN2-34 Fifth Avenue
Highrise2419 5th Avenue S 96
Multifamily
Housing 197,674 76.7 73.8 98.4 95.2 5966 946.3
American Trio Lofts 250 Park Ave 46Multifamily
Housing 103,684 93.7 89.4 141.6 137.1 3161.8 804.8
Karmel Plaza2910 Pillsbury Ave.
S.37
Mixed Use
Property 136,654 95.2 92.7 204.9 202.2 7851.8 1243.6
Broadway Flats2505 Penn Avenue
N100
Multifamily
Housing 300,000 19.2 18.8 35.7 35.2 3791.2 606.6
Cristo Rey Jesuit High
School2924 4th Ave S. 72 K-12 School 158,947 51.5 50.8 107 106.3 1469.5 976.4
Midtown Exchange 2929 Chicago Ave 96 Office 444,541 51.3 50.7 97.7 97.1 22062.4 2466.3
Seward Towers West:
Seward Tower West
2515 South 9th
Street80
Multifamily
Housing 255,838 79.8 77.7 121.2 118.3 13723.2 1700.2
Midtown Exchange
Parking Ramp2935 10th Ave S N/A Parking 534,850 1.3 1.3 3.7 3.7 N/A 99.9
University Village
Apartments
2515 University Ave
SeN/A
Multifamily
Housing 413,447 60.3 59.1 99.4 98 15922.6 1664.6
337h7-Minneapolis
Marriott City Center30 South 7th Street 65 Hotel 555,000 115.6 114.6 184.1 182.9 24961 N/A

Property Name Address
ENERGY
STAR
Score
Primary
Property Type
Total Floor
Area
(Buildings &
Parking) (ft²)
Site EUI
(kBtu/ft²)
Weather
Normalized
Site EUI
(kBtu/ft²)
Source
EUI
(kBtu/ft²)
Weather
Normalized
Source EUI
(kBtu/ft²)
Water
Use
(kgal)
Total GHG
Emissions
(Metric Tons
CO2e)
300 1st Ave. N. 300 1st Ave. N. N/AVocational
School 95,809 48.4 47.7 116.1 115.4 759.8 648.9
300 Industrial300 Industrial Blvd
NEN/A
Mixed Use
Property 157,250 187.8 187.8 226.9 226.9 867.8 777.6
Hewing Hotel300 Washington Ave
North20 Hotel 116,123 177.1 174.7 336.6 334.4 4083.9 2219.2
Broadway Ridge3001 Broadway
Street, NE77 Office 539,081 65.5 64.3 167.5 165.6 3524.4 1895.1
Ebenezer Tower
Apartments
2523 Portland
Avenue63
Multifamily
Housing 162,860 108.3 105.4 141.3 138.2 5914 1075.1
2615 Park Avenue
Associates2615 Park Ave N/A
Multifamily
Housing 248,980 N/A N/A N/A N/A N/A N/A
The Lakes Residence 2622 W Lake Street 1Multifamily
Housing 120,000 107.9 105.1 226.2 222.2 2759.9 1560.6
44 North 2701 4th St SE 100Multifamily
Housing 260,541 30.3 29.9 62.6 62.2 7469.7 935.4
Lake Calhoun Center 3033 Excelsior Blvd 30 Office 150,152 164.5 164.5 264.8 264.8 3278.6 2202.8
Sabathani Community
Center310 38th St E N/A
Social/ Meeting
Hall 246,300 66 64 100.8 98.7 1746.2 1197.6
Flour Exchange
Building310 4th Ave.So. 96 Office 129,636 61.3 58.8 65 62.4 378.8 427.5
Minnehaha Academy
North
3100 West River
PArkway78 K-12 School 222,000 104.4 102.1 160.8 158.3 1858.2 1343.4
MN2-17 Riverside2728 East Franklin
Ave19
Multifamily
Housing 113,718 161.2 154.6 205 198 2590 1060.5
Nicollet Garage3106 Nicollet
AvenueN/A
Transportation
Terminal/
Station
210,000 79 75.3 110.9 107 4430.3 1258.7

Property Name Address
ENERGY
STAR
Score
Primary
Property Type
Total Floor
Area
(Buildings &
Parking) (ft²)
Site EUI
(kBtu/ft²)
Weather
Normalized
Site EUI
(kBtu/ft²)
Source
EUI
(kBtu/ft²)
Weather
Normalized
Source EUI
(kBtu/ft²)
Water
Use
(kgal)
Total GHG
Emissions
(Metric Tons
CO2e)
Greenleaf2743 Lyndale
Avenue SouthN/A
Multifamily
Housing 102,356 51.8 50.5 71 69.6 5738.3 253.6
United Labor Center 312 Central Ave S.E 67 Office 122,044 86.8 84.8 155.9 153.8 951.4 720.4
Ryan Third and Third312 South Third
Street80 Office 71,010 43.3 41.6 84.4 82.6 601.3 341.3
Trinity Apartments2800 East 31st
StreetN/A
Multifamily
Housing 115,282 75.6 72.6 96.3 92.8 3767.6 539.6
The Murals of
LynLake2833 Lyndale Ave S. 99
Multifamily
Housing 209,505 38.1 36.2 68 65.2 4019.4 630.5
The Miles 2837 Dupont Ave S 94Multifamily
Housing 182,385 56.4 55.2 102.9 101.6 7313.5 1059
Elan Uptown
Apartments2837 Emerson Ave S N/A
Multifamily
Housing 650,582 36.9 35.7 58.8 57 15608.3 1479.3
Flux Apartments2838 Freemont
Avenue South52
Multifamily
Housing 290,154 104.5 101.6 158.1 155.1 5268 1713.7
Karmel Village2848 Pleasant
Avenue South77
Multifamily
Housing 135,281 45.8 44.6 128.3 124.8 9279.9 814.9
IMS Lofts 290 Market St 72Multifamily
Housing 129,190 79.1 75.9 114.4 111 6348.8 803.5
Calhoun Beach Club 2900 Thomas Ave S N/AMultifamily
Housing 1,193,581 57.7 55.7 97.1 95.1 12673.1 4569.9
Seward Towers East:
Seward Tower East
2910 East Franklin
Avenue87
Multifamily
Housing 255,838 69.7 67.9 111.8 109.3 13142.6 1583
The Link Minnesota2929 University Ave
SE100
Multifamily
Housing 530,839 29.6 29.2 58.3 57.8 12589.7 1764.1

Property Name Address
ENERGY
STAR
Score
Primary
Property Type
Total Floor
Area
(Buildings &
Parking) (ft²)
Site EUI
(kBtu/ft²)
Weather
Normalized
Site EUI
(kBtu/ft²)
Source
EUI
(kBtu/ft²)
Weather
Normalized
Source EUI
(kBtu/ft²)
Water
Use
(kgal)
Total GHG
Emissions
(Metric Tons
CO2e)
Lake Point Condos 2950 Dean Pkwy 21Multifamily
Housing 165,861 112.4 108.6 169.5 164.6 3216.7 1539.8
Lakewood isles3031 Ewing Ave
South 100
Multifamily
Housing 233,000 44.2 42.9 54.9 53.4 10957.8 578.5
Calhoun Village3200 West Lake
StreetN/A Strip Mall 133,494 190.6 185.1 358.9 351.4 4624.1 1812.2
Loop Calhoun 3104 Lake St W 95Multifamily
Housing 151,045 51.6 49.4 88.6 86.3 3611.7 748.6
Fairview Minneapolis
323 Stinson323 Stinson Blvd 9 Office 75,670 234.1 232.1 617.1 615 1062.4 2750.4
T3323 Washington
Avenue NorthN/A Office 264,518 23.1 22.8 59.6 59.3 1075.3 833.2
33 South Sixth Street 33 South 6th Street 94 Office 1,375,717 63 61.9 120.6 119.2 7968.1 9668.1
330 2nd Avenue
South
330 2nd Avenue
South79 Office 255,864 69.2 67.4 140.4 138.3 1953.1 1847.6
SPS Tower333 S. 7th St. Suite
25087 Office 962,240 72.4 70.4 130.5 127.6 5761.4 1806.1
333 South 12th St 333 South 12th St 12 Worship Facility 87,051 88.1 84.1 128.8 124.5 482.2 610.6
Union Plaza333 Washington Ave
N73 Office 68,043 70.1 67.4 146.3 142.7 782.8 572
YMCA- Blaisdell Ave 3335 Blaisdell Ave N/A
Fitness
Center/Health
Club/Gym
93,000 171.1 168.6 281.3 278.7 4870.6 953.6
Foundry Lake Street3118 West Lake
Street100
Multifamily
Housing 347,453 31.2 30 55.3 54.1 4799.5 812.8

Property Name Address
ENERGY
STAR
Score
Primary
Property Type
Total Floor
Area
(Buildings &
Parking) (ft²)
Site EUI
(kBtu/ft²)
Weather
Normalized
Site EUI
(kBtu/ft²)
Source
EUI
(kBtu/ft²)
Weather
Normalized
Source EUI
(kBtu/ft²)
Water
Use
(kgal)
Total GHG
Emissions
(Metric Tons
CO2e)
MN2-31 Charles Horn
Terrace
3121 Pillsbury
Avenue S98
Multifamily
Housing 317,280 75.6 72.7 91.6 88.5 9521 1502.6
Broadway Place East3433 Broadway
Street, NE96 Office 288,266 41.4 39.7 86.7 84.6 1167.6 628.2
The Hub -
Minneapolis (410)313 Harvard Street N/A
Multifamily
Housing 640,338 N/A N/A N/A N/A 11675.8 N/A
Hiawatha Collegiate
High School
3500 East 28th
Street47 K-12 School 102,000 60.9 59.7 146 143.9 1739.8 868.8
The Waters on 50th 3500 W 50th St 95Senior Care
Community 152,994 54.7 53.3 122.3 119.4 1996.4 849.4
Latitude 45313 Washington
Avenue SouthN/A
Multifamily
Housing 251,417 59.3 57.4 118.7 115.7 7869.6 1705
Calhoun Place Condos 3131 Excelsior Blvd 65Multifamily
Housing 108,795 94.2 92 142.2 139.9 2701.3 847.9
MN2-42 Archie
Givens Atrium314 Hennepin Ave 84
Multifamily
Housing 244,032 75.8 72.8 117.6 114.2 6599 1451.7
Calhoun Greenway
Apartments3140 Chowen Ave S 100
Multifamily
Housing 455,000 29.2 28.6 42.3 41.7 15756.1 977.9
Nordhaus - LMC 315 1st. Ave NE 75Multifamily
Housing 271,600 58.8 56.5 97.3 94.8 6908.1 1253.9
MN2-23 Lowry
Towers315 Lowry Avenue N 65
Multifamily
Housing 150,018 99.1 95 149.2 144.3 4095 1016.4
Variant 315 N 7th Avenue 63Multifamily
Housing 111,955 90.6 87.1 150.1 144.8 2609.3 934.9
OATI Minneapolis
Data Center
3660 Technology
Drive NE73 Office 469,300 174.4 172.2 415.8 413.8 61.1 4105.5
Jones Harrison
Residence
3700 Cedar Lake
Avenue50
Senior Care
Community 220,000 147.2 144.4 254.9 252 8038.9 2570.7

Property Name Address
ENERGY
STAR
Score
Primary
Property Type
Total Floor
Area
(Buildings &
Parking) (ft²)
Site EUI
(kBtu/ft²)
Weather
Normalized
Site EUI
(kBtu/ft²)
Source
EUI
(kBtu/ft²)
Weather
Normalized
Source EUI
(kBtu/ft²)
Water
Use
(kgal)
Total GHG
Emissions
(Metric Tons
CO2e)
Walker Place 3701 Bryant Ave S 34Senior Care
Community 124,250 123.9 121.9 204.9 202.7 4484.8 1139.9
Wayzata Venture, LLC3701 Watzata
Boulevard99 Office 713,681 25.6 25.6 71.7 71.7 N/A 1309.9
Providence Place 3720 23rd ave south 64Senior Care
Community 120,000 134.2 131.5 216.2 213.4 7405.8 1438.7
Groveland, The 317 Groveland Ave 45Multifamily
Housing 168,284 86.1 84.6 141.5 140 4318.4 1323.6
Walker Methodist
Health Center3737 Bryant Ave S 33
Senior Care
Community 373,000 160 157.5 233.2 230.5 11995.8 4227.2
Hiawatha College
Prep - Kingfield
3800 Pleasant
AvenueN/A K-12 School 70,030 63.4 59.7 88.8 84.9 484.3 336
Mill City Quarter 322 South 2nd St 90Multifamily
Housing 239,460 76.1 72.2 117.7 113.1 4082.7 1032.5
400 Wyman Building400 1st Avenue
North67 Office 224,808 101.5 95.8 161.5 154.7 1440.9 2079.7
Old Republic Title
Building400 2nd Ave South 66 Office 135,009 57.4 57.5 154 154.3 894.8 1226.4
Dock Street Flats337 Washington Ave
N100
Multifamily
Housing 317,284 34.2 33.2 67.5 66.5 3464.4 957.3
Horst Education 400 Central Ave. S.E. N/AVocational
School 99,244 101.7 100.2 191.6 190 2136.7 761.5
Minneapolis Grain
Exchange400 South 4th Street 58 Office 394,146 107.8 104.5 158.5 155 5374.6 3406.3
AX Stinson LP 400 Stinson 72 Office 405,131 95.8 94.2 187.1 185.6 3908.2 2690.7
Calhoun Towers 3430 List Place 92Multifamily
Housing 227,757 92.4 89 109.8 106.1 4058.5 829.6

Property Name Address
ENERGY
STAR
Score
Primary
Property Type
Total Floor
Area
(Buildings &
Parking) (ft²)
Site EUI
(kBtu/ft²)
Weather
Normalized
Site EUI
(kBtu/ft²)
Source
EUI
(kBtu/ft²)
Weather
Normalized
Source EUI
(kBtu/ft²)
Water
Use
(kgal)
Total GHG
Emissions
(Metric Tons
CO2e)
Nates Building 401 1st Avenue N 55 Office 56,928 99.7 94.5 155.3 149 341.7 506
MN2-50 Heritage
Commons
350 Van White
Memorial Blvd53
Multifamily
Housing 101,861 66.6 65.1 121.3 119.9 2348 635.8
Textile Building401 2nd Avenue
North65 Office 104,843 92.6 89.5 163.4 160.3 1424.3 962.2
Oaks Station Place 3550 E 46th Street 90Multifamily
Housing 153,764 49 47.2 99.5 96.8 3132.5 640.1
DESIGNERS GUILD
BUILDING401 N 3RD ST N/A Office 178,423 68 65.1 128.1 124.3 1072.8 783.2
401 Nicollet mall 401 NIcollet Mall 75 Office 247,985 60.6 58.6 169.6 164.1 1761.7 2380.5
Noble Academy 4021 Thomas Ave N N/AOther -
Education 56,963 126.9 N/A 151.4 N/A 848.1 450.8
Downtown Auto Park,
641
409 Marquette
AvenueN/A Parking 146,080 5.3 5.1 13.8 13.2 105 118.1
Historic Crane
Building404 3rd Ave N 94 Office 55,500 37.1 35.2 79.5 76.3 867 254.3
United Way 404 8th St. South 47 Office 83,222 112.2 108.1 181.3 176.5 270.5 761
Paxon_CO360 First Street
North100
Multifamily
Housing 189,985 27.4 27.4 59.6 59.7 2871.8 653.8
Best Western Plus
The Normandy Inn &
Suites
405 South 8th Street 41 Hotel 181,699 144.8 141.8 226.6 222.2 6299.1 1707.6
Hiawatha Flats 3625 E 43rd St 100Multifamily
Housing 279,173 50.9 47.8 78.5 74.7 4756.6 805.2
Gateway 412 South 3rd Street N/A Parking 545,975 4.8 4.6 13.3 13 149.9 430.9

Property Name Address
ENERGY
STAR
Score
Primary
Property Type
Total Floor
Area
(Buildings &
Parking) (ft²)
Site EUI
(kBtu/ft²)
Weather
Normalized
Site EUI
(kBtu/ft²)
Source
EUI
(kBtu/ft²)
Weather
Normalized
Source EUI
(kBtu/ft²)
Water
Use
(kgal)
Total GHG
Emissions
(Metric Tons
CO2e)
Government Center
Ramp415 south 3rd Street N/A Parking 350,000 6.3 6 12.3 12 100.8 245.3
414 Nicollet Mall 414 Nicollet Mall 69 Office 373,735 133.4 131.7 373.5 368.8 6263.4 8267
Hiawatha Flats II 3635 E 43rd St 100Multifamily
Housing 105,855 41.4 39.3 72.6 70.3 2380.3 323.9
365 Nicollet 365 Nicollet Mall N/AMultifamily
Housing 649,508 76.1 71.6 124.1 119.4 4391.5 3420.8
Lumber Exchange
Building417 Hennepin Ave 72 Office 242,681 75.3 N/A 147.7 N/A 6911 2077.3
Ford Center 420 N. 5th Street 91 Office 339,295 54.3 51.9 113.5 111.2 1155.8 1983.1
Minnehaha Academy
South
4200 West River
Parkway92 K-12 School 202,770 55.5 53.8 106.3 104.3 799.3 1043.2
Mcknight Center 4225 3rd Avenue S N/APre-school/
Daycare 108,000 57.3 54.1 79.9 76.5 14.9 465.7
Longfellow Station-
Sherman3845 Hiawatha Ave 74
Multifamily
Housing 207,773 74.3 73 121.6 120.2 5561 1042.4
Hyatt Place
Downtown
Minneapolis
425 South 7th Street 66 Hotel 183,559 119 117.3 179.8 177.5 8288.8 N/A
A-Mill (600) 400 2nd St SE 97Multifamily
Housing 400,000 61.6 N/A 79.8 N/A 6729.1 1153.2
Riverplace - Expo Hall 43 Main Street SE 34 Office 145,654 80.6 80.6 225.6 225.6 532.3 1945.8
Kickernick 430 1st Ave North 80 Office 152,110 48.3 47.4 116.2 115.3 3425.5 1031.8
Summit House400/410 Groveland
Ave 77
Multifamily
Housing 377,500 82.5 79.3 115 111.2 8102.8 2344.5

Property Name Address
ENERGY
STAR
Score
Primary
Property Type
Total Floor
Area
(Buildings &
Parking) (ft²)
Site EUI
(kBtu/ft²)
Weather
Normalized
Site EUI
(kBtu/ft²)
Source
EUI
(kBtu/ft²)
Weather
Normalized
Source EUI
(kBtu/ft²)
Water
Use
(kgal)
Total GHG
Emissions
(Metric Tons
CO2e)
RiverWest 401 1st St S 92Multifamily
Housing 402,336 54.9 53.4 96.5 94.5 11027.6 2180.9
Mill & Main West 401 Main Street SE 100Multifamily
Housing 446,200 28.4 27.5 55.3 54.1 4223.9 1009.9
Millworks Lofts (630)4041 Hiawatha
Avenue South95
Multifamily
Housing 105,599 39.3 38.1 84.2 81.9 2239.5 512.8
Residence Inn City
Center45 South 8th Street 93 Hotel 153,040 59.9 N/A 131 N/A 3341.1 882.7
FSP PLAZA SEVEN LLC45 South Seventh
Street77
Mixed Use
Property 870,775 89.6 87.4 165.4 162.2 12213.1 7043.4
Lindsay Lofts 408 1st St N 66Multifamily
Housing 107,623 90.5 87.2 132.6 129.3 1498.6 777.9
Heritage Landing415 North First
Street100
Multifamily
Housing 443,346 27.5 25.7 34.8 32.9 7206.9 817.9
VUE 415 Oak Grove St. 95Multifamily
Housing 119,083 59 56.4 106.8 102.8 2578.6 584.3
SCH 46 S 11th Street N/ACollege/
University 75,019 123.2 118.2 213.2 207.3 247 917.2
Chateau Student
Housing Cooperative425 13th Ave SE 61
Multifamily
Housing 174,900 103.6 101.4 156.8 154.6 6777.6 1100.9
SSC Dinkytown
Apartments LLC DBA
Venue at Dinkytown
428 13 Ave SE 100Multifamily
Housing 167,303 60.8 57.5 88.2 84.3 4032.7 552.5
430 Oak Grove 430 Oak Grove St N/AMultifamily
Housing 106,000 N/A N/A N/A N/A N/A N/A
Acorn Mini Storage 4652 Lyndale Ave. N N/A Other - Services 53,970 6.5 6.5 15.1 15.1 78 47.4

Property Name Address
ENERGY
STAR
Score
Primary
Property Type
Total Floor
Area
(Buildings &
Parking) (ft²)
Site EUI
(kBtu/ft²)
Weather
Normalized
Site EUI
(kBtu/ft²)
Source
EUI
(kBtu/ft²)
Weather
Normalized
Source EUI
(kBtu/ft²)
Water
Use
(kgal)
Total GHG
Emissions
(Metric Tons
CO2e)
M19013CTL 4701 BEARD AVE S N/A Other 59,172 178.8 176.2 410.5 407.8 63.2 1410.8
Becketwood
Independent Senior
Living
4300 West River
Parkway South100
Multifamily
Housing 612,000 34 33 51.4 50.2 5604.6 1380.6
Creamette 432 North 1st Street N/AMultifamily
Housing 143,895 17.6 17.3 39.6 39.4 4072.7 194.7
50 S Tenth Street 50 S Tenth Street 82 Office 525,913 72.3 71.1 138.1 136.7 6286.9 4250.6
Fifty South Sixth50 South 6th St.,
Suite 95066 Office 1,085,348 65.8 64.5 178 175 1021733 8527.9
Red Ramp 507 23rd Ave S N/A Parking 50,000 20 20 55.9 55.9 0 165.5
Bloomington
Investments500 3rd Street N 65 Office 52,534 68.9 67.1 135.9 134 152.6 407.2
Armory 500 6th St. S N/A
Other -
Entertainment/
Public Assembly
175,000 77.1 74 142.8 139.2 2095.5 1413.4
Centre Village 433 7th St S 59Multifamily
Housing 253,859 77.4 75.2 137.5 135.1 15764.4 1988.2
Coordinating Center 500 N 5th St 86 Office 246,249 71.9 69.2 134.9 132.1 2075.9 1883.2
Depot Office Center500 Washington Ave
S68 Office 143,197 95.6 93.1 187.8 185.2 9.5 1533
Cobalt Condominium 45 University AVe SE 15Multifamily
Housing 142,224 113.8 108.3 174.1 168.2 4366.1 1359.5
MacPhail Center for
Music501 S 2nd St N/A
Other -
Education 55,562 155.1 150.9 235.6 231.4 718.3 718.2
West River Commons 4610 E Lake St. 100Multifamily
Housing 113,597 18.2 17.8 43 42.1 2899.4 261.4

Property Name Address
ENERGY
STAR
Score
Primary
Property Type
Total Floor
Area
(Buildings &
Parking) (ft²)
Site EUI
(kBtu/ft²)
Weather
Normalized
Site EUI
(kBtu/ft²)
Source
EUI
(kBtu/ft²)
Weather
Normalized
Source EUI
(kBtu/ft²)
Water
Use
(kgal)
Total GHG
Emissions
(Metric Tons
CO2e)
Mt Olivet Church 5025 Knox Ave S 34 Worship Facility 296,000 92 89.4 143.1 140.5 732.9 914.3
Yellow Ramp 507 23rd ave. S N/A Parking 70,000 14.9 14.9 41.8 41.8 0 173.5
Butler North Building510 1st Avenue
NorthN/A Office 138,474 87.2 83.8 155.3 151.8 4203.6 1209.9
Nic on Fifth 465 Nicollet Mall 53Multifamily
Housing 463,815 93.9 88.2 156.2 149.3 6825.7 2824.5
510 Marquette Ave. S.510 Marquette Ave.
S.82 Office 312,452 83 80.6 127 124.5 1303.2 2273.4
Hennepin Avenue
United Methodist
Church
511 Groveland Ave 47 Worship Facility 164,999 71.9 68 113.5 109.4 2205.8 666.7
Huron Doubletree
University of
Minnesota
511 Huron
Boulevard SE83 Hotel 147,340 86.5 N/A 154.8 N/A 2277.4 1049.1
Blake Northrop
Collegiate School
511 Kenwood
Parkway69 K-12 School 151,904 124.5 122.3 190.9 188.6 1579.5 1593.2
517 Parking Ramp517 Marquette
AvenueN/A Parking 252,783 33.7 32.6 70.1 68.9 15.7 255.9
Groveland Terrace48, 50, 52 Groveland
Terrace65
Multifamily
Housing 118,796 83.4 78.9 118.2 112.8 2545.9 760.4
Freight Yard
Townhomes and Flats50 4th Ave N 43
Multifamily
Housing 105,416 102.3 98 160.2 155.7 2633.2 585.5
Grant Park 500 East Grant St 89Multifamily
Housing 439,683 89 83.4 106.8 101 10333 2456
Mill & Main East 501 Main Street SE 100Multifamily
Housing 323,543 33.5 32 64.6 62.4 4458.8 949.7

Property Name Address
ENERGY
STAR
Score
Primary
Property Type
Total Floor
Area
(Buildings &
Parking) (ft²)
Site EUI
(kBtu/ft²)
Weather
Normalized
Site EUI
(kBtu/ft²)
Source
EUI
(kBtu/ft²)
Weather
Normalized
Source EUI
(kBtu/ft²)
Water
Use
(kgal)
Total GHG
Emissions
(Metric Tons
CO2e)
Fred T. Heywood
Garage570 6th Avenue N N/A
Other - Public
Services 302,730 71 68.1 104.9 101.8 6227.9 1732.7
Nokomis Square
Cooperative5015 35th Ave S 98
Multifamily
Housing 340,790 50.8 49.8 84.6 83.6 4644.4 1214.4
North Building 524 23rd Ave. S N/A
Hospital
(General
Medical &
Surgical)
82,807 292 289 397.9 393.8 10551.3 1845.9
Annunciation School 525 West 54th St 8 K-12 School 145,345 135.8 131.1 175.1 170.2 1500.1 794.5
Cowles Center 528 Hennepin Ave N/A Performing Arts 119,970 77.8 75.4 150.3 147.8 2150.7 1026.1
107935 - 550 S. 4th
St.550 South 4th St 90 Office 534,292 60.9 59.3 129.9 128.3 4695.5 3999.4
Mount Olivet Homes 5517 Lyndale Ave S 41Senior Care
Community 170,275 173 170.5 282.4 279.7 7435.7 2189.5
Fred T. Heywood
Office Building560 6th Ave N 39 Office 56,000 84.8 85 237.5 238 516.6 787.8
06681-5937 Nicollet
Ave5937 Nicollet Ave 54
Supermarket/G
rocery Store 66,903 275.8 273 598.5 595.5 3538.5 2311.1
RBC Plaza60 South Sixth
Street83 Office 683,103 88 86.4 147.8 145.9 4593.5 5852
EDITION Residences 511 South 4th Street 92Multifamily
Housing 356,746 103.7 98.4 121.2 115.7 2744.4 1524.2
Target Center600 First Avenue
NorthN/A Indoor Arena 622,188 138.1 135.7 237.2 234.3 112.1 8988
Mayo Clinic Square600 Hennepin
AvenueN/A
Mixed Use
Property 462,301 199.3 194.9 394.2 384.7 12093.7 N/A

Property Name Address
ENERGY
STAR
Score
Primary
Property Type
Total Floor
Area
(Buildings &
Parking) (ft²)
Site EUI
(kBtu/ft²)
Weather
Normalized
Site EUI
(kBtu/ft²)
Source
EUI
(kBtu/ft²)
Weather
Normalized
Source EUI
(kBtu/ft²)
Water
Use
(kgal)
Total GHG
Emissions
(Metric Tons
CO2e)
Minneapolis City
Center Mall600 Nicollet Mall N/A Enclosed Mall 381,519 25.6 25.6 49.3 49.3 36.3 1106.6
The Marshall (419) 515 14th Ave SE N/AMultifamily
Housing 663,955 28.1 27.8 59.1 58.5 12466.6 1917.9
109667 - 600 S. 4th
St.600 South 4th St 85 Office 534,292 64.1 62.7 138.9 137.3 4221.3 4281.5
Loews Minneapolis
Hotel
601 1st Avenue
North77 Hotel 225,416 91.7 90.4 175 172.2 8388.2 2264
Stinson Ramp 601 Stinson N/A Parking 67,000 10.4 10 29.1 27.9 221.4 92.5
Bachmans Inc. 6010 Lyndale Ave. S. N/A Retail Store 316,563 144.1 139.5 203.7 198.9 24.7 2348.8
FIve15 On The Park 515 15th Ave S 97Multifamily
Housing 355,615 72.5 67.9 107.8 102.3 N/A 1591.4
East Building
606 24th ave s -
Fairview St Marys
Bldg
100
Hospital
(General
Medical &
Surgical)
596,511 125.5 124.2 168.6 167.1 19434.8 5626.5
Sexton Condominium 521 7th St S 82Multifamily
Housing 149,981 66.6 63.7 107.1 103.5 3574.2 903.2
MN2-25 Lyndale
Manor600 18th Avenue N 52
Multifamily
Housing 217,235 91.2 87.8 134.9 131 4954 1374.4
Oren Gateway Center 610 22nd Ave S N/AMixed Use
Property 132,500 26.8 26.4 75.1 74 3679.9 498.4
Banks Building 615 1st Ave NE 51 Office 197,421 85.7 83.6 191.5 189.8 950.3 1520.5
Minneapolis MN
TGRH
615 Second Avenue
South82 Hotel 200,500 75.8 75 143.8 142.9 11551.7 1636

Property Name Address
ENERGY
STAR
Score
Primary
Property Type
Total Floor
Area
(Buildings &
Parking) (ft²)
Site EUI
(kBtu/ft²)
Weather
Normalized
Site EUI
(kBtu/ft²)
Source
EUI
(kBtu/ft²)
Weather
Normalized
Source EUI
(kBtu/ft²)
Water
Use
(kgal)
Total GHG
Emissions
(Metric Tons
CO2e)
AJ1006 - Graduate
Hotel Minneapolis
MN
615 Washington
Avenue, SE50 Hotel 240,000 128.5 126.6 208.3 206.3 10325.4 2772.2
RPB 616 24th ave south 100 Medical Office 79,000 17.5 17.2 46.4 45.6 4884.4 216
District 600600 North 5th St.,
Street100
Multifamily
Housing 137,140 25.5 24.4 40.2 39 2911.7 236.3
Woodhaven 6045 Lyndale Ave S 98Multifamily
Housing 225,101 59.9 58.6 89.2 87.9 5277.1 794.6
The Copham607 Washington Ave
N91
Multifamily
Housing 152,113 52.7 50.8 95.7 92.7 5210.8 820.9
North Loop Campus620 Olson Memorial
Hwy90 K-12 School 80,000 51.9 48.4 71.3 67.6 1002.3 307
Foss Center 625 22nd Ave S N/AMixed Use
Property 65,000 105.2 102.9 167.6 164.9 2374.5 620.3
Thrivent Financial
Mpls
625 Fourth Avenue
SouthN/A Office 558,075 70.7 68.8 139.5 136.6 4621.6 4179.4
308 - University
Commons
609 Huron
Boulevard SE99
Multifamily
Housing 189,776 45.9 44.9 79.2 77.8 10208 841.5
Redeemer Health and
Rehab625 W. 31st St. N/A
Senior Care
Community 110,186 121.7 119.2 189.7 187.2 4800.3 899
Lindell Library 630 22nd Ave S N/A Library 70,000 131.9 128.9 235 230.7 846.6 945.7
The Station on
Washington
Apartments
616 Washington
Avenue SE82
Multifamily
Housing 126,510 58.3 56.9 127 124.7 2789.8 769.8
640 Stinson 640 Stinson Parkway N/A Office 392,602 90.1 88.7 166.4 165.1 2269 2356.5

Property Name Address
ENERGY
STAR
Score
Primary
Property Type
Total Floor
Area
(Buildings &
Parking) (ft²)
Site EUI
(kBtu/ft²)
Weather
Normalized
Site EUI
(kBtu/ft²)
Source
EUI
(kBtu/ft²)
Weather
Normalized
Source EUI
(kBtu/ft²)
Water
Use
(kgal)
Total GHG
Emissions
(Metric Tons
CO2e)
Mill City Apartments 625 N 2nd St 100Multifamily
Housing 124,479 29.1 28.7 58.7 57.6 1140 172
Excelen 700 10th Ave. South 58 Office 60,528 118.8 117.2 179.1 177.1 402 620.9
Hagfors 700 21st Ave South N/ACollege/
University 136,000 N/A N/A N/A N/A 3622.2 0
Centre Village 700 5th Ave S N/A Parking 359,382 366.8 343.7 491.4 463.6 88.3 438.1
MN2-30 Cedar
Apartments630 Cedar Avenue S 56
Multifamily
Housing 174,472 103.8 100.3 149.6 145.9 3817 1141.9
Junction Flats 643 North 5th Street 99Multifamily
Housing 265,017 61.3 59.7 98.2 96.5 4131.8 961.6
Fraser Center 700 Humboldt Ave N N/APre-school/
Daycare 58,000 84.7 81.8 134.4 131.3 618.6 430.7
700 Central700 Central Avenue
NE64
Multifamily
Housing 153,389 69.8 67 124.5 120.9 2099.3 683.2
Arrow Kenwood
Gables700 Douglas Ave 92
Multifamily
Housing 142,210 68.3 66.7 97.7 96 3064.9 568.4
Tower Lofts700 Washington Ave
N17
Multifamily
Housing 149,608 110.2 106.6 174.3 170.7 3254.3 1440
Riverside Park Plaza701 25th Avenue
South87 Medical Office 60,225 66 64.7 125.2 123.6 667.5 439.9
701 Building701 4th Avenue
South81 Office 286,596 78.3 76.7 133.2 131 1659.5 2200.3
06682-W Broadway701 W Broadway
Ave63
Supermarket/G
rocery Store 80,135 234 231.4 511.8 509.4 2906.5 2369.3
Loose Wiles 701 Washington Ave 35 Office 136,584 118.6 115.5 194.6 191.5 3.8 1476.7

Property Name Address
ENERGY
STAR
Score
Primary
Property Type
Total Floor
Area
(Buildings &
Parking) (ft²)
Site EUI
(kBtu/ft²)
Weather
Normalized
Site EUI
(kBtu/ft²)
Source
EUI
(kBtu/ft²)
Weather
Normalized
Source EUI
(kBtu/ft²)
Water
Use
(kgal)
Total GHG
Emissions
(Metric Tons
CO2e)
Baker Building706 Second Avenue
South7 Office 112,356 150.4 150.4 327.5 327.5 558.4 2168.1
Ameriprise Financial
Center
707 Second Avenue
South81 Financial Office 1,156,997 79.4 77 159.6 157.1 12228.4 8918.5
Purple Ramp 717 25th ave. N/A Parking 40,000 0.1 0.1 0.3 0.3 0 0.7
Itasca Building 708 North 1st St 86 Office 128,002 46 45.2 102.3 101.4 3976.9 102.7
Canopy By Hilton 708 Third St south N/A Hotel 147,000 N/A N/A N/A N/A N/A N/A
Mill City Owners
Association710 2nd St S 47 Office 119,155 137.1 133.9 226.1 222.8 1504.8 1498.3
Elysian 711 4th street se N/A
Other -
Lodging/
Residential
97,700 292551.3 282111.5 512473.9 501531.3 N/A 287.6
711 Hennepin 711 Hennepin Ave N/AMixed Use
Property 101,000 N/A N/A N/A N/A 1554.5 N/A
700 on Washington 1700 Washington Ave
SE99
Multifamily
Housing 160,891 39.4 39.2 85.4 84.9 3889.3 713.2
Luther Hall 715 20th Ave S 84Residence
Hall/Dormitory 87,780 68 65.4 120.7 118 2984.5 448
Melby Hall 715 23rd Ave S N/A
Fitness
Center/Health
Club/Gym
61,800 N/A N/A N/A N/A 2712.2 N/A
Bethlehem Baptist
Church720 13th Ave S N/A Worship Facility 73,986 59.2 57.7 102.6 101.1 527.4 425.2
Christensen Center 720 22nd Ave S N/ASocial/ Meeting
Hall 62,500 N/A N/A N/A N/A 2627.3 N/A

Property Name Address
ENERGY
STAR
Score
Primary
Property Type
Total Floor
Area
(Buildings &
Parking) (ft²)
Site EUI
(kBtu/ft²)
Weather
Normalized
Site EUI
(kBtu/ft²)
Source
EUI
(kBtu/ft²)
Weather
Normalized
Source EUI
(kBtu/ft²)
Water
Use
(kgal)
Total GHG
Emissions
(Metric Tons
CO2e)
Radius at 15th 701 15th Ave SE 100Multifamily
Housing 382,389 32.1 31.1 52.4 51.3 7630.5 942
Uptown Lake
Apartments
714 & 1220 West
Lake Street100
Multifamily
Housing 193,192 47.4 45 74 71.1 4577.6 787.9
Walker Art Center 721 Vineland Place N/A Museum 286,000 149.9 146.9 267.3 264.2 8000.7 3550.1
724 Office Associates 724 1st Street N 86 Office 57,680 50 48.6 95.1 93.6 829.3 311.6
Mpls Club 729 Second Ave. N/AMixed Use
Property 208,232 202.3 198.5 324 318.5 7384.3 N/A
730 Building730 Second Avenue
South93 Office 409,505 60.6 60.6 83.2 83.2 2860.8 1598.4
St. Anthony Mills720 Washington
Avenue SouthN/A
Multifamily
Housing 104,000 37.2 36.3 58.1 57.3 4237 333.2
Borealis 721 N. 1st St 100Multifamily
Housing 195,566 38.8 37 71.9 69.4 2778.8 595.5
Investors Building733 Marquette
Avenue SouthN/A Office 424,583 33.7 33.7 49.1 49.1 3540.7 1215
CW Lofts 730 Stinson Blvd 32Multifamily
Housing 175,551 103.9 100.4 156.2 152.7 5220.5 1245
ElseWareHouse730 Washington Ave
N83
Multifamily
Housing 170,098 53.8 51.6 102.7 100.4 5314.4 992.4
LaSalle Court Parkiing
Ramp801 LaSalle Avenue N/A Parking 250,000 8 7.9 22.3 22.2 N/A 330.1
Richfield Lutheran
Church8 60th St W 50 Worship Facility 122,640 59.6 57.7 81 79 545.5 263.8
Portland Tower 740 Portland Ave 76Multifamily
Housing 200,075 77.5 74.5 124.6 121.5 3396.1 1381

Property Name Address
ENERGY
STAR
Score
Primary
Property Type
Total Floor
Area
(Buildings &
Parking) (ft²)
Site EUI
(kBtu/ft²)
Weather
Normalized
Site EUI
(kBtu/ft²)
Source
EUI
(kBtu/ft²)
Weather
Normalized
Source EUI
(kBtu/ft²)
Water
Use
(kgal)
Total GHG
Emissions
(Metric Tons
CO2e)
IDS Center80 South Eighth
StreetN/A
Mixed Use
Property 2,463,406 102.1 100.6 173 171.3 25517.2 22577.1
Humboldt Lofts 750 2nd St S 8Multifamily
Housing 102,771 100.7 95.8 167.5 162.5 1639.9 958.4
Abbott Northwestern -
Hospital800 E 28th St. 42
Hospital
(General
Medical &
Surgical)
1,560,501 263.4 261.1 416.7 414.2 60985.1 35637.8
LaSalle Plaza 800 LaSalle Ave. 77 Office 934,285 93.5 91.4 172.3 169.7 7515.1 7812.2
US Bancorp Center 800 Nicollet Mall 79 Office 1,201,720 70.8 68.9 156.4 153.6 11131 9730.1
The Julia Apartments 80 Broadway St NE 100Multifamily
Housing 113,009 42.1 40.2 80.6 77.6 1790.7 447.1
TractorWorks Building800 Washington
Avenue N91 Office 382,374 33 32.7 90.1 89.6 63.5 2035
Corporate 801 12th Ave N 82 Office 98,712 58.3 56.4 111.3 109 1203.5 402.9
Mortensen Hall 801 21st Ave S 80Residence
Hall/Dormitory 100,764 87.4 85.5 131.9 129.7 3019.3 750.4
Urness Hall 801 21st Ave S 85Residence
Hall/Dormitory 78,800 86.1 83.6 131.5 128.4 2311 585.8
Third North 800 North 3rd St 68Multifamily
Housing 139,430 64.7 62.9 139.8 136 3462.2 1124.5
801 Washington 801 Washington Ave 77Multifamily
Housing 129,914 53.3 50.3 83.1 79.5 1739.7 595.1
811 LaSalle 811 LaSalle Ave 1 Office 76,000 141085.9 135331.6 169810.9 162887.9 N/A 578321.6
Hospital Parking
Ramp
814 Ninth Street
SouthN/A Parking 353,080 54.1 53.8 127.3 126.6 151.9 183.4
Thornton Place
Apartments
810 Thornton Street
SE77
Multifamily
Housing 120,028 82.3 78.6 123.3 118.3 2916 648

Property Name Address
ENERGY
STAR
Score
Primary
Property Type
Total Floor
Area
(Buildings &
Parking) (ft²)
Site EUI
(kBtu/ft²)
Weather
Normalized
Site EUI
(kBtu/ft²)
Source
EUI
(kBtu/ft²)
Weather
Normalized
Source EUI
(kBtu/ft²)
Water
Use
(kgal)
Total GHG
Emissions
(Metric Tons
CO2e)
Dunwoody 818
Building818 Dunwoody Blvd N/A
Vocational
School 475,776 101.2 98.8 171.9 169.3 2027.5 2167.6
Guthrie Theater 818 S. 2nd Street N/A Performing Arts 231,642 102.6 102.6 275.6 275.6 N/A 3767
W Minneapolis - The
Foshay - 42SRG821 Marquette Ave. 2 Hotel 242,879 174.3 171.7 311.5 308.2 6979 3550.6
Medical Arts Building 825 Nicolette Mall 70 Medical Office 299,253 138.5 136.2 205.9 203.2 4605.2 3745
Parkside Professional
Center825 S 8th St 24 Office 176,529 157.6 154.8 219.4 216.5 1962.7 2090.5
The Kenwood
Retirement
Community
825 Summit Avenue
South29
Senior Care
Community 265,000 66.6 65 100.9 99.3 6557.8 1216.9
HQ Apartments 816 Portland Ave S N/AMultifamily
Housing 293,300 14.1 13.8 27.6 26.9 8242.2 462.3
Essex 84 S 10th Street 55 Office 66,300 75.7 75.1 154.5 153.8 2846 595.9
Westin Minneapolis 88 6th Street 65 Hotel 208,442 109.9 108.3 194.3 192.6 6770 2275.9
Wcco-TV 90 South 11th Street N/A Office 100,000 124 123.1 284.3 283.3 1425.8 1664.9
900 Parking Ramp900 Washington
Avenue NorthN/A Parking 226,384 3.4 3.3 9.4 9.2 15 101.1
Wells Fargo Center 90 South 7th Street 84 Office 1,497,930 49 47.5 116.4 113.7 8468 9155.6
MN2-33 Spring Manor 828 Spring Street NE 75Multifamily
Housing 141,443 95.7 91.7 136.2 132.1 3341 910.6
Forum 900 2nd Ave S 900 2nd Ave S 83 Office 458,699 62 60.6 146.6 145.1 4486.6 3127.1

Property Name Address
ENERGY
STAR
Score
Primary
Property Type
Total Floor
Area
(Buildings &
Parking) (ft²)
Site EUI
(kBtu/ft²)
Weather
Normalized
Site EUI
(kBtu/ft²)
Source
EUI
(kBtu/ft²)
Weather
Normalized
Source EUI
(kBtu/ft²)
Water
Use
(kgal)
Total GHG
Emissions
(Metric Tons
CO2e)
Salvation Army 900 4th St N N/A
Other -
Lodging/
Residential
130,000 84.3 79.6 123.7 118.9 2281.6 876.9
MPLS NICOLLET MALL
(1375)900 NICOLLET MALL 35 Retail Store 159,193 88.5 87.5 224.2 223.1 N/A 2081.1
NineTen LaSalle Ramp 910 LaSalle Ave N/A Parking 180,000 13.6 N/A 24.3 N/A N/A 197
Aloft Hotel-Sherman
Associates
900 Washington Ave
S71 Hotel 93,910 73 71.2 177 172.1 3128.5 906.8
The Metro
Apartments90 South 9th St N/A
Multifamily
Housing 314,835 126 124.1 201.1 199.1 6570.6 1520
Dinnaken House900 Washington Ave
SE91
Multifamily
Housing 139,965 63.7 62.5 106.1 104.9 6608 826.8
Zenith Condominiums 901 2nd St S 21Multifamily
Housing 110,325 106.8 103.7 158.7 155.5 1789.9 956.7
Ameriprise Client
Service Center901 3rd Ave. South 88 Financial Office 1,266,005 59.2 57.9 130 128.4 10155.7 7435.7
Le Meridien
Chambers - 08SYR901 Hennepin Ave 1 Hotel 73,439 246.9 240.1 374 366 7750 1554.1
ATT Tower 901 Marquette Ave 93 Office 751,583 47.6 46.5 111.3 110.2 4496.2 4439.5
Young Quinlan
Building901 Nicollet Mall 90 Office 329,540 63.5 62.3 108 106.6 890 N/A
Bassett Creek
Business Center901 North 3rd St 91 Office 270,837 48.3 46.6 91.3 88.9 1644.4 1220.4
0300 910 Medical
Place910 East 26th St 69 Medical Office 61,609 73.2 71.2 168 165.5 561.6 606.1

Property Name Address
ENERGY
STAR
Score
Primary
Property Type
Total Floor
Area
(Buildings &
Parking) (ft²)
Site EUI
(kBtu/ft²)
Weather
Normalized
Site EUI
(kBtu/ft²)
Source
EUI
(kBtu/ft²)
Weather
Normalized
Source EUI
(kBtu/ft²)
Water
Use
(kgal)
Total GHG
Emissions
(Metric Tons
CO2e)
Miller Hall 910 Elliot Ave N/ACollege/
University 117,144 56.3 56.3 90.2 90.2 1794.9 585
Orpheum Theatre 910 Hennepin Ave. N/A Performing Arts 75,036 115.1 111.7 192.1 188 809.4 831.4
Mar Ten Parking
Ramp
921 Marquette
AvenueN/A Parking 461,314 65.8 63.7 90.1 87.7 143.7 369
Carlson Hall 916 E. 15th St. N/ACollege/
University 80,914 119.6 115.9 172.8 169 2711.7 760.3
Central Avenue Lofts-
Sherman Associates
920 24th Avenue
Northeast94
Multifamily
Housing 115,183 59.8 57.9 107 105 7785 418.1
Forum 920 2nd Ave. 920 2nd Ave. South 77 Office 375,120 76.3 74.6 165.9 162.9 4570.8 2966.8
Argyle House920 Delaware Street
SE4
Multifamily
Housing 131,815 109.7 107.6 194.4 192.2 5185.3 1440.4
0240 Minnesota
Heart Institute920 E. 28th St. 58 Medical Office 75,798 107.6 106 203 201.2 569 888.7
Skyscape 929 Portland Ave N/AMultifamily
Housing 332,682 114.8 111 195.5 191.5 9426.8 3634.5
The Bridges930 University Ave
SE100
Multifamily
Housing 358,046 32.1 31.5 66.5 65.3 8234 1156.5