- show topography or using elevation contour lines Topic: Topographic Maps.
Upload
marilyn-allisonCategory
view
220download
0
Topographic maps show….--USGS:
Uses for topographic maps…------
Contour lines are….---Contour intervals:--
Slope can be calculated Using the formula …..BM:
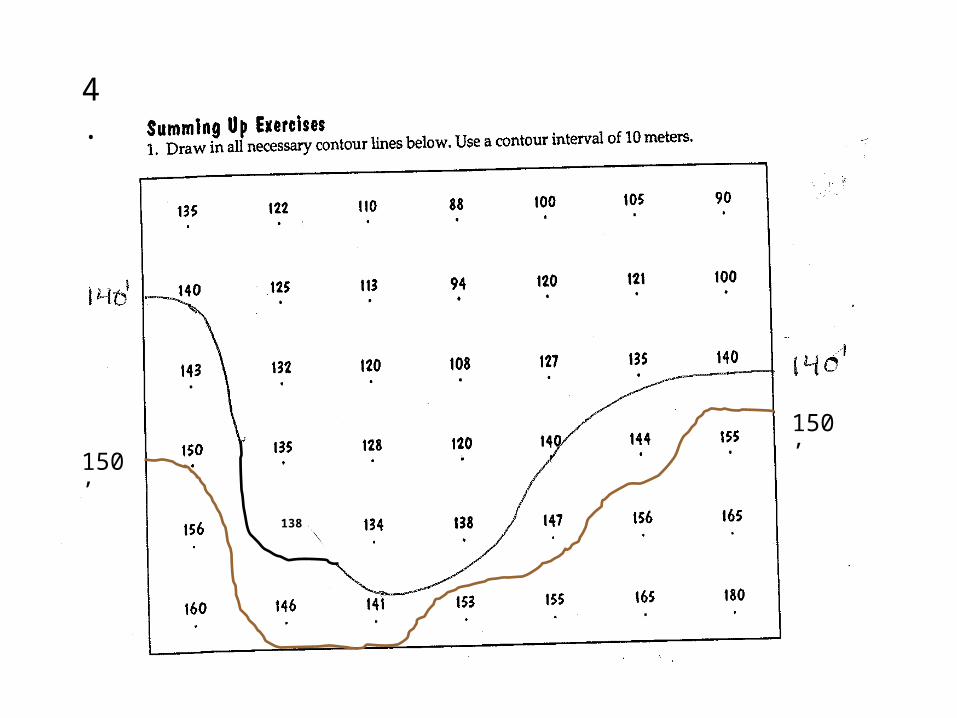
DIRECTIONS: Read pp 53-57 on topographic maps in your text book and complete the boxes below.

Topographic MapsTOPOGRAPHIC TOPOGRAPHIC MAPSMAPS
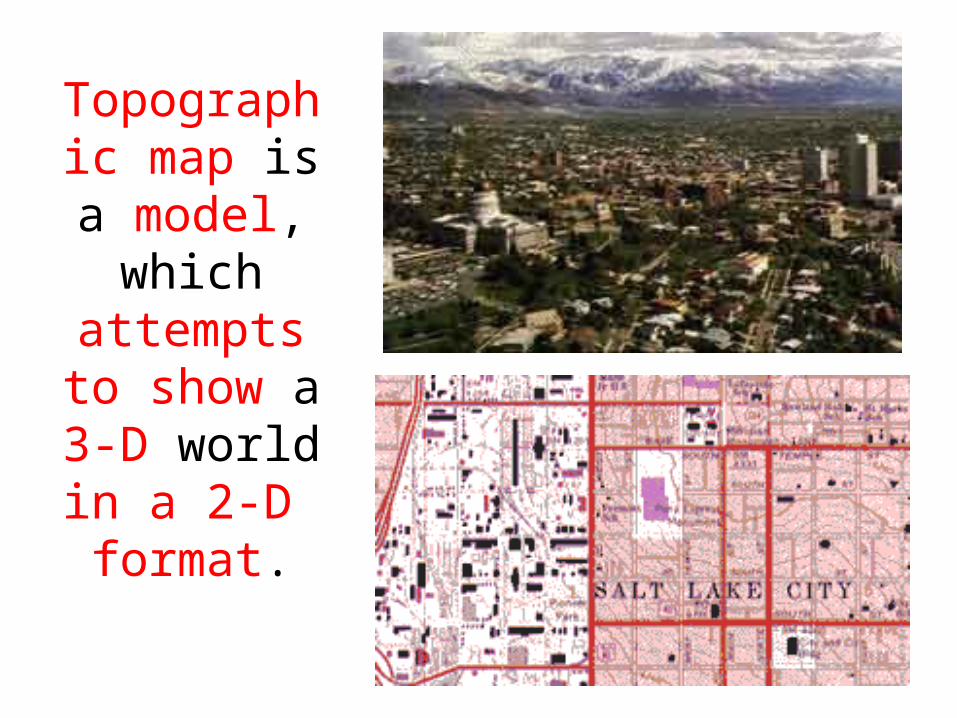
Topographic map is a
model, which attempts to show a 3-D
world in a 2-D format.

A flat picture can look 3-D using shading or color

Topographic Map History
• In the 1870’s, the U. S. Geological Survey (U.S.G.S.) began making topographic maps
• The goal was to provide complete topographic map coverage of the U.S.
• more than 54,000 maps have been made – entire area of the 48 contiguous States and
Hawaii.
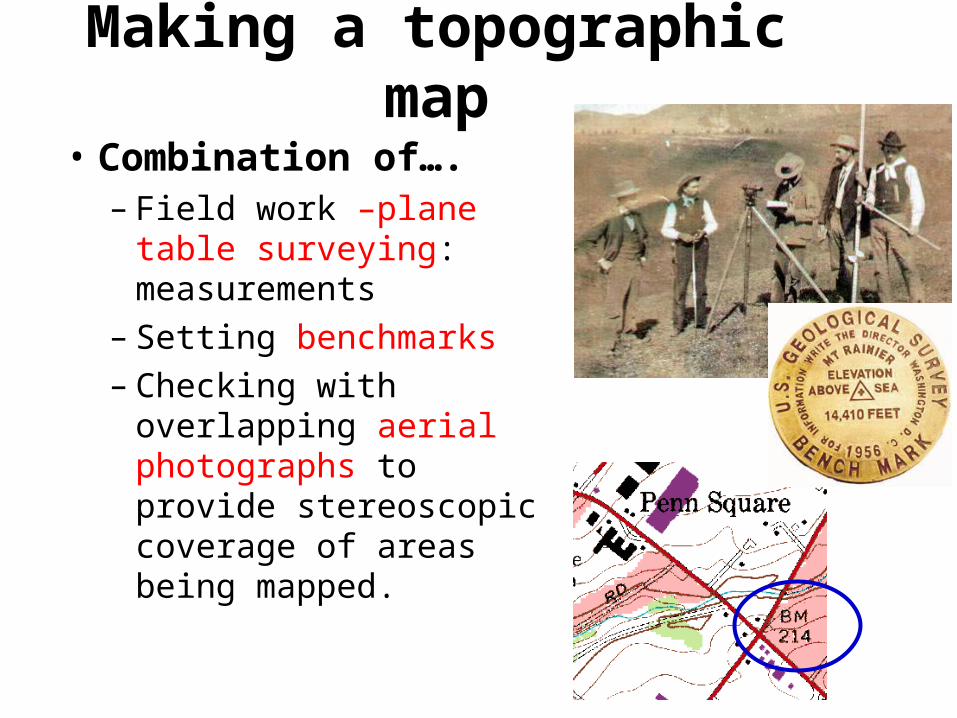
Making a topographic map
• Combination of….– Field work –plane table
surveying: measurements– Setting benchmarks– Checking with
overlapping aerial photographs to provide stereoscopic coverage of areas being mapped.
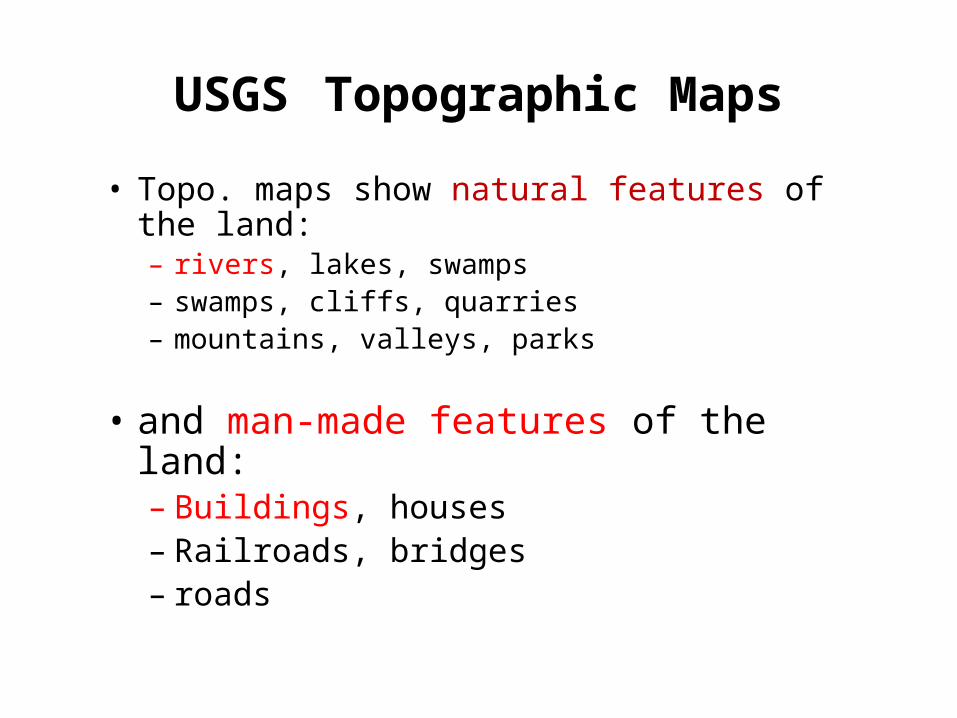
USGS Topographic Maps
• Topo. maps show natural features of the land: – rivers, lakes, swamps– swamps, cliffs, quarries– mountains, valleys, parks
• and man-made features of the land:– Buildings, houses – Railroads, bridges – roads

Topographic map Symbols / Key Appendix Text book page 697


Natural features

Bathymetric or Water features
Topographic maps are used for…
• engineering, • energy exploration,• natural resource conservation,• environmental management,• public works design, • commercial and residential planning, and• hiking, camping, and fishing
Because engineers, highway officials, land use planners, and other professionals use USGS topographic maps as tools, map accuracy is vital. Dependable maps are also important to campers, hikers, and outdoorsmen.

On a contour map, topography is shown as a series of curved brown lines called CONTOUR LINES
Is the land FLAT or HILLY?

Contour Lines
• Show the shape of the Earth's surface.
• the terrain / topography.
• Show the high and low areas: relief
• Show the elevation of land – measure the height of mountains,– depths of depressions and the ocean floor – steepness of slopes.

Contour Lines• Are a type of “isolines” prefix iso- means same• Always brown for land or blue for water• They are always closed loops that don’t cross.
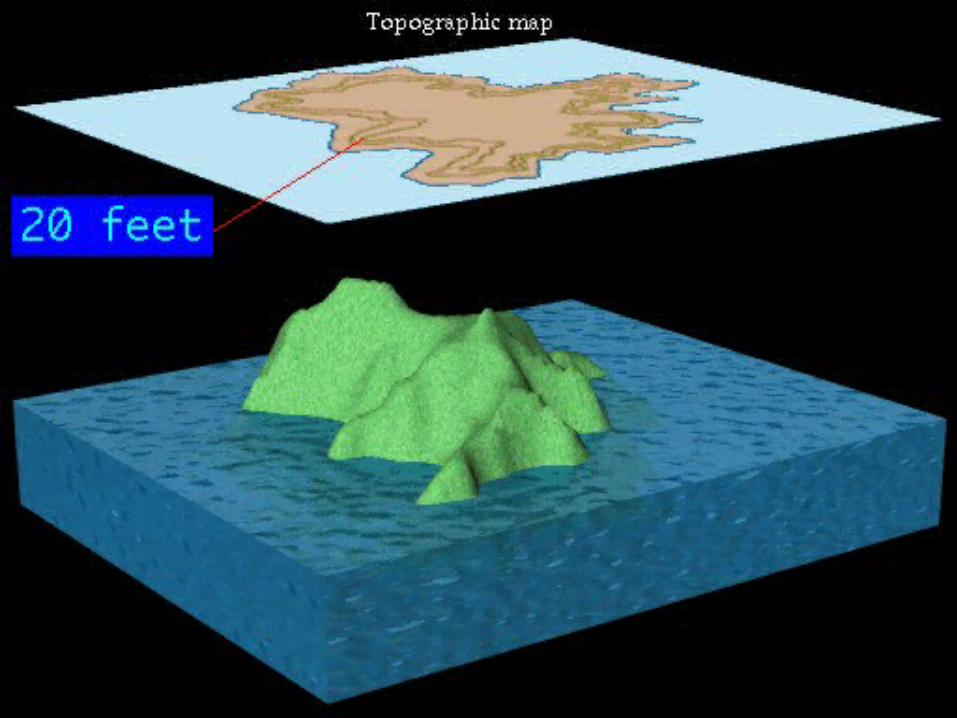
• They connect points of the same height above sea level.
• example, a 20 foot contour line connects all places on the land that are exactly 20 feet above sea level.
20
20
20
20

Profile view
Overhead or bird’s-eye view

Match the contour map with the profile of the land
B
E
D
C
F
A

Very close contour lines
Show very steep slope
If the contour lines are ….
very far apart – not closely spaced.
The land is very flat here.

Contour Interval
• This is the vertical distance between adjacent contour lines.
• Most topographic maps have a contour interval of 20 feet or 40 feet
(100 feet in very steep terrain, like mountains,
5 or 10 feet in flat terrain, like farmland)

What is the contour interval on this map?
Each line represents 20feet of elevation
X

Index contours: dark, numbered contour lines
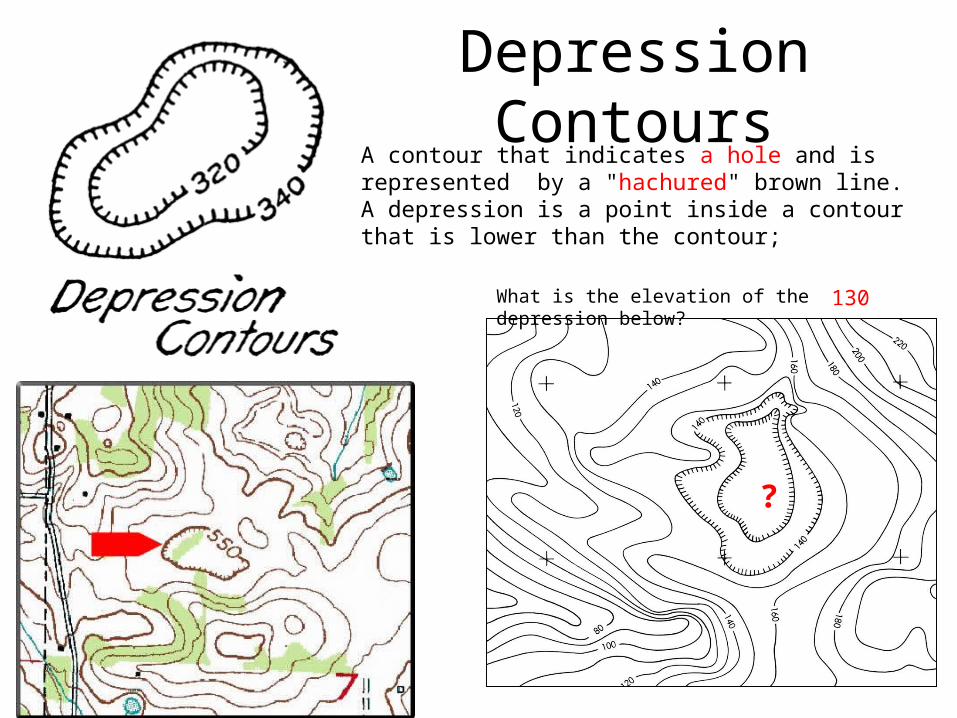
Depression ContoursA contour that indicates a hole and is represented by a "hachured" brown line. A depression is a point inside a contour that is lower than the contour;
?
What is the elevation of the depression below? 130
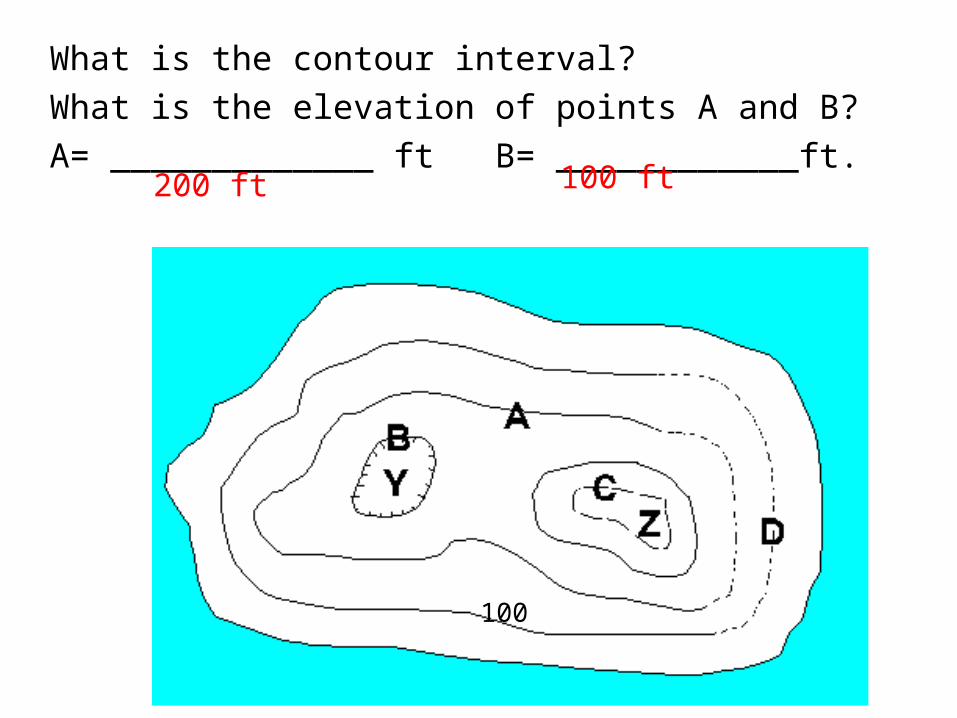
What is the contour interval?
What is the elevation of points A and B?
A= _____________ ft B= ____________ft.
100
200 ft 100 ft

Contour lines form a “V” and bend upstream when they cross a river or stream.
The contour lines bend uphill toward the source of the river.

So far….You should know..
• What a topographic maps is• How to draw and interpret contour lines, • How to determine contour interval, index contour• See slope by the spacing of contour lines• Understand map symbols and colors• Use a map scale to measure distance• Find the source of river flow by the direction that
contour lines bend.
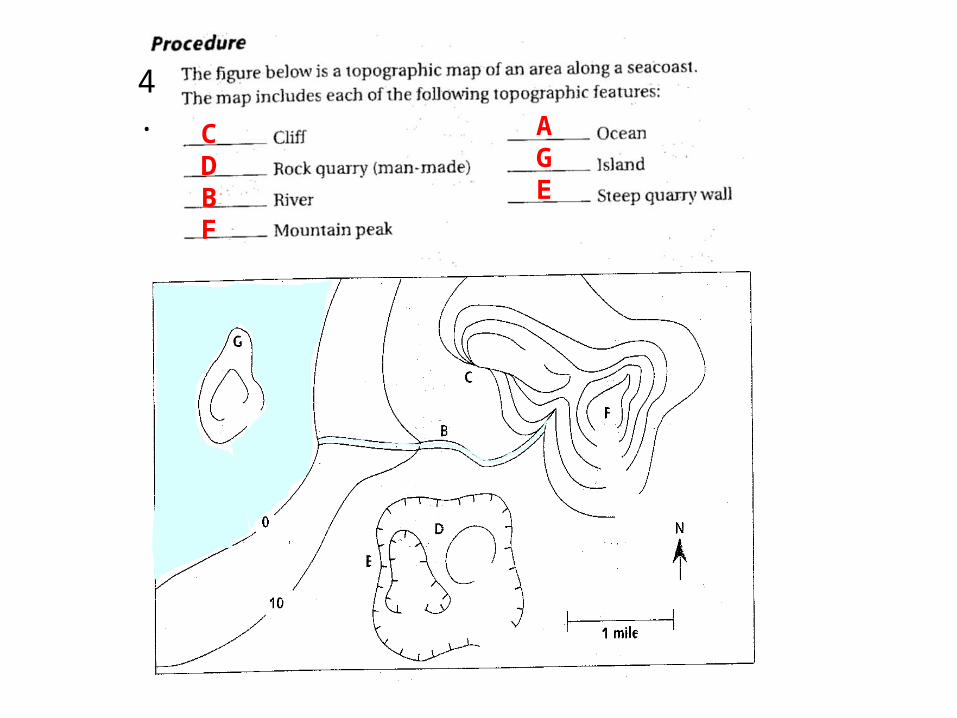
4.
CDBF
AGE

of 20 ft. 3.

552
D E
138
150’
4.
150’

5.

5.

SLOPE can be determined by the spacing of the contour lines.
But how STEEP is the slope of the terrain?

Finding the Slope or gradient of the terrain on a topographic map.
Slope = Elevation between two points
distance between two points
Slope = Rise
Run

Rise (elevation) = 3900 metersRun (distance) = 5 km
What is the Slope = ?????
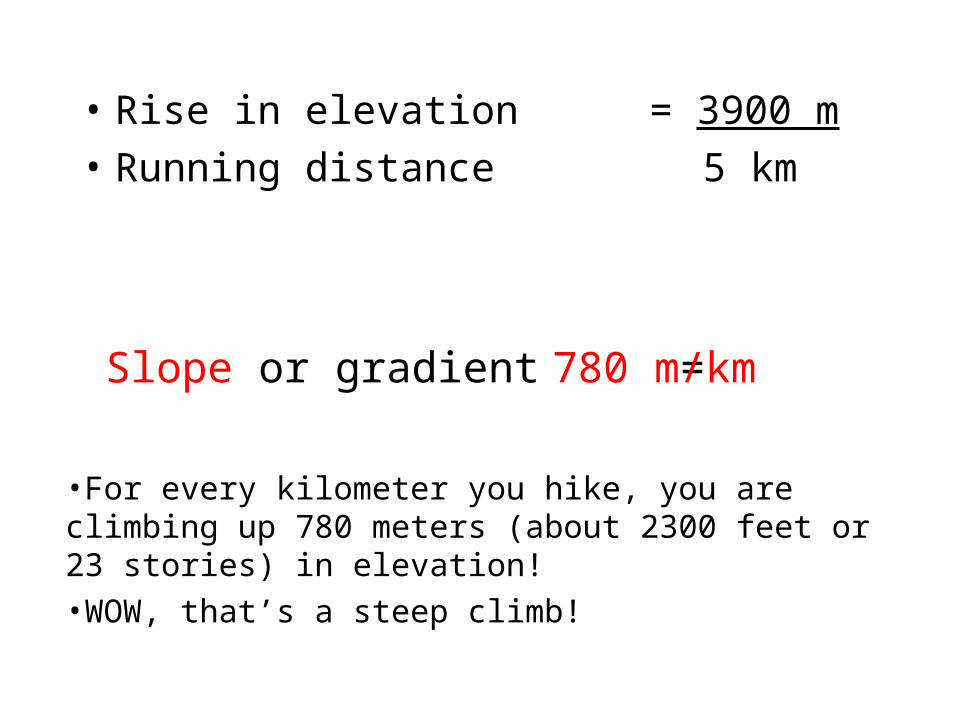
• Rise in elevation = 3900 m
• Running distance 5 km
Slope or gradient =
•For every kilometer you hike, you are climbing up 780 meters (about 2300 feet or 23 stories) in elevation!
•WOW, that’s a steep climb!
780 m/km
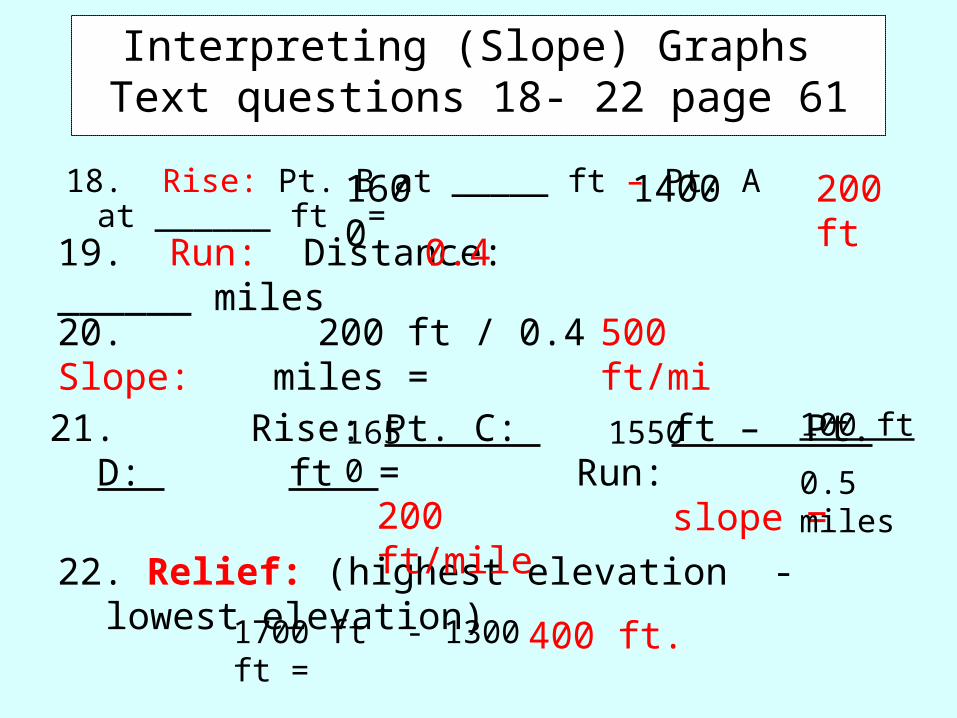
Interpreting (Slope) Graphs Text questions 18- 22 page 61
18. Rise: Pt. B at _____ ft – Pt. A at ______ ft =
19. Run: Distance: ______ miles
200 ft / 0.4 miles =
21. Rise: Pt. C: ft – Pt. D: ft = Run:
slope =
22. Relief: (highest elevation - lowest elevation)
200 ft
0.4
500 ft/mi
200 ft/mile
400 ft. 1700 ft - 1300 ft =
20. Slope:
100 ft
0.5 miles
1600 1400
1650 1550

What would the profile of this land feature look like from A to B?
A B
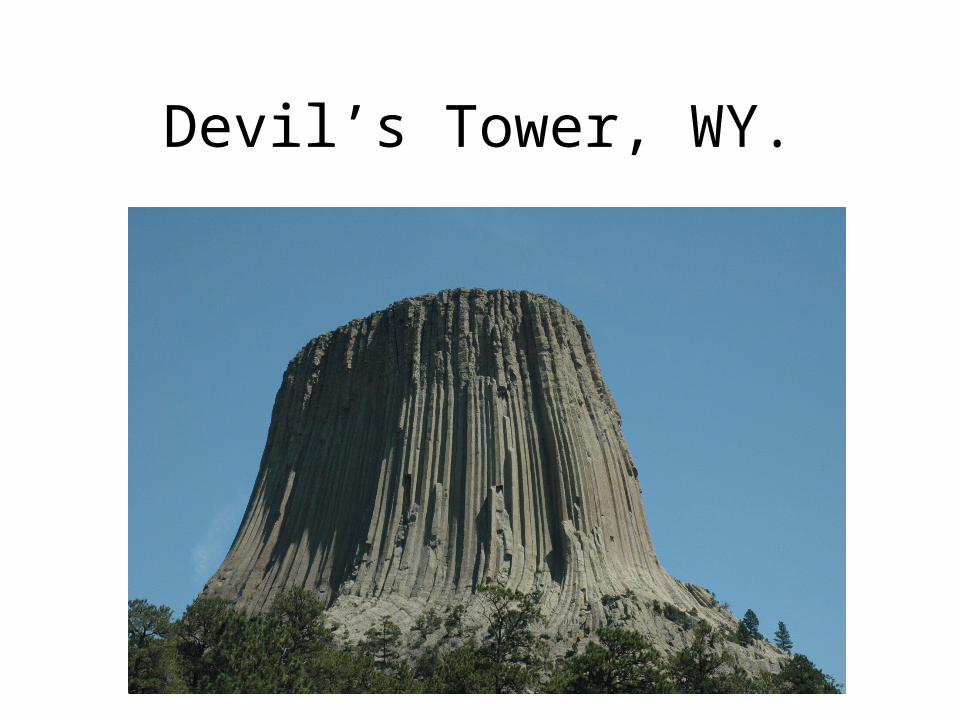
Devil’s Tower, WY.
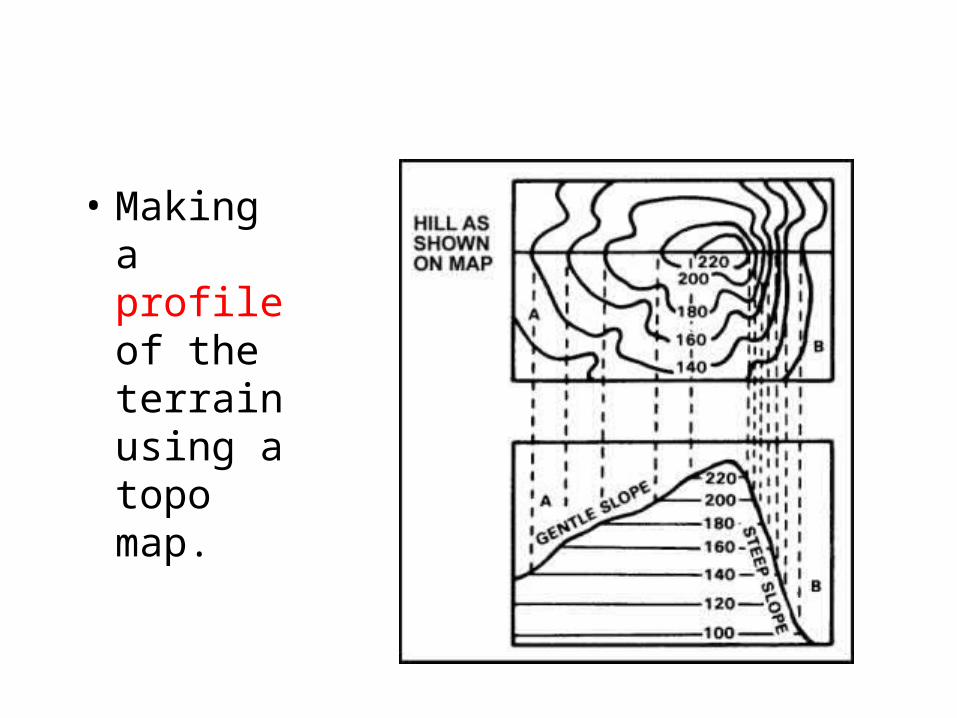
• Making a profile of the terrain using a topo map.

Every contour line from point A to point A’needs to be plotted as a data point on a that shows elevation

Every contour line from point A to point A’needs to be plotted as a data point on a that shows elevation


Before the 1980 eruption
After the eruption
The summit and side has been blown away.

A portion of the side of the mountain was “blown away”
leaving the mountain less steep.
Flatter terrain then before.
*Construct the profile activity
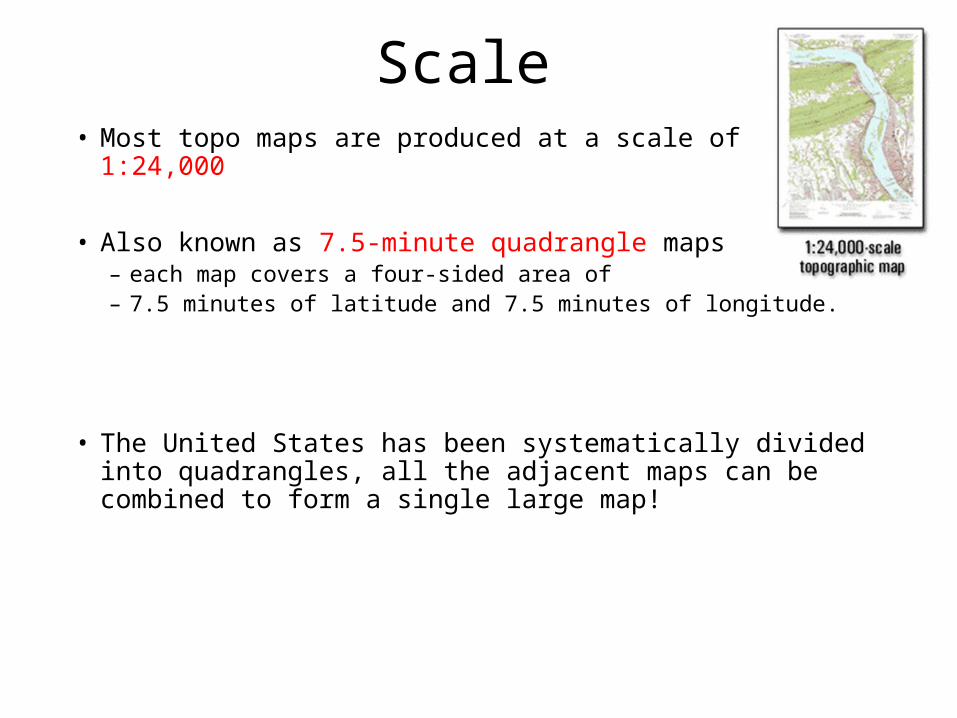
Scale• Most topo maps are produced at a scale of 1:24,000
• Also known as 7.5-minute quadrangle maps– each map covers a four-sided area of – 7.5 minutes of latitude and 7.5 minutes of longitude.
• The United States has been systematically divided into quadrangles, all the adjacent maps can be combined to form a single large map!
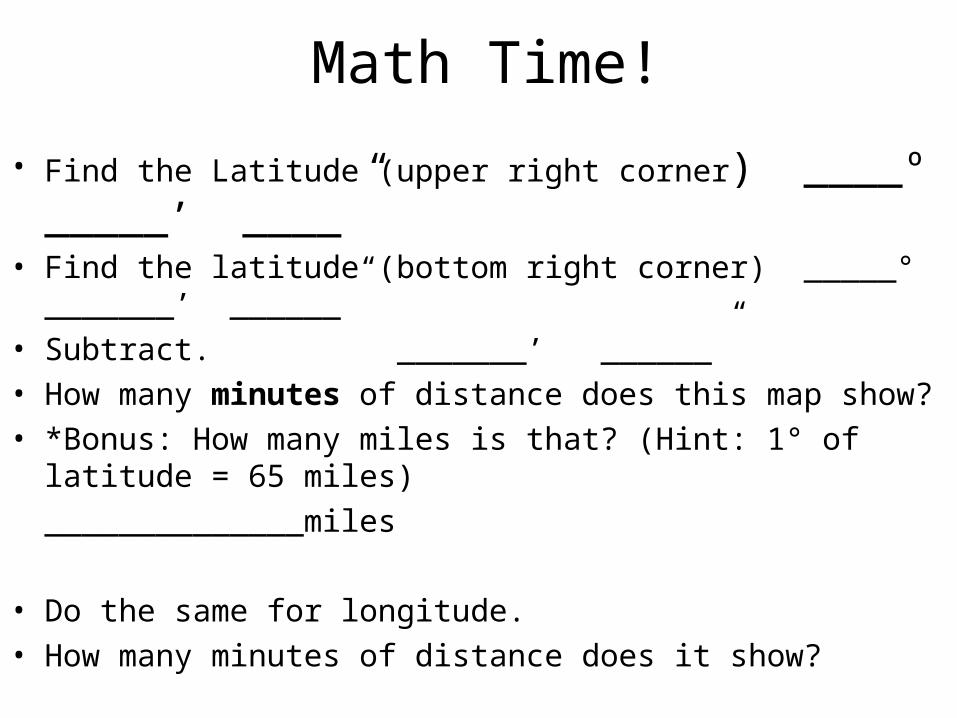
Math Time!
• Find the Latitude (upper right corner) ____º _____’ ____”• Find the latitude (bottom right corner) _____° _______’ ______”
• Subtract. _______’ ______”
• How many minutes of distance does this map show?
• *Bonus: How many miles is that? (Hint: 1° of latitude = 65 miles)
______________miles
• Do the same for longitude.
• How many minutes of distance does it show?

Alaskan Scale
• Because of its LARGE land area and sparse population, the primary scale for mapping Alaska is 1:63,360 (1 inch = 1 mile).
• Each Alaska quadrangle map covers
15 minutes of latitude and longitude• There are 2,700 maps in the Alaska 15-minute quadrangle
series.