Top Challenges Performance Engineers Face in 2013
14
January 20 13
Transcript of Top Challenges Performance Engineers Face in 2013

7/27/2019 Top Challenges Performance Engineers Face in 2013
http://slidepdf.com/reader/full/top-challenges-performance-engineers-face-in-2013 1/14
January 2013
7/27/2019 Top Challenges Performance Engineers Face in 2013
http://slidepdf.com/reader/full/top-challenges-performance-engineers-face-in-2013 2/14
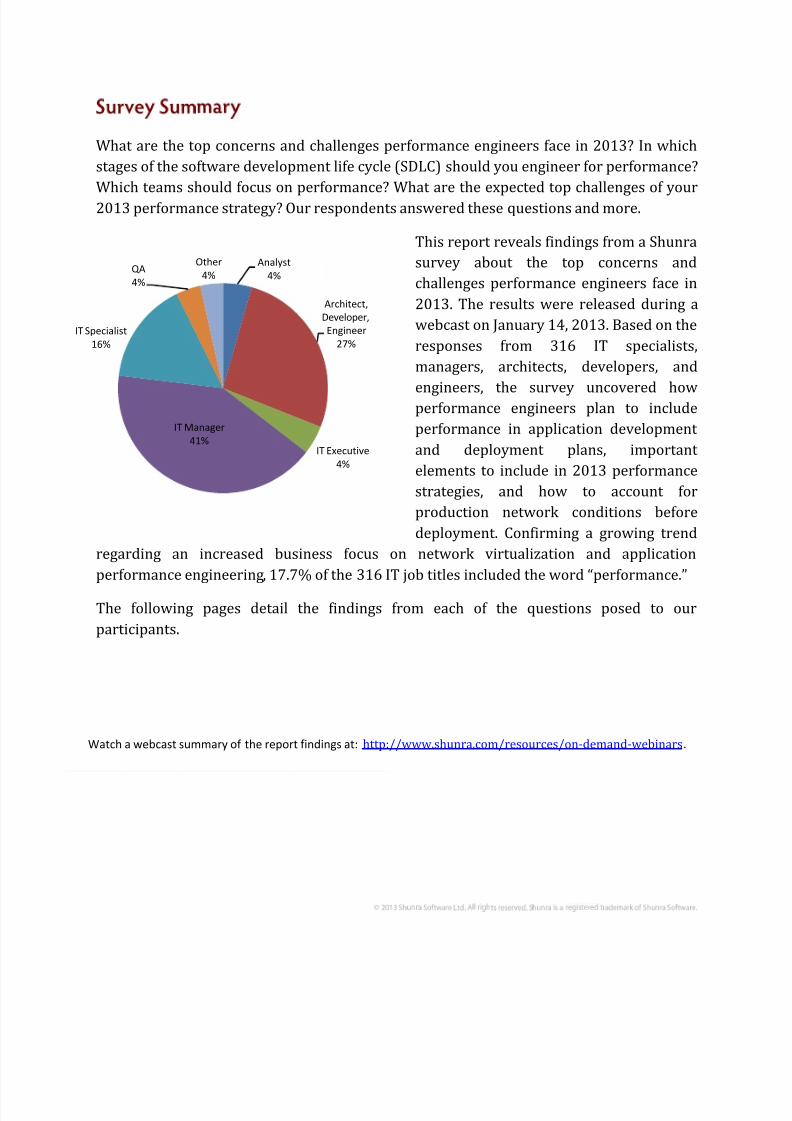
What are the top concerns and challenges performance engineers face in 2013? In which
stages of the software development life cycle (SDLC) should you engineer for performance?
Which teams should focus on performance? What are the expected top challenges of your
2013 performance strategy? Our respondents answered these questions and more.
This report reveals findings from a Shunra
survey about the top concerns and
challenges performance engineers face in
2013. The results were released during a
webcast on January 14, 2013. Based on the
responses from 316 IT specialists,
managers, architects, developers, and
engineers, the survey uncovered howperformance engineers plan to include
performance in application development
and deployment plans, important
elements to include in 2013 performance
strategies, and how to account for
production network conditions before
deployment. Confirming a growing trend
regarding an increased business focus on network virtualization and application
performance engineering, 17.7% of the 316 IT job titles included the word “performance.”
The following pages detail the findings from each of the questions posed to our
participants.
Analyst
4%
Architect,
Developer,
Engineer
27%
IT Executive
4%
IT Manager
41%
IT Specialist
16%
QA
4%
Other
4%
Watch a webcast summary of the report findings at: http://www.shunra.com/resources/on-demand-webinars.
7/27/2019 Top Challenges Performance Engineers Face in 2013
http://slidepdf.com/reader/full/top-challenges-performance-engineers-face-in-2013 3/14
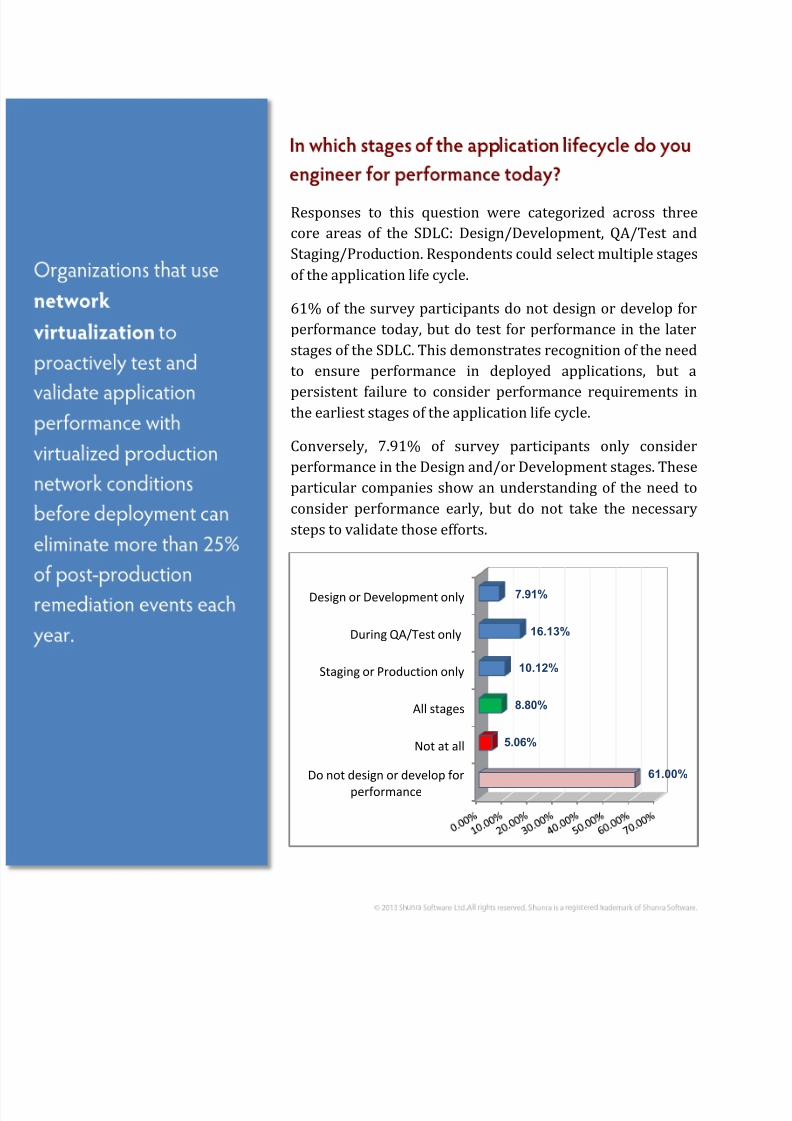
Responses to this question were categorized across three
core areas of the SDLC: Design/Development, QA/Test and
Staging/Production. Respondents could select multiple stages
of the application life cycle.
61% of the survey participants do not design or develop for
performance today, but do test for performance in the later
stages of the SDLC. This demonstrates recognition of the need
to ensure performance in deployed applications, but a
persistent failure to consider performance requirements inthe earliest stages of the application life cycle.
Conversely, 7.91% of survey participants only consider
performance in the Design and/or Development stages. These
particular companies show an understanding of the need to
consider performance early, but do not take the necessary
steps to validate those efforts.
Do not design or develop for
performance
Not at all
All stages
Staging or Production only
During QA/Test only
Design or Development only
61.00%
5.06%
8.80%
10.12%
16.13%
7.91%

7/27/2019 Top Challenges Performance Engineers Face in 2013
http://slidepdf.com/reader/full/top-challenges-performance-engineers-face-in-2013 4/14
Only 8.8% of companies surveyed showed the maturity to consider performance
throughout the entire SDLC.
Less than 10% of companies surveyed have made performance a policy and built
performance into their development and deployment best practices. This represents a
significant and costly gap which is demonstrated by recent media and research indicatingthat applications continue to fail to live up to end user expectations.
Application performance is the number one factor impacting application success and end
user adoption. It also remains the number one cost when it comes to developing, managing
and maintaining applications.
When asked when performance is
considered in different types of testing, not surprisingly, load
testing was most frequently
selected. However, demonstrating
the growing trend to incorporate
performance throughout testing
methodologies, over 90% consider
performance in at least two
different test types.
Of concern, especially consideringthe impact of performance on
mobile app users, is that less than half of survey participants consider performance with
functional testing. Traditional testing methodologies are incomplete if conditions affecting
application performance are not incorporated. They do not account for the dynamic nature
of today’s global networks, and are therefore not reflective of real end-user experience,
thus accounting for the large number of applications that fail in production but “work ed
fine” in test .
For example, load testing in a pristine test environment will provide some insight into
system scalability, but without an understanding of the network conditions experienced by
different (virtual) user groups, assumptions made regarding capacity requirements will be
misleading, as will test results. If one of these virtual user groups is a mobile audience, it is
28.20%
42.70%
83.90%
75.30%
Single unit test
Functional testing
Load testing
Capacity/Scalability
7/27/2019 Top Challenges Performance Engineers Face in 2013
http://slidepdf.com/reader/full/top-challenges-performance-engineers-face-in-2013 5/14
imperative to account for the longer mobile user sessions that result from the inherent
latency of mobile networks and how system resources will be affected.
In the same manner, functional testing in a pristine test environment is not indicative of
how a user will experience an application or website. Functional test results may confirm
that button A leads to transaction B, but if that transaction takes 30 seconds or longer inthe real world due to network constraints, end users may not wait long enough to see the
results. Performance thresholds must be set, and violations of those thresholds should be
considered a functional fail.
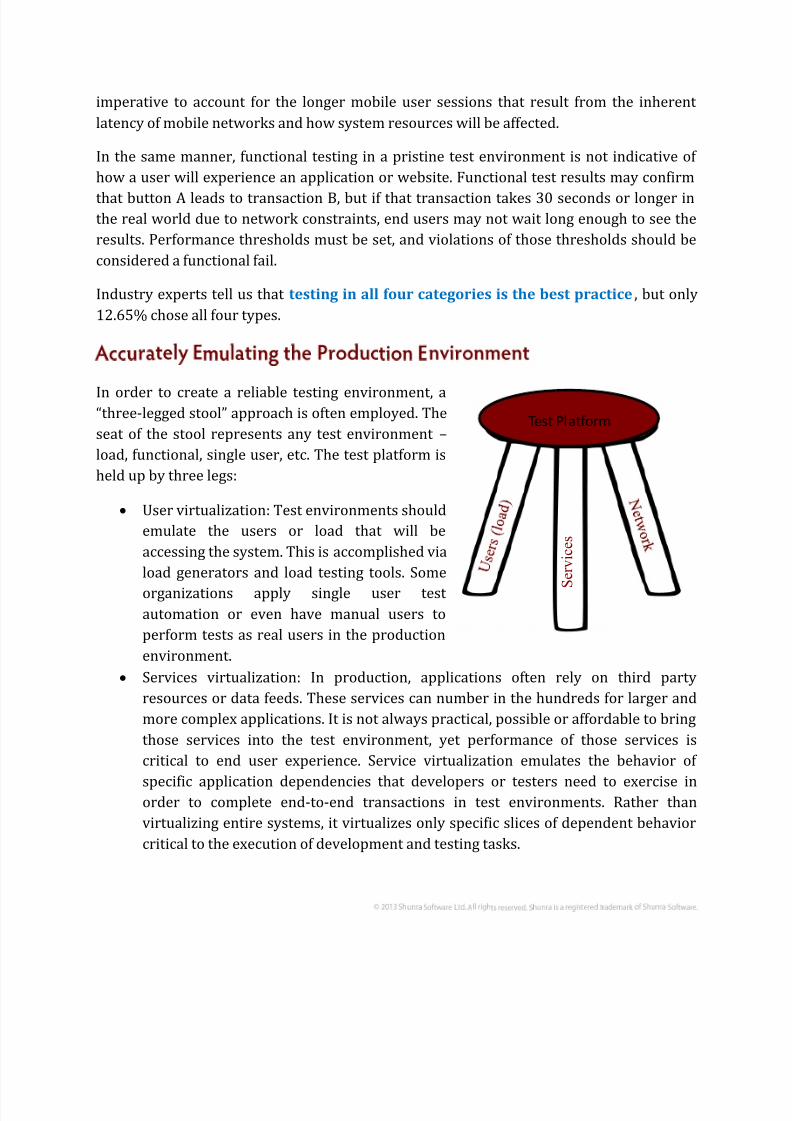
Industry experts tell us that testing in all four categories is the best practice, but only
12.65% chose all four types.
In order to create a reliable testing environment, a“three-legged stool” approach is often employed. The
seat of the stool represents any test environment –
load, functional, single user, etc. The test platform is
held up by three legs:
User virtualization: Test environments should
emulate the users or load that will be
accessing the system. This is accomplished via
load generators and load testing tools. Some
organizations apply single user test automation or even have manual users to
perform tests as real users in the production
environment.
Services virtualization: In production, applications often rely on third party
resources or data feeds. These services can number in the hundreds for larger and
more complex applications. It is not always practical, possible or affordable to bring
those services into the test environment, yet performance of those services is
critical to end user experience. Service virtualization emulates the behavior of
specific application dependencies that developers or testers need to exercise inorder to complete end-to-end transactions in test environments. Rather than
virtualizing entire systems, it virtualizes only specific slices of dependent behavior
critical to the execution of development and testing tasks.
S e r v i c e s
Test Platform
7/27/2019 Top Challenges Performance Engineers Face in 2013
http://slidepdf.com/reader/full/top-challenges-performance-engineers-face-in-2013 6/14
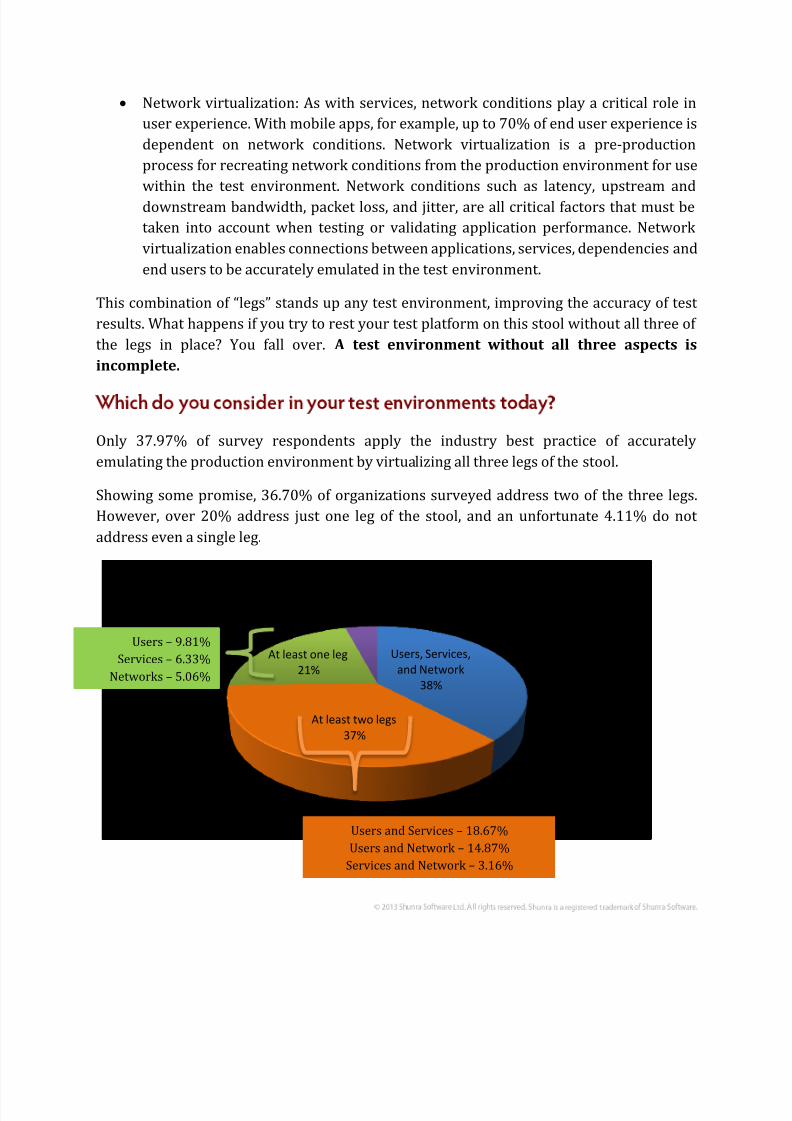
Network virtualization: As with services, network conditions play a critical role in
user experience. With mobile apps, for example, up to 70% of end user experience is
dependent on network conditions. Network virtualization is a pre-production
process for recreating network conditions from the production environment for use
within the test environment. Network conditions such as latency, upstream and
downstream bandwidth, packet loss, and jitter, are all critical factors that must be
taken into account when testing or validating application performance. Network
virtualization enables connections between applications, services, dependencies and
end users to be accurately emulated in the test environment.
This combination of “legs” stands up any test environment, improving the accuracy of test
results. What happens if you try to rest your test platform on this stool without all three of
the legs in place? You fall over. A test environment without all three aspects is
incomplete.
Only 37.97% of survey respondents apply the industry best practice of accurately
emulating the production environment by virtualizing all three legs of the stool.
Showing some promise, 36.70% of organizations surveyed address two of the three legs.
However, over 20% address just one leg of the stool, and an unfortunate 4.11% do not
address even a single leg.
Users, Services,
and Network
38%
At least two legs
37%
At least one leg
21%
No legs
4%
Users, Services, and Network Virtualization
Users and Services – 18.67%
Users and Network – 14.87%
Services and Network – 3.16%
Users – 9.81%
Services – 6.33%
Networks – 5.06%

7/27/2019 Top Challenges Performance Engineers Face in 2013
http://slidepdf.com/reader/full/top-challenges-performance-engineers-face-in-2013 7/14
Regardless of the number of “virtualized legs” you use, the large majority understands the
importance of load testing with 81.30% factoring users/load testing into their
environments today. Also worth noting from this question is that less than half (45.30%)
consider testing the end user device.
38.29% do not plan to test for network conditions or are going to test in production only.
16.4% do not plan to test for networks conditions at all in 2013 and 21.89% are going to
wait until they deploy. This is a top challenge for performance engineers in 2013. Testing in
production only is not enough.
Industry best practices dictate that all teams have a focus on performance. However, only
19% of our respondents have a best practice in place regarding team focus on
performance. One out of five respondents considers performance across the board
(choices included architect, developers, QA/test, operations, line of business owners). Over
95% of organizations have assigned performance responsibility to at least one team. More
often than not, that team was QA/Testers who comprised nearly 65% of all responses.
Only 24.4% of businesses identified line of
business owners as having a focus onperformance. A higher percent was expected
as line of business owners have a
responsibility for their business units’ bottom
line which is heavily influenced by application
adoption and use. As the mobile wave
continues to grow, and as mobile apps
continue to be initiated by individual business
units, a larger percentage of line of business
owners is expected to be assigned applicationperformance responsibilities.

7/27/2019 Top Challenges Performance Engineers Face in 2013
http://slidepdf.com/reader/full/top-challenges-performance-engineers-face-in-2013 8/14
Understanding internal and/or external constraints was selected by 81.01%. Of the
responses related to these constraints, having the ability to understand internal system
constraints, such as contention, memory usage, database, and storage, was selected by
72.80% of respondents; in addition, the ability to understand external system constraints,
such as use of external web services, CDNs, and cloud-based services was deemed
important to 58.90% of respondents.
Having the ability to understand inefficient use of network resources (chatty latency-
dependent applications, uncompressed content, duplicated/redundant requests, etc.) was
chosen by 68.40% of participants. Knowing how applications scale during peak usage
periods is important to 71.20% of our respondents, and assessing real-world network
conditions and the impact on their performance is important to 72.20% of participants.
Approximately one-third (35.44%) chose all the answers as important to their 2013
performance strategies. Which of these did respondents feel would be challenges in 2013?
All areimportant
35.44%
Understandinginternal and/orexternal system
constraints
81.01%
Assessing real-world, end-user
networkconditions
72.20%
Understanding
inefficient use of network resources
68.40%
Understandingof how appsscale duringpeak usage
periods
71.20%
7/27/2019 Top Challenges Performance Engineers Face in 2013
http://slidepdf.com/reader/full/top-challenges-performance-engineers-face-in-2013 9/14
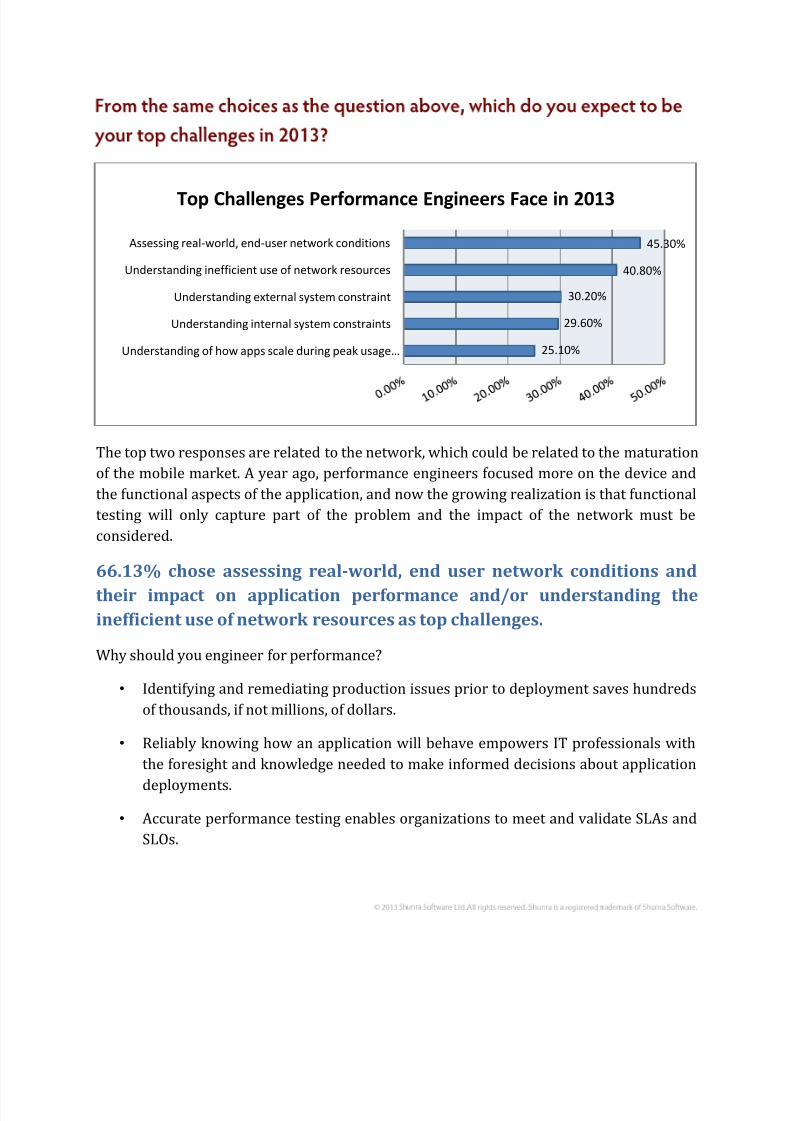
The top two responses are related to the network, which could be related to the maturation
of the mobile market. A year ago, performance engineers focused more on the device and
the functional aspects of the application, and now the growing realization is that functional
testing will only capture part of the problem and the impact of the network must be
considered.
66.13% chose assessing real-world, end user network conditions and
their impact on application performance and/or understanding the
inefficient use of network resources as top challenges.
Why should you engineer for performance?
• Identifying and remediating production issues prior to deployment saves hundreds
of thousands, if not millions, of dollars.
• Reliably knowing how an application will behave empowers IT professionals with
the foresight and knowledge needed to make informed decisions about application
deployments.
• Accurate performance testing enables organizations to meet and validate SLAs and
SLOs.
25.10%
29.60%
30.20%
40.80%
45.30%
Understanding of how apps scale during peak usage…
Understanding internal system constraints
Understanding external system constraint
Understanding inefficient use of network resources
Assessing real-world, end-user network conditions
Top Challenges Performance Engineers Face in 2013

7/27/2019 Top Challenges Performance Engineers Face in 2013
http://slidepdf.com/reader/full/top-challenges-performance-engineers-face-in-2013 10/14
Investments in performance
engineering are shifting left in the
development life cycle, as
organizations continue to better
understand the critical importance
of designing and developing for
performance. In this survey,
56.96% have increased budgets or
their performance budget has
remained intact from 2012. A verysmall amount, 6.01%, had a budget
decrease from 2012 to 2013.
37.02% do not have budgets in
2013.
The Cost of Poor Performance
Industry analysts, like Forrester, EMA and others, agree that the average cost to a
business of a production incident can exceed $45,000 per hour . This cost includes
multiple factors that impact the business, including the cost of resources to resolve
the issue along with the impact of the issue on business factors like revenue,
employee productivity and customer satisfaction. The impact to the business’
bottom line varies on the function and criticality of the affected application. In
another Shunra survey, our customers estimated the cost per incident at $80,000
for remediation, but this did not consider the impact on the business like brand
damage, revenue loss, or customer dissatisfaction. Based on ROI input from
customers and the average cost of a production incident as reported by industry
analysts, we know that an incident that requires one day to remediate can cost abusiness $360,000. A three-day remediation quickly turns into more than $1M, and
a six-day remediation can cost a business $2.1 million.
Yes, and
budget has
increased.
25.63%
Yes, and
budget has
remained the
same. 31.33%
Yes, and
budget has
decreased.6.01%
No budget for
designing for
performance.
37.03%

7/27/2019 Top Challenges Performance Engineers Face in 2013
http://slidepdf.com/reader/full/top-challenges-performance-engineers-face-in-2013 11/14
Mobile is rapidly becoming important to employee productivity. A sign of inefficient testing
practices and performance assurance, 67.8% of responding organizations reported
experiencing problems related to the performance of critical business applications
accessed by employees via mobile devices. More troubling is the fact that only 44.3% have
a 2013 plan in place to proactively assess the performance of these applications.
While concerning, this data is also not entirely
surprising. Testing mobile apps and ensuringmobile performance is challenging. When you
add a requirement to have a mobile load
scalability test, for example, there may be
disparity between the recognition of the need,
the expertise required and availability of
necessary tools.
So why are less than half of survey respondents
doing something about this issue? The World
Quality Report supports these findings.
Capgemini, one of the world’s foremost
providers of consulting, technology and
outsourcing services, and Sogeti, its local professional services division, recently released
the findings of the fourth annual World Quality Report. The report, published in
conjunction with HP, revealed that organizations are struggling to manage the challenges of
the mobile era, with only one-third of those surveyed currently formally testing their
mobile applications.
Only 6% of respondents reported “critical problems,” though over 60% cited the
occurrence of at least a few problems. Even these few problems are a concern when it
comes to mobility. Just a fraction of a second delay in transaction response times means
increased abandonment of mobile users, resulting in decreased revenue (in the case of m-
commerce apps) or loss of productivity (for internal app use). This also brings the light the
No
problems
32.30%
A few
problems
41.80%
Multiple
problems
20.30%
Critical
problems
5.70%
7/27/2019 Top Challenges Performance Engineers Face in 2013
http://slidepdf.com/reader/full/top-challenges-performance-engineers-face-in-2013 12/14
interpretation of severity. What may seem to be a trivial problem, or minor nuisance to an
organization, may actually be much more meaningful, and frustrating, to an end user.
Studies have shown that if you have a revenue-generating application, a failure can impact
up to 10% of your revenue. Furthermore, according to a survey from CA Technologies, the
loss associated with IT issues has been quantified as a 63% reduction in productivity,
resulting in an average of 552 people hours lost per year per company.
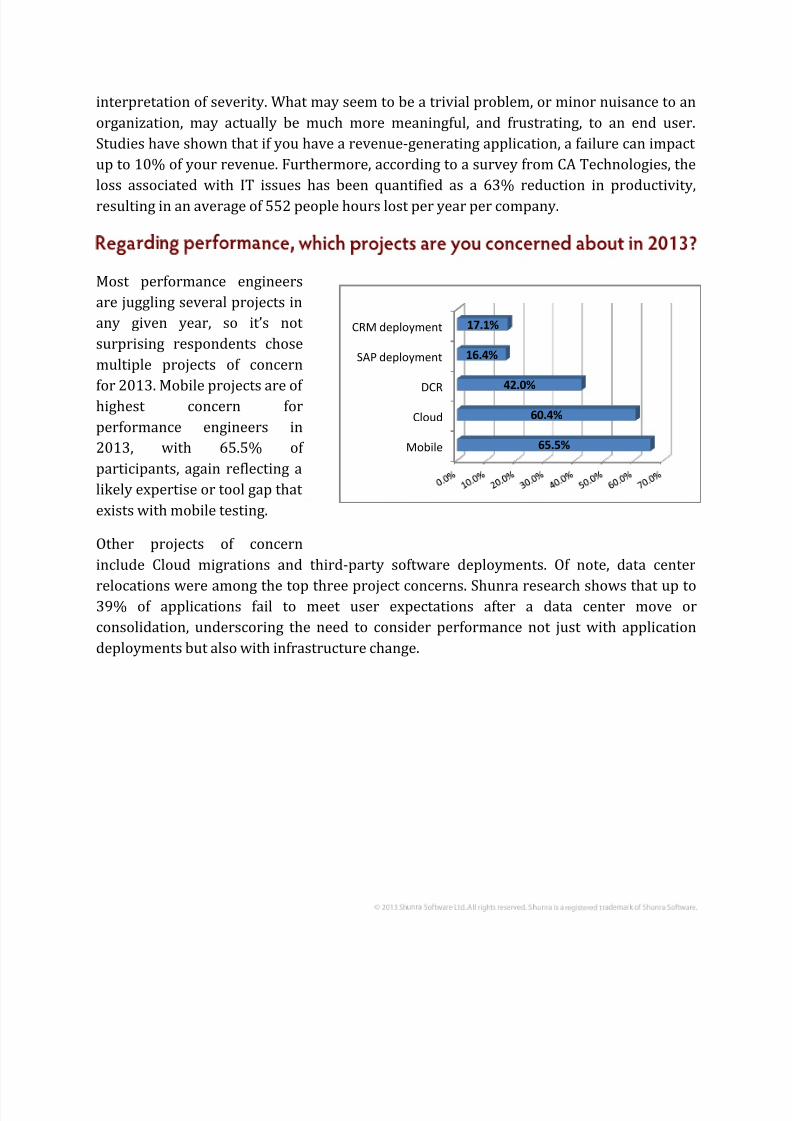
Most performance engineers
are juggling several projects in
any given year, so it’s not
surprising respondents chose
multiple projects of concern
for 2013. Mobile projects are of highest concern for
performance engineers in
2013, with 65.5% of
participants, again reflecting a
likely expertise or tool gap that
exists with mobile testing.
Other projects of concern
include Cloud migrations and third-party software deployments. Of note, data center
relocations were among the top three project concerns. Shunra research shows that up to39% of applications fail to meet user expectations after a data center move or
consolidation, underscoring the need to consider performance not just with application
deployments but also with infrastructure change.
Mobile
Cloud
DCR
SAP deployment
CRM deployment
65.5%
60.4%
42.0%
16.4%
17.1%

7/27/2019 Top Challenges Performance Engineers Face in 2013
http://slidepdf.com/reader/full/top-challenges-performance-engineers-face-in-2013 13/14
The largest response to this question indicated that a limited to no budget is the hindrance,
with 57.10% choosing this response as a reason. The impact and cost of failure forperformance issues actually far outweighs the budget required for proactive performance
testing. According to National Institute of Standards and Technology, approximately 80%
of the total cost of ownership of an application is spent and directly attributable to finding
and fixing performance issues post-deployment, costing businesses $60 billion annually in
the United States alone; one-third of those costs could be avoided with better testing
practices.
The second most popular reason survey respondents are not proactively testing for
performance is due to an inadequate testing environment at 49.20%. Lack of management
support came in third with 26.70% as the reason companies are not proactively testing forperformance. The gap which exists between knowing what must be done to ensure end
user experience and actually employing best practices must be closed. This can only be
accomplished by both a top-down and bottom-up approach, with all areas of the business
recognizing the financial implication of poor performance and an enterprise-wide
commitment to end user experience.
Agile methodologies continue to gain traction with development teams. Of the 316 survey
participants, 57.9% are using While Agile adoption is still growing, much has been written
about the challenges of Agile and how performance fits into an Agile environment, if at all.
According to the survey, only 25.6% have Agile organizations have performance as part of
their requirements. Just 15.5% integrate performance acceptance tests into automated
tests. Less than 14% fully automate performance and can compare each build to prior
builds for response time and resource utilization. For more insight and explanation around
the Agile-performance dilemma, please view the Shunra webcast:
How does performance testing fit into Agile?
http://ape.shunra.com/PerfTestandAgile.html

7/27/2019 Top Challenges Performance Engineers Face in 2013
http://slidepdf.com/reader/full/top-challenges-performance-engineers-face-in-2013 14/14
Application performance is a competitive differentiator and a clear indicator of business
success. However, 80% of the costs associated with application development occur in
remediating failed or underperforming applications after deployment, when the ineffective
application has already had a negative impact on the end user or customer experience.
One-third of those costs could be recovered with better testing practices.
Shifting left in the software development lifecycle is the key – testing early and often will
help organizations avoid the negative impact of performance failure while affording the
opportunity to capitalize on end user demands for immediate and ubiquitous access to
data, creating a significant competitive advantage for those organizations that are most
successful in building performance in to their application design, development and
deployment efforts.
Network conditions such as latency, limited bandwidth, packet loss, and jitter, are all
critical factors that must be taken into account when testing or validating application
performance, especially when considering the multiple network connections required to
support 3rd party services and external resources. With Network Virtualization, you
discover the real-world network conditions affecting end users and application service,
virtualize network impairments (such as high jitter rate and limited available bandwidth)
in the test lab so that the effect of the network on transaction response time can be reliably
and accurately measured, and then remediate or optimize performance.
Shunra has the benefit of working with more than 2,500 organizations globally and with
some of the most complicated application infrastructures in the world. For over a decade,
Shunra has witnessed a dramatic shift in awareness and focus on application performance
and seen this gap continue to shrink. Great progress is being made, and Shunra has been
fortunate to help our customers implement network virtualization solutions for software
testing and incorporate application performance engineering policies that encompass best
practices and proven strategies for improving and ensuring application performance. New
methodologies and approaches like Agile and DevOps continue to move companies towards
performance optimization, but greater awareness and performance policy across the
enterprise are still needed in order to truly achieve performance Zen.
More than 2,500 organizations use Shunra Network Virtualization solutions to proactively
test and validate application performance with real-world, virtualized network conditions
before deploying to production. Visit www.shunra.com for more information.