Tools for trade policy analysis examples from impact ... Feb 15_Tools... · Tools for trade policy...
38
Myanmar and the Asia-Pacific region: Role of policy research in economic and trade reforms 19-21 February 2015, Yangon Tools for trade policy analysis: examples from impact assessment of FTAs Witada Aunkoonwattaka (PhD) Trade and Investment Division, ESCAP [email protected]
Transcript of Tools for trade policy analysis examples from impact ... Feb 15_Tools... · Tools for trade policy...

Myanmar and the Asia-Pacific region: Role of policy research in economic and trade reforms
19-21 February 2015, Yangon
Tools for trade policy analysis: examples from impact assessment of FTAs
Witada Aunkoonwattaka (PhD)
Trade and Investment Division, ESCAP

Points to be raised
• Researchers must understand the needs of policymakers in terms of what policy questions they face
• The second stage is choosing the right tool(s) from the menu. – Often, there is more than one alternative.
– The choice should be dictated by policy questions
– Questions requiring ex-ante and ex-post analyses require different tools
• Problems would arise if researchers choose the tools that are not appropriate to answer your questions. – Researchers need to understand the advantages and disadvantages
(limitations) of each tool
2

Policy questions at different stages of policymaking
• Before negotiation of an FTA: An analysis of potential costs and benefits (ex-ante) – What a country can supply to its FTA partners? What it can source from the
partners?
– What are expected impacts on production and employment level and composition, welfare, fiscal balance, etc.
– What are the costs of necessary adjustment policies for the adversely affected sectors?
• After its implementation: An impact assessment (ex-post) – Whether the impacts are within the expected range?
– Whether the expected benefits are fully materialized?
– Whether further adjustment policies are necessary?
3
Context of the questions and availability of resources dictate the choice of methodology
• Whether the focus is the impacts at macroeconomic level or industry level ?
• Whether ex-post questions or ex-ante questions are being asked?
• Whether the required data are available?
• How much time and resources (technology, human capital, and money) are available?
4
What will be the potential effects of an FTA?
Tools:
1. Making inferences from trade indicators
2. Estimating the potential effects on an individual product
3. Estimating the potential effects on the whole economy
They are complementary with different strength/weakness and different (explicit and/or implicit)assumptions
What will be the potential effects of an FTA?
1. Making inferences from descriptive statistics / trade indicators
2. Estimating the potential effects on an individual product
3. Estimating the potential effects on the whole economy

What could be relevant to analyze ?
• How much of trade is intraregional? – Will the proposed FTA promote trade between trading partners? Are they
then “natural” trading partners?
• What is the comparative advantage of each member? – Which sectors are likely to have export (import) potential?
• Is export of a particular good regionally oriented? – How strong is a regional bias (if there is one)?
• How complementary is trade between a given pair of FTA members? – To what extent the export pattern of a country matches the import pattern
of a region?
• What is a degree of similarity between partners’ exports? – To what extent a country’s export profile overlaps with other FTA members?
7
Limitations
• They cannot provide precise numbers that quantify the effect of an FTA on trade, production, consumption, or welfare
• They can be meaningless or misleading if data are unsuitably classified – Trade classifications do not match a country’s production structure
– Data are too aggregated
8
What will be the potential effects of an FTA?
1. Making inferences from trade indicators
2. Estimating the potential effects on an individual product
3. Estimating the potential effects on the whole economy

Potential impacts on an individual product
• How an FTA will affect production, consumption, and trade flows in the domestic market for a single commodity?
– What will be an import increase?
– What will be an export increase of FTA partners?
– What will be an export decrease of non-member countries?
– What will be a fall in tariff revenue?
10

Potential impacts on an individual product
• How an FTA will affect production, consumption, and trade flows in the domestic market for a single commodity?
• Reasons for focusing on an individual product: – Its trade is significant in the country’s trade balance
– It generates substantial tariff revenue,
– It employs a large share of the country’s workforce
– Its output contributes significantly to GDP
– Firms in the sector may be important political players
– It may be located in an important region of a country
• The in-depth analysis at the level of individual industry or product makes partial equilibrium (PE) approach more appropriate
11
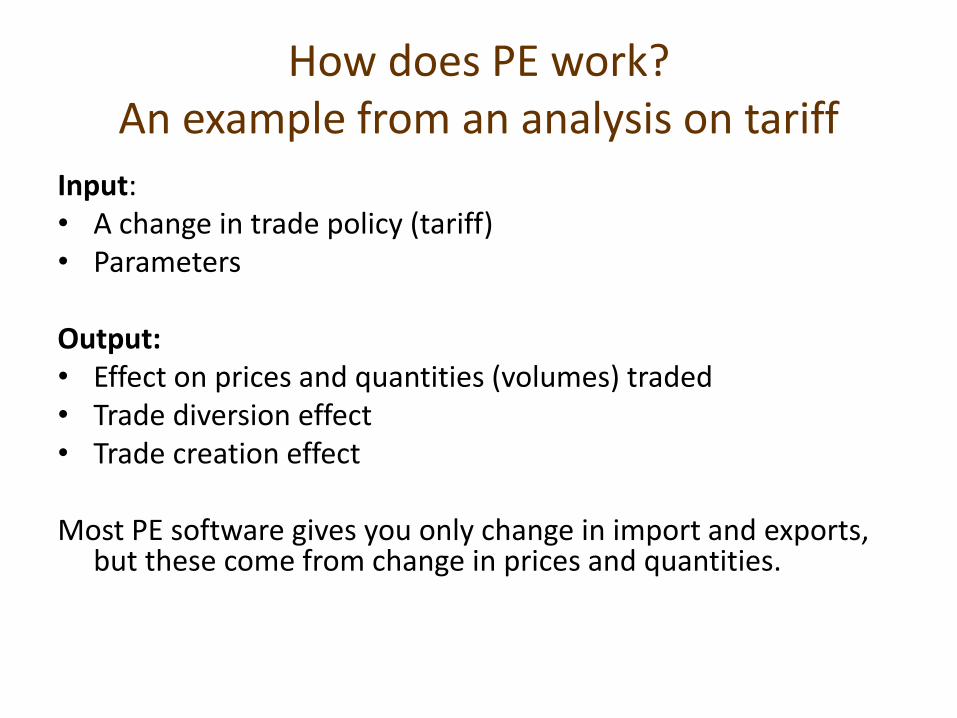
How does PE work? An example from an analysis on tariff
Input: • A change in trade policy (tariff) • Parameters
Output: • Effect on prices and quantities (volumes) traded • Trade diversion effect • Trade creation effect Most PE software gives you only change in import and exports,
but these come from change in prices and quantities.

Software for PE analysis
SMART – UNCTAD/World Bank WITS
TRIST – World Bank website – Excel
GSIM -(to be implemented in WITS)

Software limitations
• Results depends on pre-defined elasticities – But these can be adjusted into the software
• Trade policy restricted to tariffs (taxes)
• Not well suited to assess policy related to other trade policies or costs – Non-tariff measures
– Cost of compliance
– Behind-the-border issues
– Trade facilitations
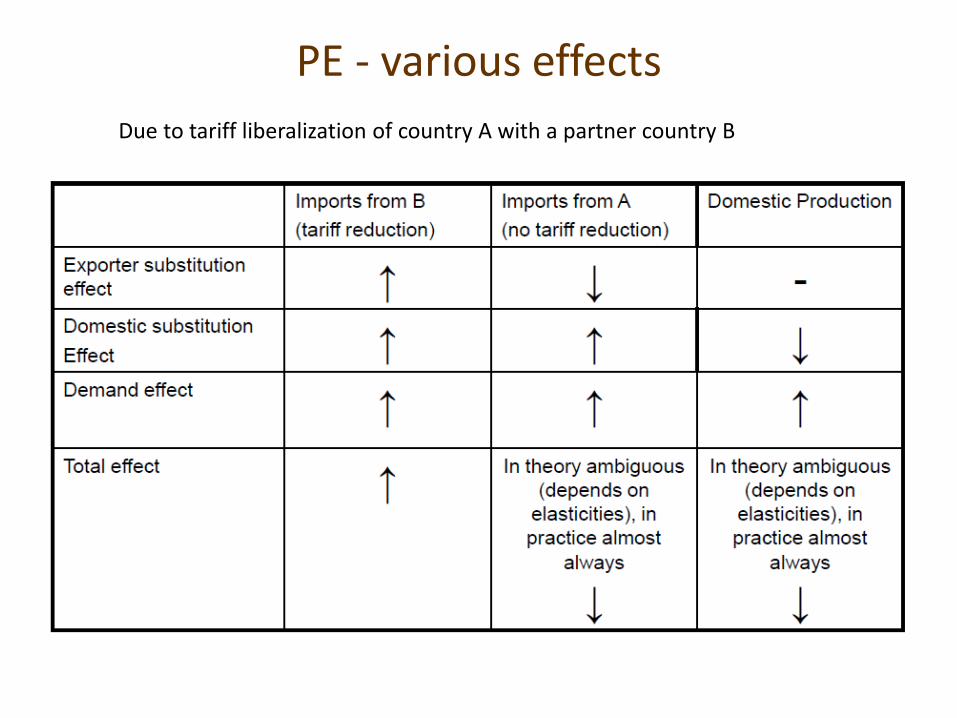
PE - various effects
Due to tariff liberalization of country A with a partner country B

Advantages of using PE Analysis
• PE models can be used to compute trade impacts of trade policy at a very disaggregated level of statistical product classification.
– This detailed level is very often the level at which trade liberalization and rule of origin in trade agreements are negotiated.
• Easier to implement than general equilibrium
• Less of a black box than general equilibrium
• Less intensive on data requirements
• Easy to change parameters and check for robustness to different assumptions
Limitations
• It ignores the inter-industry effects and the feedback effects of a trade policy change
– One way to look at it is the short-run impacts of a policy change on a particular industry
17
What will be the potential effects of an FTA?
1. Making inferences from trade indicators
2. Estimating the potential effects on an individual product
3. Estimating the potential effects on the whole economy
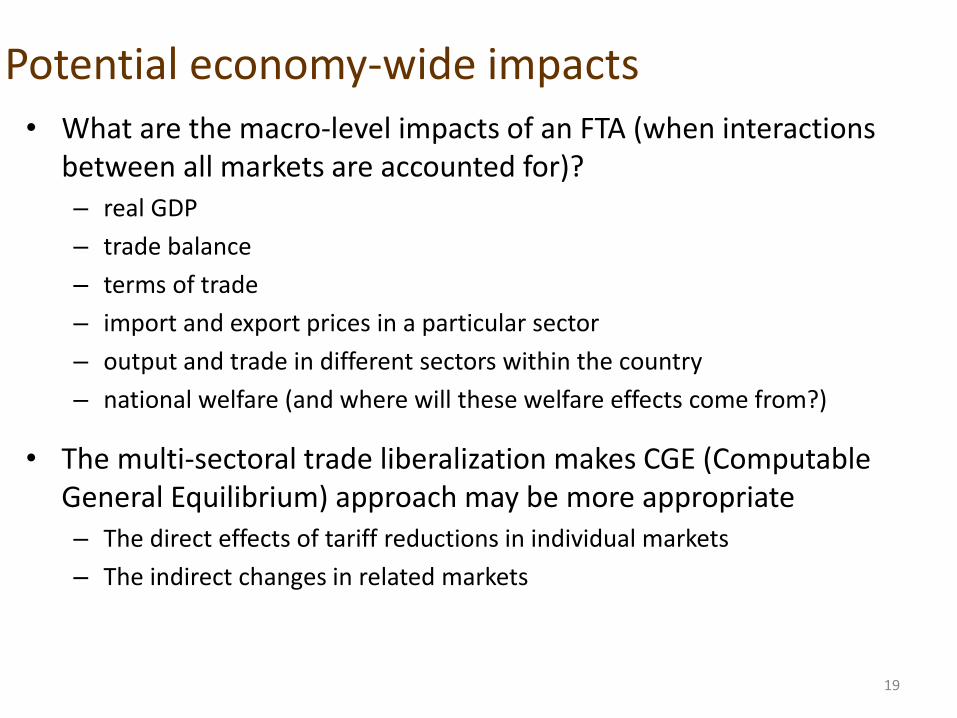
Potential economy-wide impacts • What are the macro-level impacts of an FTA (when interactions
between all markets are accounted for)? – real GDP
– trade balance
– terms of trade
– import and export prices in a particular sector
– output and trade in different sectors within the country
– national welfare (and where will these welfare effects come from?)
• The multi-sectoral trade liberalization makes CGE (Computable General Equilibrium) approach may be more appropriate – The direct effects of tariff reductions in individual markets
– The indirect changes in related markets
19
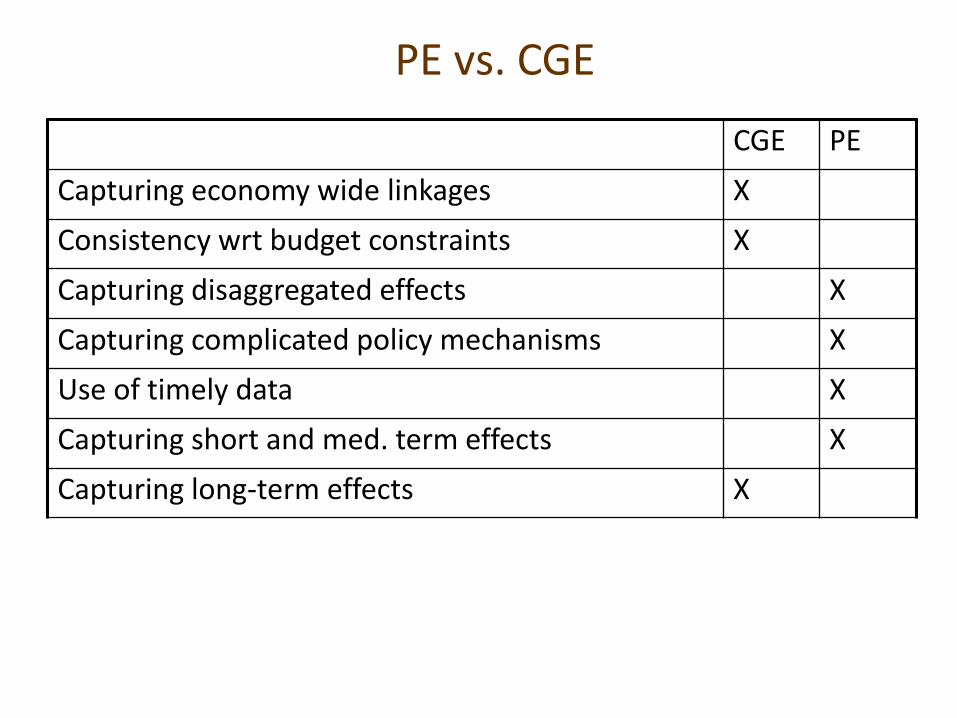
PE vs. CGE
CGE PE
Capturing economy wide linkages X
Consistency wrt budget constraints X
Capturing disaggregated effects X
Capturing complicated policy mechanisms X
Use of timely data X
Capturing short and med. term effects X
Capturing long-term effects X

When to use CGE?
21
• They are useful when sectors interact – through intermediate consumption, or
– their competition for factors of production or for consumers
• …when the focus is economy- wide impacts of a policy change
• …when the focus is identifying winners and losers under a policy change
Note:
If the scope of a study is limited to a small sector or short-term impacts, building a partial equilibrium model may be more relevant
– It will be simpler and will allow entering into more details
– Price rigidity may play an important role (impact of a devaluation, short-term impact of trade policy on current accounts)

After an FTA is ratified and implemented
22
Ex-post impact assessment

Ex-post policy questions
• Were the preferences utilized?
• Did the FTA raised welfare of the country in question?
• What were the channels of transmission of FTA-triggered trade flows changes to households’ welfare?
23

Were the preferences utilized?
• Do preferences cover all or most of otherwise dutiable imports?
• Have traders used the preferences ? (what is the utilization rate? ) – How high is the preferential margin and is it high enough to cover the
compliance (e.g. RoOs) costs?
24

Preference indicators
• Preference margin – also known as MOP- (the attractiveness of a preferential regime relative to MFN treatment) – MFN-FTA tariff
– The compliance cost has to be lower than the preference margin for exporters to utilize the preferences.
25
Source: Plummer, Cheong, Hamanaka (2010)
Advantages and Limitations
• Useful summary measures
• Calculation is simple provided customs data is made available
But
• They do not identify the reasons behind the results
Thus,
• Firm survey may be used to fill the gap
26

Did the FTA raised welfare of the country?
• Qualitative evaluation – Based on Viner’s concept of trade creation and trade diversion
• Quantitative evaluation – Gravity model of trade (an econometric approach)
27

Did the FTA raised welfare of the country?
• Qualitative evaluation: Changes in domestic production and trade affect welfare (based on the Viner concept)
+ inefficient domestic production is replaced by efficient imports from FTA members.
- efficient imports from the rest of the world are replaced by inefficient imports from FTA members.
28

Gravity Model of Trade
• The gravity model is an econometric method of estimating trade flows. – Tinbergen (1962) compared the size of bilateral trade flows between
any two countries to the gravitational force in physics between two objects.
– Since then, many theoretical models that yield the gravity equation for trade has been produced.
• It was used to analyze the impact of FTAs, GATT- WTO membership, TBTs, NTBs, currency unions, etc. on trade flows.
• The main advantage is that it can control for the effects of other trade determinants besides the FTA, and can therefore isolate the effects of the FTA on trade.
29
Gravity Model of Trade
30
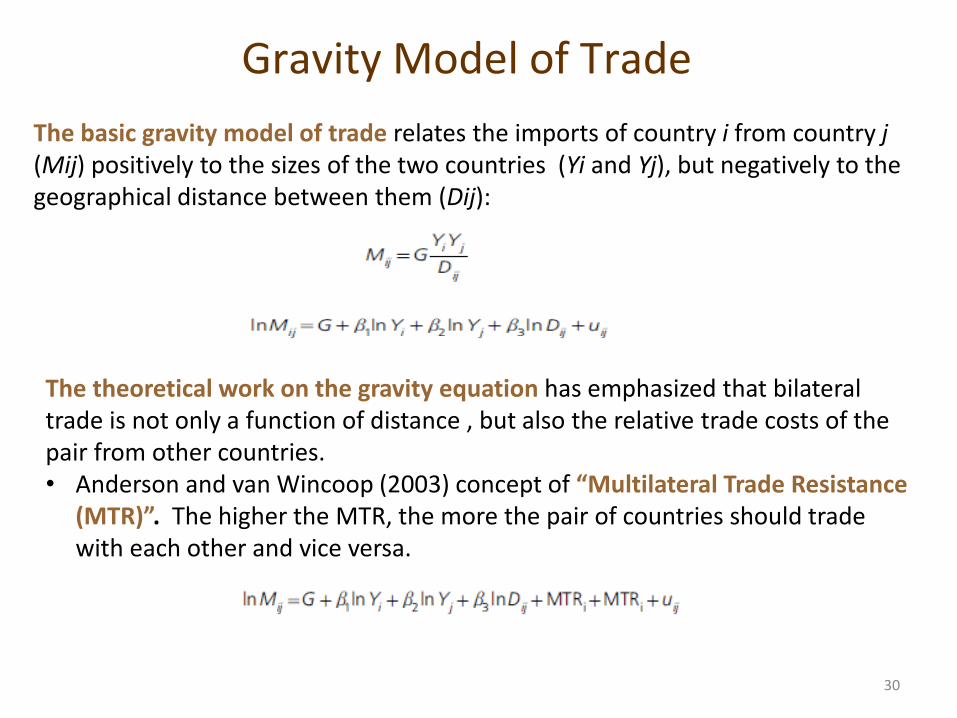
The basic gravity model of trade relates the imports of country i from country j (Mij) positively to the sizes of the two countries (Yi and Yj), but negatively to the geographical distance between them (Dij):
The theoretical work on the gravity equation has emphasized that bilateral trade is not only a function of distance , but also the relative trade costs of the pair from other countries. • Anderson and van Wincoop (2003) concept of “Multilateral Trade Resistance
(MTR)”. The higher the MTR, the more the pair of countries should trade with each other and vice versa.

Gravity Model of Trade
31
Several approaches to proxy the MTR:
• One is to use iterative methods to construct the estimates of the price-
raising effects of barriers to multilateral trade (Anderson and van Wincoop, 2003).
• A simpler alternative is to control for each country’s “remoteness” by using a formula that measures its average distance to trading partners.
• An even simpler −and widely used− method consists of using country fixed effects for importers and exporters (Rose and van Wincoop, 2001).

Using the gravity model for an FTA analysis
• At the aggregated level, gravity equations have been used extensively to assess, ex post, the effect of FTAs. – One of the seminal contributions in this area being Frankel, Stein and
Wei (1995).
• The crudest way to do so is to include a “dummy” (zero/one) variable marking pairs of countries linked by the FTA in the set of gravity regressors.
32

An example
33
TradeCreate = 1 when both the importing and exporting countries are members of the FTA in year t (Otherwise, TradeCreate = 0 ) TradeDivert = 1 when the importing country is a member of the FTA in year t, but the exporting country is not. (TradeDivert = 0)
Note: TradeCreate measures trade creation, while TradeDivert measures trade diversion.

Advantages
• Data for the gravity model is widely available.
• The model has a high level of explanatory power.
• Although a theoretical gravity model could be complicated, there are established standard practices that facilitate the work of researchers.
• It allows controlling for other trade-related variables and quantify any changes in a country’s trade due to the FTA.
• These quantitative estimates may then be used in welfare calculations.
34
Cautions and Limitations
Quantitative results should not be over-sold because the econometric technique has its own limitations.
• The model may yield misleading results if the data is inaccurate, or important variables are omitted from the estimation.
• The fact that FTA membership are likely to be endogenous to trade flows make the estimation is prone to endogeneity problem – Natural trading partners are more likely to form FTAs if governments
decide to form them on welfare grounds.
• Results may differ depending on whether or not zero trade flows are included in the dataset. – Potential solutions are increasingly discovered by the literature
35

Conclusions • A tour d’horizon of some of widely used tools for EBPM.
• There is more than one answer to a policy question. The choice is dictated by: – Policy questions – Data availability – Technical capability of research institutes – Time and resources
• Alternative model, sometimes, give conflicting results, but they are actually complementary. – Understanding underlying assumptions the tools is the key to properly
interpret the research results
Useful readings
• Andriamananjara, Cadot, and Grether (2013). Tools for Applied Goods Trade Policy Analysis: An Introduction, in Arvid Lukauskas, Robert M. Stern, and Gianni Zanini (eds), Handbook of Trade Policy for Development. Oxford University Press.
• ESCAP (2009). Trade Statistics in Policymaking - A Handbook of Commonly Used Trade Indices and Indicators.
• Plummer, Cheong, and Hamanaka (2010). Methodology for Impact Assessment of Free Trade Agreements. Manila, ADB.
• World Bank (2011). User’s Manual-WITS. • World Bank (2013). Online Trade Outcome Indicators- User’s
Manual. World Integrated Trade Solution (WITS). • WTO-UNCTAD (2012), A Practical Guide to Trade Policy Analysis.

Thank you