Proposal for a Globalization Matrix: Quantifying Impacts ...

243© The Author(s) 2021T. M. Poland et al. (eds.), Invasive Species in Forests and Rangelands of the United States,https://doi.org/10.1007/978-3-030-45367-1_11
Tools and Technologies for Quantifying Spread and Impacts of Invasive Species
Matt Reeves, Inés Ibáñez, Dana Blumenthal, Gang Chen, Qinfeng Guo, Catherine Jarnevich, Jennifer Koch, Frank Sapio, Michael K. Schwartz, Ross K. Meentemeyer, Bruce K. Wylie, and Stephen Boyte
11.1 The Need for Tools and Technologies
The need for tools and technologies for understanding and quantifying invasive species has never been greater. Rates of infestation vary on the species or organism being examined across the United States, and notable examples can be found. For example, from 2001 to 2003 alone, ash (Fraxinus spp.) mortality progressed at a rate of 12.97 km year −1 (Siegert et al. 2014), and cheatgrass (Bromus tectorum) is expected to increase dominance on 14% of Great Basin rangelands (Boyte et al. 2016). The magnitude and scope of problems that invasive species present suggest novel approaches for detection and management are needed, especially those that enable more cost-effective solutions. The advantages of
using technologically advanced approaches and tools are numerous, and the quality and quantity of available informa-tion can be significantly enhanced by their use. They can also play a key role in development of decision-support systems; they are meant to be integrated with other systems, such as inventory and monitoring, because often the tools are applied after a species of interest has been detected and a threat has been identified. In addition, the inventory systems mentioned in Chap. 10 are regularly used in calibrating and validating models and decision-support systems. For forested areas, Forest Inventory and Analysis (FIA) data are most com-monly used (e.g., Václavík et al. 2015) given the long history of the program. In non-forested systems, national inventory datasets have not been around as long (see Chap. 10), but use of these data to calibrate and validate spatial models is grow-ing. These inventory datasets include the National Resources Inventory (NRI) (e.g., Duniway et al. 2012) and the Assessment Inventory and Monitoring program (AIM) (e.g., McCord et al. 2017). Similarly, use of the Nonindigenous
M. Reeves (*)U.S. Department of Agriculture, Forest Service, Rocky MountainResearch Station, Human Dimensions Program, Department ofForestry and Environmental Resources Campus,Missoula, MT, USAe-mail: [email protected]
I. IbáñezSchool of Environment and Sustainability, University of Michigan,Ann Arbor, MI, USA
D. BlumenthalU.S. Department of Agriculture, Agricultural Research Service,Rangeland Resources & Systems Research Unit,Fort Collins, CO, USA
G. ChenDepartment of Geography and Earth Sciences,University of North Carolina at Charlotte,Charlotte, NC, USA
Q. GuoU.S. Department of Agriculture, Forest Service,Southern Research Station, Eastern Forest EnvironmentalThreat Assessment Center, Research Triangle Park, NC, USA
C. JarnevichU.S. Deparatment of Interior, U.S. Geological Survey, Fort CollinsScience Center, Fort Collins, CO, USA
11
J. KochU.S. Department of Agriculture, Forest Service, Northern ResearchStation, Delaware, OH, USA
F. SapioForest Health Assessment and Applied Sciences Team, ForestHealth Protection, U.S. Department of Agriculture, Forest Service,Fort Collins, CO, USA
M. K. SchwartzU.S. Department of Agriculture, Forest Service, NationalGenomics Center for Wildlife and Fish Conservation,Missoula, MT, USA
R. K. Meentemeyer Center for Geospatial Analytics, North Carolina State University, Raleigh, NC, USA
B. K. Wylie U.S. Department of Interior, U.S. Geological Survey, EROS Science Division, Sioux Falls, SD, USA
S. BoyteU.S. Department of the Interior, U.S. Geological Survey,Sioux Falls, SD, USA
This work was supported in part by the U.S. Department of Agriculture, Forest Service.The findings and conclusions in this publication are those of the authors and should not be construed to represent any official USDA or U.S. Government determination or policy.

244
Aquatic Species (NAS) database is growing as well (e.g., Evangelista et al. 2017). The consistent protocols employed by these programs prove valuable for developing better tools, but the data they afford are generally limited for some tools because the sampling intensity is too low.
The rapidly accelerating impact of invasive species sug-gests that development and implementation of geospatial tools and technologies will need to be expanded, given the high cost and impracticality of wide-area in situ reconnaissance. Although improvements are definitely needed, with increasing remote sensing data availability and significant computer pro-cessing capacity, geospatial tools and models are now suffi-ciently useful to be applied in an operational mode.
While tools and technologies offer significant promise, they should not be automatically applied to all situations. Ground surveys provide the most fundamental data for spe-cies management, and nearly all imagery studies suggest that georeferenced field data will not be replaced by technology anytime soon (Underwood et al. 2013). Though the need for consistent and comprehensive data describing the extent and location of invasive species has never been greater, inter-agency collaboration toward this end continues to be defi-cient. This is significant since the effective tools and technologies invariably require access to plot data for cali-bration and validation. In turn, fieldwork can become more efficient through the use of tools that identify high-priority locations for management or those that are likely to experi-ence new invasions or outbreaks in the future (Underwood et al. 2013). An accounting of these tools and technologies is therefore essential to aid in prioritization, to determine which tools merit further development, and to identify gaps where further research is needed.
Recently, Underwood et al. (2013) provided excellent overviews of remote sensing and geospatial tools, focusing on more specific examples than are discussed in this chapter. We sought to build on their previous efforts and add some non-spatially explicit technologies by focusing more atten-tion on different types of tools needed for evaluating invasive species. As a result, our assessment is broad and introduces new ideas and concepts that represent the state of the sci-ence. This chapter provides a synthesis of tools, technolo-gies, and techniques that are available across a number of disciplines, to quantify, estimate, and characterize presence, spread, and impacts of invasive species. Many tools and technologies specific to management activities (e.g., devel-opment of new trapping methods) are covered in Chap. 7. Here we focus on five areas including detection and map-ping, predicting establishment and spread, decision-support systems, genetic tools for restoration, and key findings, information needs, and opportunities. The systems presented are not a comprehensive list but do offer a state-of-the- science assessment of prominent tools and techniques.
11.2 Detection and Mapping of Species Occurrence or Spread
In this section, we refer to invasive species as a subject, which can include floral and faunal species. Some of the ideas, tools, and techniques can apply to both floral and fau-nal population, but, in general, we focus our efforts on veg-etation. Understanding and reducing the spread and impact of invasive species begin with detection (Lodge et al. 2006). Detection involves surveying, reporting, and verifying the presence of a non-native species. This is a critical process because it is the basis for initiating a rapid and timely response before an invasive species spreads so widely that eradication is no longer feasible (U.S. Department of Interior 2016). There are many approaches used to detect invasive species before they become established, but the most suc-cessful approaches are relatively inexpensive and have the potential for wide application. Thus, approaches like citizen science to detect colonization of new habitats by invasive species can be especially effective since they meet the crite-ria of being inexpensive and widely applicable (Crall et al. 2011; Delaney et al. 2008; Hawthorne et al. 2015). Citizen science is particularly relevant when the target species is conspicuous and easily identified (Darwall and Dulvy 1996), which is rarely the case for insects and pathogens. Yet, there are circumstances when those involved in citizen science lack the more advanced training or technology that is required to detect and identify invasive species (Fore et al. 2001). The subject of citizen science is discussed in Chap. 10 and in this chapter (including Geospatial Participatory Modeling). Tools for early detection included in this chapter include remote sensing, traditional geospatial modeling, analysis of inventory databases, and molecular detection techniques. Of these, remote sensing is probably the most widely used method for gathering data, repeatedly over large areas, at a relatively low cost.
11.2.1 Remote Sensing
A diverse suite of sensors spanning numerous temporal, spa-tial, and spectral resolutions has been evaluated for use in detection strategies. However, all remote sensing systems have some inherent limitations that constrain their applica-bility to specific situations, species, and temporal and spatial domains. Some of these limitations can be at least partially addressed through greater collaboration and sharing of resources across disciplines, organizations, and agencies. If image processing, data warehousing, and spectral analysis algorithms were partitioned among different organizations, great economies of scale could be realized, and this process
M. Reeves et al.
245
would foster greater interagency communication, data col-lection, sharing, and cooperation.
Some species are particularly unsuited for identification with remote sensing instruments because they are too small, mobile, or simply look like non-target species. For example, consider a remote sensing early detection system designed to find new outbreaks of kudzu (Pueraria lobata). Because kudzu is normally a sub-canopy species, it will be practically impossible to identify using most remote sensing platforms. Likewise, detection of new outbreaks of knapweeds (Centaurea spp.) at low densities will be equally as difficult given the similarities of spectral qualities with other species. Successful strategies for early detection with remote sensing instruments exploit characteristics of a target invasive spe-cies that are separable from background vegetation, by color, spectral response, phenology, or inference. Thus, for the pur-pose of this chapter, we limit our discussion to remote sens-ing studies, techniques, and platforms that have demonstrated some utility for effective early detection.
Remote sensing is only useful for detection if outbreaks of invasive species populations cause changes in spectral response from airborne or space-borne instruments (Asner et al. 2008a). Current remote detection and mapping of the ecological impacts of invasive species typically rely on the measurements of the disparities in spectral, structural, and temporal characteristics. These disparities, however, result-ing from symptoms of invasion such as dead tree canopies caused by sudden oak death (caused by Phytophthora ramo-rum), often manifest several seasons after initial infection (Haas et al. 2016). This delay in expression of symptoms is problematic for early detection regardless of the characteris-tics of the sensors being used. In addition, detection of inva-sive vegetation using remotely sensed data can be difficult because non-native plants are often obscured by, or com-mingled with, natural vegetation, making them difficult to identify using relatively moderate spatial/spectral resolution images.
Spectral Considerations Changes in the spectral response of a vegetation canopy may be used to identify an invasion. Because such phenomena can be directly captured in the vis-ible portion of the electromagnetic spectrum (wavelengths from approximately 400–700 nm), many remote sensing sys-tems are equipped to detect the noticeable discoloration. Typical systems that have proven effective to detect foliage- level spectral variation include those that employ coarse- spatial resolution for broad-scale detection, for example, 1-km MODIS (Moderate Resolution Imaging Spectroradiometer) (Coops et al. 2009) and 30-m Landsat (Skakun et al. 2003), and high-spatial resolution for monitor-ing fine-scale patchy distributions of tree mortality, for example, aerial photography (Kelly and Meentemeyer 2002) and 2.5-m QuickBird (Wulder et al. 2008). Limiting detec-
tion strategies to only visible bands is problematic if, for example, an affected forest remains at the pre-visual green mortality stage, where tree foliage contains slightly reduced chlorophylls and water content. To address this challenge, researchers seek to discover a stronger relationship between plant physiological stress and spectral reflectance from the near infrared (wavelengths from approximately 700–1300 nm) and the short wave infrared (wavelengths from approximately 1300–2500 nm) spectral ranges (Knipling 1970; Laurent et al. 2005). Most of today’s remote sensors have the capacity to record near infrared radiation, while the short wave infrared bands are often available from the sen-sors with medium to coarse spatial resolution (e.g., Thematic Mapper (TM) and Landsat 8 Operational Land Imager (OLI)).
At times, however, more narrow spectral channels offered on hyperspectral platforms offer improved identification of the subtle spectral discrepancies between healthy and dam-aged vegetation. Fine spectral resolution data acquired through hyperspectral imaging provide a viable solution by using dozens to hundreds of narrow and contiguous spectral bands. Successful applications of hyperspectral sensors have primarily emerged since 2000 (e.g., Asner et al. 2008b; Chen et al. 2015; Cheng et al. 2010; Coops et al. 2003; McNeil et al. 2007; Noujdina and Ustin 2008; Pu et al. 2008). Unfortunately, the majority of the applications have been limited to relatively small areas because hyperspectral sen-sors, to date, are mostly mounted on airborne platforms, such as NASA’s AVIRIS (Airborne Visible/Infrared Imaging Spectrometer), Canada’s CASI (Compact Airborne Spectrographic Imager), and Australia’s HyMap (hyperspec-tral mapper). A few space-borne hyperspectral systems (e.g., NASA’s Hyperion) are available; however, their applications have been restricted due to limited spatial coverage and high spectral noise. NASA’s next generation HyspIRI (Hyperspectral Infrared Imager) is expected to deliver con-sistent, global coverage imagery using contiguous 10-nm spectral bands from the visible, short wave infrared to the thermal infrared spectral range.
Spatial Resolution Considerations Satellite technology has been used to study issues of environmental concern over large geographical areas (Rose et al. 2015), but high-spatial resolution satellite and airborne imagery, such as sub-meter aerial photos, are more suitable for detecting fine-scale dis-turbances, where the infested native species are within small, discrete patches (Meddens et al. 2011). Applying high spa-tial resolution data can be advantageous for capturing spatial details for monitoring plant structural dynamics; however, limited data availability, high acquisition costs, and reduced processing efficiency often become major obstacles in real- world applications.
11 Tools and Technologies for Quantifying Spread and Impacts of Invasive Species

246
Despite these issues, perhaps the most straightforward approach for detecting invasive species is using visual inspection of high spatial resolution images. Using this sim-ple technique, it is possible to pinpoint certain species based on their unique spatial patterns, phenological characteristics (Huang and Asner 2009), or color of inflorescence. Species with colorful, diagnostic flowers, such as leafy spurge (Euphorbia esula) and saltcedar (Tamarix chinensis), have been identified using visible wavelengths (400–700 nm) in aerial photographs taken during the flowering seasons (Everitt et al. 1995, 1996). The USDA National Agriculture Imagery Program (NAIP) has archived color (RGB) and color infrared (CIR) aerial photographs with resolutions ranging from a few centimeters (in the case of aerial videog-raphy) to ~2 m. Each State has its own acquisition schedule and choice of imagery, but the timing of data acquisition is crucial because the data may only be useful if collected when the targeted non-native plant is distinct from its background and neighboring areas (e.g., flowering).
Techniques and sensors also exist that enable exploitation of unique spatial patterns. For example, 4-m multispectral IKONOS imagery has been used to identify Melaleuca (Melaleuca quinquenervia) in South Florida because the spatial pattern of Melaleuca is highly aggregated (Huang and Asner 2009). However, even with such a diagnostic spatial pattern, 4-m spatial resolution was insufficient to identify this tree at lower densities (Fuller 2005). Likewise, smaller statured species, such as grasses and forbs, often require even higher resolution imagery, again exemplifying the need to design specific protocols for each target species. For example, QuickBird (2.4 m), another multispectral satellite system, has been used to estimate (accuracy assessment ≥65%) the presence of multiple non-native plants including purple loosestrife (Lythrum salicaria), common reed
(Phragmites australis), and water chestnut (Trapa natans) in the Hudson River National Estuarine Research Reserve (Laba et al. 2008), and to delineate (accuracy assessment ≥86%) giant cane (Arundo donax) in Texas (Everitt et al. 2005). Again, despite success with relatively high resolution from satellite platforms, some situations require still greater resolution necessitating use of aerial platforms.
Very-high-resolution imagery taken from light aircraft or unmanned aerial vehicles (UAVs) can be used to find and even measure invasive species that blend in with other vege-tation. While not yet practical for regional mapping, it has been used effectively for finding invasive species, measuring changes in invasive species abundance over time, and under-standing environmental correlates of invasive species suc-cess (Blumenthal et al. 2012; Calviño-Cancela et al. 2014; Wan et al. 2014; Zaman et al. 2011).
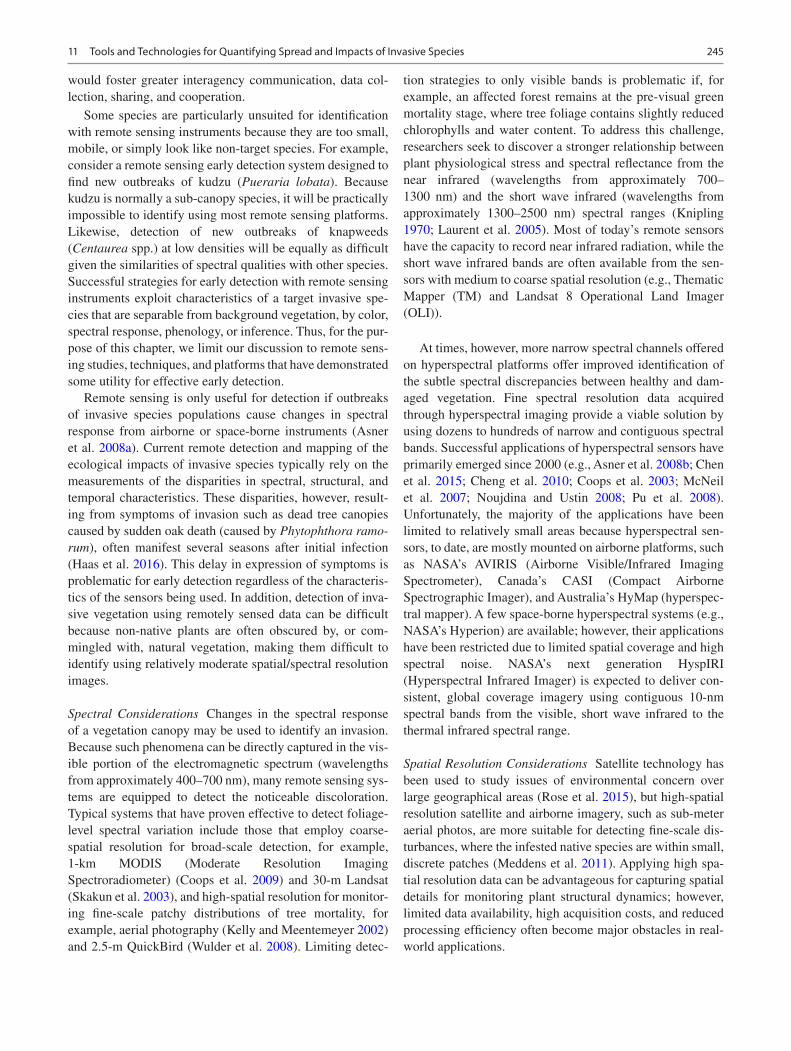
Digital images taken from slow-flying lightweight aircraft have attained resolution (ground sample distances) of as lit-tle as 1–2 mm per pixel (Booth and Cox 2008). The advan-tage of such methods is that species not visible with coarser resolution methods can be identified and measured (Fig. 11.1). Herbaceous invasive species that have been effectively measured through visual analysis of such images include Dalmatian toadflax (Linaria dalmatica), leafy spurge, and cheatgrass (Bromus tectorum) (Blumenthal et al. 2007; Booth et al. 2010; Mealor et al. 2012). The disadvan-tage of using such very-high-resolution methods is that they currently offer narrow fields of view and thus low spatial coverage (17.5–48.5 m/image in the above examples). Consequently, they favor subsampling rather than fully map-ping invasive species. For example, 2049 images used to study Dalmatian toadflax in mixed-grass prairie covered only 2.4% of the 4.1-km2 sampling area (Blumenthal et al. 2007).
Fig. 11.1 Digital aerial image of mixed-grass prairie containing multiple patches of Dalmatian toadflax. Upper inset shows an individual toadflax plant with six stems. Lower inset shows a dense patch of toadflax. Both insets also contain prairie sagewort (Artemisia frigida Willd.), with lighter gray-green foliage
M. Reeves et al.

247
For many invasive species, moderately lower resolution images are sufficient to distinguish them from native vegeta-tion, facilitating complete spatial coverage. For example, 25-cm spatial resolution visible and near-infrared images taken from a UAV were sufficient to identify patches of com-mon reed (Zaman et al. 2011) across a 31-km2 area over sev-eral hours of flight time. Similarly, 20–40-cm spatial resolution hyperspectral imagery has been effective for map-ping broad Melaleuca patches across the Florida Everglades. Even without hyperspectral imagery, 2.4-cm ground resolu-tion was sufficient to distinguish Brazilian pepper (Schinus terebinthifolius) from similar woody vegetation in Florida (Pearlstine et al. 2005).
As technology continues to improve, the trade-off between resolution and spatial coverage should be elimi-nated. This prospect could be realized with a combination of improved sensors flown at greater altitudes and faster pro-cessing and storage speeds, allowing more images to be taken per unit time (Anderson and Gaston 2013; Calviño- Cancela et al. 2014). Visual examination of images can be accurate and quick when determining presence/absence, which is often all that is needed to detect new infestations (Blumenthal et al. 2007). Visual measurements of species cover, however, can take considerably longer; consequently, developing techniques for automating image processing will be key to measuring invasive species cover over larger areas. These can rely on spectral characteristics, texture, shape, and phenology, and sometimes involve machine learning (Bradley 2014; Pearlstine et al. 2005; Wan et al. 2014). Given images with sufficient spatial and spectral resolution, such methods can often achieve >95% accuracy in identifying invasive species (Calviño-Cancela et al. 2014; McCormick 1999; Wan et al. 2014; Zaman et al. 2011).
Regardless of the spatial resolution, detecting invasive species below forest canopies, especially when forests are dense, is practically impossible. There is, however, promis-ing research suggesting that by using LiDAR (light detection and ranging), it is possible to penetrate the forest canopy and characterize forest 3D structure (e.g., biomass and leaf area index) with no apparent sign of saturation (Zhao et al. 2011). Over the past two decades, LiDAR attracted considerable attention and is already established as one of the standard remote sensing tools for mapping forest biophysical param-eters such as tree height, crown size, basal area, timber vol-ume, and canopy fuel (Asner et al. 2008a; Chen and Hay 2011; Lim et al. 2003; Zhao et al. 2011). Recent studies sug-gest that even if the structure of the native plants has yet to be significantly altered, LiDAR could still be used to detect understory invasive plant species (Singh et al. 2015). Most LiDAR systems are mounted on airborne platforms, and, currently, there is no space-borne LiDAR specifically designed for studying forest ecosystems; however, the Geoscience Laser Altimeter System (GLAS) instrument
(footprint: 70 m in diameter; point spacing: 170 m along the track) onboard the NASA Ice, Cloud, and land Elevation sat-ellite (ICESat) was utilized (data available from 2003 to 2010) to map forest height and carbon variability at the regional to global scales (Saatchi et al. 2011).
Temporal Resolution Considerations In contrast to the very- high- resolution applications introduced above, moderate to low spatial resolution imagery usually covers the largest areas in the greatest temporal detail but at reduced spatial resolution. The relatively coarse spatial resolution of high temporal resolution imagery generally limits its early detec-tion to invasive species that cover large, relatively homoge-nous areas, or that delineate strong canopy differences between infested and non-infested sites. Typically, annual or bi-annual data are used because the intra-annual variability in native species (e.g., broadleaf trees) may also be induced by seasonal changes in climatic variables. To date, remotely sensed time-series data have been applied successfully to assess the impacts of invasive diseases/insects (e.g., Townsend et al. 2012; Wulder et al. 2008) and invasive plants (Bradley and Mustard 2005). It should be noted that time- series data are collected at different dates and are possibly affected by various atmospheric conditions. Thus, conduct-ing an effective radiometric correction becomes essential for extracting ‘real’ changes in forests (Song et al. 2001).
Although most of the remote sensing systems offer repeated monitoring capability, medium- to coarse-spatial resolution sensors are more frequently used in time-series analysis owing to the short revisit intervals (e.g., MODIS: half a day; Landsat: 16 days); this provides flexibility to col-lect high-quality data, especially in the cloud-prone tropical regions (Asner 2001). Using medium- to coarse-spatial reso-lution sensors can further mitigate the joint effects of sensor/sun angles and tree 3D structure, which typically cause high spectral variation in high spatial resolution imagery (Chen et al. 2011). Another solution for analyzing high-spatial res-olution time-series data is employing Geographic Object- Based Image Analysis (GEOBIA), using image objects (groups of pixels) rather than individual pixels as the basic study units (Chen et al. 2012). These groups of pixels reduce within-class variability while maximizing between class variance. For example, Chen et al. (2015) applied this approach to high-spatial, high-spectral MASTER (MODIS/ASTER Airborne Simulator) airborne images for assessing the severity of wildfire burn in forests affected by sudden oak death. Additionally, the USDA Forest Service Region 1 (Northern Region) Existing Vegetation Database (VMap) (www.fs.usda.gov/goto/r1/VMap) applied this approach to imagery from NAIP at ~1 m to detect a host of forest stand attributes and outbreaks of insects and disease across the Northern Region. Regardless of the approach used to evaluate
11 Tools and Technologies for Quantifying Spread and Impacts of Invasive Species

248
the presence of invasive species, the timing of data acquisi-tion (time of overpass) is one of the most critical aspects for consideration and can be a significant determinant in the suc-cess of the analysis. For example, if imagery is acquired dur-ing a senescent period, the efficacy of the analysis will be reduced, especially when the invasive species (e.g., leafy spurge) can be easily differentiated from background and other species when flowering. Likewise, in forested systems, the early-stage establishment of invasive species can influ-ence trees’ photosynthetic capacity by altering leaf nitrogen content and chlorophyll pigment (Kattge et al. 2009). This rapid change in leaf optical properties indicates a need to carefully consider the timing of acquisition and repeat frequency.
Application on Invasive Annual Grasses Some of the most successful uses of high temporal resolution imagery are those leveraging distinct phenological cycles of cool season invasive annual grasses, such as cheatgrass, red brome (Bromus rubens), and medusahead (Taeniatherum caput- medusae) (Clinton et al. 2010). These invasive grasses are among the most serious invasive species present in the Western United States. These invasive annuals displace native species and accelerate fire cycles. A variety of satel-lites at different spatial, temporal, and spectral resolutions have been used to detect and quantify the presence of inva-sive annual grasses.
The most common platforms for quantifying presence or abundance of invasive annual grasses include Landsat TM and ETM+ (Enhanced Thematic Mapper Plus), Advanced
Very High Resolution Radiometer (AVHRR), and MODIS. Peterson (2003) used Landsat ETM+ to quantify percent cover of cheatgrass over roughly 12.9 million ha in the Great Basin to a root mean square error (RMSE) of 9%. In the same region, Bradley and Mustard (2006) used time series of Landsat TM and ETM+ and AVHRR data to clas-sify areas infested with cheatgrass. The interannual ampli-fied response to rainfall was quite distinct from native shrub/bunch grass, which enabled a 71% classification accuracy of detecting cheatgrass. Other examples of successfully detect-ing invasive annual grasses include Peterson (2007) (Owyhee uplands; Landsat TM), Singh and Glenn (2009) (Southern Idaho; Landsat 7 ETM+), and Boyte et al. (2015) (Great Basin and vicinity; MODIS). All these successful studies leverage the distinct phenological pattern via time-series analysis portrayed by invasive annual grasses and focus, most often, on the presence/absence of invasive annual grasses.
In terms of ecological effects and the resistance to con-trol, it is helpful to understand the relative abundance of annual grasses in addition to their presence/absence. Such information enables both ongoing regional-scale analysis and management while still facilitating local patch-based application. The US Geological Survey (USGS) has devel-oped two methods that detect and map invasive annual grasses in the Western United States. One method created a time series of cheatgrass percent-cover maps (Fig. 11.2) by keying in on dynamic phenological characteristics of cheat-grass that differ from other vegetation types, using a fine- scale temporal resolution satellite product at 250-m spatial resolution. The other method created a snapshot of annual
Fig. 11.2 Mean cheatgrass percent cover (2000–2013). The map represents the mean cheatgrass percent-cover value for each pixel during 14 years. The mapping model was developed using regression-tree software driven by annual eMODIS NDVI at 250 m and biogeophysical data. Values ranged from 0 to 86 with an overall mean of 9%. The mask (white areas) hides 2001 National Land Cover Database classifications other than shrub or grassland/herbaceous and elevations higher than 2000 m
M. Reeves et al.

249
grass abundance by transforming scaled-up field data using multiple spectral bands from two satellite products with dif-ferent resolutions to separate the response of invasive annual grasses from spectra of other vegetation types at 30-m spatial resolution. To improve the time series of information for mapping invasive annual grasses, high temporal resolution imagery at 250-m resolution from the enhanced Moderate Resolution Imaging Spectroradiometer (eMODIS) (Brown et al. 2015) can be used in conjunction with higher spatial resolution training data.
The weekly composites from the eMODIS enable charac-terization of cheatgrass abundance by analyzing the phenol-ogy of cheatgrass. This is because the species commences spring growth (increases in plant greenness are measured by normalized difference vegetation index (NDVI) values), sets seed, senesces, and dies within a period of few to several weeks. The eMODIS NDVI is adept at capturing cheatgrass green-up because the data product represents near-daily acquisitions of satellite images that are composited into the best available pixel for each 7-day period (Jenkerson et al. 2010) (Fig. 11.3).
The USGS developed model parameters and algorithms using two years of data on invasive annual grasses (Nevada Natural Heritage Program 2015) stratified by percent-cover cohorts at more than 35,000 points resulting in 250-m pre-dicted cheatgrass percent-cover time series (2000–2013). A substantial advantage of focusing on cheatgrass phenology using eMODIS NDVI and regression-tree models is that both an historical time series of cheatgrass percent-cover maps and annual near-real-time cheatgrass percent-cover maps can be developed. The same eMODIS data, used in
conjunction with other data sources for detecting invasive annual grasses, are used for evaluating the status of current forest health and identifying the presence and extent of pest outbreaks across the United States (e.g., Chastain et al. 2015a).
Application on Forest Pests It’s important to distinguish between “pests” and invasive species as they are defined in this assessment. The term “pest” is used here because it is commonly used throughout many State and Federal govern-ment programs, and thus cannot be easily removed from the discussion. A pest is an organism out of place, though it may not cause a disturbance. A pest can be a plant, an insect, or a pathogen in our context of management. Often pests are invasive, sometimes they are native, and often they are exotic, but this distinction is without value because some problems are native to the country but are new to certain areas and causing pestilence, economic, and ecological harm. A good example of this condition arises from the goldspotted oak borer (Agrilus auroguttatus), which is native to North America and the Pacific Southwest region of the United States. However, this pest is killing and weakening numerous tree species in southern California and Mexico.
Forest pests influence millions of hectares of both private and federally owned forest land. As noted in Chap. 10, forest health surveys are conducted annually to detect and evaluate the scope and impact of forest pest activity and are a major component of the Forest Service Forest Health Protection (FHP) program’s strategy to minimize the impact of both native and exotic invasive pests. FHP surveys for distur-
Fig. 11.3 The chart illustrates differences between eMODIS NDVI profiles in adjacent pixels, one estimated with moderate cheatgrass per-cent cover and the other with very low cheatgrass percent cover. The spike in the profiles starting about week 9 and ending about week 14 represents the period of short-lived cheatgrass growth. The second
spike in the profiles starting about week 17 and ending about week 21 could represent (1) the emergence from an extended wet period where high soil moisture deflated NDVI values, (2) a second wave of cheat-grass growth, or (3) other annual species’ green-up
11 Tools and Technologies for Quantifying Spread and Impacts of Invasive Species

250
bances and pests, and the Forest Service’s Forest Health Assessment and Applied Sciences Team (FHAAST) (for-merly the Forest Health Technology Enterprise Team (FHTET)) facilitates these surveys by offering a range of data collection, data analysis, and forest pest information reporting technologies. The FHAAST is unique in that it is one of few operational pest detection programs that employs remote sensing technology in forests across the United States. The process model (Fig. 11.4) describes how FHP and its partners in all 50 States identify, survey, and report on forest pest activity.
Forest pests, including those considered to be invasive, are detected annually through a variety of means. The sur-veys are organized around a reporting construct called a pest event. Pest events are characterized as annual pest activity for a given organism or damage-causing agent, where the pest activity is homogeneous in nature over a given geogra-phy. Pest events can be quite large, sometimes covering large portions of entire States, or they may be multistate in nature, exemplified by Fig. 11.5, which depicts the proportion of forested area damaged by gypsy moth (Lymantria dispar) from 2011 to 2015. A recent lodgepole pine (Pinus contorta) mortality event triggered by the mountain pine beetle (Dendroctonus ponderosae) covered most of Colorado and parts of Utah and extended well into Wyoming. While that pest event is largely concluded, the mortality caused by mountain pine beetle continues to surface in the northern
part of the lodgepole pine range. This continuing tree mortal-ity would likely be described as a separate event. Pest events also often include damage caused by extreme weather events, where trees are killed, broken, or uprooted. Forest fires are not typically mapped by FHP surveys (active fire mapping at the national level is led by the Forest Service through the Monitoring Trends in Burn Severity (MTBS) program, www.mtbs.gov), though many cooperating State partners assume that responsibility.
FHP and its partners issue pest reports in one of two ways. Often times, pest events are not specifically surveyed, and even though their location and intensity are known locally, they are not mapped with geospatial data and transmitted to the national office (FHAAST). FHP refers to these observa-tions as unstructured pest reports. Frequently, pest events of this kind are difficult to survey or have a technological or a diagnostic limitation, or there is a lack of agency commit-ment to survey based upon local need. These events are described with software called the pest event reporter (PER). This web-based tool is specifically designed to address pest conditions where actual geospatial data may not exist or are inconsistently acquired nationally.
Secondly, broad-scale impact pests achieve a level of importance indicating that a forest pest survey is necessary. These surveys are often interagency in nature and target a specific invasive species. Pests such as the mountain pine beetle or the emerald ash borer (Agrilus planipennis) are
Fig. 11.4 FHP forest disturbance reporting process
M. Reeves et al.

251
Fig. 11.5 Insect and Disease Survey by Subwatersheds (6th Level Hydrologic Unit Codes (HUCs)) proportion of treed area with damage from gypsy moth from 2011 to 2015 (Map date: June 2016)
11 Tools and Technologies for Quantifying Spread and Impacts of Invasive Species

252
recent examples of pests that warranted a multiagency sur-vey response. Mission planning is critical for these pests and occurs on an annual basis. Initial queues of outbreaks often come from the public, overview surveys, or remote sensing initiatives such as the Forest Disturbance Monitor (FDM) (Chastain et al. 2015a). At present, forest disturbance moni-toring remotely from satellite is only intended to trigger a subsequent aviation or ground-based survey, where causal agents, intensity, and impact can be adequately estimated. These efforts represent the mission planning phase, which focuses on enabling surveys that incorporate appropriate ref-erence data, maps, and scope of the event(s) to be surveyed.
Forest pest surveys can be conducted in multiple ways. Aerial Detection Surveys (ADS) make up most of the area evaluated annually (202,343 ha). Structured ground surveys, where observers are equipped with pen-based tablets and specialized software, are expected to increase the area where detection surveys are conducted and, to some degree, dis-place aerial surveys. Surveillance using satellite remote sensing is also improving through programs like Operational Remote Sensing (ORS) (Chastain et al. 2015b). ORS was expected to surveil 30 million ha in 2016 and targeted 60 mil-lion ha in 2017. Efforts to increase the number of observa-tions or the area surveyed have been facilitated through recent successes using massive parallel computer process-ing, such as Google Earth Engine, coupled with a robust imagery stack of satellite data (Chastain et al. 2015b).
Pest observation data, in the form of point-, polygon-, and cell-based geographic features, are captured through a range of technologies supported by the FHAAST. Recent efforts focus on Android-based tablet software, where field observa-tions are collected and reported to FHAAST annually for cor-rection, summation, and sharing through a variety of web applications (https://www.fs.fed.us/foresthealth/publications/fhaast/index.shtml). Without additional adornment, these data are just geographic features and attributes which lack any temporal dimension or biological or socioeconomic reference to scope or impact. Through a process called Pest Event Reporting, and using web software called the Pest Event Reporter (https://www.fs.fed.us/foresthealth/applied-sci-ences/mapping-reporting/data-app-development.shtml), these geographic features are organized into biologically based events at the local, regional, and national level. Pest outbreaks or their associated forest damage are organized into groups of counties based on geographic data or other non-geographic information. These events are vetted at both the regional and national level by designated specialists within the Forest Service. In the case of invasive species, these events are recognized as important at the national level and are pub-licized through a variety of web reporting applications. The FHP Mapping and Reporting Portal provides forest health information annually to internal and external partners through a variety of web applications. This information is increas-
ingly incorporated into local forest health reports, State forest health highlights, and a variety of internal reports including the FHP report on annual pest conditions.
11.2.2 Environmental DNA Sampling for Early Detection of Invasive Species
One technological advance that has the potential to be highly effective in the early detection of invasive species is environ-mental DNA sampling (eDNA). Environmental DNA is the trace DNA in samples of water, soil, or air from shed or elim-inated parts (or the whole) of multiple organisms (Bohmann et al. 2014). Sampling eDNA has been used effectively to detect the presence of endangered (Goldberg et al. 2011; McKelvey et al. 2016) and invasive (Mahon et al. 2013; Wilcox et al. 2013, 2016) species at low densities. While most often used to detect invasive fish and amphibians, eDNA can also be used to detect a suite of other vertebrates including semi-aquatic mammals, terrestrial mammals, and reptiles (Padgett-Stewart et al. 2016; Piaggio et al. 2014; Rodgers and Mock 2015; Schwartz et al. 2017). Most eDNA protocols involve filtering water from streams, rivers, ponds, or oceans to collect DNA for detection of invasive species. However, other approaches involve sampling the soil, honey from beehives, carrion flies, or leeches, all of which may contain traces of target invasive species (reviewed in Bohmann et al. 2014). The key to using eDNA successfully is in the development of the laboratory methods that are sen-sitive to detection of trace amounts of targeted DNA, and in the development of field protocols where the probability of detection and behavior of eDNA under different field condi-tions is accounted for (Jane et al. 2015; Pilliod et al. 2014).
The advantages of sampling eDNA for invasives are the ease at which field sampling can be conducted, and improved sensitivity as compared to traditional sampling approaches used for detecting rare, invasive amphibians and fish (Dejean et al. 2012; Wilcox et al. 2016). Furthermore, no specialized expertise is required to conduct the field sampling, making it ideal for pairing with citizen science. The diagnosis for the invasive species is determined when the sample is brought into the molecular genetics laboratory. In the laboratory, quantitative polymerase chain reaction (qPCR) or droplet digital PCR (ddPCR) can be used to detect one or a few tar-get species with extreme sensitivity. Wilcox et al. (2016) found that samples containing an average of two DNA cop-ies led to positive detections of target invasive species in 72–86% of trials using qPCR. Alternatively, multiple species can be detected simultaneously through metabarcoding and related genomics approaches, which involve high- throughput sequencing of all DNA in the sample. Overall, the combina-tion of sensitivity, reliability, and efficiency afforded by eDNA sampling enhances the potential to expand the
M. Reeves et al.

253
detection and monitoring of invasive species across broad geographic ranges.
11.3 Predicting Occurrence and Spread
Prediction in relation to early detection and intervention, pathway analysis, and risk assessments is covered in Chap. 6. This section is more focused on species occurrence and spread models. Predicting the potential occurrence, suitable habitat, and spread of invasive species encompasses both static and dynamic approaches. To date, static approaches to species distribution models are more common than dynamic approaches, with parameters based on expert-defined rules or statistical estimation of relationships between species occurrence and environmental variables. Logistic regression, for example, is commonly used to model disease occurrence (i.e., presence/absence) at a site (Meentemeyer et al. 2012). Dynamic models allow phenomena to change through time to represent population dynamics and fluctuating behavior of an epidemic. Since they are process-based, dynamic models have the advantage of being applicable for projecting future epidemics. This is a critical advantage over static models since the process driving the invasion (e.g., colonization, establishment, or spread) can be identified. Process informa-tion is critical for management (Simberloff 2009), as approaches to management differ depending on the phase of infestation. For example, the goal of early detection and rapid response (EDRR) programs is to avoid colonization of invasive species, while the prevention of favorable condi-tions (e.g., disturbances) interrupts the spread and domi-nance of invasive species. Necessary precursors to forecast invasions at each phase are (1) the availability of field-based observations from which the spatial distribution can be esti-mated and (2) the demographic data from which population dynamics can be inferred. Spatial distribution data can aid identification of other locations where the species is likely to thrive and become problematic. For some species, distribu-tion data from a species’ native ranges have been collected, but more comprehensive data are needed from native ranges, including life history, genetic, and abundance. Data on demographic transitions, propagule to juvenile, juvenile to reproductive adult, and dispersal mechanisms are also essen-tial to identify both bottlenecks and opportunities in the inva-sion process. Moreover, integrating distributional data (from both native and invaded ranges) with available demographic data could greatly enhance the results of current modeling efforts (Guo et al. 2009; Ibáñez et al. 2009).
High-quality distribution data in exotic ranges (e.g., county-level or FIA program data for forest ecosystems in the United States) are needed, but corresponding distribution data from the native regions are equally important (Guo 2006; Ibáñez et al. 2009). This is based on the hypothesis
(which has been confirmed in many cases) that species with large native ranges are likely to have larger ranges in exotic regions (Guo et al. 2006) (Fig. 11.6) and on the prediction that invasive species may expand their climatic ranges (Broennimann et al. 2007; Ibáñez et al. 2009) (Fig. 11.7).
Once a species has been introduced into a new region, data related to the dispersal of propagules are essential to assess the potential for its spread into new areas. Assessment of the colonization potential depends on the ability of the introduced species to establish without human intervention and to survive and initiate self-sustaining populations. Proliferation of the invasive species to the point where it has a detrimental effect on the native community is dependent on its growth and reproductive capacity (Ricklefs et al. 2008). Thus, demographic data that include a species’ reproduction, survival, growth, and dispersal, and its response to distur-bances and resources, will be critical to model the invasion process (Foxcroft et al. 2011; Gurevitch et al. 2011).
The success of some highly invasive species can be attributed to the rapid changes in their genetics (“rapid evo-lution”) after invading new habitats (Ellstrand 2009; Whitney and Gabler 2008). Currently, the Forest Service is building a database with 29 major life history/genetic trait categories for over 4000 introduced plant species in the United States. Once this work is completed, two ranking systems for all the species can be developed based on (1) current distributions and (2) traits that can indicate future spread (some species with invasive traits now have limited distribution but could spread rather quickly in the future with or without climate change). Albright et al. (2010) dem-onstrate an example of this predictive capability where data collected abroad on the native range of tree of heaven
Fig. 11.6 Diagram showing that native distribution can be used to pre-dict present and future exotic distribution and spread in conjunction with species traits (i.e., life history and genetic elasticity). The position of a particular species in the graph may be determined by multiple fac-tors as discussed in this chapter (e.g., time, rapid evolution, interspecies facilitation, mutualisms). (Modified from Guo (2006))
11 Tools and Technologies for Quantifying Spread and Impacts of Invasive Species

254
(Ailanthus altissima) can be used to estimate potential dis-tribution in the invaded range (Fig. 11.8).
11.3.1 Integrating Available Data into Forecasting Models
Integrated models are analytical approaches that link local demographic/genetic information with coarse-resolution models of environmental suitability into a predictive assessment of species invasion (Ibáñez et al. 2014). Integrated models combine knowledge of the processes that take place during invasions, based mainly on life his-tory/demographic data (e.g., genetics, reproduction, growth, survival, dispersal), along with available distribu-tion data (native and/or invaded ranges). These models are highly flexible and easily adaptable to analyze whatever types of data (e.g., demographic, distributional, observa-tional, experimental) are available. Statistical techniques like hierarchical/multilevel models are highly suitable for use in such integration (Clark and Gelfand 2006; Clark
et al. 2010). Hierarchical models allow the combination of data collected at different temporal and spatial scales. They can also include latent processes that are not directly observed, for example, establishment and reproduction, that are then modeled as a function of the available demo-graphic data. Another advantage of such models is that they can quantify the uncertainty associated with each model component that can then be tracked when invasion forecasts for different scenarios are generated. They can quantify the varying effects of certain variables along gra-dients (e.g., the effect of disturbance along climatic gradi-ents), and can identify and quantify both bottlenecks and windows of opportunity for invasion. These models can produce forecasts of potential impact of invasions at any particular site, from a local to regional scale, and for dif-ferent scenarios of environmental conditions. This infor-mation could be then employed to guide monitoring efforts for early detection of plant invasions. In summary, results from integrated models have the potential for enhancing model realism, explanatory insight, and predictive capabil-ity (Ibáñez et al. 2014).
Fig. 11.7 Distribution and climate data models used to predict inva-sion. Model 1: distribution and climate data from invaded range used to predict invasion in invaded range of Japanese barberry (Berberis thun-bergii). Model 2: distribution and climate data from native range used to
predict invasion in invaded range. Model 3: distribution and climate data from native and invaded ranges used to predict invasion in invaded range. Model 4: model ensemble and standard deviation (SD) about the mean
M. Reeves et al.

255
11.4 Decision-Support Systems
A decision-support system is a program that analyzes data and presents results in a format that supports decision making for management, operations, and planning activities. Though these systems vary greatly in complexity, they generally uti-lize multiple sources of data. The models underlying the data analyses can be developed specifically to address manage-ment questions by involving decision makers and managers
in their development. These tools can predict the dynamics of invasions, including the area invaded through time, and also guide selection of the management activities, monitoring, and treatments that are most likely to result in suitable outcomes (Provencher et al. 2016). Model-based decision-support sys-tems include optimization models and simulation models. Optimization models are computationally difficult, usually require a small spatial extent, and consider minimal alterna-tive actions from which the optimal solution is determined. Conversely, simulation models can be used to address larger areas, and can provide a comparison of a large number of proposed activities. Both types of models have been used to evaluate management activities for buffelgrass (Pennisetum ciliare) in southern Arizona but focused on different aspects of response (Büyüktahtakin et al. 2014). The optimization model attempted to minimize damage over time for an 800-ha area, subject to budget and labor constraints, and focused on where to treat. The simulation models (Frid et al. 2013a; Jarnevich et al. 2015) focused on comparing allocation of resources between inventory and treatment activities and lev-els of activities (resources involved).
Even when sophisticated models of biological invasions are available (Cunniffe et al. 2016), informing and mobiliz-ing stakeholders to use them for making timely decisions is still a challenge (see Chap. 12). Participatory approaches (Reed 2008; Voinov and Bousquet 2010) have been designed to facilitate stakeholder engagement in research and manage-ment of invasive species. Perera et al. (2006) suggest that involving stakeholders (Fig. 11.9) throughout the modeling process maximizes information transfer, helps generate buy- in, and creates advocates for their inclusion in complex cir-cumstances. This conceptual framework—known as participatory modeling (Voinov and Bousquet 2010)—may move participants from passive or didactic learning to expe-riential learning through immersion in what Colella (2000) called the “computational sandbox,” that is, simulations with realism adequate to temporarily suspend disbelief and con-stitute a shared experience.
A new modeling tool called Tangible Landscape (Fig. 11.10), which is being developed at the Center for Geospatial Analytics at North Carolina State University, gives stakeholders the ability to visualize place- and time- dependent management scenarios with real-time feedback (Petrasova et al. 2015). Using simple, tangible gestures on a physical, 3D representation of landscape data (Petrasova et al. 2015), the tool uses simultaneous 3D laser scanning and liquid crystal display (LCD) projection to connect a computational model to a physical 3D model. Tangible Landscape will soon be used to help stakeholders develop collaborative solutions for managing sudden oak death in California. Although these recent efforts in invasive species modeling offer advantages over earlier models, at increas-ingly larger scales of analysis, landscape heterogeneity and diverse patterns of ownership still present significant chal-
Fig. 11.8 Relative suitability for tree of heaven estimated by a simple Bayesian model based on distribution information from the United States and prior parameters derived from China. In the maps, point sym-bols represent occurrence records and areas with different suitabilities (i.e., modeled logit values using posterior parameter estimates). Both suitable and unsuitable areas are divided into quartiles of relative prob-ability (i.e., suitability). (Courtesy of Thomas P. Albright and repro-duced from Albright and others (2010))
11 Tools and Technologies for Quantifying Spread and Impacts of Invasive Species

256
Fig. 11.9 Stakeholder engagement in invasive species research and management. (a) Field crew chemically treats the stumps of recently cut California bay laurel (Umbellularia californica) trees to prevent re-sprouting of this reservoir host species; (b) disease prevention in some areas involves complete removal of host trees located within 15 feet of susceptible oak species; (c) a stakeholder defines a disease management scenario by placing intervention markers on the 3D Tangible Landscape; (d) markers are laser scanned and resulting intervention areas provide real-time input for exploring simulated scenarios of management actions at particular place and time. (Photos courtesy of Ross Meentemeyer)
Fig. 11.10 Overview of the Tangible Landscape system. Photos courtesy of Ross Meentemeyer
M. Reeves et al.

257
lenges. In addition, development and utilization of models is further complicated by the lack of consistency among orga-nizations and agencies in their priorities, data availability, modeling expertise, and ecological classifications.
Although organizations have disparate ideas, programs, and directives for managing invasive species, there is a clear need to improve consistency in data collection, ecological classification, and modeling. The national framework for early detection and rapid response is a positive approach toward consolidating thoughts and actions among agencies (https://www.fws.gov/ficmnew/FICMNEW_EDRR_FINAL.pdf). Another example of publicly accessible citizen science data is the Early Detection and Distribution Mapping System (https://www.eddmaps.org). EDDMapS is the most easily accessible and comprehensive spatially explicit data-base available that describes the extent and magnitude of biological invasions.
Invasive species present a national challenge most effi-ciently addressed through consolidated, all lands approaches,
which necessitates developing more consistent databases for describing ecological processes. Though numerous chal-lenges exist toward realizing this idyllic scenario, in 2013, all major land management agencies participated in the devel-opment of the Interagency Ecological Site Handbook for Rangelands. Ecological sites provide a kind of decision- support and land-classification system that describes the eco-logical potential and ecosystem dynamics of land areas (http://www.ars.usda.gov/Research/docs.htm?docid= 18502). Ecological Site Descriptions provide narratives of each site and most often include conceptual state and transi-tion models (STMs), which are box-and- arrow diagrams that depict vegetation communities (states depicted by boxes) and shifts between them (transitions depicted by arrows) (Bestelmeyer et al. 2004; Westoby et al. 1989) (Fig. 11.11). States can be defined based on vegetation cover types, struc-tural stages, and ages, while transitions are processes or thresholds that shift the vegetation between states, including natural processes (e.g., dispersal, succession, fire) and
Fig. 11.11 (a) Example of how a state and transition model from the Upland Gravelly Loam Ecological Site becomes digitized, and (b) acts as input to a simulation system such as ST-SIM. This site is highly inva-
sible (very low resistance) by cheatgrass. Note that the Reference State with no non-native species is unlikely on this site and is therefore omit-ted from this example digitized model
11 Tools and Technologies for Quantifying Spread and Impacts of Invasive Species

258
anthropogenic processes (e.g., herbicide spraying, grazing, development). These conceptual STMs can be subsequently digitized and converted to state and transition simulation models (STSM) enabling stochastic simulation of ecological processes including invasive species dynamics. State and transition simulation modeling conducted in a quantitative manner is an analytical framework for consolidating resource management issues under different scenarios (Provencher et al. 2016). Additionally, using STSMs to explore the impacts of different assumptions can quantify uncertainty and help guide future research activities, identifying key information that is needed to answer management questions. For example, Jarnevich et al. (2015) developed an STSM for buffelgrass in Ironwood Forest National Monument, AZ, with the states representing cover class categories, and the transitions including growth (increase in abundance), detec-
tion of patches through surveys, and decrease in abundance associated with treatments to control buffelgrass (Fig. 11.12). In this buffelgrass example, Jarnevich et al. (2015) compared invasion over time related to the degree of management occurring in the monument across all lands within the own-ership matrix included in the monument (Fig. 11.13). STSMs have been used to aid decisions for several invasive plant species by assessing whether to prioritize small or large patches for treatment (Frid et al. 2013b; Frid and Wilmshurst 2009) and how to allocate resources between inventory and treatment activities (Frid et al. 2013a; Jarnevich et al. 2015), and for assessing varying amounts and types of treatment (Frid et al. 2013b; Jarnevich et al. 2015). In addition, Provencher et al. (2016) used STSM to investigate manage-ment issues and uncertainty associated with exotic annual Bromus species.
Fig. 11.12 State and transition simulation model for buffelgrass in Ironwood Forest National Monument, AZ. Shown here is the concep-tual model where each box represents the state with regards to buffel-grass cover (uninvaded, seedbank, <5% cover, 5–50% cover, or >50% cover; right to left) and detection (undetected or detected; top to bot-
tom). The color-coded arrows represent different types of transitions including growth (invasion, establishment, spread), detection (failure and success), and management (treatment and maintenance failure and success). Solid lines represent success; dotted lines represent failure
Fig. 11.13 Simulation model results for 11 “what if” management scenarios (A to K) showing area invaded after 20 simulated years on the y-axis and cumulative cost of management activities (varying amounts of intensive field surveys, vehicle- mounted herbicide spraying, backpack herbicide spraying, volunteer hand pulling, contract hand pulling, helicopter herbicide spraying, and follow-up maintenance of buffelgrass) over a 20-year period on the x-axis. (Figures adapted from Jarnevich and others (2015))
M. Reeves et al.

259
The increase in availability of STMs associated with eco-logical sites, combined with new spatially explicit simula-tion models, such as those developed with the ecological modeling software ST-SIM (http://www.apexrms.com/), provides an emerging toolset capable of estimating the effects of management and climate on biological invasions across the United States (Daniel et al. 2016). Although Ecological Sites are works in progress, they represent a potentially cost-effective framework that is applicable on an interagency basis for local to regional simulation of how invasive species respond to disturbances.
11.5 Genetic Tools to Accelerate Restoration and Facilitate Management
Advances in technology have provided a plethora of genetic- based tools that can be used to facilitate management of genetic resources and/or advance restoration efforts by accel-erating breeding programs aimed at developing planting stock with resistance to invasive insects and pathogens. Genetic markers, pieces of DNA that can be used to distin-guish an individual, population, or species, can facilitate management of genetic resources. Such markers can also be used to identify locations in the genome that contain genes for desired traits such as resistance. Breeding can be acceler-ated by using genetic markers to select for desired traits instead of labor-intensive, costly, long-term classic pheno-typing methods (evaluating traits and performance over time), a process known as indirect selection. Genes that have been identified as having a role in flowering can be used to accelerate breeding by inducing early flowering so that breeding can be done without waiting years or decades for a superior tree to reach sexual maturity so that it can serve as a parent. Genetic engineering is a tool that can introduce genes, such as those to induce early flowering or even those that would confer resistance, into a plant to produce trans-genic trees that express these desired traits. Advances in technology that allow rapid sequencing of the DNA that incorporates the entire genome of a tree, referred to as next- generation sequencing or high-throughput sequencing, have advanced our abilities to develop genetic markers and to identify genes and even differences in the ways these genes are expressed (called transcriptomics) that may play a role in resistance. In this section, we provide a brief overview of genetic tools, their potential uses in restoration and manage-ment, and their current limitations.
Common examples of genetic markers include SSRs (simple sequence repeats) and SNPs (single nucleotide poly-morphism). These important tools can improve efficiencies of conventional breeding programs through a variety of applications, including the evaluation of genetic diversity in
breeding populations; the confirmation and tracking of iden-tity, parentage, and relatedness; and the assessment of pollen flow/contamination in seed orchards (Neale and Kremer 2011; Porth and El-Kassaby 2014). Breeding can be a long- term process in forest trees, with some species requiring a decade or more to reach reproductive status. Technical advances in sequencing DNA have significantly reduced the costs of obtaining thousands of markers that are dispersed throughout the genome. The ability to achieve such dense genome coverage can provide information on genetic varia-tion relevant to a desired phenotype through the development of indirect selection techniques, including marker assisted selection (MAS) and genomic selection (GS). These two tools can potentially streamline the conventional breeding process by allowing the breeder to use markers to “pre- select” trees at a young age, or to select parent trees directly from natural stands. Pre-selection will help by minimizing the number of trees whose phenotypes will need to be care-fully confirmed over a range of time and environments.
Markers linked to traits for use in traditional MAS are identified through the development of a genetic linkage map which relies on analyzing patterns of segregation of markers from parents to progeny to identify the number of linkage groups and to place markers in an orderly fashion on each group. Markers that are closer together are more likely to be inherited together in the progeny. Many different genes may contribute to expression of the desired trait. The process of identifying markers associated with the region of the genome that contains each of these genes, called a quantitative trait locus (QTL), is referred to as QTL analysis. Despite the enormous investment in resources that have been expended to identify markers, very few operational breeding programs for either crops or trees use MAS (Isik 2014; Muranty et al. 2014; Neale and Kremer 2011; Xu and Crouch 2008). Several factors have contributed to this, but often markers associated with QTLs are identified in studies using a rela-tively small number of progeny, and consequently they may not be useful when tested in other families because the mark-ers are not located sufficiently close to the genes responsible for the trait of interest (Nilausen et al. 2016). In addition, traits like resistance are often complex, so it can be difficult to detect all the different loci involved. Development of an operational MAS system is more likely to be successful when conducted in conjunction with an existing breeding program that has access to carefully phenotyped progeny and parents.
Breeding programs that do successfully employ MAS in trees, for example, those associated with domesticated fruit and nut producing species, are typically tracking a single locus or a small number of loci with very large effect, including major gene resistance (Ru et al. 2015; Sathuvalli et al. 2011). A common use of MAS in crops and fruit trees is pyramiding multiple major effect resistance alleles, which
11 Tools and Technologies for Quantifying Spread and Impacts of Invasive Species

260
is difficult using traditional phenotyping methods (Muranty et al. 2014; Ru et al. 2015). In forest tree species, a poten-tially useful application of MAS would be for within family selection in dealing with rapidly evolving pathogens, such as white pine blister rust, and when the goal is to pyramid major gene resistance with quantitative resistance to increase dura-bility of resistance (Sniezko et al. 2011).
Another type of indirect selection known as genomic selection (GS) does not require identification of specific marker-trait associations of individual QTLs. Instead, GS relies on phenotyping and using such a high density of mark-ers to genotype a large enough sample of the breeding popu-lation (called the training population) that the majority of loci that contribute to a quantitative trait are closely located to one or more markers. The effects of all markers are then estimated simultaneously (unlike MAS) and used to predict genomic breeding values in a test population without needing pheno-typic data (Jannink et al. 2010; ReSende et al. 2012). Although GS is routinely used in animal breeding programs (Hayes and Goddard 2010), and has been used successfully in crop breed-ing programs (Lorenzana and Bernardo 2009), the strategy has only been tested in forest trees in simulation studies (Grattapaglia and Resende 2011; Iwata et al. 2011) and in preliminary trials (Resende et al. 2012; Zapata-Valenzuela et al. 2013). The studies in forest trees show promise but the results should be interpreted with caution because studies were conducted in small populations; additional ‘proof of concept’ studies need to be performed using larger popula-tions (Plomion et al. 2016). Successful application of GS to forest tree breeding will ultimately require correlating thou-sands or even hundreds of thousands of markers with a desired phenotype in a sufficiently large training population in order to develop models to select the best performing trees in the breeding population. Both training and breeding populations need to have undergone at least some breeding and been care-fully phenotyped for resistance, a genetic resource that likely will only be available in the most advanced forest tree breed-ing programs (Isik 2014; Jannink et al. 2010; Zapata-Valenzuela et al. 2013). Analysis of the economic feasibility of incorporating GS is also needed before it will be accepted for widespread use in forest tree breeding programs (Plomion et al. 2016).
Another tool that can accelerate breeding is the use of genetic engineering to induce early flowering. Transgenic approaches to manipulate flowering have been developed in many woody plants and, because the effect of early flowering caused by the introduction of the transgene is dominant, it is only required in one parent and can be selected against in the progeny so that the final selected genotype is not transgenic (Van Nocker and Gardiner 2014). New technology, using a virus as a vector to introduce genes that control flowering, has been used successfully to produce early flowering apple and pear trees (Yamagishi et al. 2016). A simple heat treat-
ment can be used to eliminate the viral vector from resultant seedlings. Successful application of this technology in forest trees offers the potential to reduce breeding cycles from sev-eral decades to mere months.
Although it is commonly asserted that the use of genetic engineering to insert a gene to develop a transgenic plant that conveys resistance to an insect or disease is a quicker, less expensive alternative to traditional breeding, this is not necessarily the case. It takes an estimated timeframe of 7–24 years (average 13.1 years) to discover, develop, and obtain regulatory authorization to distribute seed for a crop plant carrying a new transgenic trait, and an average cost of $136 million (McDougall 2011). Despite this investment, resistance based on a single transgene can sometimes be overcome or inactivated or have unintended fitness costs (Finnegan and McElroy 1994; Gurr and Rushton 2005; Tabashnik and Carriere 2017; Tian et al. 2003). In the case of forest tree species, it is not possible yet to do an accurate cost assessment because a transgenic forest tree has not yet obtained authorization to be released into natural forests. Development and deployment of a transgenic forest tree will likely require a similar investment of time and money. In addition, once a transgenic tree is produced, it will be necessary to incorporate genetic diversity adequate to main-tain the adaptive capacity to multiple stresses and environ-ments through traditional breeding (Steiner et al. 2016). Transgenic technology alone cannot replace a breeding pro-gram, rather successful deployment of transgenics (assum-ing regulatory approval) for restoration purposes will depend on the existence of a breeding program, the possible exception being industrial forestry plantations or horticul-tural cultivars, where it may be appropriate to deploy mate-rial with limited genetic diversity. The same would be true if the new genome editing technologies, such as CRISPR-Cas9, were used to develop a resistant tree (Puchta 2016). Unlike the development of a resistant plant through trans-genics, genome editing directly alters specific genes in the genome. This requires extensive basic knowledge about the number and function of genes involved in the trait being altered (i.e., susceptible altered to become resistant) that is not always available and can take years or even decades of research to acquire. Genetic engineering through transgen-ics or genome editing is a valuable tool that can facilitate the study and confirmation of gene function. Once the neces-sary basic knowledge is accumulated, development of a resistant tree through transgenics or genome editing may be possible but should only be pursued in conjunction with a breeding program if the ultimate goal is restoration using resistant planting stock.
Transcriptomics, the process of sequencing expressed genes to evaluate the level of gene expression, is a genomic tool used to study patterns of differential gene expression in forest trees, often with the goal of identifying candidate genes
M. Reeves et al.

261
involved in resistance to insects and diseases, for potential downstream utility in developing markers for implementation in breeding programs, or for use in developing transgenic trees with resistance (Bai et al. 2011; Barakat et al. 2009). However, a recent review article by Feder and Walser (2005) concluded that using transcriptomics to compare gene expres-sion patterns in plants exposed to a stress (abiotic or biotic), or to identify the genes responsible for a specific phenotype or response to the stress, such as resistance, is rarely success-ful. This can be explained because the measured differences in expression levels of genes do not accurately predict abun-dance or activity of the resulting proteins that are produced from these expressed genes (Feder and Walser 2005). The authors recommended employing a careful cost/benefit anal-ysis prior to employing such a strategy.
Many of the genomic tools and technologies that we have presented are in their infancy and have not yet been widely implemented; additionally, thorough review of their useful-ness and success over the long term is not always available. An analysis of the benefits derived from utilizing many of these techniques, relative to the significant financial invest-ment required to develop them, is lacking. Ultimately, tech-nological advances will undoubtedly reduce the cost of many of these tools, and continued research will lead to improved rates of success, but it’s also important to remember that, although these technologies have the potential to accelerate restoration, (breeding), they are not essential for implement-ing a successful breeding program. The vast majority of breeding programs (see Table 8.1 in Chap. 8) have achieved success without the use of genomic tools. It is of equal importance to note that an active breeding program is a pre-requisite for the successful development and implementation of these genetic tools. Investment in both technology/tool development and traditional breeding programs is essential for providing the appropriate genetic tools that can facilitate the accelerated and cost-effective production of resistant planting stock needed to manage and restore forests impacted by invasive insects and diseases.
11.6 Key Findings, Information Needs, and Opportunities
Advances in biotechnology have produced genetic tools with the potential to accelerate the production of resistant plant-ing stock for restoration. However, these tools cannot replace the need for traditional breeding programs, and, in fact, they depend upon such programs for their efficient and effective development and implementation or deployment. Forest managers and tree breeders will need to weigh public opin-ion as well as the costs and benefits of such tools before adopting them. Continued technical developments may help decrease costs in the future.
Improvements in computational resources and model complexity have enhanced the ability of managers and scien-tists to evaluate the extent and magnitude of invasive species. This situation is exemplified by FHP and other national sys-tems that provide essential monitoring of forest conditions. In addition, these improvements have led to greater use of models to forecast potential future conditions. Overall avail-ability of data and modeling is better in forested ecosystems relative to other ecosystems, suggesting that there is a sig-nificant opportunity and need for improved modeling, data collection, and mapping in non-forested systems, including aquatic habitats.
The most significant gap consistently identified across the numerous disciplines discussed in this chapter is the relative paucity of spatially referenced data describing the extent and magnitude of invasive species, especially on non-forested lands. A consistent, comprehensive, easily accessible data-base provides the underpinning for identifying new out-breaks, calibrating and validating models, improving remote sensing analyses, and monitoring management effectiveness. US land management agencies do not currently perform con-sistent annual inventory and monitoring of non-forested landscapes; however, the situation is slowly changing. For example, the FIA program has established protocols for non- forested landscapes very similar to the forested data collec-tion, but less than 1% of the FIA plots represent non-forested landscapes (All Conditions Inventory). In 2011, the Bureau of Land Management began data collection for the Assessment, Inventory, and Monitoring (AIM) project. To date, data have been collected on about 5000 “national” and 4000 “project” plots. National and field office–collected AIM plots use the same protocols and can be used to report the same AIM core indicators regarding terrestrial ecosys-tems. National plots are designed, however, to yield a statis-tically valid sample that can be used to derive inferences across the landscape, like FIA. The situation is considerably better on privately owned landscapes where the USDA Natural Resources Conservation Service supports and main-tains the National Resources Inventory (USDA 2015, ~20,000 plots), which includes non-forested plots. Non- forested lands of the coterminous United States occupy roughly 268 million ha (Reeves and Mitchell 2011), of which approximately 166 million ha are privately owned (USDA 2015), indicating that there is approximately 1 plot every 83 km2 of privately owned land that is non-forested (assum-ing an even distribution). Given that many of these plots are unevenly distributed, many vegetation types and regions of the country are considerably unrepresented, and therefore many new invasions may go unnoticed. On 3 October 2016, the search words of “FIA invasive species” with Google yielded ~41,000 results. This suggests that regular, consis-tent, and comprehensive data collection could be invaluable. Considering the large number of publications, reports, and
11 Tools and Technologies for Quantifying Spread and Impacts of Invasive Species

262
analyses supported by FIA, it follows that a program designed to acquire data (or simply an expansion of existing programs) on the roughly 268 million ha of non-forested land (Reeves and Mitchell 2011) could be equally invaluable.
Although an improved strategy for combatting invasive species would include a consolidated, interagency, publicly available, spatially explicit database, other noteworthy gaps were identified during the conduct of this assessment. These gaps can be classified in one of three categories including data limitations, institutional limitations, or a combination of these. With respect to data limitations (data gathering, dis-semination, and analysis), these gaps are generally summa-rized as:
• Lack of consistency among stakeholders with image data processing, cataloging, and distribution
• Lack of consistency among stakeholders with data collec-tion protocols (e.g., many habitats go unsampled each year) and data storage and distribution
With respect to institutional limitations, gaps are gener-ally summarized as:
• Lack of interagency communication and cooperation• Lack of shared vision and priorities• Lack of consistency in data collection protocols, data
storage, distribution, and sharing (including both georef-erenced plot data and image data)
The existence of these gaps does not automatically sug-gest that more programs are needed, but it does indicate that there is a need for greater sharing, communication, and col-laboration. If all stakeholders and management agencies could define priorities nationally, and then regionally define strategies and tactics, this could foster more efficient data acquisition and analysis and ultimately enhance the control of invasive species.
Literature Cited
Albright TP, Chen H, Chen LJ et al (2010) The ecological niche and reciprocal prediction of the disjunct distribution of an inva-sive species: the example of Ailanthus altissima. Biol Invasions 12:2413–2427
Anderson K, Gaston KJ (2013) Lightweight unmanned aerial vehicles will revolutionize spatial ecology. Front Ecol Environ 11:138–146
Asner GP (2001) Cloud cover in Landsat observations of the Brazilian Amazon. Int J Remote Sens 22:3855–3862
Asner GP, Hughes RF, Vitousek PM et al (2008a) Invasive plants trans-form the three-dimensional structure of rain forests. Proc Natl Acad Sci U S A 105:4519–4523
Asner GP, Jones MO, Martin RE et al (2008b) Remote sensing of native and invasive species in Hawaiian forests. Remote Sens Environ 112:1912–1926
Bai X, Rivera-Vega L, Mamidala P et al (2011) Transcriptomic signa-tures of ash (Fraxinus spp.) phloem. PLoS One 6:1–12
Barakat A, DiLoreto DS, Zhang Y et al (2009) Comparison of tran-scriptomes of American chestnut (Castanea dentata) and Chinese chestnut (Castanea mollissima) in response to the chestnut blight infection. BMC Plant Biol 9:51
Bestelmeyer BT, Herrick JE, Brown JR et al (2004) Land management in the American Southwest: a state-and-transition approach to eco-system complexity. Environ Manag 34:38–51
Blumenthal D, Booth DT, Cox SE et al (2007) Large-scale aerial images capture details of invasive plant populations. Rangel Ecol Manag 60:523–528
Blumenthal DM, Norton AP, Cox SE et al (2012) Linaria dalmatica invades south-facing slopes and less grazed areas in grazing-tolerant mixed-grass prairie. Biol Invasions 14:395–404
Bohmann K, Evans A, Gilbert MTP et al (2014) Environmental DNA for wildlife biology and biodiversity monitoring. Trends Ecol Evol 29:358–367
Booth DT, Cox SE (2008) Image-based monitoring to measure ecologi-cal change in rangeland. Front Ecol Environ 6:185–190
Booth DT, Cox SE, Teel D (2010) Aerial assessment of leafy spurge (Euphorbia esula L.) on Idaho’s deep fire burn. Nativ Plants J 11:327–340
Boyte SP, Wylie BK, Major DJ (2015) Mapping and monitoring cheat-grass dieoff in rangelands of the northern Great Basin, USA. Rangel Ecol Manag 68:18–28
Boyte SP, Wylie BK, Major DJ (2016) Cheatgrass percent cover change: comparing recent estimates to climate change driven predictions in the northern Great Basin. Rangel Ecol Manag 69:265–279
Bradley BA (2014) Remote detection of invasive plants: a review of spectral, textural and phenological approaches. Biol Invasions 16:1411–1425
Bradley BA, Mustard JF (2005) Identifying land cover variability dis-tinct from land cover change: Cheatgrass in the Great Basin. Remote Sens Environ 94:204–213
Bradley BA, Mustard JF (2006) Characterizing the landscape dynamics of an invasive plant and risk of invasion of invasion using remote sensing. Ecol Appl 16:1132–1147
Broennimann O, Treier UA, Müller-Schärer H et al (2007) Evidence of climatic niche shift during biological invasion. Ecol Lett 10:701–709
Brown JF, Howard D, Wylie B et al (2015) Application-ready expedited MODIS data for operational land surface monitoring of vegetation condition. Remote Sens 7:16226–16240
Büyüktahtakin İE, Feng Z, Olsson AD et al (2014) Invasive species control optimization as a dynamic spatial process: an application to buffelgrass (Pennisetum ciliare) in Arizona. Invasive Plant Sci Manag 7:132–146
Calviño-Cancela M, Méndez-Rial R, Reguera-Salgado J et al (2014) Alien plant monitoring with ultralight airborne imaging spectros-copy. PLoS One 9:e102381
Chastain RA, Fisk H, Ellenwood JR et al (2015a) Near-real time deliv-ery of MODIS-based information on forest disturbances. In: Lippitt CD, Stow DA, Coulter LL (eds) Time sensitive remote sensing. Springer, New York, pp 147–164
Chastain RA, Housman I, Finco M (2015b) Forest health protec-tion operational remote sensing: algorithm development and pilot study area assessments, RSAC-10107-RPT1. U.S. Department of Agriculture, Forest Service, Remote Sensing Applications Center, Salt Lake City, 34 p
Chen G, Hay GJ (2011) A support vector regression approach to esti-mate forest biophysical parameters at the object level using airborne LiDAR transects and QuickBird data. Photogramm Eng Remote Sens 77:733–741
Chen G, Hay GJ, Castilla G et al (2011) A multiscale geographic object- based image analysis to estimate lidar-measured forest canopy height using QuickBird imagery. Int J Geogr Inf Sci 25:877–893
M. Reeves et al.

263
Chen G, Hay GJ, Carvalho LMT, Wulder MA (2012) Object-based change detection. Int J Remote Sens 33:4434–4457
Chen G, Metz MR, Rizzo DM et al (2015) Object-based assessment of burn severity in diseased forests using high-spatial and high- spectral resolution MASTER airborne imagery. ISPRS J Photogramm Remote Sens 102:38–47
Cheng T, Rivard B, Sánchez-Azofeifa GA et al (2010) Continuous wave-let analysis for the detection of green attack damage due to moun-tain pine beetle infestation. Remote Sens Environ 114:899–910
Clark JS, Gelfand AEE (2006) Hierarchical modelling for the envi-ronmental sciences statistical methods and applications. Oxford University Press, Oxford, 205 p
Clark JS, Bell D, Chu C et al (2010) High-dimensional coexistence based on individual variation: a synthesis of evidence. Ecol Monogr 80:569–608
Clinton NE, Potter C, Crabtree B et al (2010) Remote sensing-based time-series analysis of cheatgrass (Bromus tectorum L.) phenology. J Environ Qual 39:955–963
Colella V (2000) Participatory simulations: building collaborative understanding through immersive dynamic modeling. J Learn Sci 9:471–500
Coops N, Stanford M, Old K et al (2003) Assessment of dothistroma needle blight of Pinus radiata using airborne hyperspectral imagery. Ecol Epidemiol 93:1524–1532
Coops NC, Wulder MA, Iwanicka D (2009) Large area monitoring with a MODIS-based Disturbance Index (DI) sensitive to annual and sea-sonal variations. Remote Sens Environ 113:1250–1261
Crall AW, Newman GJ, Stohlgren TJ et al (2011) Assessing citizen science data quality: an invasive species case study. Conserv Lett 4:433–442
Cunniffe NJ, Cobb RC, Meentemeyer RK et al (2016) Modeling when, where, and how to manage a forest epidemic, motivated by sudden oak death in California. Proc Natl Acad Sci U S A 113:5640–5645
Daniel C, Frid L, Sleeter B et al (2016) State-and-transition simulation models: a framework for forecasting landscape change. Methods Ecol Evol 7:1413–1423
Darwall WRT, Dulvy NK (1996) An evaluation of the suitability of non-specialist volunteer researchers for coral reef fish surveys. Mafia Island, Tanzania: a case study. Biol Conserv 78:223–231
Dejean T, Valentini A, Miquel C et al (2012) Improved detection of an alien invasive species through environmental DNA barcoding: the example of the American bullfrog Lithobates catesbeianus. J Appl Ecol 49:953–959
Delaney DG, Sperling CD, Adams CS et al (2008) Marine invasive species: validation of citizen science and implications for national monitoring networks. Biol Invasions 10:117–128
Duniway MC, Karl JW, Schrader S et al (2012) Rangeland and pasture monitoring: an approach to interpretation of high-resolution imag-ery focused on observer calibration for repeatability. Environ Monit Assess 184:3789–3804
Ellstrand NC (2009) Evolution of invasiveness in plants following hybridization. Biol Invasions 11:1089–1091
Evangelista PH, Young NE, Schofield PJ et al (2017) Modeling suit-able habitat of invasive red lionfish Pterois volitans (Linnaeus, 1758) in North and South America’s coastal waters. Aquat Invasions 11:313–326
Everitt JH, Anderson GL, Escobar DE et al (1995) Use of remote sens-ing for detecting and mapping leafy spurge (Euphorbia esula). Weed Technol 9:599–609
Everitt JH, Escobar DE, Alaniz MA et al (1996) Using spatial infor-mation technologies to map Chinese tamarisk (Tamarix chinensis) infestations. Weed Sci 44:194–201
Everitt JH, Yang C, Deloach CJ (2005) Remote sensing of giant reed with QuickBird satellite imagery. J Aquat Plant Manag 43:81–85
Feder ME, Walser JC (2005) The biological limitations of transcriptomes in elucidating stress and stress responses. J Evol Biol 18:901–910
Finnegan J, McElroy D (1994) Transgene inactivation: plants fight back! Biotechnology 12:883–888
Fore LS, Paulsen K, O’Laughlin K (2001) Assessing the performance of volunteers in monitoring streams. Freshw Biol 46:109–123
Foxcroft LC, Pickett STA, Cadenasso ML (2011) Expanding the con-ceptual frameworks of plant invasion ecology. Perspect Plant Ecol Evol Syst 13:89–100
Frid L, Wilmshurst JF (2009) Decision analysis to evaluate control strat-egies for crested wheatgrass (Agropyron cristatum) in Grasslands National Park of Canada. Invasive Plant Sci Manag 2:324–336
Frid L, Hanna D, Korb N et al (2013a) Evaluating alternative weed management strategies for three Montana landscapes. Invasive Plant Sci Manag 6:48–59
Frid L, Holcombe T, Morisette JT et al (2013b) Using state and transi-tion modeling to account for imperfect knowledge in invasive spe-cies management. Invasive Plant Sci Manag 6:36–47
Fuller D (2005) Remote detection of invasive Melaleuca trees (Melaleuca quinquenervia) in South Florida with multispectral IKONOS imagery. Int J Remote Sens 26:1057–1063
Goldberg CS, Pilliod DS, Arkle RS et al (2011) Molecular detection of vertebrates in stream water: a demonstration using Rocky Mountain tailed frogs and Idaho giant salamanders. PLoS One 6:e22746
Grattapaglia D, Resende MDV (2011) Genomic selection in forest tree breeding. Tree Genet Genomes 7:241–255
Guo Q (2006) Intercontinental biotic invasions: what can we learn from native populations and habitats? Biol Invasions 8:1451–1459
Guo Q, Qian H, Ricklefs RE et al (2006) Distributions of exotic plants in eastern Asia and North America. Ecol Lett 9:827–834
Guo QF, Falcone J, Brownsmith J (2009) Building the database for introduced plants in the United States. In: McManus KA, Gottschalk KW (eds) Proceedings of 20th U.S. department of agriculture inter-agency research forum on invasive species, Gen. Tech. Rep. NRS- P- 51. USDA, Forest Service, Annapolis, 73 p
Gurevitch J, Fox GA, Wardle GM et al (2011) Emergent insights from the synthesis of conceptual frameworks for biological invasions. Ecol Lett 14:407–418
Gurr SJ, Rushton PJ (2005) Engineering plants with increased dis-ease resistance: what are we going to express? Trends Biotechnol 23:275–282
Haas SE, Cushman JH, Dillon WW et al (2016) Effects of individual, community, and landscape drivers on the dynamics of a wildland forest epidemic. Ecology 97:649–660
Hawthorne TL, Elmore V, Strong A et al (2015) Mapping non-native invasive species and accessibility in an urban forest: a case study of participatory mapping and citizen science in Atlanta, Georgia. Appl Geogr 56:187–198
Hayes B, Goddard M (2010) Genome wide association and genomic selection in animal breeding. Genome 53:876–883
Huang C, Asner GP (2009) Applications of remote sensing to alien invasive plant studies. Sensors 9:4869–4889
Ibáñez I, Silander JA, Wilson AM et al (2009) Multi-variate fore-casts of potential distribution of invasive plant species. Ecol Appl 19:359–375
Ibáñez I, Diez JM, Miller LP et al (2014) Integrated assessment of bio-logical invasions. Ecol Appl 24:25–37
Isik F (2014) Genomic selection in forest tree breeding: the concept and an outlook for the future. New For 45:379–401
Iwata H, Hayashi T, Tsumura Y (2011) Prospects for genomic selection in conifer breeding: a simulation study of Cryptomeria japonica. Tree Genet Genomes 7:747–758
Jane SF, Wilcox TM, McKelvey KS et al (2015) Distance, flow and PCR inhibition: eDNA dynamics in two headwater streams. Mol Ecol Resour 15:216–227
Jannink JL, Lorenz AJ, Iwata H (2010) Genomic selection in plant breeding: from theory to practice. Brief Funct Genomics 9:166–177
11 Tools and Technologies for Quantifying Spread and Impacts of Invasive Species

264
Jarnevich CS, Holcombe TR, Cullinane Thomas C et al (2015) Simulating long-term effectiveness and efficiency of management scenarios for an invasive grass. AIMS Environ Sci 2:427–447
Jenkerson CB, Maiersperger TK, Schmidt GL (2010) eMODIS – a user-friendly data source, U.S. Geological Survey Open-File Report 2010-1055, Reston
Kattge J, Knorr W, Raddatz T, Wirth C (2009) Quantifying photosyn-thetic capacity and its relationship to leaf nitrogen content for global- scale terrestrial biosphere models. Glob Chang Biol 15:976–991
Kelly M, Meentemeyer RK (2002) Landscape dynamics of the spread of sudden oak death. Photogramm Eng Remote Sens 68:1001–1009
Knipling EB (1970) Physical and physiological basis for the reflectance of visible and near-infrared radiation from vegetation. Remote Sens Environ 1:155–159
Laba M, Downs R, Smith S et al (2008) Mapping invasive wetland plants in the Hudson River National Estuarine Research Reserve using QuickBird satellite imagery. Remote Sens Environ 112:286–300
Laurent EJ, Shi H, Gatziolis D et al (2005) Using the spatial and spec-tral precision of satellite imagery to predict wildlife occurrence pat-terns. Remote Sens Environ 97:249–262
Lim K, Treitz P, Wulder M et al (2003) LiDAR remote sensing of forest structure. Prog Phys Geogr 27:88–106
Lodge DM, Williams S, MacIsaac HJ et al (2006) Biological inva-sions: recommendations for US policy and management. Ecol Appl 16:2035–2054
Lorenzana RE, Bernardo R (2009) Accuracy of genotypic value pre-dictions for marker-based selection in biparental plant populations. Theor Appl Genet 120:151–161
Mahon AR, Jerde CL, Galaska M et al (2013) Validation of eDNA sur-veillance sensitivity for detection of Asian carps in controlled and field experiments. PLoS One 8:e58316
McCord SE, Buenemann M, Karl JW et al (2017) Integrating remotely sensed imagery and existing multiscale field data to derive range-land indicators: application of Bayesian additive regression trees. Rangel Ecol Manag 70:644–655
McCormick CM (1999) Mapping exotic vegetation in the Everglades from large-scale aerial photographs. Photogramm Eng Remote Sens 65:179–184
McDougall Phillips, consultants (2011) The cost and time involved in the discovery, development and authorization of a new plant biotechnol-ogy derived trait. A Consultancy Study for Crop Life International. 24 p. https://croplife.org/wp-content/uploads/2014/04/Getting-a-Biotech-Crop-to-Market-Phillips-McDougall-Study.pdf.
McKelvey KS, Young MK, Knotek WL et al (2016) Sampling large geographic areas for rare species using environmental DNA: a study of bull trout (Salvelinus confluentus) occupancy in western Montana. J Fish Biol 88:1215–1222
McNeil BE, de Beurs KM, Eshleman KN et al (2007) Maintenance of ecosystem nitrogen limitation by ephemeral forest disturbance: an assessment using MODIS, Hyperion, and Landsat ETM+. Geophys Res Lett 34:1–5
Mealor BA, Cox S, Booth DT (2012) Postfire downy brome (Bromus tectorum) invasion at high elevations in Wyoming. Invasive Plant Sci Manag 5:427–435
Meddens AJH, Hicke JA, Vierling LA (2011) Evaluating the potential of multispectral imagery to map multiple stages of tree mortality. Remote Sens Environ 115:1632–1642
Meentemeyer RK, Haas SE, Václavík T (2012) Landscape epidemiol-ogy of emerging infectious diseases in natural and human-altered ecosystems. Annu Rev Phytopathol 50:379–402
Muranty H, Jorge V, Bastien C et al (2014) Potential for marker-assisted selection for forest tree breeding: lessons from 20 years of MAS in crops. Tree Genet Genomes 10:1491–1510
Neale DB, Kremer A (2011) Forest tree genomics: growing resources and applications. Nat Rev Genet 12:111–122
Nevada Natural Heritage Program, State of Nevada (2015). Available at http://heritage.nv.gov/gis. Last Accessed 1 Sept 2015
Nilausen C, Gelinas N, Bull G (2016) Perceived acceptability of implementing marker-assisted selection in the forests of British Columbia. Forests 7:1–9
Noujdina NV, Ustin SL (2008) Mapping downy brome (Bromus tecto-rum) using multidate AVIRIS data. Weed Sci 56:173–179
Padgett-Stewart TM, Wilcox TM, Carim KJ et al (2016) An eDNA assay for river otter detection: a tool for surveying a semi-aquatic mammal. Conserv Genet Resour 8:5–7
Pearlstine L, Portier KM, Smith SE (2005) Textural discrimination of an invasive plant, Schinus terebinthifolius, from low altitude aerial digital imagery. Photogramm Eng Remote Sens 71:289–298
Perera A, Buse A, Crow T (2006) Knowledge transfer in forest land-scape ecology: a primer. In: Perera A, Buse L, Crow T (eds) Forest landscape ecology. Transferring knowledge into practice. Springer, New York, pp 1–18
Peterson EB (2003) Mapping percent-cover of the invasive species Bromus tectorum (Cheatgrass) over a large portion of Nevada from satellite imagery. U.S. Fish and Wildlife Service, Nevada State Office, Reno, Carson City, 40 p
Peterson EB (2007) A map of annual grasses in the Owyhee Uplands, Spring 2006, derived from multitemporal Landsat 5 TM imagery. U.S. Department of Interior, Bureau of Land Management, Nevada State Office, Reno, Carson City, 32 p
Petrasova A, Harmon B, Petras V et al (2015) Tangible modeling with open source GIS. Springer, Cham, 202 p
Piaggio AJ, Engeman RM, Hopken MW et al (2014) Detecting an elu-sive invasive species: a diagnostic PCR to detect Burmese python in Florida waters and an assessment of persistence of environmental DNA. Mol Ecol Resour 14:374–380
Pilliod DS, Goldberg CS, Arkle RS et al (2014) Factors influencing detection of eDNA from a stream-dwelling amphibian. Mol Ecol Resour 14:109–116
Plomion C, Bastien C, Bogeat-Triboulot MB et al (2016) Forest tree genomics: 10 achievements from the past 10 years and future pros-pects. Ann For Sci 73:77–103
Porth I, El-Kassaby YA (2014) Assessment of the genetic diversity in forest tree populations using molecular markers. Diversity 6:283–295
Provencher L, Frid L, Czembor C, Morisette JT (2016) State-and- transition models: conceptual versus simulation perspectives, use-fulness and breadth of use, and land management applications. In: Germino M, Chambers J, Brown C (eds) Exotic brome-grasses in arid and semiarid ecosystems of the western US. Springer, Cham, pp 371–407
Pu R, Kelly M, Anderson GL et al (2008) Using CASI hyperspectral imagery to detect mortality and vegetation stress associated with a new hardwood forest disease. Photogramm Eng Remote Sens 74:65–75
Puchta H (2016) Using CRISPR/Cas in three dimensions: towards synthetic plant genomes, transcriptomes and epigenomes. Plant J 87:5–15
Reed MS (2008) Stakeholder participation for environmental manage-ment: a literature review. Biol Conserv 141:2417–2431
Reeves MC, Mitchell JE (2011) Extent of coterminous US rangelands: quantifying implications of differing agency perspectives. Rangel Ecol Manag 64:1–12
Resende MDV, Resende MFR, Sansaloni CP et al (2012) Genomic selection for growth and wood quality in Eucalyptus: capturing the missing heritability and accelerating breeding for complex traits in forest trees. New Phytol 194:116–128
Ricklefs RE, Guo Q, Qian H (2008) Growth form and distribution of introduced plants in their native and non-native ranges in Eastern Asia and North America. Divers Distrib 14:381–386
Rodgers TW, Mock KE (2015) Drinking water as a source of environ-mental DNA for the detection of terrestrial wildlife species. Conserv Genet Resour 7:693–696
M. Reeves et al.

265
Rose RA, Byler D, Eastman JR et al (2015) Ten ways remote sensing can contribute to conservation. Conserv Biol 29:350–359
Ru S, Main D, Evans K et al (2015) Current applications, challenges, and perspectives of marker-assisted seedling selection in Rosaceae tree fruit breeding. Tree Genet Genomes 11:8
Saatchi SS, Harris NL, Brown S (2011) Benchmark map of forest car-bon stocks in tropical regions across three continents. Proc Natl Acad Sci U S A 108:9899–9904
Sathuvalli VR, Mehlenbacher SA, Smith DC (2011) DNA markers linked to eastern filbert blight resistance from a hazelnut selection from the Republic of Georgia. J Am Soc Hortic Sci 136:350–357
Schwartz MK, Penaluna BE, Wilcox TM (2017) Not just for fisheries biologists anymore: environmental DNA sampling makes strides in wildlife. Wildl Prof 11:47–51
Siegert NW, McCullough DG, Liebhold AM, Telewski FW (2014) Dendrochronological reconstruction of the epicenter and early spread of emerald ash borer in North America. Divers Distrib 20:847–858
Simberloff D (2009) The role of propagule pressure in biological inva-sions. Annu Rev Ecol Evol Syst 40:81–102
Singh N, Glenn NF (2009) Multitemporal spectral analysis for cheatgrass (Bromus tectorum) classification. Int J Remote Sens 30:3441–3462
Singh KK, Davis AJ, Meentemeyer RK (2015) Detecting understory plant invasion in urban forests using LiDAR. Int J Appl Earth Obs Geoinf 38:267–279
Skakun RS, Wulder MA, Franklin SE (2003) Sensitivity of the thematic mapper enhanced wetness difference index to detect mountain pine beetle red-attack damage. Remote Sens Environ 86:433–443
Sniezko RA, Mahalovich MF, Schoettle AW (2011) Past and current investigations of the genetic resistance to Cronartium ribicola in high-elevation five-needle pines. In: Keane RE, Tomback DF, Murray MP, Smith CM (eds) The future of high-elevation, five- needle white pines in western North America: proceedings of the high five symposium, Proceedings RMRS-P-63. U.S. Department of Agriculture, Forest Service, Rocky Mountain Research Station, Fort Collins, pp 246–264
Song C, Woodcock CE, Seto KC et al (2001) Classification and change detection using Landsat TM data: when and how to correct atmo-spheric effects? Remote Sens Environ 75:230–244
Steiner KC, Westbrook JW, Hebard FV et al (2016) Rescue of American chestnut with extraspecific genes following its destruction by a nat-uralized pathogen. New For 48:1–2
Tabashnik BE, Carriere Y (2017) Surge in insect resistance to transgenic crops and prospects for sustainability. Nat Biotechnol 35:926–935
Tian D, Traw MB, Chen JQ et al (2003) Fitness costs of R-gene- mediated resistance in Arabidopsis thaliana. Nature 423:74–77
Townsend PA, Singh A, Foster JR et al (2012) A general Landsat model to predict canopy defoliation in broadleaf deciduous forests. Remote Sens Environ 119:255–265
U.S. Department of Agriculture (2015) Summary report: 2012 national resources inventory. Natural Resources Conservation Service,
Washington, DC, and Center for Survey Statistics and Methodology, Iowa State University, Ames, Iowa
U.S. Department of the Interior (2016) Safeguarding America’s lands and waters from invasive species: a national framework for early detection and rapid response, Washington DC, 55 p
Underwood MC, Allan DH, James FQ (2013) Geospatial tools for iden-tifying and managing invasive plants. In: Jose S, Singh HP, Batish DR, Kohli RK (eds) Invasive plant ecology. CRC Press, Boca Raton, pp 175–202
Václavík TÅ, Kanaskie A, Hansen EM et al (2015) Predicting potential and actual distribution of sudden oak death in Oregon: prioritizing landscape contexts for early detection and eradication of disease outbreaks. For Ecol Manag 260:1026–1035
Van Nocker S, Gardiner SE (2014) Breeding better cultivars, faster: applications of new technologies for the rapid deployment of supe-rior horticultural tree crops. Hortic Res 1:14022
Voinov A, Bousquet F (2010) Modelling with stakeholders. Environ Model Softw 25:1268–1281
Wan H, Wang Q, Jiang D et al (2014) Monitoring the invasion of Spartina alterniflora using very high resolution unmanned aerial vehicle imagery in Beihai, Guangxi (China). Sci World J 24:1–9
Westoby M, Walker B, Noy-Meir I (1989) Opportunistic management for rangelands not at equilibrium. J Range Manag 42:266–274
Whitney KD, Gabler CA (2008) Rapid evolution in introduced species, ‘invasive traits’ and recipient communities: challenges for predict-ing invasive potential. Divers Distrib 14:569–580
Wilcox TM, McKelvey KS, Young MK et al (2013) Robust detection of rare species using environmental DNA: the importance of primer specificity. PLoS One 8:e59520
Wilcox TM, McKelvey KS, Young MK et al (2016) Understanding envi-ronmental DNA detection probabilities: a case study using a stream- dwelling char Salvelinus fontinalis. Biol Conserv 194:209–216
Wulder MA, White JC, Coops NC et al (2008) Multi-temporal analy-sis of high spatial resolution imagery for disturbance monitoring. Remote Sens Environ 112:2729–2740
Xu Y, Crouch JH (2008) Marker-assisted selection in plant breeding: from publications to practice. Crop Sci 48:391–407
Yamagishi N, Li C, Yoshikawa N (2016) Promotion of flowering by apple latent spherical virus vector and virus elimination at high temperature allow accelerated breeding of apple and pear. Front Plant Sci 7:1–10
Zaman B, Jensen AM, McKee M (2011) Use of high-resolution mul-tispectral imagery acquired with an autonomous unmanned aerial vehicle to quantify the spread of an invasive wetlands species. In: Geoscience and Remote Sensing Symposium (IGARSS), 2011 IEEE international. IEEE, pp 803–806
Zapata-Valenzuela J, Whetten RW, Neale DB et al (2013) Genomic estimated breeding values using genomic relationship matrices in a cloned population of loblolly pine. Genes Genomes Genet 3:909–916
Zhao K, Popescu S, Meng X et al (2011) Characterizing forest canopy structure with LiDAR composite metrics and machine learning. Remote Sens Environ 115:1978–1996
Open Access This chapter is licensed under the terms of the Creative Commons Attribution 4.0 International License (http://creativecommons.org/licenses/by/4.0/), which permits use, sharing, adaptation, distribution and reproduction in any medium or format, as long as you give appropri-ate credit to the original author(s) and the source, provide a link to the Creative Commons license and indicate if changes were made.
The images or other third party material in this chapter are included in the chapter’s Creative Commons license, unless indicated otherwise in a credit line to the material. If material is not included in the chapter’s Creative Commons license and your intended use is not permitted by statu-tory regulation or exceeds the permitted use, you will need to obtain permission directly from the copyright holder.
11 Tools and Technologies for Quantifying Spread and Impacts of Invasive Species