Proposal for a Globalization Matrix: Quantifying Impacts ...
Upload
truongnhanCategory
view
217download
0
MARINE ECOLOGY PROGRESS SERIESMar Ecol Prog Ser
Vol. 398: 19–32, 2010doi: 10.3354/meps08345
Published January 5
INTRODUCTION
Worldwide increasing pressure on the marine envi-ronment, due to development of new technologiessuch as offshore renewable energy, and the conflictinginterests that occasionally result, requires integratedand ecosystem-based management. An ecosystemapproach to management promotes the integratedmanagement of human uses while maintaining ecosys-tem goods and services (Leslie & McLeod 2007, Ruck-elshaus et al. 2008), but must address interactionsbetween a range of human activities which vary intheir intensity, footprint (Eastwood et al. 2007) and
impact on the marine environment (Crain et al. 2008).One tool that supports such an ecosystem approach tomanagement is marine spatial planning (Douvere2008). Thus, an understanding of the risk of cumulativeimpacts of numerous activities is crucial for the devel-opment of a marine spatial plan.
In general, determining the impact of a human activ-ity on an ecosystem component requires both a methodfor translating human activities into ecosystem-specificpressures, and a measure of sensitivity of ecosystemcomponents to those pressures. Human activities havealready been grouped by the type of pressure, such ascontamination, abrasion, extraction, that they exert on
© Inter-Research 2010 · www.int-res.com*Email: [email protected]
Quantifying cumulative impacts of human pressureson the marine environment: a geospatial modelling
framework
V. Stelzenmüller*, J. Lee, A. South, S. I. Rogers
Centre for Environment, Fisheries and Aquaculture Science (Cefas), Pakefield Road, Lowestoft NR33 OHT, UK
ABSTRACT: Worldwide increasing pressure on the marine environment requires integrated andecosystem-based management, and a sound understanding of cumulative impacts of human pres-sure. As yet, the quantification of risk of cumulative impact remains a difficult task in practice. Wedeveloped a geospatial modelling framework to group data on the spatial distribution and intensityof human activities by generic pressure. The impact of those pressures was mapped by accounting forthe sensitivity of UK marine landscapes to those pressures. With the help of GIS-based multi-criteriaanalysis, we developed 4 different scenarios to quantify risk of cumulative impacts that accounted fordifferent importance of ranked pressures (equal, linear and logistic decrease), including a simulatedexpert consultation. Finally, we assessed the sensitivity of the scenario outcomes to changes to inputparameters and compared model outcomes. The risk assessment framework exposed both a widerange of possible modelled scenarios and uncertainties, but all scenarios revealed similar locationswith an increased risk of cumulative impacts. Results showed that the logistic weighting scheme wasvery sensitive to changes in the importance and ranking of pressures in comparison to the linearweighting scheme. For marine planning the use of a weighting scheme with more constrained valuesshould be used in conjunction with a sensitivity analysis to determine the order of input parameters.Once a more comprehensive geodatabase becomes available our standardised framework can beapplied to support both the development of sustainable marine plans in practise and the prioritisationof different uses.
KEY WORDS: GIS-MCA · GIS-based multi-criteria analysis · Fuzzy sets · Human pressures ·Sensitivity · Impact · Marine landscapes · Marine planning
Resale or republication not permitted without written consent of the publisher
Mar Ecol Prog Ser 398: 19–32, 2010
ecosystem components (Eastwood et al. 2007). Follow-ing Zacharias & Gregr (2005), we define the impact ofa pressure on an ecosystem component as a function ofthe spatial footprint and intensity of a pressure, and ameasure of the degree to which an ecosystem compo-nent responds to a pressure (sensitivity).
The risk of an impact at a certain spatial location istherefore a function of a measure of intensity of humanactivities causing the same generic pressure and thesensitivity of the ecosystem component to this genericpressure. However, an ecosystem approach to marinemanagement that makes use of marine spatial plan-ning needs to consider cumulative and interactiveimpacts of several human activities (Evans & Klinger2008, Halpern et al. 2008a). Cumulative impacts can bedescribed as the combined impact of multiple pres-sures over space and time (MacDonald 2000).
The risk and consequences of cumulative impacts onecosystems due to the presence of multiple pressuresare discussed in a number of theoretical and practicalecological studies (Folt et al. 1999, Folke et al. 2004,Vinebrooke et al. 2004, Christensen et al. 2006, Hal-pern et al. 2008b). The quantification of cumulativeimpacts still remains a difficult task for applied ecologyand conservation science (see Darling & Côté 2008 andreferences therein). If multiple pressures act indepen-dently within a system, cumulative impacts may bemodelled as the additive accumulation of impacts ofindividual pressures (Halpern et al. 2007, 2008a, Ban &Alder 2008). However, a common ecological paradigmis that multiple pressures can act in synergy (Folt et al.1999, Folke et al. 2004, Christensen et al. 2006, Crainet al. 2008). Synergistic effects occur when the com-bined impact of several pressures is greater than thealgebraic sum of the impacts of the individual pres-sures. In contrast, antagonistic effects occur when thecombined impact of multiple pressures is less than thesum of the individual impacts of the pressures (Folt etal. 1999). Recent studies exploring the nature of inter-action of multiple pressures show that cumulativeimpacts are additive (i.e. are summed) for pairs ofpressures (Crain et al. 2008) and that synergisticeffects are generally more common than additive ones(Darling & Côté 2008). This highlights the need to eval-uate the complexity and range of uncertainty in assess-ing cumulative impacts of human pressures, especiallyfor the development of sustainable marine spatialplans.
Recent advances in the quantification of risks ofcumulative impacts in marine systems have beendemonstrated by Halpern et al. (2007, 2008b). Theycombined the spatial information on the occurrencesand intensity of human activities with a measure ofsensitivity of various ecosystem components to theactivities and assumed additive cumulative impacts.
Inspired by their work, we developed a geospatialmodelling framework which assesses a range of mod-els that quantify the risk of cumulative impacts on UKmarine habitats by altering the importance of singlepressures that lead to numerical results other thanaddition of single pressures. Moreover, our frameworkenables the evaluation of both the uncertainty at dif-ferent stages of the assessment and the sensitivity torespective model parameters.
Multi-criteria analysis (MCA) is a decision-makingtool that allows for comparative assessment of alterna-tive scenarios. It generates a set of alternative out-comes based on multiple criteria, where the outputsare quantified indicators of the extent to which differ-ent objectives are realised (Malczewski 1999). The setof alternative outcomes can then be evaluated, but thefinal decision will be taken by the decision maker. Theintegration of MCA in Geographical Information Sys-tem (GIS), i.e. a spatially explicit MCA, is a major con-tribution to the development of tools for integratedmanagement (Jiang & Eastman 2000, Malczewski2006). In the marine environment, GIS-MCA has beenemployed to aid zoning within marine protected areas(Villa et al. 2002), across national borders (Portman2007) and in coastal areas (Kitsiou et al. 2002). It hasalso been applied to identify candidate sites for protec-tion based on multiple objectives (Wood & Dragicevic2007).
First, our algorithm combined standardised datadescribing locations and/or intensities of human activ-ities (Eastwood et al. 2007, Stelzenmüller et al. 2008)with a measure of the sensitivity of the UK marinelandscapes (Connor et al. 2006) to the pressures ofthese activities. We then applied a weighting to theseimpact layers and combined them to model 4 scenariosquantifying the risk of cumulative impacts on the UKcontinental shelf. The computed cumulative impactscenarios assumed (1) equal importance of all pres-sures, (2) linear decrease of importance of subsequentpressures, (3) logistic decrease of importance of pres-sures, and (4) ranking of importance of pressures bysimulating an expert consultation. We were also ableto assess the sensitivity of the outcomes of the analysisto changes in the input parameters. If a small change inthe rank order of an input parameter leads to a largechange in the results then the outcome is deemed to besensitive to that parameter and may indicate a need formore accurate determination of the parameter, or ofconsideration of the alternative scenarios in the deci-sion making process. We compared and interpretedthe different models based on the definition of additiveeffects, and the final outcome in terms of potential syn-ergistic and antagonistic effects of multiple impacts.The results and the use of our framework in marineplanning is discussed.
20
Stelzenmüller et al.: Quantifying cumulative impacts of human pressures
METHODS
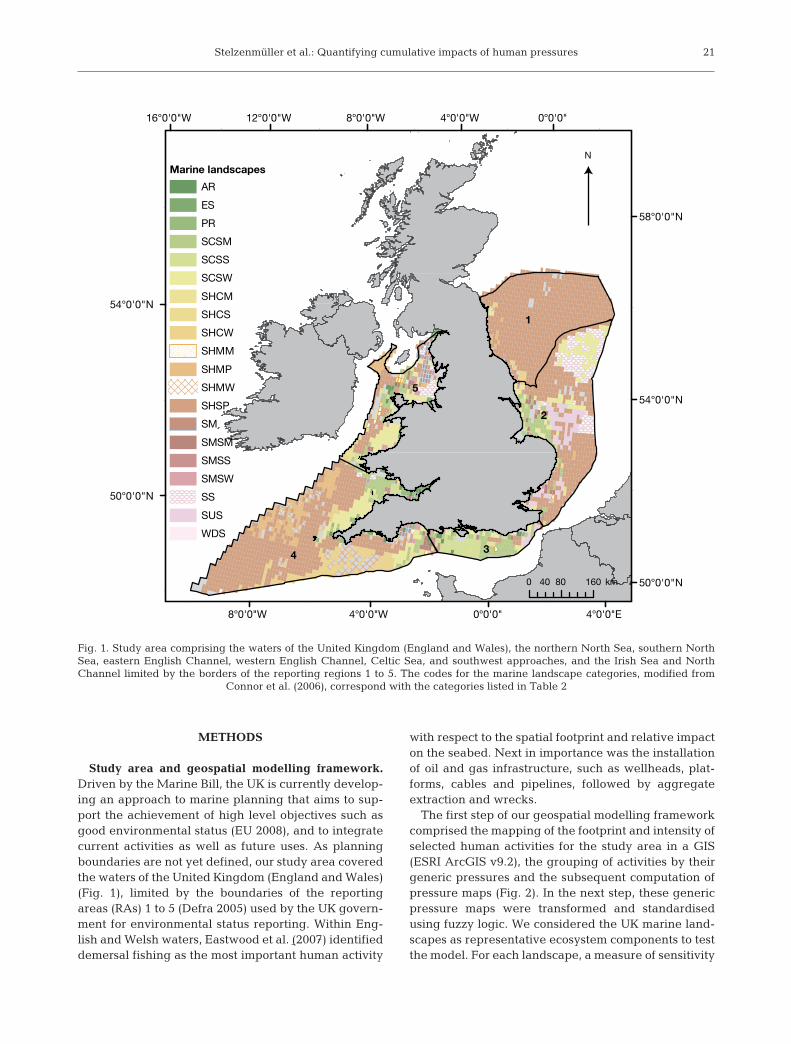
Study area and geospatial modelling framework.Driven by the Marine Bill, the UK is currently develop-ing an approach to marine planning that aims to sup-port the achievement of high level objectives such asgood environmental status (EU 2008), and to integratecurrent activities as well as future uses. As planningboundaries are not yet defined, our study area coveredthe waters of the United Kingdom (England and Wales)(Fig. 1), limited by the boundaries of the reportingareas (RAs) 1 to 5 (Defra 2005) used by the UK govern-ment for environmental status reporting. Within Eng-lish and Welsh waters, Eastwood et al. (2007) identifieddemersal fishing as the most important human activity
with respect to the spatial footprint and relative impacton the seabed. Next in importance was the installationof oil and gas infrastructure, such as wellheads, plat-forms, cables and pipelines, followed by aggregateextraction and wrecks.
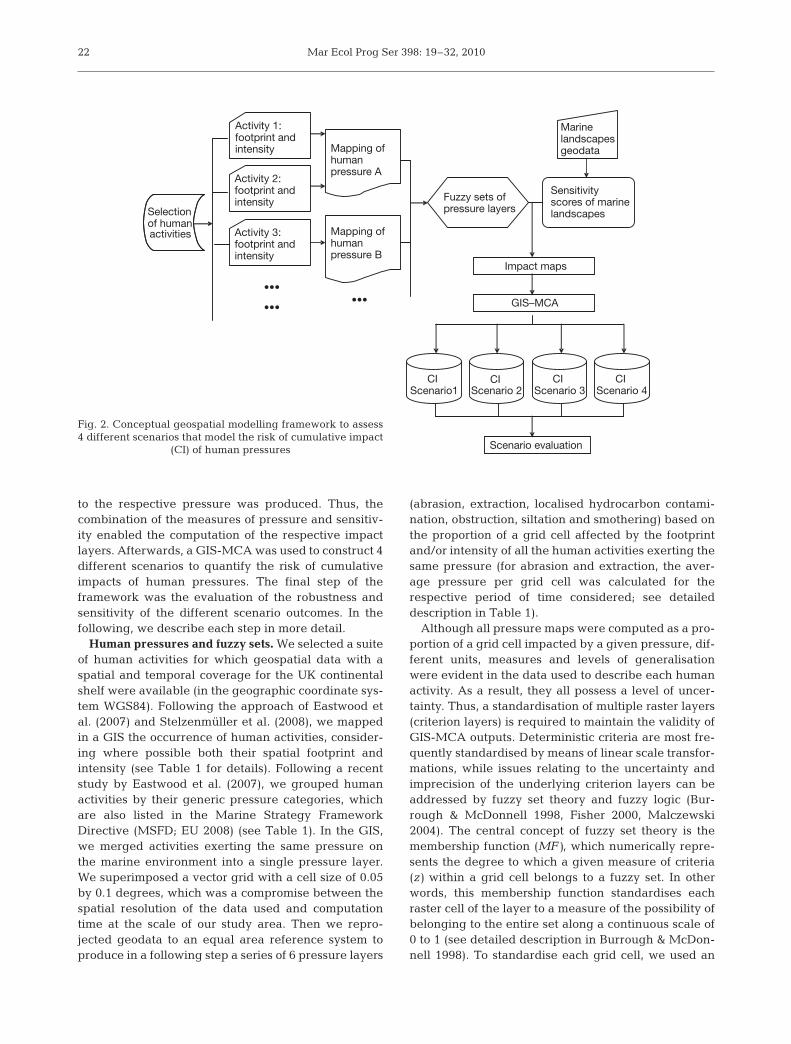
The first step of our geospatial modelling frameworkcomprised the mapping of the footprint and intensity ofselected human activities for the study area in a GIS(ESRI ArcGIS v9.2), the grouping of activities by theirgeneric pressures and the subsequent computation ofpressure maps (Fig. 2). In the next step, these genericpressure maps were transformed and standardisedusing fuzzy logic. We considered the UK marine land-scapes as representative ecosystem components to testthe model. For each landscape, a measure of sensitivity
21
0°0'0"
0°0'0"
4°0'0"W
4°0'0"W
8°0'0"W
8°0'0"W12°0'0"W16°0'0"W
4°0'0"E
58°0'0"N
N
54°0'0"N
54°0'0"N
50°0'0"N
50°0'0"N0 80 16040 km
4
5
3
2
1
Marine landscapes
AR
ES
PR
SCSM
SCSS
SCSW
SHCM
SHCS
SHCW
SHMM
SHMP
SHMW
SHSP
SM
SMSM
SMSS
SMSW
SS
SUS
WDS
Fig. 1. Study area comprising the waters of the United Kingdom (England and Wales), the northern North Sea, southern NorthSea, eastern English Channel, western English Channel, Celtic Sea, and southwest approaches, and the Irish Sea and NorthChannel limited by the borders of the reporting regions 1 to 5. The codes for the marine landscape categories, modified from
Connor et al. (2006), correspond with the categories listed in Table 2
Mar Ecol Prog Ser 398: 19–32, 2010
to the respective pressure was produced. Thus, thecombination of the measures of pressure and sensitiv-ity enabled the computation of the respective impactlayers. Afterwards, a GIS-MCA was used to construct 4different scenarios to quantify the risk of cumulativeimpacts of human pressures. The final step of theframework was the evaluation of the robustness andsensitivity of the different scenario outcomes. In thefollowing, we describe each step in more detail.
Human pressures and fuzzy sets. We selected a suiteof human activities for which geospatial data with aspatial and temporal coverage for the UK continentalshelf were available (in the geographic coordinate sys-tem WGS84). Following the approach of Eastwood etal. (2007) and Stelzenmüller et al. (2008), we mappedin a GIS the occurrence of human activities, consider-ing where possible both their spatial footprint andintensity (see Table 1 for details). Following a recentstudy by Eastwood et al. (2007), we grouped humanactivities by their generic pressure categories, whichare also listed in the Marine Strategy FrameworkDirective (MSFD; EU 2008) (see Table 1). In the GIS,we merged activities exerting the same pressure onthe marine environment into a single pressure layer.We superimposed a vector grid with a cell size of 0.05by 0.1 degrees, which was a compromise between thespatial resolution of the data used and computationtime at the scale of our study area. Then we repro-jected geodata to an equal area reference system toproduce in a following step a series of 6 pressure layers
(abrasion, extraction, localised hydrocarbon contami-nation, obstruction, siltation and smothering) based onthe proportion of a grid cell affected by the footprintand/or intensity of all the human activities exerting thesame pressure (for abrasion and extraction, the aver-age pressure per grid cell was calculated for therespective period of time considered; see detaileddescription in Table 1).
Although all pressure maps were computed as a pro-portion of a grid cell impacted by a given pressure, dif-ferent units, measures and levels of generalisationwere evident in the data used to describe each humanactivity. As a result, they all possess a level of uncer-tainty. Thus, a standardisation of multiple raster layers(criterion layers) is required to maintain the validity ofGIS-MCA outputs. Deterministic criteria are most fre-quently standardised by means of linear scale transfor-mations, while issues relating to the uncertainty andimprecision of the underlying criterion layers can beaddressed by fuzzy set theory and fuzzy logic (Bur-rough & McDonnell 1998, Fisher 2000, Malczewski2004). The central concept of fuzzy set theory is themembership function (MF), which numerically repre-sents the degree to which a given measure of criteria(z) within a grid cell belongs to a fuzzy set. In otherwords, this membership function standardises eachraster cell of the layer to a measure of the possibility ofbelonging to the entire set along a continuous scale of0 to 1 (see detailed description in Burrough & McDon-nell 1998). To standardise each grid cell, we used an
22
Mapping of human pressure A
Activity 1:footprint and intensity
Fuzzy sets of pressure layersSelection
of human activities
Sensitivity scores of marine landscapes
•••
•••
Activity 2:footprint and intensity
Activity 3: footprint and intensity
Mapping of human pressure B
•••
CI Scenario1 Scenario 2 Scenario 3 Scenario 4
Marine landscapesgeodata
Scenario evaluation
GIS–MCA
CI CI CI
Impact maps
Fig. 2. Conceptual geospatial modelling framework to assess4 different scenarios that model the risk of cumulative impact
(CI) of human pressures
Stelzenmüller et al.: Quantifying cumulative impacts of human pressures
asymmetric sigmoid membership function (Mal-czewski 2004, Wood & Dragicevic 2007, Maina et al.2008) modified after Burrough & McDonnell (1998):
if 0 < z < a + b (1)
MF (z) = 1 if z ≥ a + b
with a as the standard deviation and b as the 0.9 quar-tile of the respective log-transformed measure of apressure.
Measures of sensitivity and impact. We adopted themarine landscape categories developed by Connor etal. (2006) for our study grid and distinguished between20 landscape categories at the scale of the grid sizeused (Fig. 1). Each raster cell was assigned to onemarine landscape category. From an extensive litera-ture review (Defra 2007), we extracted information onsensitivity of a marine landscape to each human activ-ity presented on an ordinate scale (no, low, mediumand high). Then we converted this measure of sensitiv-ity from an ordinate scale to a numeric measure forsensitivity (sensitivity score) 0 (no), 0.2 (low), 0.6(medium) and 1 (high) (Table 2). In cases where more
than one human activity contributed to a pressure cat-egory, the average sensitivity across all relevant activ-ities was calculated. This enabled us to compute foreach raster cell the impact (I) of a given pressure:
Ii = Pi SSij (2)
with Pi as the fuzzy standardised (0 to 1) measure of apressure (i = 1, 2,…6) and SS as the sensitivity score(Defra 2007) of the landscape category j ( j = 1, 2,…20)for the given pressure Pi. In total, we computed 6impact layers for the UK and Welsh waters accountingfor the 6 pressure categories.
Quantification of cumulative impacts and scenarioevaluation. We modelled 4 different scenarios to quan-tify the risk of cumulative impacts for the UK continen-tal shelf. After constructing the impact layers, a weightwas assigned to each layer reflecting its relative impor-tance (from the user’s perspective). The layers are thencombined according to different decision rules(Boroushaki & Malczewski 2008). The weighted linearcombination is the decision rule most commonly usedfor a GIS-MCA and therefore, for all scenarios, wequantified the relative risk of cumulative impacts foreach raster cell (RiskCIcell) as (after Malczewski 1999):
MF zz a b
a
( ) =
+ − −⎛⎝
⎞⎠
1
12
23
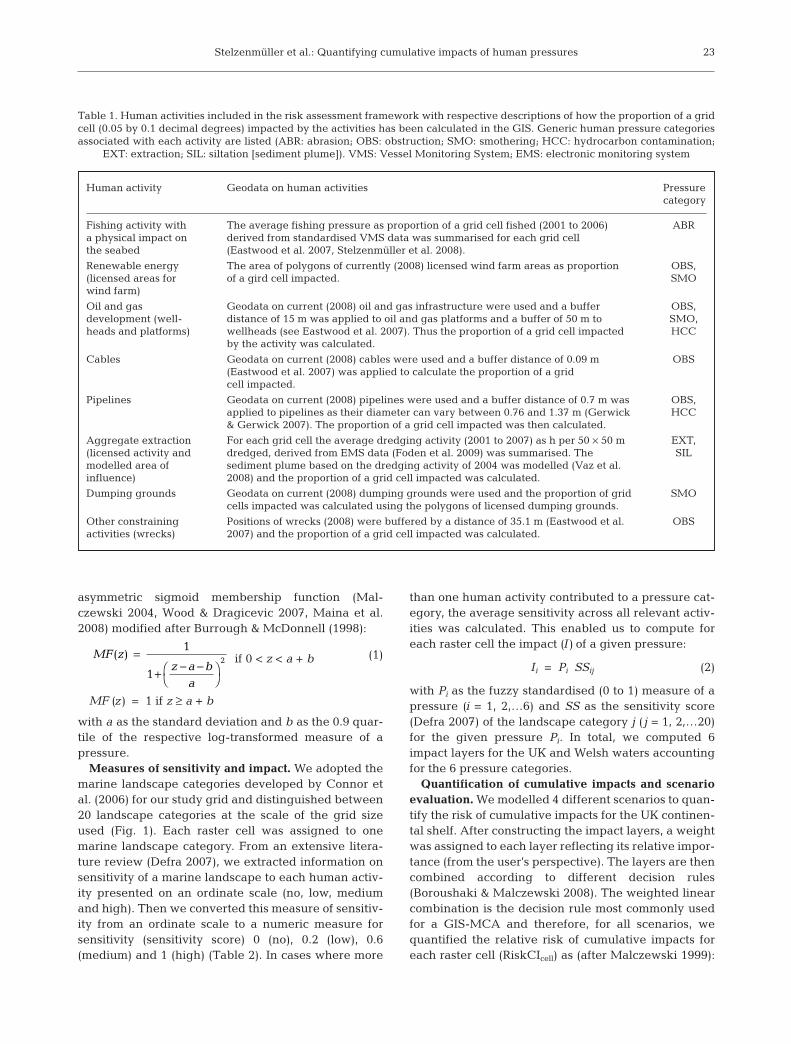
Human activity Geodata on human activities Pressurecategory
Fishing activity with The average fishing pressure as proportion of a grid cell fished (2001 to 2006) ABRa physical impact on derived from standardised VMS data was summarised for each grid cell the seabed (Eastwood et al. 2007, Stelzenmüller et al. 2008).
Renewable energy The area of polygons of currently (2008) licensed wind farm areas as proportion OBS,(licensed areas for of a gird cell impacted. SMOwind farm)
Oil and gas Geodata on current (2008) oil and gas infrastructure were used and a buffer OBS,development (well- distance of 15 m was applied to oil and gas platforms and a buffer of 50 m to SMO,heads and platforms) wellheads (see Eastwood et al. 2007). Thus the proportion of a grid cell impacted HCC
by the activity was calculated.
Cables Geodata on current (2008) cables were used and a buffer distance of 0.09 m OBS(Eastwood et al. 2007) was applied to calculate the proportion of a grid cell impacted.
Pipelines Geodata on current (2008) pipelines were used and a buffer distance of 0.7 m was OBS,applied to pipelines as their diameter can vary between 0.76 and 1.37 m (Gerwick HCC& Gerwick 2007). The proportion of a grid cell impacted was then calculated.
Aggregate extraction For each grid cell the average dredging activity (2001 to 2007) as h per 50 × 50 m EXT,(licensed activity and dredged, derived from EMS data (Foden et al. 2009) was summarised. The SILmodelled area of sediment plume based on the dredging activity of 2004 was modelled (Vaz et al.influence) 2008) and the proportion of a grid cell impacted was calculated.
Dumping grounds Geodata on current (2008) dumping grounds were used and the proportion of grid SMOcells impacted was calculated using the polygons of licensed dumping grounds.
Other constraining Positions of wrecks (2008) were buffered by a distance of 35.1 m (Eastwood et al. OBSactivities (wrecks) 2007) and the proportion of a grid cell impacted was calculated.
Table 1. Human activities included in the risk assessment framework with respective descriptions of how the proportion of a gridcell (0.05 by 0.1 decimal degrees) impacted by the activities has been calculated in the GIS. Generic human pressure categoriesassociated with each activity are listed (ABR: abrasion; OBS: obstruction; SMO: smothering; HCC: hydrocarbon contamination;
EXT: extraction; SIL: siltation [sediment plume]). VMS: Vessel Monitoring System; EMS: electronic monitoring system
Mar Ecol Prog Ser 398: 19–32, 2010
(3)
where Ii are the impact layers and wj are the criterionweights, which are listed in Table 3.
In our framework, we constructed 4 scenarios (seeTable 3): (1) equal importance of pressures (Scenario1), (2) linear decrease of importance of pressures (Sce-nario 2), (3) logistic decrease of importance of pres-sures (Scenario 3) and (4) ranking of importance ofpressures derived from a simulated expert consultation(Scenario 4). For Scenarios 2 and 3, we ranked pres-sures by their spatial extent (percentage of grid cellswith a positive value for the pressure), assuming the
greater the spatial extent of a pressure the lower thelikelihood of a general recovery from the respectivepressure. Thus, obstruction was ranked for Scenarios 2and 3 as the most severe pressure and aggregateextraction as the least (see Table 3).
For the fourth scenario, we simulated a random pair-wise comparison of the importance of pressures. Apairwise comparison is the basic measurement methodin an analytical hierarchy process (AHP) (Saaty 1980).AHP uses weighted overlays and is of particular impor-tance for spatial decision problems with a largenumber of alternatives (Saaty 1980, Boroushaki & Mal-czewski 2008). Thus, the comparison of the relativeimportance of pairs of pressures by stakeholder con-
sultation would generate a large numberof alternatives. We ran 2 random simula-tions of stakeholder consultations with 25(Scenario 4a) and 500 (Scenario 4b) itera-tions of pairwise comparisons of pressuresusing a reciprocal matrix and a scale ofvalues from 1 to 9 reflecting the relativepreferences for 2 pressure categories (e.g.1 = equal importance, 3 = moderateimportance, 5 = strong importance, 7 =very strong importance, 9 = extremeimportance, 2,4,6,8 = intermediate valuesbetween adjacent scale values) (seeBoroushaki & Malczewski 2008). The rel-ative weights for the impact layers in Sce-nario 4 (see Table 3) were derived by nor-
RiskCI andcell = =∑ ∑I w wi jj
jj
1
24
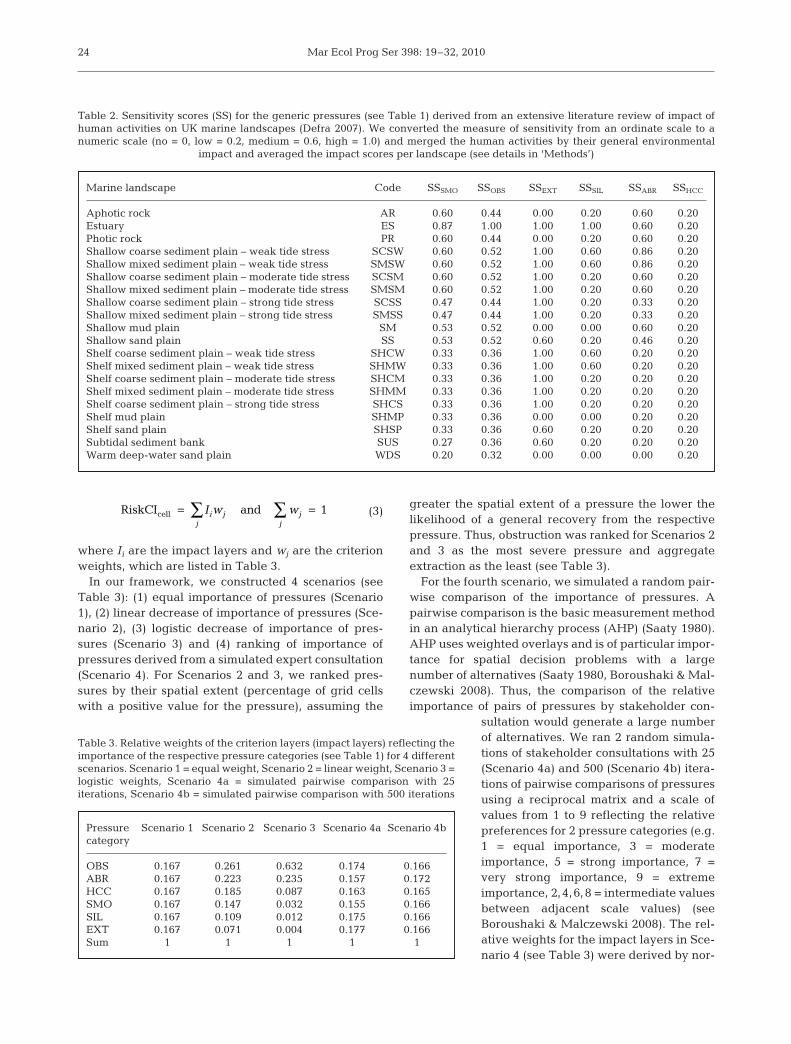
Marine landscape Code SSSMO SSOBS SSEXT SSSIL SSABR SSHCC
Aphotic rock AR 0.60 0.44 0.00 0.20 0.60 0.20Estuary ES 0.87 1.00 1.00 1.00 0.60 0.20Photic rock PR 0.60 0.44 0.00 0.20 0.60 0.20Shallow coarse sediment plain – weak tide stress SCSW 0.60 0.52 1.00 0.60 0.86 0.20Shallow mixed sediment plain – weak tide stress SMSW 0.60 0.52 1.00 0.60 0.86 0.20Shallow coarse sediment plain – moderate tide stress SCSM 0.60 0.52 1.00 0.20 0.60 0.20Shallow mixed sediment plain – moderate tide stress SMSM 0.60 0.52 1.00 0.20 0.60 0.20Shallow coarse sediment plain – strong tide stress SCSS 0.47 0.44 1.00 0.20 0.33 0.20Shallow mixed sediment plain – strong tide stress SMSS 0.47 0.44 1.00 0.20 0.33 0.20Shallow mud plain SM 0.53 0.52 0.00 0.00 0.60 0.20Shallow sand plain SS 0.53 0.52 0.60 0.20 0.46 0.20Shelf coarse sediment plain – weak tide stress SHCW 0.33 0.36 1.00 0.60 0.20 0.20Shelf mixed sediment plain – weak tide stress SHMW 0.33 0.36 1.00 0.60 0.20 0.20Shelf coarse sediment plain – moderate tide stress SHCM 0.33 0.36 1.00 0.20 0.20 0.20Shelf mixed sediment plain – moderate tide stress SHMM 0.33 0.36 1.00 0.20 0.20 0.20Shelf coarse sediment plain – strong tide stress SHCS 0.33 0.36 1.00 0.20 0.20 0.20Shelf mud plain SHMP 0.33 0.36 0.00 0.00 0.20 0.20Shelf sand plain SHSP 0.33 0.36 0.60 0.20 0.20 0.20Subtidal sediment bank SUS 0.27 0.36 0.60 0.20 0.20 0.20Warm deep-water sand plain WDS 0.20 0.32 0.00 0.00 0.00 0.20
Table 2. Sensitivity scores (SS) for the generic pressures (see Table 1) derived from an extensive literature review of impact ofhuman activities on UK marine landscapes (Defra 2007). We converted the measure of sensitivity from an ordinate scale to anumeric scale (no = 0, low = 0.2, medium = 0.6, high = 1.0) and merged the human activities by their general environmental
impact and averaged the impact scores per landscape (see details in ‘Methods’)
Pressure Scenario 1 Scenario 2 Scenario 3 Scenario 4a Scenario 4bcategory
OBS 0.167 0.261 0.632 0.174 0.166ABR 0.167 0.223 0.235 0.157 0.172HCC 0.167 0.185 0.087 0.163 0.165SMO 0.167 0.147 0.032 0.155 0.166SIL 0.167 0.109 0.012 0.175 0.166EXT 0.167 0.071 0.004 0.177 0.166Sum 1 1 1 1 1
Table 3. Relative weights of the criterion layers (impact layers) reflecting theimportance of the respective pressure categories (see Table 1) for 4 differentscenarios. Scenario 1 = equal weight, Scenario 2 = linear weight, Scenario 3 =logistic weights, Scenario 4a = simulated pairwise comparison with 25 iterations, Scenario 4b = simulated pairwise comparison with 500 iterations
Stelzenmüller et al.: Quantifying cumulative impacts of human pressures
malising the eigenvector associated with the maximumeigenvalue of the respective pairwise comparisonmatrix. This provides a weighting derived from the pri-ority vector of the matrix and reflects the relativeimportance of each criteria as compared to all other cri-teria (see a detailed description in e.g. Boroushaki &Malczewski 2008).
Scenario evaluation and comparison. We assessedthe sensitivity of scenario results to variations in modelinput parameters and compared scenario outcomeswith the help of explorative tools and GIS. First, to testthe similarity of scenario outcomes, we plotted theraster values for each scenario against each other andcalculated Pearson correlation coefficients. Then weconducted a sensitivity assessment of model inputparameters by testing the influence of both single pres-sures and the relative ranking of the pressure cate-gories on the scenario results. Hence, if a scenarioresult is sensitive to a change to the order of the pres-sures or the assigned weight, this indicates the needfor a more accurate determination of the model para-meters. Thus, we recalculated the scenarios by leavingout the most (obstruction; OBS) and least importantpressure category (extraction; EXT). Subsequently, weused 6 sets of randomly assigned pressure categoriesin the weighting schemes of Scenarios 2 and 3 to assessdifferent combinations of pressure category × weighton the quantification of cumulative impacts (Table 4).With the help of cubic smoothing splines (Hastie & Tib-shirani 1990), we explored differences between thepredictions made by the 6 random sets of pressure cat-egory × weight combinations and the prediction basedon ranked pressures, respectively.
Although the concept of a weighted overlay is ap-plied to all scenarios, the value for cumulative impactfor any single raster cell will differ due to the variousweighting schemes applied to the individual impactlayers. We used the definition of cumulative impact asa result of additive (sum of individual impacts), syner-gistic (greater than the algebraic sum of individualimpacts) and antagonistic (lower than the algebraic
sum of individual impacts) interactions of multipleimpacts to compare the model outputs (see Folt et al.1999). We treated our Scenario 1 (equal weighting ofthe pressures) as the reference scenario, which can beinterpreted as the quantification of cumulative impactsusing the sum of equally important individual impactlayers (additive interaction). Thus, if for a given rastercell, a scenario (2, 3, 4a and 4b) predicted a valuegreater than the value of Scenario 1, the result for thatraster cell is interpreted as an assumed synergisticeffect. In contrast, if for a given raster cell a scenariopredicted a value lower than the value of Scenario 1the result for the raster cell is interpreted as anassumed antagonistic effect. In a GIS, we producedmaps comparing the reference Scenario 1 to all otherscenarios (Scenario 1 to Scenarios 2, 3, 4a and 4b).
RESULTS
Scenarios of risk of cumulative impact
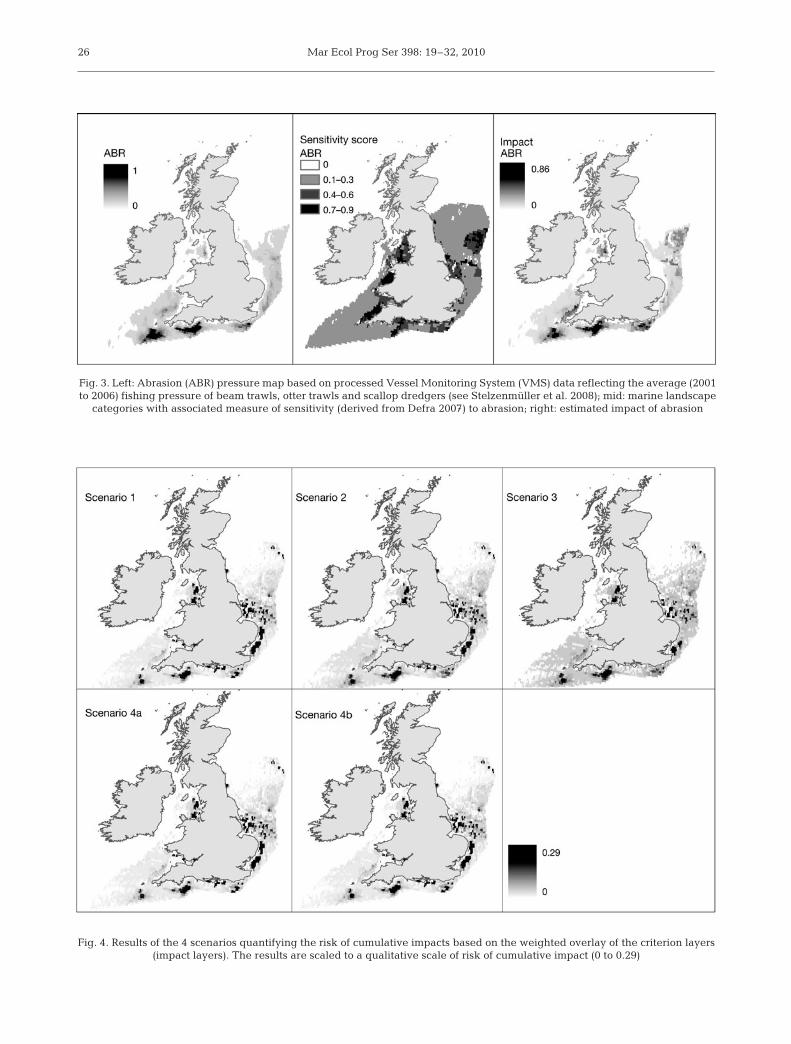
The impact layer prepared using the abrasion data(ABR) (reflecting fishing activity with a physical impacton the seabed) and the habitat sensitivity scores areshown in Fig. 3. An increased impact of abrasion canbe found at 2 distinct areas off the south west coast ofthe UK. Off the northeast coast there was a mediumlevel of impact due to the presence of more sensitivemarine landscapes (Fig. 3).
The different scenarios of cumulative impact (Fig. 4)showed generally consistent spatial patterns with anincreased risk of cumulative impacts in the south east,north east and east of the study area. Scenario 3, usinga logistic decrease in the importance of pressures,showed the greatest spatial deviation where the areasof increased risk off the east coast of the UK clearly dif-fered in shape and extent from the areas predicted byScenarios 1, 2, 4a and 4b.
Scenario evaluation
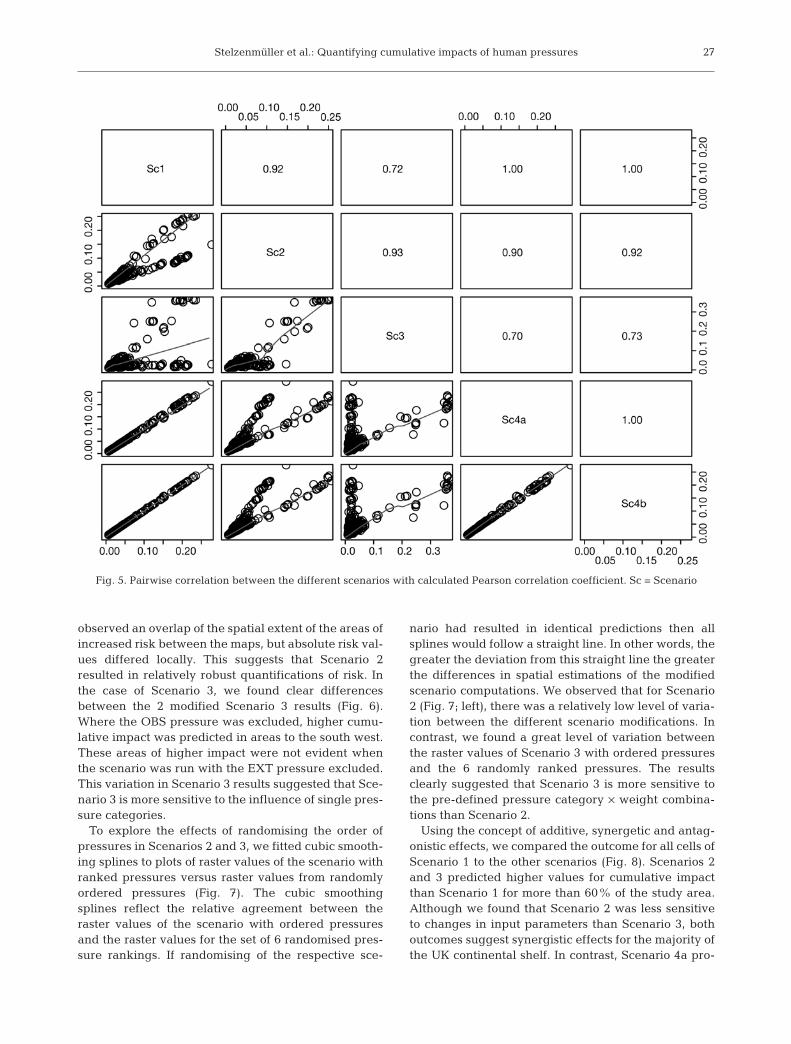
The pairwise correlations of the scenario raster val-ues (Fig. 5) showed lower values of the Pearson corre-lation coefficient for Scenario 3 versus Scenario 4a(0.70) and Scenario 3 versus Scenario 1 (0.72). Thisunderpins our visual observation of a clear spatialdeviation of the Scenario 3 outcome from the other sce-nario results. As an example, the results of the sensitiv-ity assessment are presented for Scenarios 2 and 3 inFig. 6. In general, we found a good agreement be-tween the results of Scenario 2 (Fig. 4) and the recom-puted Scenario 2 results where the most and leastsevere pressures have been left out (Fig 6). We
25
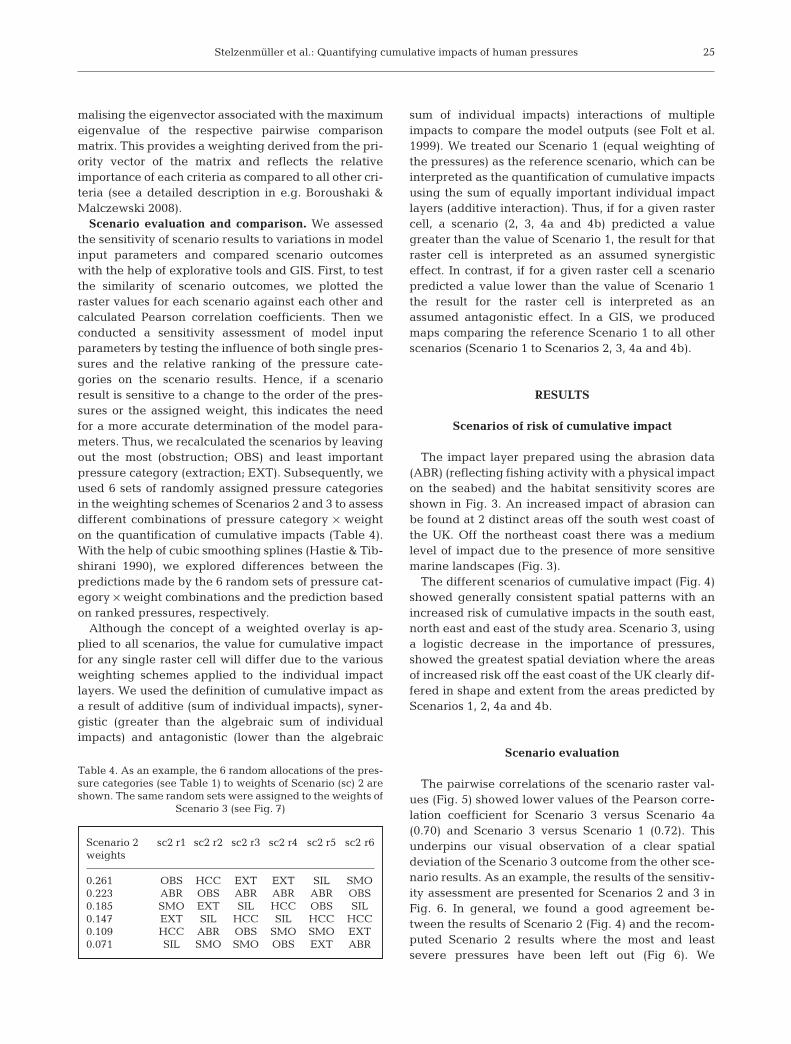
Scenario 2 sc2 r1 sc2 r2 sc2 r3 sc2 r4 sc2 r5 sc2 r6weights
0.261 OBS HCC EXT EXT SIL SMO0.223 ABR OBS ABR ABR ABR OBS0.185 SMO EXT SIL HCC OBS SIL0.147 EXT SIL HCC SIL HCC HCC0.109 HCC ABR OBS SMO SMO EXT0.071 SIL SMO SMO OBS EXT ABR
Table 4. As an example, the 6 random allocations of the pres-sure categories (see Table 1) to weights of Scenario (sc) 2 areshown. The same random sets were assigned to the weights of
Scenario 3 (see Fig. 7)
Mar Ecol Prog Ser 398: 19–32, 201026
Fig. 4. Results of the 4 scenarios quantifying the risk of cumulative impacts based on the weighted overlay of the criterion layers (impact layers). The results are scaled to a qualitative scale of risk of cumulative impact (0 to 0.29)
Fig. 3. Left: Abrasion (ABR) pressure map based on processed Vessel Monitoring System (VMS) data reflecting the average (2001to 2006) fishing pressure of beam trawls, otter trawls and scallop dredgers (see Stelzenmüller et al. 2008); mid: marine landscape
categories with associated measure of sensitivity (derived from Defra 2007) to abrasion; right: estimated impact of abrasion
Stelzenmüller et al.: Quantifying cumulative impacts of human pressures
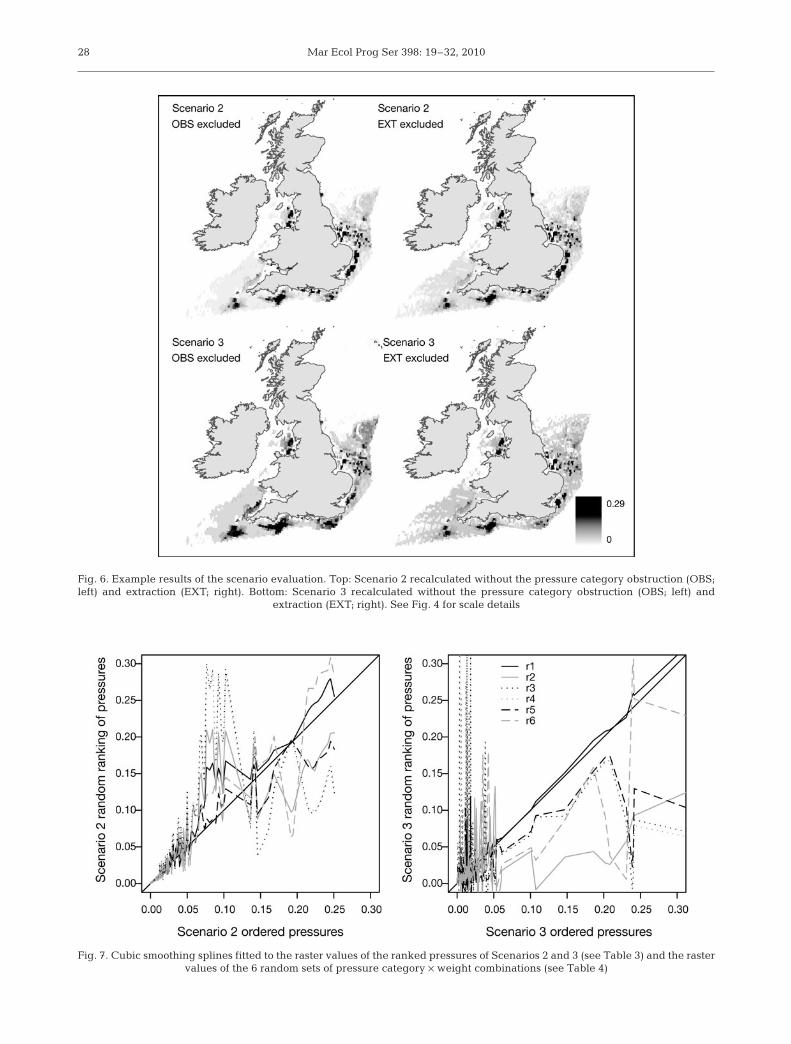
observed an overlap of the spatial extent of the areas ofincreased risk between the maps, but absolute risk val-ues differed locally. This suggests that Scenario 2resulted in relatively robust quantifications of risk. Inthe case of Scenario 3, we found clear differencesbetween the 2 modified Scenario 3 results (Fig. 6).Where the OBS pressure was excluded, higher cumu-lative impact was predicted in areas to the south west.These areas of higher impact were not evident whenthe scenario was run with the EXT pressure excluded.This variation in Scenario 3 results suggested that Sce-nario 3 is more sensitive to the influence of single pres-sure categories.
To explore the effects of randomising the order ofpressures in Scenarios 2 and 3, we fitted cubic smooth-ing splines to plots of raster values of the scenario withranked pressures versus raster values from randomlyordered pressures (Fig. 7). The cubic smoothingsplines reflect the relative agreement between theraster values of the scenario with ordered pressuresand the raster values for the set of 6 randomised pres-sure rankings. If randomising of the respective sce-
nario had resulted in identical predictions then allsplines would follow a straight line. In other words, thegreater the deviation from this straight line the greaterthe differences in spatial estimations of the modifiedscenario computations. We observed that for Scenario2 (Fig. 7; left), there was a relatively low level of varia-tion between the different scenario modifications. Incontrast, we found a great level of variation betweenthe raster values of Scenario 3 with ordered pressuresand the 6 randomly ranked pressures. The resultsclearly suggested that Scenario 3 is more sensitive tothe pre-defined pressure category × weight combina-tions than Scenario 2.
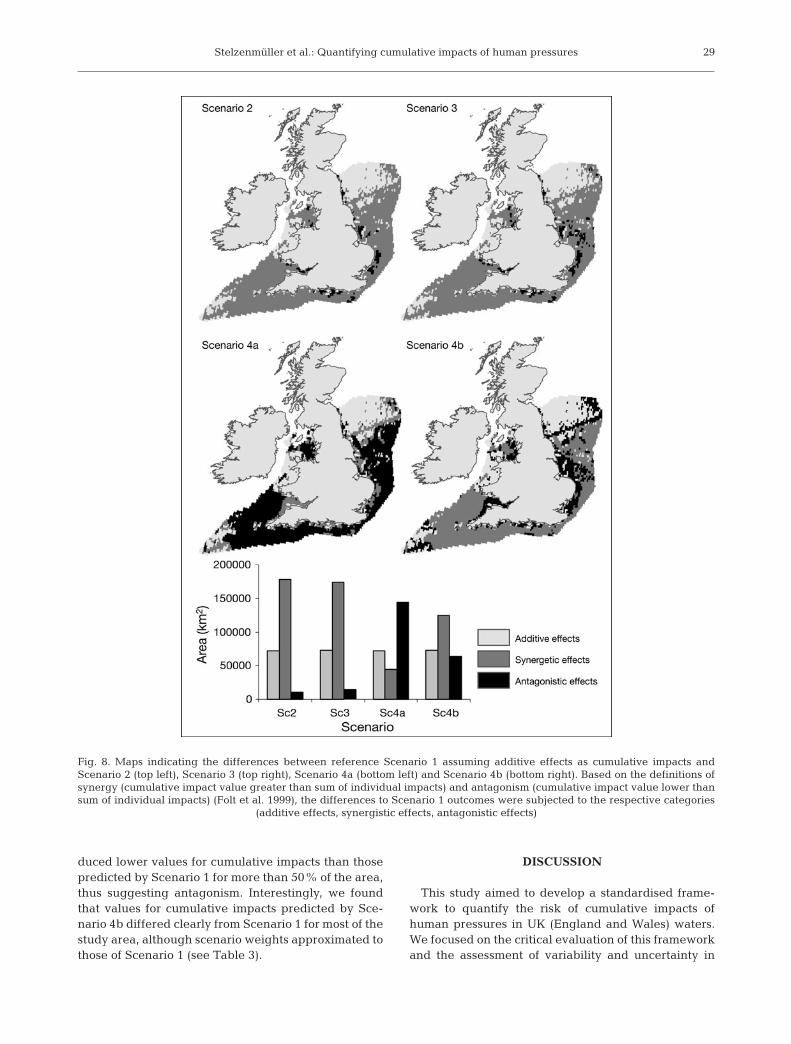
Using the concept of additive, synergetic and antag-onistic effects, we compared the outcome for all cells ofScenario 1 to the other scenarios (Fig. 8). Scenarios 2and 3 predicted higher values for cumulative impactthan Scenario 1 for more than 60% of the study area.Although we found that Scenario 2 was less sensitiveto changes in input parameters than Scenario 3, bothoutcomes suggest synergistic effects for the majority ofthe UK continental shelf. In contrast, Scenario 4a pro-
27
Fig. 5. Pairwise correlation between the different scenarios with calculated Pearson correlation coefficient. Sc = Scenario
Mar Ecol Prog Ser 398: 19–32, 201028
Fig. 6. Example results of the scenario evaluation. Top: Scenario 2 recalculated without the pressure category obstruction (OBS;left) and extraction (EXT; right). Bottom: Scenario 3 recalculated without the pressure category obstruction (OBS; left) and
extraction (EXT; right). See Fig. 4 for scale details
Fig. 7. Cubic smoothing splines fitted to the raster values of the ranked pressures of Scenarios 2 and 3 (see Table 3) and the raster values of the 6 random sets of pressure category × weight combinations (see Table 4)
Stelzenmüller et al.: Quantifying cumulative impacts of human pressures
duced lower values for cumulative impacts than thosepredicted by Scenario 1 for more than 50% of the area,thus suggesting antagonism. Interestingly, we foundthat values for cumulative impacts predicted by Sce-nario 4b differed clearly from Scenario 1 for most of thestudy area, although scenario weights approximated tothose of Scenario 1 (see Table 3).
DISCUSSION
This study aimed to develop a standardised frame-work to quantify the risk of cumulative impacts ofhuman pressures in UK (England and Wales) waters.We focused on the critical evaluation of this frameworkand the assessment of variability and uncertainty in
29
Fig. 8. Maps indicating the differences between reference Scenario 1 assuming additive effects as cumulative impacts andScenario 2 (top left), Scenario 3 (top right), Scenario 4a (bottom left) and Scenario 4b (bottom right). Based on the definitions ofsynergy (cumulative impact value greater than sum of individual impacts) and antagonism (cumulative impact value lower thansum of individual impacts) (Folt et al. 1999), the differences to Scenario 1 outcomes were subjected to the respective categories
(additive effects, synergistic effects, antagonistic effects)
Mar Ecol Prog Ser 398: 19–32, 2010
the modelling outputs rather than the development ofprecise marine planning scenarios.
The output of any modelling framework dependsstrongly on the quality of the input data. Hence, our listof human activities and pressures is not a comprehen-sive one, lacking data at a suitable scale on manyactivities affecting inshore areas, such as inshore fish-ing (see Eastwood et al. 2007, Stelzenmüller et al.2008), recreational angling, navigational dredging ornutrient loading. As a consequence, our approachunderestimated the relative risk of cumulative impactfor inshore areas for each scenario. The contribution ofwatersheds to marine pressures is neglected in thepresented application of our framework as we did notinclude data from e.g. land-based pollution. The inclu-sion of those land-based activities having an impact onthe marine environment is essential for a robust esti-mate of the risk of cumulative impacts, especially ininshore waters. Nevertheless, our framework could beapplied at any spatial scale and adapted to differentpressure categories when suitable data are available.
A measure of the sensitivity of ecosystem compo-nents to pressures from human activities is essential(Hope 2006, Halpern et al. 2008a). We considered asan example the marine landscape categories asecosystem components and converted respective mea-sures of sensitivity from an ordinate scale to a numericscale to derive sensitivity scores for each landscapecategory. Our algorithm computed impact on the land-scape as a function of the intensity of a pressure andthe measure of sensitivity. Consequently, an increasedimpact can be the result of either increased pressureintensity and a low level of sensitivity or a high level ofsensitivity and a low pressure intensity.
Both measures introduced uncertainty into the mod-elling framework. We partly dealt with the uncertaintyby using fuzzy logic to normalise the pressure layers,but some uncertainty remained due to the generalisedmeasure of sensitivity. This uncertainty can only bequantified with the help of experimental studies withmarine organisms to assess their sensitivity to the mainpressures. This gap in experimental studies to quantifysensitivity or to ground-truth impact models was alsorecognised by Halpern et al. (2008b). Moreover, in thecontext of national marine planning, where decisionson resource allocations will be taken, it is crucial todevelop a standardised measure of sensitivity of a suiteof ecosystem components to generic human pressures(see e.g. Stelzenmüller et al. 2009).
An ecosystem approach to management usingmarine planning (Douvere 2008) requires a soundassessment of combined or cumulative impacts of sev-eral human pressures (Rosenberg & McLeod 2005,Leslie & McLeod 2007, Halpern et al. 2008a). Thisstudy aimed to contribute to the pressing questions on
the quantification of cumulative impacts (Darling &Côté 2008). In contrast to former studies (e.g. Ban &Alder 2008), our framework comprised not only themapping of pressures and additive impacts, but alsoquantified cumulative impacts according to the rela-tive importance of single pressures. We constructed 4different scenarios to quantify cumulative impacts andassessed the variability and sensitivity of model out-puts. We based the reasoning of the different weight-ing schemes on the theory of different models forcumulative impacts (Folt et al. 1999). For instance, ifpressures are applied consecutively to the marinelandscapes rather than simultaneously, then theimpact of the first pressure is likely to pre-condition thehabitat to be less sensitive to the second pressure.Thus, the variability of the importance of individualimpacts is reflected in our scenarios, allowing for aqualitative comparison of the model outputs. Weapplied the definitions of synergism and antagonism tocompare Scenario 1 (assuming simple additive effects)with all other scenarios. This comparison is of impor-tance when a potential user of this framework appliesa scenario based on an alternative model. However,our framework did not model or describe the exactmechanisms of interactions leading to cumulativeimpacts. For instance a recent microcosm study indi-cated that pressures acting via similar mechanismsmay result in additive effects, while those pressuresthat are dependent but act through different mecha-nisms result in synergistic effects (Mora et al. 2007).The development of models translating and extrapolat-ing the mechanisms of synergistic or antagonisticinteractions of pressures to large spatial scales remainsfor the future.
Our geospatial framework revealed a range of vari-ability in the prediction of risk of cumulative impactthat can be crucial at a local scale, such as in regionalmarine plans. For example, our scenario evaluationrevealed that Scenario 3 with logistic criterion weightsis more sensitive to the defined pressure × weight com-binations than a linear weighting scheme and shouldtherefore be used with caution unless the data clearlysupport the identification of one dominant pressure.
In general, we can conclude that the use of GIS-MCA, commonly deployed to assess decision alterna-tives (Malczewski 1999), is a useful approach to derivedifferent quantifications of risk of cumulative impactsin the context of marine planning. It enabled us todevelop a spatial explicit risk framework and to evalu-ate the robustness of the respective scenarios. The useof pairwise comparison to derive criterion weightsenables expert opinion and/or stakeholder’s percep-tion to form input to the modelling of cumulativeimpacts, and provides a means of comparison andevaluation of diverse views.
30
Stelzenmüller et al.: Quantifying cumulative impacts of human pressures
The UK recently stated its proposals to deliver a newmarine planning system (Defra 2008). This will allowthe development of marine plans enhancing protectionof the seas while balancing pressures on the marineenvironment (Defra 2008). An effective marine plan-ning system requires a number of steps, such as goaland objective setting, data collection, analysis andgeneration of spatial options, and development andevaluation of the marine spatial plan, followed byimplementation of the plan (see Gilliland & Laffoley2008). Crucial to the integrated analysis phase is thequantification of cumulative impacts. Our frameworkcan be used to conduct such an assessment, whichleads to the question of how our framework could beput into effect for UK regional planning.
In principle, the framework can be applied for 2types of planning scenarios: (1) there are no activitieslicensed within an area and a planner wants to assessthe risk of cumulative impacts when licensing newactivities, and (2) there are already activities licensedwithin the planning area and a planner needs to find asuitable site to licence a new activity. Based on theassumption that the first impact by a pressure causesthe greatest mortality and with each subsequentimpact only the remaining biota is affected, our sce-nario with equally weighted pressures can be used toassess the first planning option (1). Moreover, based onthis assumption, the sensitivity score for each marinelandscape would need to be adjusted for each addi-tional pressure (planning scenario 2). Hence, asalready discussed, such a relationship between sensi-tivity score and number of pressures/pressure typescould only be established by experimental studies. Asthis information is lacking, a practical solution to find asuitable site to licence a new activity is the applicationof our framework Scenarios 2 or 3, using pressure cat-egory × weight combinations reflecting the importanceof the pressures. One way of dealing with uncertaintywith regard to pressure category × weight combina-tions would be the development of weighting schemesbased on stakeholder consultations. At the same time,a planning cycle should allow for a rapid adaptation ofspatial management decisions in case new knowledgeon sensitivity and in-combination effects of humanpressures becomes available.
Our framework is based on the assessment ofimpacts of generic pressures on ecosystem compo-nents developed and applied by OSPAR (Conventionfor the Protection of the Marine Environment of theNorth-East Atlantic) and also distinguished in theMSFD (EU 2008). Other studies dealing with theassessment of impacts of human activities (e.g. Ban &Alder 2008, Halpern et al. 2008a) focus on the activitiesthemselves rather than on generic pressures exertedby those activities. Thus, depending on the type of risk
the user is interested in, our framework could also bemodified to focus on multiple activities rather than onmultiple pressures by omitting the first step. In thiscase, the sensitivity measure included in the frame-work would need to reflect the sensitivity to a certainactivity as opposed to sensitivity to a pressure. Such asimplification of the framework might be suitable forlocal applications where comprehensive data on foot-prints and intensities of activities and the respectivemeasures of sensitivities are available. In contrast, ourmore generic approach, using pressures rather thanactivities, allows a generic assessment and comparisonbetween different spatial locations independent of thetype of activities occurring in those areas.
In summary, uncertainty exists across many compo-nents of our modelling framework, including dataquality, model design and/or parameters used. Never-theless, management decisions must be made, even inthe context of incomplete knowledge (Kerns & Ager2007). The computation of different scenarios of risk ofcumulative impacts based on the users’ assumptionsalso facilities a stakeholder engagement as differentoutcomes and their consequences can be discussed.Thus, different stakeholder views can be translatedinto respective risk assessment scenarios. We concludethat our spatially explicit, standardised and repeatableapproach to quantifying risk of cumulative impact is apractical tool that can support the development of sus-tainable marine plans.
Acknowledgements. This study was funded by the UKDepartment of Environment, Food and Rural Affairs (Defra)(contracts ME1420 and A1148).
LITERATURE CITED
Ban N, Alder J (2008) How wild is the ocean? Assessing theintensity of anthropogenic marine activities in BritishColumbia, Canada. Aquat Conserv: Mar Freshw Ecosyst18:55–85
Boroushaki S, Malczewski J (2008) Implementing an exten-sion of the analytical hierarchy process using orderedweighted averaging operators with fuzzy quantifiers inArcGIS. Comput Geosci 34:399–410
Burrough PA, McDonnell A (1998) Principles of geographicalinformation systems. Oxford University Press, New York
Christensen MR, Graham MD, Vinebrooke RD, Findlay DL,Paterson MJ, Turner MA (2006) Multiple anthropogenicstressors cause ecological surprises in boreal lakes. GlobChange Biol 12:2316–2322
Connor D, Gilliland P, Golding N, Robinson P, Todd D, Ver-ling E (2006) UKSeaMap : the mapping of seabed andwater column features of UK seas. Joint Nature Conserva-tion Committee, Peterborough
Crain CM, Kroeker K, Halpern BS (2008) Interactive andcumulative effects of multiple human stressors in marinesystems. Ecol Lett 11:1304–1315
Darling ES, Côté IM (2008) Quantifying the evidence for eco-logical synergies. Ecol Lett 11:1278–1286
31
Mar Ecol Prog Ser 398: 19–32, 2010
Defra (2005) Charting progress: An integrated assessment ofthe state of the seas. Department for Environment, Foodand Rural Affairs, London
Defra (2007) Cost impact of marine biodiversity policies onbusiness—the marine bill. Department for Environment,Food and Rural Affairs, London
Defra (2008) Draft Marine Bill, April 2008. Defra, LondonDouvere F (2008) The importance of marine spatial planning
in advancing ecosystem-based sea use management. MarPolicy 32:762–771
Eastwood PD, Mills CM, Aldridge JN, Houghton CA, RogersSI (2007) Human activities in UK offshore waters: anassessment of direct, physical pressure on the seabed.ICES J Mar Sci 64:453–463
EU (2008) Directive 2008/56/EC of the European Parliamentand of the Council of 17 June 2008, establishing a frame-work for community action in the field of marine environ-mental policy (Marine Strategy Framework Directive).http://eur-lex.europa.eu/LexUriServ/LexUriServ.do?uri=OJ:L:2008:164:0019:0040:EN:PDF.
Evans KE, Klinger T (2008) Obstacles to bottom-up imple-mentation of marine ecosystem management. ConservBiol 22:1135–1143
Fisher P (2000) Fuzzy modelling. Taylor & Francis, LondonFoden J, Rogers SI, Jones AP (2009) Recovery rates of UK
seabed habitats after cessation of aggregate extraction.Mar Ecol Prog Ser 390:15–26
Folke C, Carpenter S, Walker B, Scheffer M, Elmqvist T, Gun-derson L, Holling CS (2004) Regime shifts, resilience, andbiodiversity in ecosystem management. Annu Rev EcolEvol Syst 35:557–581
Folt CL, Chen CY, Moore MV, Burnaford J (1999) Synergismand antagonism among multiple stressors. LimnolOceanogr 44:864–877
Gerwick BC, Gerwick BCJ (2007) Construction of marine andoffshore structures. CRC Press, Boca Raton, FL
Gilliland PM, Laffoley D (2008) Key elements and steps in theprocess of developing ecosystem-based marine spatialplanning. Mar Policy 32:787–796
Halpern BS, Selkoe KA, Micheli F, Kappel CV (2007) Evaluat-ing and ranking the vulnerability of global marine ecosys-tems to anthropogenic threats. Conserv Biol 21:1301–1315
Halpern BS, McLeod KL, Rosenberg AA, Crowder LB (2008a)Managing for cumulative impacts in ecosystem-basedmanagement through ocean zoning. Ocean Coast Manage51:203–211
Halpern BS, Walbridge S, Selkoe KA, Kappel CV and others(2008b) A global map of human impact on marine ecosys-tems. Science 319:948–952
Hastie TJ, Tibshirani RJ (1990) Generalized additive models.Chapman & Hall, London
Hope BK (2006) An examination of ecological risk assessmentand management practices. Environ Int 32:983–995
Jiang H, Eastman JR (2000) Application of fuzzy measures inmulti-criteria evaluation in GIS. Int J Geogr Inf Sci 14:173–184
Kerns BK, Ager A (2007) Risk assessment for biodiversity con-servation planning in Pacific Northwest forests. For EcolManag 246:38–44
Kitsiou D, Coccossis H, Karydis M (2002) Multi-dimensional
evaluation and ranking of coastal areas using GIS andmultiple criteria choice methods. Sci Total Environ 284:1–17
Leslie HM, McLeod KL (2007) Confronting the challenges ofimplementing marine ecosystem-based management.Front Ecol Environ 5:540–548
MacDonald LH (2000) Evaluating and managing cumulativeeffects: process and constraints. Environ Manag 26:299–315
Maina J, Venus V, McClanahan TR, Ateweberhan M (2008)Modelling susceptibility of coral reefs to environmentalstress using remote sensing data and GIS models. EcolModel 212:180–199
Malczewski J (1999) GIS and multicriteria decision analysis.Wiley & Sons, New York
Malczewski J (2004) GIS-based land-use suitability analysis:A critical overview. Prog Plann 62:3–65
Malczewski J (2006) GIS-based multicriteria decision analysis:A survey of the literature. Int J Geogr Inf Sci 20:703–726
Mora C, Metzger R, Rollo A, Myers RA (2007) Experimentalsimulations about the effects of overexploitation and habi-tat fragmentation on populations facing environmentalwarming. Proc Biol Sci 274:1023–1028
Portman ME (2007) Zoning design for cross-border marineprotected areas: The Red Sea Marine Peace Park casestudy. Ocean Coast Manage 50:499–522
Rosenberg AA, McLeod KL (2005) Implementing ecosystem-based approaches to management for the conservation ofecosystem services. Mar Ecol Prog Ser 300:270–274
Ruckelshaus M, Klinger T, Knowlton N, DeMaster DP (2008)Marine ecosystem-based management in practice: Scien-tific and governance challenges. Bioscience 58:53–63
Saaty TL (1980) The analytical hierarchy process: planning,priority setting, resource allocation. McGraw-Hill, NewYork
Stelzenmüller V, Rogers SI, Mills CM (2008) Spatio-temporalpatterns of fishing pressure on UK marine landscapes, andtheir implications for spatial planning and management.ICES J Mar Sci 65:1081–1091
Stelzenmüller V, Ellis JR, Rogers SI (2009) Towards a spatiallyexplicit risk assessment for marine management: Assess-ing the vulnerability of fish to aggregate extraction. BiolConserv (in press), doi:10.1016/j.biocon.2009.10.7
Vaz S, Martin CS, Eastwood PD, Ernande B, Carpentier A,Meaden GJ, Coppin F (2008) Modelling species distribu-tions using regression quantiles. J Appl Ecol 45:204–217
Villa F, Tunesi L, Agardy T (2002) Zoning marine protectedareas through spatial multiple-criteria analysis: The caseof the Asinara Island National Marine Reserve of Italy.Conserv Biol 16:515–526
Vinebrooke RD, Cottingham KL, Norberg J, Scheffer M, Dod-son SI, Maberly SC, Sommer U (2004) Impacts of multiplestressors on biodiversity and ecosystem functioning: Therole of species co-tolerance. Oikos 104:451–457
Wood LJ, Dragicevic S (2007) GIS-based multicriteria evalua-tion and fuzzy sets to identify priority sites for marine pro-tection. Biodivers Conserv 16:2539–2558
Zacharias MA, Gregr EJ (2005) Sensitivity and vulnerabilityin marine environments: An approach to identifying vul-nerable marine areas. Conserv Biol 19:86–97
32
Editorial responsibility: Jake Rice,Ottawa, Ontario, Canada
Submitted: June 18, 2009; Accepted: September 28, 2009Proofs received from author(s): December 11, 2009