Tome of Ultimate Mapping - Cloud Object Storage | Store & …€¦ · · 2017-04-11However, this...
15
WELCOME Welcome to the Tome of Ultimate Mapping. Together, we will journey through the realms of fantasy mapmaking using the range of cartographic software from ProFantasy. This Tome will take you into the depth of Campaign Cartographer 3+ and all its add-ons and companion products, providing you with a wealth of information, tips and tricks you can use when creating your maps. The Tome contains a selection of the collected knowledge and experience from both our master mappers, as well as the users of the Campaign Cartographer software range. Therefore, I’d like to thank all of you for making this work possible. Credits and Acknowledgements Tome of Ultimate Mapping written and laid out by Remy Monsen Parts of this book is based on previous work by Allyn Bowker, Simon Rogers, Ralf Schemmann, Mark Fulford, Linda Kekumu, Joe Slayton, L Lee Sauders, Kevin Thomas, Morgan Olden, Tony Marker, et al CC3+ concept and design: Simon Rogers, Mark Fulford CAD Source Code and CC3+ Engine: Mike Riddle Programming: Peter Olsson, Joe Slayton Additional programming: L Lee Saunders Additional Effects Filters: Joe Slayton Thanks to all members of the ProFantasy mailing lists and forum. You have all taken part in providing me with the inspiration for many of the tutorials in this book. ©Copyright 2016 ProFantasy Software, Ltd except for those images whose copyright is held by the artist Software ©Copyright 2016 ProFantasy Software, Ltd Campaign Cartographer 3™, Campaign Cartographer 3+™, CC3™ and CC3+™ are trademarks of ProFantasy Software Ltd. Fractal Terrains 3™ is a trademark of ProFantasy Software, Ltd. Windows® is a registered trademark of Microsoft Corporation. TrueType® is a registered trademark of Apple Computer, Inc. Photoshop® is a registered trademark of Adobe Systems Inc. Traveller® is a registered trademark of Far Future Enterprises. Mindjammer® is a registered trademark of Cubicle 7 Entertainment Ltd. ToUM3-03-03
Transcript of Tome of Ultimate Mapping - Cloud Object Storage | Store & …€¦ · · 2017-04-11However, this...

WELCOME Welcome to the Tome of Ultimate Mapping. Together, we will
journey through the realms of fantasy mapmaking using the range
of cartographic software from ProFantasy. This Tome will take you
into the depth of Campaign Cartographer 3+ and all its add-ons and
companion products, providing you with a wealth of information,
tips and tricks you can use when creating your maps.
The Tome contains a selection of the collected knowledge and
experience from both our master mappers, as well as the users of
the Campaign Cartographer software range. Therefore, I’d like to
thank all of you for making this work possible.
Credits and Acknowledgements
Tome of Ultimate Mapping written and laid out by Remy Monsen
Parts of this book is based on previous work by Allyn Bowker, Simon Rogers, Ralf Schemmann, Mark Fulford, Linda Kekumu,
Joe Slayton, L Lee Sauders, Kevin Thomas, Morgan Olden, Tony Marker, et al
CC3+ concept and design: Simon Rogers, Mark Fulford
CAD Source Code and CC3+ Engine: Mike Riddle
Programming: Peter Olsson, Joe Slayton
Additional programming: L Lee Saunders
Additional Effects Filters: Joe Slayton
Thanks to all members of the ProFantasy mailing lists and forum. You have all taken part in providing me with the inspiration for many of the tutorials in this book.
©Copyright 2016 ProFantasy Software, Ltd except for those images whose copyright is held by the artist
Software ©Copyright 2016 ProFantasy Software, Ltd
Campaign Cartographer 3™, Campaign Cartographer 3+™, CC3™ and CC3+™ are trademarks of ProFantasy Software Ltd.
Fractal Terrains 3™ is a trademark of ProFantasy Software, Ltd.
Windows® is a registered trademark of Microsoft Corporation.
TrueType® is a registered trademark of Apple Computer, Inc.
Photoshop® is a registered trademark of Adobe Systems Inc.
Traveller® is a registered trademark of Far Future Enterprises.
Mindjammer® is a registered trademark of Cubicle 7 Entertainment Ltd.
ToUM3-03-03

19
INTRODUCTION As you read this, you are probably already familiar with Campaign
Cartographer 3+™ (CC3+™). You have installed the software, read
the manual, and tried the tutorials you found within it. You might
even have tried out the annuals. In any case, we will assume that
you are familiar with the basics of the CC3+ interface, allowing us
to skip giving detailed explanations for the most basic tasks.
However, this tome is intended for all CC3+ users, not just the
experience veterans, so we will start slowly. If you are one of the
experienced veterans, you'll probably just want to skim through the
first few tutorials.
Campaign Cartographer 3+ (CC3+) forms the core of the Campaign
Cartographer suite of products. Using CC3+, you can create any
kind of map imaginable, including, but not limited to the following:
Overland maps in a multitude of styles, including local,
regional, continental and planetary maps.
Floor plans; Modern, fantasy and futuristic.
Portraits and Counters.
Battle Maps.
You can create all of the above in the base CC3+ software, and this tome will teach you the skills
needed to do so. However, there are several add-ons available for CC3+ that make the task of
creating specific map types easier, such as Dungeon Designer 3 for creating Dungeon, Floorplan and
Battle Maps, and City Designer 3 for creating villages, towns and huge cities. All of these add-ons
will be detailed in their own section of the Tome.
Annuals
The Cartographer’s Annual
is a premium subscription
service providing you with a
new issue every month of
the year. The annuals cover
various topics, so even if not
all issues in a given year are
interesting to you, most
people should find many
interesting issues. You can
read more about the
annuals on page 703.
Basics
If you are not familiar with
the basics of CC3+, you
should start with the CC3+
manual instead.
You should find it in your
@Documentation folder.
Moons
This composite image by Bill
Roach shows a brilliant,
warm, ringed gas giant with
two Earth like moons.
Both moons were created
using Fractal Terrains 3.
The moon is much smaller
than the planet, but the
perspective used for this
view makes it look larger.

20
THE BASIC OVERLAND MAP Let’s start this journey into the world of CC3+ by creating a basic map. We will use this map to
reacquaint ourselves with several of the core concepts of CC3+, and to explore some map-making
techniques.
During this tutorial, we will discuss various topics related to creating believable maps, so even if
you feel confident enough in your mapmaking to skip doing this tutorial, I recommend giving it a
quick read through even if you are not actually mapping along.
Maps and Magic (and Technology) When it comes to fantasy, whether it be in role playing games, computer games, literature or
movies, we will often encounter magic. And if we are going to create a map for a world where
magic exists, we must also consider how this will affect our maps.
The main reason for planning for this at the current stage is that I want to make sure my maps are
believable. If I make a map for a roleplaying game, I want my players to be able to look at the map
and feel that it fits naturally in the world. This obviously also holds true for a novel.
Magic is usually encountered in maps where features not normally possible are depicted. This may
be as blatantly obvious as flying mountains and rivers that run upstream, but may also be subtle like
terrain that wouldn’t normally form in a specific area, like a lush jungle far to the north where
normally there would be taiga.
Before even planning the map, you should have an idea of how magic will affect it. If you want a
world heavily modified by magic, keep this in mind during planning, and if you want a world where
magic is more rare and low-power (or even non-existent), you should plan for a world with features
that would be believable in the real world.
Personally, I prefer worlds where magic isn’t world-altering. I find it easier to accept a fantasy world
if it makes sense to me in a real-world context, and magic feels more special if it isn’t all-pervasive.
But a high-magic world can also feel believable if the magic is properly defined up front, so it makes
sense. But whatever you do, don’t let magic become an afterthought. Retroactively explaining all
the cool features of your world with “it’s magic” as your players point them out for braking the laws
of nature makes suspension of disbelief hard. Also, if a feature is shaped by magic, ask yourself why
someone would go through the effort to use all that magic to do this, or if it formed naturally, what
caused magic to form such a feature?
Oh, and if you do Sci-Fi, this applies equally. Futuristic technology will make possible what we
cannot do today, and terraforming is a common theme, but do remember that everything takes
time, money and effort. A feature shouldn’t be there just because it is cool, there should be a
believable reason for it.
Planning the Map Before going ahead with the mapping, you should at the very least have a basic plan in mind. What
is this location you are going to map? Where is it in the world? What geographical features would
you find in the area? What is the scale of the map? Is it densely populated? How long have people
been living here? What level of magic and technology do the inhabitants have? How is the mapped
area influenced by the off-map neighbors? What is the background for the area? How is the political
situation?
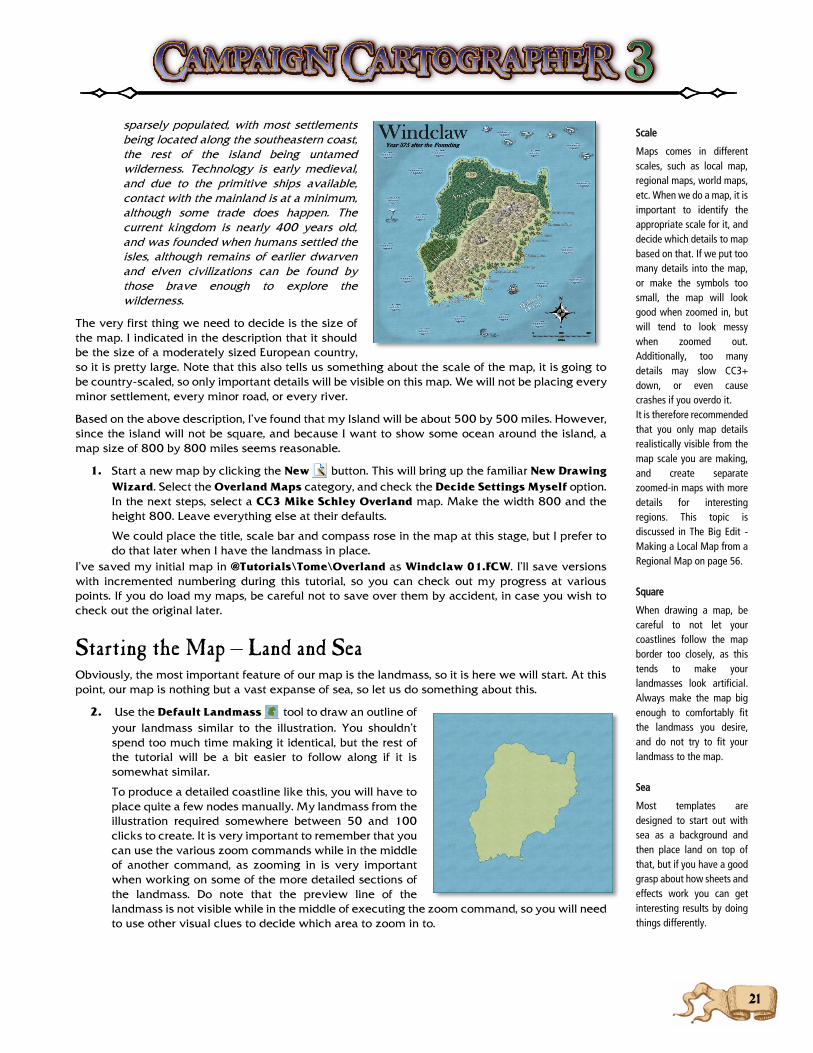
The area I am going to map for this tutorial is a large island from my own role playing campaign.
The following text briefly answers the questions from above, and give us some flavor to aid in
mapping.
The Island of Windclaw is the largest of the Windclaw Isles and also the location of the
capital of the Isles, Snowport. The group of islands is located in open sea in the northern
parts of Virana (about the same latitude as southern Norway on Earth). Windclaw is a
reasonably sized island, about the size of a moderate European country. The island is
Tutorial
All files for this tutorial are
located in the directory
@Tutorials\Tome\Overland,
and they are sequentially
numbered, starting with
Windclaw 01.FCW, unless
otherwise stated in the text.
Windclaw
You may remember
Windclaw from the CC3+
manual, as we mapped part
of the coastline for our
tutorial map there. This
time, we will map the entire
island.
I actually have the entire
world in Fractal Terrains 3
(see page 627) format, you
can find the world file in
@Tutorials/Tome/Fractal
Terrains/Virana.ftw. In the
FT3 chapter we will discuss
how to export this island
from FT3 to CC3+ instead of
drawing the coastline
ourselves.
21
sparsely populated, with most settlements
being located along the southeastern coast,
the rest of the island being untamed
wilderness. Technology is early medieval,
and due to the primitive ships available,
contact with the mainland is at a minimum,
although some trade does happen. The
current kingdom is nearly 400 years old,
and was founded when humans settled the
isles, although remains of earlier dwarven
and elven civilizations can be found by
those brave enough to explore the
wilderness.
The very first thing we need to decide is the size of
the map. I indicated in the description that it should
be the size of a moderately sized European country,
so it is pretty large. Note that this also tells us something about the scale of the map, it is going to
be country-scaled, so only important details will be visible on this map. We will not be placing every
minor settlement, every minor road, or every river.
Based on the above description, I’ve found that my Island will be about 500 by 500 miles. However,
since the island will not be square, and because I want to show some ocean around the island, a
map size of 800 by 800 miles seems reasonable.
1. Start a new map by clicking the New button. This will bring up the familiar New Drawing
Wizard. Select the Overland Maps category, and check the Decide Settings Myself option.
In the next steps, select a CC3 Mike Schley Overland map. Make the width 800 and the
height 800. Leave everything else at their defaults.
We could place the title, scale bar and compass rose in the map at this stage, but I prefer to
do that later when I have the landmass in place.
I’ve saved my initial map in @Tutorials\Tome\Overland as Windclaw 01.FCW. I’ll save versions
with incremented numbering during this tutorial, so you can check out my progress at various
points. If you do load my maps, be careful not to save over them by accident, in case you wish to
check out the original later.
Starting the Map – Land and Sea Obviously, the most important feature of our map is the landmass, so it is here we will start. At this
point, our map is nothing but a vast expanse of sea, so let us do something about this.
2. Use the Default Landmass tool to draw an outline of
your landmass similar to the illustration. You shouldn’t
spend too much time making it identical, but the rest of
the tutorial will be a bit easier to follow along if it is
somewhat similar.
To produce a detailed coastline like this, you will have to
place quite a few nodes manually. My landmass from the
illustration required somewhere between 50 and 100
clicks to create. It is very important to remember that you
can use the various zoom commands while in the middle
of another command, as zooming in is very important
when working on some of the more detailed sections of
the landmass. Do note that the preview line of the
landmass is not visible while in the middle of executing the zoom command, so you will need
to use other visual clues to decide which area to zoom in to.
Scale
Maps comes in different
scales, such as local map,
regional maps, world maps,
etc. When we do a map, it is
important to identify the
appropriate scale for it, and
decide which details to map
based on that. If we put too
many details into the map,
or make the symbols too
small, the map will look
good when zoomed in, but
will tend to look messy
when zoomed out.
Additionally, too many
details may slow CC3+
down, or even cause
crashes if you overdo it.
It is therefore recommended
that you only map details
realistically visible from the
map scale you are making,
and create separate
zoomed-in maps with more
details for interesting
regions. This topic is
discussed in The Big Edit -
Making a Local Map from a
Regional Map on page 56.
Square
When drawing a map, be
careful to not let your
coastlines follow the map
border too closely, as this
tends to make your
landmasses look artificial.
Always make the map big
enough to comfortably fit
the landmass you desire,
and do not try to fit your
landmass to the map.
Sea
Most templates are
designed to start out with
sea as a background and
then place land on top of
that, but if you have a good
grasp about how sheets and
effects work you can get
interesting results by doing
things differently.

22
Let us zoom in to a part of the coastline to have a look.
3. Use Zoom Window to zoom in to the top left of the landmass.
If we look at the coastline here, we’ll note that the detail level is rather
low. There are lots of straight lines here, and the coastline could surely
need a bit more definition. The easiest way to do this is to apply some
fractalization to the coastline.
Do note that your landmass consists of both the main landmass polygon,
as well as a blue outline. We cannot fractalize both at the same time
and still make the outline follow the landmass, so we need to remove
the outline, fractalize the landmass, and then create a new outline matching your newly fractalize
landmass.
4. Use Erase to delete the outline. If you don’t remember how to select just the outline
without also selecting the landmass, I recommend reviewing the Selection menu chapter on
page 47, but one way of doing this is selecting the outline (which will also select
the landmass), then hit (Both), followed by (Fill Style). The prompt now
reads Fill style name [dialog]:, so type s ol i d on the command line. You
should now see that the selection count drops to 1, so complete the procedure
by hitting (Do It). If you did this correctly, the outline should now be gone,
just leaving the actual landmass.
5. Click Fractalise .
Let us have a closer look at the fractalization dialog that
appears.
Strength determines how much variation we
introduce. If this number is too low, we will
struggle to see the result of the fractalization, but
if the value is too high, the result will be very
jagged. Good values range between 20 and 50.
Depth is the number of times the fractalization
algorithm runs. Each run will increase the detail
level of the entity, but will double the number of
nodes in the entity. Keep this number low!
Wave allows a more complex fractalization algorithm to run, which will vary the
strength instead of using a fixed value
Random Seed affects the random outcome of the algorithm. Changing this value will
change the result, but there are no good/bad values to use here.
Smoothing creates a smooth polygon instead of a regular polygon. This may improve
the end result, but a smooth polygon has a much longer redraw time than a regular
polygon, so be a bit careful with this option on entities with many nodes.
6. Set the options as shown in the image above. Click OK, then click on the coastline
to fractalize it. You may need to manually click Redraw to see the changes.
DON’T click multiple times on the coastline.
Compare the image to the right with the pre-fractalized coastline from step 4 above. We
can clearly see that the fractalized coastline is much more detailed, giving a more natural
look.
Now, we need to add the coastal outline back. We could do this by using Outline in
black or Outline in current color, which is the standard way of adding an outline to an entity, but
since we wish to restore the look of our landmass to look like a landmass drawn by a drawing tool,
it is faster to use the Change like draw tool for this, since we don’t need to manually adjust the
properties of the outline afterwards.
Fractalization
Fractalization works by
adding extra nodes to
increase detail. This is done
by inserting the extra node
midway between each
existing node pair, and
offsetting this node a bit so
that the line between the
original two nodes is no
longer straight. This can be
repeated multiple times
(depth), and each time the
lines are halved, doubling
the number of nodes in the
polygon.
Do note that having too
many nodes in any one
entity both slows down
CC3+, and if you go beyond
10,000 nodes, you will start
to encounter limitation in
the underlying operating
system, which can lead to
crashes, so be careful. You
can always use the LIST
command to check how
many nodes there are in a
polygon, and you can
reduce the number by using
the REDN command.
Hit
I prefer to do my selections
by using the shortcut keys
because this is far faster,
but you can accomplish the
same by using the right click
selection menu (see the
Selection menu chapter on
page 47).
Type
If you don’t know the exact
name of the fill style to look
for, you could instead just
have clicked the right
mouse button, and selected
the appropriate fill style
from the dialog instead.

239
Complex Rooms If you are starting at the tutorial at this point, you can load up the Chapel Maldina Catacombs 05
map in the @Tutorials\Tome\Dungeon folder.
So far, we have been drawing rooms using the standard room tools. This lets us easily draw circular
rooms, square rooms, rectangular rooms and polygonal rooms. The last one offers quite a bit of
flexibility, but what if we wish to draw a rectangular room with a half-circle end? Obviously, the
standard room tools don’t allow us to do this, but that doesn’t mean that CC3+ doesn’t allow us to
do this. With a little manual work, we can create rooms in any shape we desire.
Before we draw our rooms, let us
examine the properties of existing
rooms. We do this by using the List
command on one of our rooms. If you
select one of the corners of one of the
rooms, the status bar should tell you
that you have 3 entities selected, and
the List output should look like in the
image.
As we can see, a room is built from 3
entities. Two of them are on the
FLOORS sheet and one on the
WALLS sheet. If you remember the
Add Room dialog, this matches with
the choices in that dialog, as you
were prompted to select both a
background and a foreground floor,
and a wall. Since our foreground floor
is completely opaque, the back-
ground entity is never seen, so we
normally don’t concern us about it.
However, if you are using a partially
transparent foreground, you can get
nice effects by combining it with the correct background. We’ll explore this option later though. For
now, we will stick by opaque foreground floors and ignore the background completely.
From the list output, we are going to take with use a few important pieces of information. For each
of our two relevant entities, we need to know what sheet and layer they are on, what fill style they
use, and finally what line width they have.
12. Set the current sheet to FLOORS and the layer to BACKGROUND (FLOOR 2). Set line width to
0, line style to solid, and fill style to solid. Also set the color to something that will be visible
on the background. Whatever color we use will not be visible in the final map, so I tend to
use something highly visible, like color 6 (Pink).
13. Make sure you have the snap grid from previously (10’
grid, 2 snaps) enabled, then draw two 10’ radius circles
using the Circle tool below each other (Let there be
40’ between the circle centers) in the empty area in the
northwest part of the map. Then, draw two smaller 5’
radius circles, positioned like in the image. As long as
the snap grid is on, getting these correct is extremely
simple. My example image uses different colors for the
small and large circles to make the setup clearer, but
this is not needed. I have also turned off the
BACKGROUND sheet to make the entities easier visible
in the screenshots.
List
Remember the List
command found in the Tools
menu? It is extremely
helpful to find out
information about entitles,
such as the sheet and layer
they are on, colors, fill style,
and so on.
Snap Grid
The snap grid is highly
useful for exact placement
of points, especially in this
situation where we need
multiple entities to match
up perfectly. We could also
have used the regular
modifiers (like endpoint) to
achieve the same goal. The
modifiers are especially
useful when lining up
entities in a manner that
don't easily fit on a grid, but
for our purpose, the snap
grid is perfect.

240
14. These circles don’t look that much like a room yet, but if you look at
the outline of the circles, you may be getting an idea for what we are
trying to do here. And to make this into a room, that is exactly what
we need, the outline. By using the Break tool, we both remove the
part of the circle we don’t need, and change it from a filled circle to an
outline in one step.
Click the Break button. Now, select the upper large circle by
clicking on the top edge of it. The command line now asks you for the
break staring point. Click on the left edge of the circle (A little bit above
where it meets the smaller circle). Finally, for the ending point of the
break, click on the right edge of the circle. After executing a
Redraw , your map should look like the image.
15. Repeat the procedure for the bottom circle.
16. Now, for the smaller circles. Use the Break tool, select the circle by
clicking on the left edge, and the break points at the top and bottom.
This should leave the left halves of the circles.
17. Use the Path tool to draw a path starting at the open end at the top
circle, going 10’ to the right, 30’ down, and 10’ left to meet the open
point of the bottom circle.
Notice how we now have the outline of our room. We have a few gaps, but
these will be closed automatically when we combine the various parts.
We are now going to merge these outlines into a single polygon for our room.
The first thing we need to do is to change our half-circles into paths. Right
now they are arc entities, which cannot be a part of a polygon.
18. Right click the Explode button, and then select the Line to Path
command. Select all the 4 arcs, and then hit to complete the
command.
Each arc has now been converted to a path. If these arcs were
touching, they would also have been merged into a single path, but
since they weren’t, they are now 4 separate paths.
19. Right click the Explode button, and then select the Combine Paths
command.
This command is used to combine several paths into one continuous
path. If the paths are not already connected by sharing a common
point, it will also add a line segment between the paths to make them
continuous. However, when using this command, it won’t always
know which ends of the paths to join. Therefore, after having selected the two paths you
wish to join, the command line will read:
Select Next Path/[Finish] Flip Selections (‘F’ – First, ‘S’ – Second):
Use the and keys to flip the
endpoints used for the joining. Note that
this will actually reverse the order of the
nodes in the entity. There won’t be a
visible effect, but basically the start and
endpoints of the entity is now reversed.
If you use the wrong endpoints, you will
end up with an extra unwanted line
segment. Notice in the Incorrect image
how there is multiple line segments that
shouldn’t be there. This happened
because one or more paths were flipped
the wrong way during the joining. The
Correct image shows what happens when we correctly join the entities. It is also worth
Top Edge
When we use the break tool,
the part of the entity we
click on when we select it is
also the part of the entity
we are going to keep. If we
click in the wrong part of the
entity, we end up cutting
away the piece we want to
keep instead.
Arc
Arcs are a basic type of
CC3+ entities, like a line.
The default arc is defined
using a center point, the
starting angle of the arc,
and the size of the arc. Right
click on the Arc button to
see other ways you can
define these.

241
noticing that there appears to be a line missing in the Correct image. This happened because
after joining, we had both the start and ending point of our path in the same spot. To avoid
duplicate points, CC3+ deleted the end point. This will fix itself when we create a polygon
from this path, because a polygon always includes a closing line between the end point and
starting point, as opposed to a path which does not have this.
To use the Combine Paths command, first select the first two paths to combine, use and
to flip the entities to join the correct ends, then select the next path to join with the path.
This completes the merging of the first two paths, and you can use / to fit the new one.
Continue until all the paths have been joined, then right click to finish the command.
20. Right click the Explode button, and then select the Path to
Poly command. Select our path, then hit o it to complete
the command. Except for the fill, we now have a perfect floor.
That is, assuming we joined our paths correctly earlier. If not,
the polygon will look quite weird.
21. Use Change Properties on the entity to change the fill
style to Flagstone B Bitmap.
Now we have the floor in place. We still need the walls, but
notice how the walls should be in the exact same shape as the
floor. This makes that part of the job really easy.
22. Click the Copy button. Select the floor, hit to complete
the selection process. CC3+ now asks for the source position
of the copy, so enter 0,0 on the command line. Now CC3+
asks you to place the copy. Again, type 0,0 . This will place a copy of our floor exactly
on top of the existing one. Finally, right click to end the command.
23. Click Change Properties . However, instead of clicking on the floors to select them, hit
. This stands for Prior, and will automatically select the last entities you had selected, or if
we copied entities, the last copy you placed. This is very helpful, since it will select the copy
of the floor we just placed, but not the original. Hit to finalize the selection process, and
the Change Properties dialog should show.
Now, change the properties to the correct properties for
a Wall entity which we found using the List command
earlier. These are:
Layer: WALLS
Sheet: WALLS
Width: 2
Fill: Wall Cobble Grey Bitmap
That’s it. We have created a complex room, using both
circles and straight walls. We also made sure to use the
correct properties for both walls and floor, so this room
will work exactly like a regular dungeon room. This
means that we can connect corridors to it and break the
walls just as for any other room. Notice that connecting
corridors to the rounded parts does work poorly
however.
24. Connect the room to the neighboring room with a corridor.
Prior
If you try to select the
entities the normal, way,
you will find that when you
click on the floor, both the
original and the copy will be
selected. Because they are
in the exact same spot, it is
impossible to select only
one of them. Since they are
copies, they are identical in
every regard, except for the
entity tag. So, to select only
one of them, you could also
use list on the entities to
learn their entity tags, then
select by entity tag to only
get one of them. Suffice to
say, selecting by Prior is
much faster.

280
11. Add a Texturize effect. Use @Bitmaps\Tiles\Overland\ice_VH.png as the texture, and an
intensity of 1. This will give the background the same roughness as the ice walls.
12. Add an Adjust Hue/Saturation effect, with a lightness value of 25. Leave the other values
at 0. This will lighten the overall color of the background
Finishing Touches
That yellow map border doesn’t fit too well with this map. I would think that something closer to
blue would be better.
The yellow part of the map border consists of 2 polygons, one for the dark color, and one for the
light color.
13. Change the colors of each of the two yellow polygons. Change the color of the dark polygon
to color 65, and the color of the light polygon to 69.
14. Add the Texturize effect to the MAP BORDER sheet to remove the flat look. Use
@Bitmaps\Tiles\Overland\ice_VH.png as the texture, and an intensity of 1.
There you go; a nice cool ice cave for your adventures. Notice how we drew this one “backwards”.
Instead of drawing rooms and corridors, we actually drew the solid areas instead.

321
taverns frequented by the sailors currently in town, as well as dock workers. Housing is generally
cheap, but small and low standard.
When planning your districts, think of what kinds of houses and businesses belong in the area.
Which people live here? How do they live? Which people work here? Where do they work? Which
people tend to visit the district? Why are they visiting?
Snowport has been an important port from the earliest history of the city. So it is only natural that
there is large dock district here. Additionally, the King of the Isles has always lived in Snowport,
attracting the wealthier citizens to that part of the city, forming the government district. Around the
eastern gate in the city wall, we find the warriors district, named after the eastern gate, which is
again named the Warriors Gate because it was through this gate the city’s warrior would return
triumphantly after taking care of whatever threat the city was experiencing. Lastly, we have the
river district to the west, around the River Gate.
Mapping the City Now that we have a plan, we are ready to start mapping
the city.
Now, where to start our mapping? I prefer to start
mapping a city by getting the bigger details into place,
like the terrain, and let the city flow around them rather
than shaping the terrain to the city.
Terrain The most important terrain features of this particular city
are the coastline and river. We already established that
the city had a natural harbor, so let us ensure that our
coastline represents this.
If we look at the local map of the region, you can see that
the river seems to run just to the southwest of the city.
However, this is really just due to the fact that a symbol
on the overland map just represents the location of the
city, but doesn’t properly represent the exact dimensions
of the city. Additionally, it would have obscured the river
if I placed it on top of it, so I left it next to the river, but
when mapping the actual city, I fully intend to let the river
flow through it. The same is true with regards to the coastline. It looks bad if I try to place the
overland symbol on the actual coastline itself, and it makes the map harder to read. If I wanted the
overland map to be 100% exact in this matter, I would have needed to resort to a colored polygon
for my city instead of a symbol. For a modern type of map, that would probably have been the way
to go, but for a fantasy map, we must often compromise a bit between visual looks and complete
accuracy.
1. Start a new City map based on the CD3 Bitmap A style. Use a map size of 2000×1600 feet,
and use CD3B_Grass Dark 3 as the background fill. To follow along with my tutorial maps,
check out the numbered Snowport maps in @Tutorials\Tome\City.
Note that this style relies a bit on effects to make everything look right. The effect setting
CD3 Bitmap A should be loaded with the template, if not, you should load this setting. Do
note that this city map is much more resource demanding than any of the other maps we
have drawn so far in this book, so you may wish to leave effects disabled when drawing.
Additionally, if you feel things are going a bit slow, you may reduce the setting for the
Automatic bitmap quality under Speed Settings. Checking the various options under
Shading in this dialog also speeds up drawing considerably, at the expense of visual look.
Just remember to reset the settings before printing or exporting the map.
CD3 Bitmap A
I base this city on the CD3
Bitmap A style, but I am
going to use several
elements from the CD3
Bitmap B style too,
especially fills.

322
2. Use the Water, Smooth drawing tool to add a coastline.
Remember that this is an extreme close-up of the coastline
compared to the King’s Coast local map, so we should add
additional details, but we should also give the local map a quick
glance to make sure we get the overall shape and positioning
correct.
Now, I also said that the river flows through the city, so we need to add
that. There are no separate drawing tools in this style to make larger
rivers, but neither do we need one, as we can continue using the same drawing tool as we did for
the sea.
3. Use the Water, Smooth drawing tool again to draw a river coming
in from the upper half of the left edge and running into the bay.
Remember that you now need to draw the river as a polygon,
effectively drawing each river bank individually as opposed to
drawing a single line using the overland river drawing tools.
In the screenshot to the right, I made the river pink to show
exactly how I drew it, but yours will be the same color as the sea.
Note that I used the node edit tools (See page 50) to make the
river extend slightly beyond the map border. I did this because the river is set up with an
edge effect, and I didn’t want that effect to appear where the river exited the map. Remember
that the white polygons on the SCREEN sheet will cover up anything that extends slightly
beyond the map border, so this part of the river will not be seen in the final map. Also note
that you don’t need to be concerned by the edge where the river touches the ocean, since
the river and ocean will be one surface as far as effects are concerned.
Partitioning the City From our discussion, we decided that the city should have a city wall,
and that it consists of 4 districts (docks district, government district,
warriors district and river district). I like to set up the area used by the
city and the partitioning first, so that I know how to treat each area. Let
us start with the city wall.
There is a drawing tool called City Wall 20’, which is excellent for the
wall itself. However, I do like to add some towers to my wall as well; something there is no drawing
tool for. Fortunately, we can define our own drawing tools, so let us take care of this little issue
immediately.
4. Make a copy of the City Wall 20’ drawing tool, and name it City
Wall Tower. Edit your new drawing tool, and set the Draw method
to Ellipse/Circle. Hit the Options button, and set Eccentricity to
1.0. This will ensure that our towers are circular and not elliptical.
Click the Properties button, and set the Width to the fixed value
of 8.0. Finally, click the Outline button, then the Properties button
in that dialog. Set the width of the outline to a fixed value of 0.0.
That’s it. You now have a tower uses the exact same settings as
the rest of the wall. When placing a tower, simply draw it on top
of the wall where you want it, and it will merge seamlessly with
the wall.
5. I also created a tool to draw simple gatehouses for the city gates.
This tool is made the exact same way as the tower tool above, the
only difference is that the Draw method is set to Path/polygon,
and the Closure option is set to Closed. If you wish to make perfect
rectangles with this tool, I recommend using some construction
lines first to set up the rectangle, then using these as a guide when
drawing the gatehouse (the Endpoint modifier is helpful here.)
Start with City Wall
I start with the city wall
because I already have a
rough vison on how this city
looks. By starting with the
city wall, I find it easier to
show a city where the city
wall has been a limiting
factor in expansion, which
often was the case.
However, if you have not
decided on the layout of
your city, you may find that
building the city first, and
then encircling it with a wall
later may also work,
although this approach can
lead to an “unnatural”
spacious city. In the end,
choose the approach that
fits you and the current city
best.
Copy
For more details on how to
create and edit drawing
tools, see Editing and
Creating Drawing Tools on
page 140.
Merge Seamlessly
The reason for this behavior
is that the outline and main
entity is on two different
sheets for this tool. This will
cause the outline for the
walls to appear on top of
your tower walls, even if
you draw the tower on top
of the wall. Just remember
to do a reload after placing
the tower to observe the
behavior.
Construction Line
A construction line is a
temporary line used to aid
in drawing, but which is not
part of the final drawing. A
construction line is usually
set up on its own layer so
that it is easy to hide these
lines. To make it contrast
with the map and easy to
spot, I usually use bright
green or pink for these lines.
403
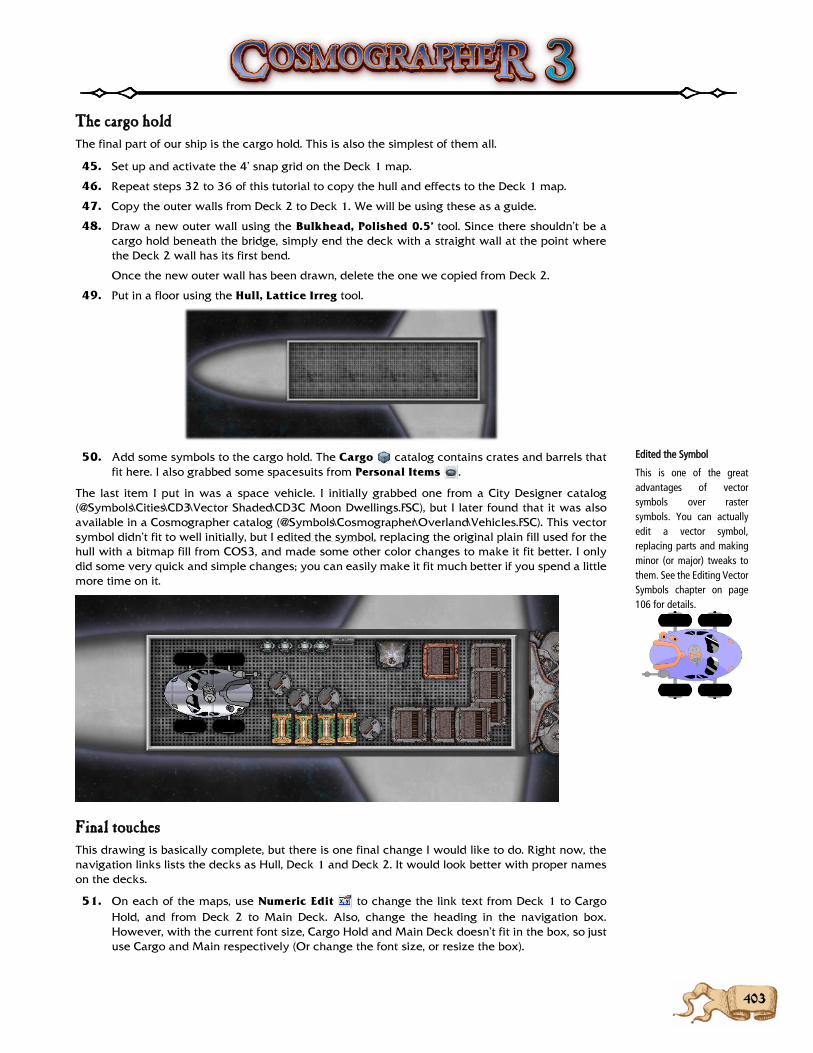
The cargo hold The final part of our ship is the cargo hold. This is also the simplest of them all.
45. Set up and activate the 4’ snap grid on the Deck 1 map.
46. Repeat steps 32 to 36 of this tutorial to copy the hull and effects to the Deck 1 map.
47. Copy the outer walls from Deck 2 to Deck 1. We will be using these as a guide.
48. Draw a new outer wall using the Bulkhead, Polished 0.5’ tool. Since there shouldn’t be a
cargo hold beneath the bridge, simply end the deck with a straight wall at the point where
the Deck 2 wall has its first bend.
Once the new outer wall has been drawn, delete the one we copied from Deck 2.
49. Put in a floor using the Hull, Lattice Irreg tool.
50. Add some symbols to the cargo hold. The Cargo catalog contains crates and barrels that
fit here. I also grabbed some spacesuits from Personal Items .
The last item I put in was a space vehicle. I initially grabbed one from a City Designer catalog
(@Symbols\Cities\CD3\Vector Shaded\CD3C Moon Dwellings.FSC), but I later found that it was also
available in a Cosmographer catalog (@Symbols\Cosmographer\Overland\Vehicles.FSC). This vector
symbol didn’t fit to well initially, but I edited the symbol, replacing the original plain fill used for the
hull with a bitmap fill from COS3, and made some other color changes to make it fit better. I only
did some very quick and simple changes; you can easily make it fit much better if you spend a little
more time on it.
Final touches This drawing is basically complete, but there is one final change I would like to do. Right now, the
navigation links lists the decks as Hull, Deck 1 and Deck 2. It would look better with proper names
on the decks.
51. On each of the maps, use Numeric Edit to change the link text from Deck 1 to Cargo
Hold, and from Deck 2 to Main Deck. Also, change the heading in the navigation box.
However, with the current font size, Cargo Hold and Main Deck doesn’t fit in the box, so just
use Cargo and Main respectively (Or change the font size, or resize the box).
Edited the Symbol
This is one of the great
advantages of vector
symbols over raster
symbols. You can actually
edit a vector symbol,
replacing parts and making
minor (or major) tweaks to
them. See the Editing Vector
Symbols chapter on page
106 for details.

440
MAKING SOLID SHAPES AND HOLES Perspectives 3 includes some solid entities
to create platforms, stairs, balconies, towers
and holes. Cylinders, 3D Boxes and 3D
Polygons and other solids are all available.
After you’ve drawn the base of a solid, you
are asked for its height — if you select a
point above the base, you will get a solid, if
you select a point below the base, a hole.
3D Boxes To show the use of solids, we are going to add a raised pool to an existing room using 3D Box.
1. Open ShapesHoles 01.FCW. This
shows a room drawn in the P3B
Stone Wall, Flagstone Floor style.
2. Click Perspective Settings . Click P3B Brick
G Wall, Water Floor.
Note that the floor area thumbnail looks like a
watery surface.
3. On the Perspectives 3 toolbar click 3D Box .
The prompt reads First Corner:
4. Click the first point for the box about one-and-
half grid squares away from the north-west
corner of the room.
The prompt reads Second corner or enter length.
5. Click a point in the north-east corner of the
room. The cursor should be parallel to the
north wall.
The prompt reads Third corner or enter
length [square]:
6. Click the final point for the room near the
south-east corner.
The prompt reads Height or Depth[6]:
7. Type 2’ and press for a 2’ high raised area.
(ShapesHoles 02.fcw)
3D Regular Polygon Now we’ll make an indented area filled with water to go on the raised floor.
8. Set the current sheet to FLOOR 01.
9. Zoom in to an empty area to the side of the floor plan. We are going to draw this hole at floor
level, then move the center over the raised area.
10. Right click 3D Box . Click 3D Regular Poly.
The prompt reads Number of nodes [6]:
11. Type 8 for an octagonal hole. Press .
The prompt reads Center:
Other Solids
Other solids are available,
but these are currently beta
versions. They do not hatch
properly. Type in their text
equivalents to use them –
but remember they are
betas. We recommend that
you use them with a
Perspective Setting that
does not have a hatch
pattern (for example,
Current Color, Solid) To use
them, type the text
equivalent at the Command
prompt.
Solid Text Equivalent
Pyramid IPYRAMID
Cone ICONE
Sphere IPSPHERE
Spherical Section
IPSPHERA
Slope IBOXA
Floor Level
If you want to work on a
horizontal surface that is
not at floor level, you have
three choices:
▪ Work by eye, that is,
guess.
▪ Work at floor level, then
move the entities to the
correct height (a move up
or down in Per3, is a move
up or down the screen)
▪ Move the entire snap grid
upwards. Right-click the
Grid button then edit the
current grid settings.
Increase or decreasing the
Y value of the grid center
to change the height.

561
MIXING MAP STYLES In this floorplan tutorial, we will look at how
to mix map styles for good effect. We will
draw a modern map in the SS3 Bitmap A
floorplan style, but we will also use elements
from the DD3 dungeon style and the SS2
Bitmap A style as well. The result should be
a very unique map.
For this map, we will make a small street
scene, where some strange demonic
platform has broken through from below.
The general layout will contain a road, a
parking lot, two buildings, an area behind the
buildings with a park, which also is the
location where our demonic platform will
break through.
Do beware that this tutorial contains a lot of tiny details, but the I think the result is quite pleasing.
Consider this an advanced tutorial. I will explain how to accomplish everything in this map, but I
won’t tell you every button you need to press or every symbol to place. By now, you should have
more than enough grasp on the basics to understand what I am talking about at the various stages.
Also, If I tell you do something on a sheet or layer you don’t have, create it. Refer to the complete
sheet list on the next page for the complete sheet order.
You can find tutorial maps for various stages through this tutorial in the @Tutorials\Tome\SS3 folder,
under the Breaking Through filename. Be warned that this map is rather heavy on the effects, so a
reasonably fast computer is recommended.
Getting Started First, let us start a new map, and set it up with all the fill styles we will be using. I already know what
fill styles the map will use, so I am adding them now, but there is nothing wrong with doing this at
a later point if you need to include more fill styles.
1. Start a new map in the SS3 Bitmap A floorplan style. Size should be 150 by 80, and the
background should be Concrete_SS3A.
2. Use Draw -> Insert file, and insert @System\Fill Styles\DD3 Dungeon Color.FCW into your map.
However, when asked to place it in your map, don’t, simply hit to end the command
instead.
Repeat for @System\Fill Styles\SS2 Bitmap A.FCW.
Laying down the groundwork Since we started with the concrete background, we
need to lay down some grass, a parking lot and a
road.
3. Used the Terrain, Asphalt Cracked 1 drawing
tool for the road, and Terrain, Asphalt
Cracked 2 for the parking lot.
For the grass, I wanted the Grass_SS3A fill
style. However, there are no straight polygon
drawing tools for this grass, so I found it
easier to just draw the grass using Box .
Make sure everything we just drew ended up on the OUTSIDE sheet.
Insert
So, why did we start to
insert this file into the map,
but aborted before placing
it? The secret is how CC3+
handles fill styles. When you
insert one map into another
map, all the fill style
definitions from the map is
also inserted into the
current map. However, this
happens immediately,
before we place the file we
tried to insert. Since we
were only doing this to get
the fill style definitions,
placing the actual content
of the file was unnecessary.
Note that if you need to
include fill styles from a
style where no file exists in
@System\Fill styles, all you
need to do is to start a new
map in that style, save it
somewhere, and then insert
this file into a map the same
way.
If you don’t want all the fill
styles imported, you can
instead manually create
new fill styles one by one in
the fill style dialog, or use
Tools -> Import Bitmap Fill
styles to import all the fill
styles in one directory.

690
PROJECTIONS FT works with spherical worlds but your monitor is flat. A sphere won't fit on a flat surface, no matter
how hard you try. Try peeling an orange and getting the peel to lie flat on a table. It won't go flat
unless it tears or distorts. A map projection is the way in which a sphere (the orange rind) is distorted
and torn to fit on a flat surface (the table). Many map projections have been developed down over
the years to suit many tasks. Some preserve relative areas at the cost of distorting shapes, others
preserve shapes at the cost of distorting areas, and others try to compromise between the two.
FT provides many map projections; some are well suited for whole-world maps while others work
best on a local scale. It also includes interrupted projections, which can be used to display pieces of
a world rather than a single contiguous world.
Supported Projections
Albers Equal-Area Conic This conic projection is named after Heinrich C. Albers. The
projection uses two standard parallels. Shape and scale are not
preserved, but the distortion between the standard parallels is
very small.
It is primarily used for regional area maps.
Azimuthal Equidistant An azimuthal projection capable of showing the entire world at once.
Scale between any two points along a line passing through the center of
the projection is true. Distorts the shapes and areas of places on the world.
Examples of maps using this projection are found as early as the 16th
century.
Equidistant Conic This projections is a conic projection using parallels that are equally
spaced. Distortion is the same along any one parallel, but there are both
angular and scale distortions outside the two standard parallels used
for this projection.
Equirectangular This cylindrical projection has the useful property that the scale
is constant and true along meridians and the equator. It is by far
the simplest projection to construct, being a simple graph of
latitude vs. longitude. It distorts both shape and area, with the
distortions increasing relative to distance from the equator.
The version of the Equirectangular project used by FT3 is actually
a special case called Plate Carree. In this projection, latitude and
longitude are equal in size. It may have been originated by Eratosthenes in ancient Greece, and was
widely used in the 15th and 16th centuries.