Together Toward Zero - MARC
93
Together Toward Zero 2018–2022 Kansas City Regional Transportation Safety Blueprint
Transcript of Together Toward Zero - MARC

Together Toward Zero 2018–2022
Kansas City Regional Transportation Safety
Blueprint

2 Destination Safe Coalition
Table of ContentsForeword ............................................................................................................................................5
Acknowledgements .........................................................................................................................5
23 USC § 409 ....................................................................................................................................5
A Life Remembered, Changed and Saved .................................................................................6
Statement of Coalition Support ....................................................................................................7
Executive Summary .........................................................................................................................8
Section 1: Introduction ....................................................................................................................11
The Coalition .................................................................................................................................11
Organization of This Document ...............................................................................................11
Notes About This Document .....................................................................................................12
Presentation of Information ......................................................................................................12
Section 2: Setting Regional Safety Performance Targets ......................................................13
Looking Back ................................................................................................................................13
Safety Performance Measures and Target Setting ..............................................................14
Looking Ahead .............................................................................................................................20
Section 3: Emphasis and Focus Areas.........................................................................................21
Spotlight Areas.............................................................................................................................21
Infrastructure ................................................................................................................................22
Behavioral ......................................................................................................................................22
Special Users .................................................................................................................................23
Section 4: Infrastructure .................................................................................................................24
Intersections .................................................................................................................................24
Fixed Object ..................................................................................................................................27
Run-Off-Road Crashes ................................................................................................................29
Horizontal Curve Crashes ..........................................................................................................30
Head-on Crashes ..........................................................................................................................32
Section 5: Behavioral .......................................................................................................................36
Aggressive Driving ......................................................................................................................36
Impaired Driving ..........................................................................................................................38
Unrestrained Occupants .............................................................................................................40
Distracted Driving ........................................................................................................................43
Unlicensed, Revoked or Suspended Drivers..........................................................................45
Section 6: Special Users .................................................................................................................48
Young Motorists (Ages 15-24) ..................................................................................................48
Older Motorists (Ages 65 or older) .........................................................................................51
Motorcycle/Moped Riders .........................................................................................................55
Pedestrians and Bicyclists .........................................................................................................57
Large Trucks ..................................................................................................................................62

3Towards Zero Deaths, 2018-2022
Appendix A: Regional Transportation Safety Data by County .............................................65
Appendix B: Acronyms and Abbreviations ................................................................................79
Appendix C: Definitions ..................................................................................................................81
Appendix D: Coalition Roles and Responsibilities ...................................................................85
Appendix E: Coalition Work Plan 2018-2022 ............................................................................90
List of Figures
Figure 1: Regional Crash Factors ..................................................................................................9
Figure 2: Destination Safe Regional Service Area....................................................................11
Figure 3: U.S. Roadway Fatalities 1950 - 2011 ...........................................................................13
Figure 4: U.S. Roadway Fatality Rate Per Million VMT 1950 – 2011 ......................................13
Figure 5: Missouri And Kansas Statewide Annual Traffic Fatalities 2006-2016 ................14
Figure 6: Destination Safe Fatality Trends .................................................................................15
Figure 7: Fatality Rate Trends for the Kansas City Region ....................................................16
Figure 8: Serious Injury Trends for the Kansas City Region...................................................16
Figure 9: Serious Injury Rate Trends for the Kansas City Region ........................................17
Figure 10: Five-year Average Fatality Targets ...........................................................................18
Figure 11: Five-year Average Fatality Rate Targets ..................................................................18
Figure 12: Five-year Average Serious Injuries Targets .............................................................19
Figure 13: Five-year Average Serious Injuries Rate Targets ...................................................19
Figure 14: Five-year Average Nonmotorized Fatalities and Serious Injuries Targets ......20
Figure 15: Fatalities and Serious Injuries by Focus Areas.......................................................21
Figure 16: Fatalities and Serious Injuries Involving Intersections .........................................24
Figure 17: Fatalities Involving Intersections by State ..............................................................25
Figure 18: Serious Injuries Involving Intersections by State ..................................................25
Figure 19: Fatalities And Serious Injuries Involving Fixed Objects .....................................28
Figure 20: Fatalities Involving Fixed Objects by State ...........................................................28
Figure 21: Serious Injuries Involving Fixed Objects by State .................................................29
Figure 22: Fatalities and Serious Injuries Involving Run-Off-Road Crashes ......................29
Figure 23: Fatalities Involving Run-Off-Road Crashes by State ...........................................30
Figure 24: Serious Injuries Involving Run-Off-Road Crashes by State ................................30
Figure 25: Fatalities Involving Horizontal Curves .....................................................................31
Figure 26: Fatalities Involving Horizontal Curves by State ....................................................31
Figure 27: Serious Injuries Involving Horizontal Curves by State .........................................32
Figure 28: Fatalities And Serious Injuries Involving Head-on Crashes ..............................33
Figure 29: Fatalities Involving Head-on Crashes by State .....................................................33
Figure 30: Serious Injuries Involving Head-on Crashes by State ..........................................33
Figure 31: Fatalities And Serious Injuries Involving Aggressive Driving .............................36
Figure 32. Fatalities Involving Aggressive Driving by State ..................................................37

4 Destination Safe Coalition
Figure 33. Serious Injuries Involving Aggressive Driving by State.......................................37
Figure 34. Fatalities and Serious Injuries Involving Impaired Driving .................................39
Figure 35. Fatalities Involving Impaired Driving by State ......................................................39
Figure 36. Serious Injuries Involving Impaired Driving by State ..........................................39
Figure 37. Fatalities and Serious Injuries Involving Unrestrained Occupants ....................41
Figure 38. Fatalities Involving Unrestrained Occupants by State ........................................41
Figure 39. Serious Injuries Involving Unrestrained Occupants by State .............................41
Figure 40. Fatalities and Serious Injuries Involving Distracted Driving ..............................44
Figure 41. Fatalities Injuries Involving Distracted Driving by State .....................................44
Figure 42. Serious Injuries Involving Distracted Driving by State ........................................44
Figure 43. Unlicensed, Revoked or Suspended Drivers ..........................................................46
Figure 44. Fatalities Involving Unlicensed, Revoked or Suspended Drivers by State ......46
Figure 45. Serious Injuries by Unlicensed, Revoked or Suspended Drivers by State .......46
Figure 46: Monthly Underage Alcohol Consumption ..............................................................48
Figure 47. Fatalities and Serious Injuries Involving Young Motorists ..................................49
Figure 48. Fatalities Involving Young Motorists by State .......................................................50
Figure 49. Serious Injuries Involving Young Motorists by State ...........................................50
Figure 50. Fatalities and Serious Injuries Involving Older Motorists ...................................52
Figure 51. Fatalities Involving Older Motorists by State .........................................................52
Figure 52. Serious Injuries Involving Older Motorists by State .............................................53
Figure 53. Fatalities and Serious Injuries Involving Motorcycle/Moped Riders ................55
Figure 54. Fatalities Involving Motorcycle/Moped Riders by State.....................................55
Figure 55. Serious Injuries Involving Motorcycle/Moped Riders by State .........................56
Figure 56: Fatalities and Serious Injuries for Nonmotorized Crashes .................................57
Figure 57: Pedestrian Fatalities as a Percentage of Total Crash Fatalities ........................58
Figure 58. Fatalities And Serious Injuries Involving Pedestrians ..........................................58
Figure 59. Fatalities Involving Pedestrians by State ...............................................................59
Figure 60. Serious Injuries Involving Pedestrians by State ....................................................59
Figure 61: Fatalities and Serious Injuries Involving Bicyclists ...............................................61
Figure 62: Fatalities and Serious Injuries Involving Large Trucks ........................................62
Figure 63: Fatalities Involving Large Trucks by State .............................................................63
Figure 64: Serious Injuries Involving Large Trucks by State .................................................63
Figures 65-77: Crash Statistics by County .................................................................................66-78

5Towards Zero Deaths, 2018-2022
FOREWORD
The preparation of this report was financed in part through a technical studies grant from the Federal Transit
Administration and metropolitan planning funds from the Federal Highway Administration, administered by the
Kansas and Missouri departments of Transportation. The opinions, findings and conclusions expressed in this
publication are those of the authors and not necessarily those of the Missouri Highways and Transportation
Commission, the Kansas Secretary of Transportation, the Federal Highway Administration or the Federal Transit
Administration.
Acknowledgements
Many thanks to all of the partner organizations and individuals who contributed to the preparation and review of this document, with special thanks to:
Americans for Older Driver Safety Missouri Department of Transportation
Blue Springs Police Department Missouri State Highway Patrol Troop A
Children’s Mercy Hospital & Clinics MRI Global
Independence Police Department Parsons Brinkerhoff
Jackson County Sheriff’s Office Pioneer Trails Regional Planning Commission
Kansas City Scout Platte County Health Department
Kansas City, Missouri Police Department Safe Kids Johnson County
Kansas Department of Transportation Safe Kids Metro KC
Kansas Highway Patrol Troop A Safety & Health Council of Western MO & KS
Kansas Traffic Safety Resource Office Unified Gov. of Wy. Co./KCK Public Health Department
MADD Heartland Chapter ThinkFirst of Greater Kansas City
Mid-America Regional Council Tri-County Mental Health Services
Midwest Trauma Society Truman Medical Center
23 USC § 409
This document is exempt under discovery or admission under 23 USC § 409. The collection of safety data in the
Kansas City region is encouraged to actively address safety issues on regional, local and site-specific levels. Congress
has enacted a law, 23 USC § 409, which prohibits the discovery or admission of crash and safety data from being
admitted into evidence in a federal or state court proceeding. This document contains wording, charts, tables,
graphs, lists and diagrams for the purpose of identifying and evaluating safety enhancements in the Kansas City
region. These materials are protected under 23 USC § 409. Congress’ rationale behind 23 USC § 409 is that safety
data is compiled and collected to help prevent future crashes, injuries and deaths on our nation’s transportation
system.
6 Destination Safe Coalition
“I urge motorists to
use extra caution when
they approach and drive
through work zones or
the scene of an accident
— for their own safety,
and especially for that of
the highway workers and
law enforcement officers
who are working there to
protect us.”
Former Missouri
governor Jay Nixon
“People make mistakes. This is one you
can’t take back. Think first and buckle up.
You have to be your own hero.“
Heather Tice
“My parents were strong advocates for
safety belt use. They always reminded me
to wear it before I went out with friends.
Also, my boyfriend always made sure that
everyone in his car was buckled in before
he would drive.“
Erin Rider
A Life Remembered
Date: September 21, 2012
Time: 1:50 a.m.
Place: Independence (Eastbound I-70 near Lee’s Summit Road)
Clifton J. Scott, a 1 veteran motorist
assist operator with the Missouri
Department of Transportation, was
struck by a motorist while working
an accident in Independence.
An impaired driver was speeding
when he crashed through cones and
barriers and struck Clifton. The driver had a blood alcohol content
more than double the legal level for Missouri.
A Life Changed
Date: July 12, 2005
Time: 3:30 p.m.
Place: Belton
At the young age of 15,
Heather Tice’s world
changed in an instant.
Riding in a car with an
inexperienced driver with
no safety belt on, Heather
suffered a C-7 spinal cord
injury as a result of a car crash. She spent months
recovering from her debilitating injury which left
her in a wheelchair for the rest of her life.
Heather, determined to not let her injury define
her, now advocates for safety as a Voices for
Injury Prevention (VIP) speaker for The Research
Foundation ThinkFirst of Greater Kansas City
and Young Traffic Offenders Program. Both of
these programs are dedicated to educating
young people on the importance of making
safe decisions through school assemblies and
educational programs. During the 2016-2017
academic year, Heather and other ThinkFirst VIP
speakers educated more than 37,000 local students
on the importance of making safe decisions like
wearing your safety belt. She earned her master’s
degree and currently works as a social worker.
Heather’s story inspires the Destination Safe
Coalition partners to continue working to prevent
needless tragedies and it helps remind us of the
foundation of our together toward zero approach
to transportation safety.
A Life Saved
Date: Circa 1992
Time: Around 10:00 p.m.
Place: St. Charles, Missouri
Erin Rider and two friends were on their way home
from Six Flags theme park. Erin’s boyfriend was
driving. They were late getting home for curfew,
so he was speeding. He took a tight S-curve too
fast. The vehicle made it around the first turn, but
on the second turn the right rear tire went off the
road onto the dirt shoulder. When the driver tried
to compensate, the car lost traction and spun out
of control. The car went off the road and ended up
about 100 feet into the corn field. There was a dip
in the ground and the car ended up stopping nose
down into the dip. Erin was thrown forward pretty
hard, but her safety belt stopped her from going
into the dash or through the windshield.
7Towards Zero Deaths, 2018-2022
Statement of Coalition Support
The Destination Safe Coalition is a partnership between federal, state, regional and local agencies to improve transportation system safety serving thirteen (13) counties in the Greater Kansas City region. The Coalition has active members from the fields of law enforcement, safety advocacy, engineering, public health, health care, transportation planning, emergency response, research science, behavioral science and other professional sectors.
The Coalition received input from local stakeholders and identified three emphases: infrastructure, behavior, and special roadway user, each with a set of focus areas, on which to focus transportation safety investments. The Kansas City Regional Transportation Safety Blueprint examines transportation safety issues in the region and identifies preferred strategies to address these issues. In all, there are fifteen (15) focus areas however; three (3) spotlight areas have been identified for further analysis over the life of the plan. The Coalition uses quarterly fatality reports to monitor progress towards fatality reductions including the 15 focus areas. An Annual Safety Report is produced to track progress towards performance measures targets and monitor emerging safety needs. The Annual Safety Report also identifies education and enforcement programs funded by state partners, and related Coalition accomplishments.
On November 29, 2017, the Coalition approved the Kansas City Regional Transportation Safety Blueprint, Together Toward Zero – 2018 - 2022.
_________________________ _________________________
Rose M. Simone, Director of Development Norraine Wingfield, Program Director ThinkFirst of Greater Kansas City Kansas Traffic Safety Resource Office Missouri Co-Chair Kansas Co-Chair

8 Destination Safe Coalition
EXECUTIVE SUMMARY
Destination Safe, a regional multidisciplinary transportation safety coalition, developed the Kansas City Regional Transportation Safety Blueprint Together Toward Zero: 2018-2022, also known as the Regional Blueprint, to provide guidance for decision makers seeking to reduce roadway fatalities and serious injuries in the region. This is the fourth Regional Blueprint.
The plan adopts a safety vision for the region. It provides information about the current state of roadway safety,
presents strategies for the reducation of fatalities and serious injuries and sets targets for both, and identifies priority
focus areas for improvement. The plan presents crash data by state and county as well as for the entire region.
The Regional Blueprint supports both state Strategic Highway Safety Plans (SHSPs), Missouri’s Blueprint A
Partnership Toward Zero Deaths – 2016-2020 and the Kansas Strategic Highway Safety Plan 2015. Strategies
presented for each focus area were developed from multiple sources and are intended to provide a toolbox of
options.
Crashes resulting in deaths and serious injuries are preventable. This plan embraces a bold vision for the region’s
future.
Our Vision
Destination Safe Coalition partners are working together to create the safest transportation system possible, a region with zero crash-related deaths and a culture of safety where every life counts and one death is too many.
Toward Zero Deaths, a national strategy on highway safety, and Vision Zero, a collaborative campaign aimed at advancing a shift toward safe, healthy, equitable mobility for all, complement this vision.
While the ultimate goal is zero deaths, we also recognize the importance of setting targets to measure progress. This plan addresses performance measure targets required by MAP-21 and the FAST Act.
The five safety performance measure targets were defined in accordance with the final USDOT rule on safety performance measures, authorized by 23 CFR Part 4901.1
Targets based on a five-year rolling average
Performance Measure 2018 Target 2022 Target
1. Number of fatalities 210.5 197.4
2. Fatality rate per 100 million vehicle miles traveled 0.904 0.802
3. Number of serious injuries 1131.5 891.9
4. Serious injury rate per 100 million vehicle miles traveled 4.886 3.630
5. Number of nonmotorized fatalities and serious injuries 108.3 83.1
The above targets project the following.
» 4 percent annual decrease in the number of fatalities.
» 6 percent annual decrease in the number of serious injuries.
» 6 percent annual decrease in the number of nonmotorized fatalities and serious injuries.
» 1 percent annual increase in vehicle-miles traveled (VMT).
Regional data from the five-year period between 2012 and 2016 was analyzed to develop aspirational performance measure targets. The adopted targets apply to the 13 counties of the Destination Safe service area. Both Kansas and Missouri have statewide targets for the period 2014-2018 based on the same five performance measures. Regional targets are designed to support statewide efforts through this period and have been projected through the period 2018-2022 for the purpose of this plan. Regional targets are scaled to establish reasonable targets for the Destination Safe Service Area and likewise may be further scaled to fit the eight counties of the Mid-America Regional Council’s (MARC) Metropolitan Planning Organization (MPO) planning area. (See Section 1, Figure 2)
This document should be used as a resource for city, county, regional and state officials to prioritize safety projects
1 Safety performance measure final rules available at www.regulations.gov (Dockets: FHWA-2013-0019 and FHWA-2013- 0020).

9Towards Zero Deaths, 2018-2022
and to consider safety strategies that could be incorporated in other roadway construction and maintenance projects. Destination Safe will seek to prioritize funding to safety projects in the region using a data-driven process and implement strategies with proven results.
Regional data from the five-year period was analyzed to identify regional focus areas grouped by three emphases (Infrastructure, Behavior, and Special User). In prior plans, “emphases” were referred to as “priorities”.
The prioritization process considers both fatalities and serious injuries when identifying focus areas. The list of crash factors is comprehensive in its coverage of potential contributing factors to a crash. Figure 1 shows all the crash factors that were included in the analysis, the number and percent of their involvement in fatal and serious injury crashes, and ranks the top 15 issues. A line of demarcation exists between these crash factors and the others included in our analysis. Each of these 15 factors has played a part in at least 500 combined fatalities and serious injuries in the region between 2012 and 2016.
The Destination Safe Coalition has elected to conduct additional analysis of the leading focus areas (spotlight areas) from each area of emphasis. The intent is to better understand and prevent crashes in order to reduce fatalities and serious injuries.
Focus Areas Emphasis Factor
Fatalities & Serious
Injuries Combined
Fatalities Serious Injuries
TotalPercent of Total Crashes
TotalPercent of Total Crashes
1 Infrastructure Intersection 3,505 342 31% 3,163 49%
2 Behavior Aggressive 3,179 534 48% 2,645 41%
3 Infrastructure Fixed Object 3,020 571 52% 2,449 38%
4 Special Users Young Drivers (15-24) 2,665 330 30% 2,335 36%
5 Infrastructure Run-Off-Road 2,348 385 35% 1,963 30%
6 Behavior Seat Belt Use (unbelted) 1,686 409 37% 1,277 20%
7 Infrastructure Horizontal Curve 1,471 282 26% 1,189 18%
8 Behavior Unlicensed, Revoked, or Suspended Drivers 1,408 265 24% 1,143 18%
9 Behavior Distracted 1,287 121 11% 1,166 18%
10 Behavior Impaired 1,257 329 30% 928 14%
11 Special Users Older Drivers (65+) 1,190 197 18% 993 15%
12 Special Users Motorcycles/Mopeds 1,055 173 16% 882 14%
13 Special Users Non-Motorized 642 171 16% 471 7%
14 Special Users Large Truck 584 134 12% 450 7%
15 Infrastructure Head-on 571 77 7% 494 8%
16 Infrastructure Work Zone 172 15 1% 157 2%
17 Special Users School Bus 18 3 0% 15 0%
18 Infrastructure Highway/Railway Crossing 11 3 0% 8 0%
Figure 1: Regional Crash Factors

10 Destination Safe Coalition
Many crashes involve more than one factor from this list. For example, a crash could involve an unbelted driver who was using a cell phone while navigating a curve. The vehicle leaves the roadway, the drivers is unable to regain control and collides with a fixed object, such as a tree. Did the crash result in a fatality or serious injury? Was the driver distracted by the phone conversation? At what time of the day or day of the week did the crash occur? As safety professionals, we study crashes to identify patterns that are predictable and apply strategies to prevent crashes and/or to lessen their severity.
Infrastructure-related crashes include intersections, fixed object, run-off-the-road, horizontal curves and head-on crashes. Lane departures are often associated with the first harmful event such as impacts with fixed objects when a vehicle runs off the road or head-on crashes when two or more vehicles collide. Single vehicle crashes comprise the largest group of crashes. Horizontal curves are a geometric condition that, when combined with speeding, distraction or poor weather conditions, may result in a crash. Strategies for this emphasis area are primarily engineering strategies and involve roadway and intersection design treatments. These treatments may change the geometry of the roadway, traffic control, or other characteristics of the roadway or roadside to reduce the risk of crashes.
Behavior-related crashes involve poor or careless decisions that increase the risk of roadway fatalities and serious injuries. Behaviors include drivers who choose to drive impaired, drive aggressively, distracted or unrestrained. Strategies presented for the focus areas within this emphasis are primarily education and enforcement programs aimed at modifying unsafe behaviors.
Crashes involving special users include young drivers, older drivers, motorcyclist/mopeds, pedestrians/cyclists and large trucks. Special user groups are unique and present a different set of challenges. Young drivers lack experience and are more likely to crash when distracted by vehicle occupants. Older adult drivers as a demographic are safe drivers but cognitive and physical abilities diminish with age. Motorcyclists, cyclists and pedestrians each have unique vulnerabilities as roadway users. Complete streets and safe crossings combined with education and enforcement are effective approaches. Drivers of large trucks are well trained, however the size of larger vehicles increases the severity of a crash. Strategies mainly focus on public education, truck inspections and Commercial Driver’s License (CDL) training.

11Towards Zero Deaths, 2018-2022
INTRODUCTION
The Coalition
The Destination Safe Coalition is an award-winning partnership among federal, state and local agencies in the Kansas City metropolitan area and surrounding rural areas dedicated to improving the safety of our transportation system. Partnerships create the strength of the Coalition. The Coalition has members from many community sectors — law enforcement, engineers, safety advocates, public health officials, citizens, trauma room nurses, transit coordinators, public works managers, emergency services providers, bike/ped advocates, local officials, planners, researchers and others — to coordinate and collaborate on highway safety programs and projects.
The Leadership Team is the governing body of the Destination Safe Coalition. Members on the Leadership Team represent interests to improve surface transportation safety throughout the Kansas City region.
The Leadership Team has adopted roles and responsibilities to outline the purpose of the Coalition and to define its governance. The document is periodically updated and may occur independent of the Kansas City Regional Safety Blueprint. Appendix D contains a current copy of the roles and responsibilities. Appendix E outlines a set of general strategies that form a framework of overarching objectives endorsed by the Leadership Team.
Destination Safe establishes the region’s transportation safety priorities, coordinates the region’s safety planning and implements coordinated efforts to improve transportation system safety. The Missouri and Kansas counties in MARC’s metropolitan planning organization boundaries, as well as Missouri counties in the Pioneer Trails Regional Planning Commission boundaries, are included in the scope of Destination Safe’s work. The Destination Safe Regional Service Area (shown in Figure 2) includes the counties of Johnson, Leavenworth, Miami and Wyandotte in Kansas and Cass, Clay, Jackson, Johnson, Lafayette, Pettis, Platte, Ray and Saline in Missouri.
Organization of this Document
The remainder of this document is organized as follows:
» Section 2 provides the historical trends in crash data at the national, state and regional level and then presents the regional performance targets required under the FAST Act.
» Section 3 introduces the emphasis and focus areas for the region.
» Sections 4, 5 and 6 examine the three emphasis areas in greater depth, including historical crash data for each
Figure 2: Destination Safe Regional Service Area

12 Destination Safe Coalition
focus area presented in rank order. Each focus area includes a list of possible strategies for improvement. Evidence based strategies with proven results are preferred.
» Appendix A provides fatalities and serious injuries for each focus area by county.
» Appendix B provides common acronyms and abbreviations used in this document and in transportation safety literature.
» Appendix C provides definitions of terms used throughout the document.
» Appendix D shares Destination Safe’s roles and responsibilities.
» Appendix E shares the Coalition Work Plan for 2018-2022.
Notes About This Document
The following pages describe regional transportation trends in each emphasis area and their related focus areas in more detail. Unless otherwise labeled, all figures present information for the four Kansas counties and nine Missouri counties included in Destination Safe’s region. Data used to develop the figures was provided by the Kansas Department of Transportation and the Missouri Department of Transportation, and was compiled by the Mid-America Regional Council.
Presentation of Information
A brief discussion is provided regarding trends or concerns for that focus area. Figures are provided to illustrate the number of fatalities and serious injuries that occurred in the region in each of the past five years by focus area.
In addition, tables present a menu of strategies to reduce the prevalence of crashes involving each focus area. The strategies included in the table were taken from a variety of sources, including national safety guides (TRB, 2003, NCHRP Report 500, Series), state highway safety plans and local experts. They include safety strategies focused on infrastructure, enforcement, education and health care. They are intended to serve as a toolbox to guide local practitioners.
The Coalition’s intent with this document is to encourage the consideration of safety impacts in all transportation projects throughout the region, and to support transportation decision-making with quality regional data. In many cases, strategies listed in this document can be incorporated into construction and maintenance projects or educational programs that are not otherwise focused on safety.
The tables of strategies include information about the time frame for implementation, the relative cost of implementation, and the potential safety partners who might be involved in implementation. The time frame for implementation is defined as current (indicating this treatment is already being implemented to some extent in the region), short-term (1 to 2 years), long-term (3 to 5 years) or future (indicating that implementation will require significant coordination, special funding, or policy change to implement). Cost is listed as inexpensive, low-cost, moderate-cost, or high-cost.
The following examples will assist in understanding the relative cost of strategies:
Finally, the “potential safety partners” column is provided as an indication of the groups who may have some responsibility or authority in carrying out the strategy, should it be implemented.
Inexpensive Strategies Low-cost Strategies Moderate-cost Strategies
High-cost/Premium Strategies
Education campaign Data improvements Obstruction removal Capacity improvements
Speed enforcement Signage Sidewalks Bus rapid transit
Collaboration and coordination
Wolf packs (saturation patrols)
Lighting Interchange construction
Signal timing Bicycle lanes Communications systems Road reconstruction
13Towards Zero Deaths, 2018-2022
SETTING REGIONAL SAFETY PERFORMANCE TARGETS
Looking Back
The United States
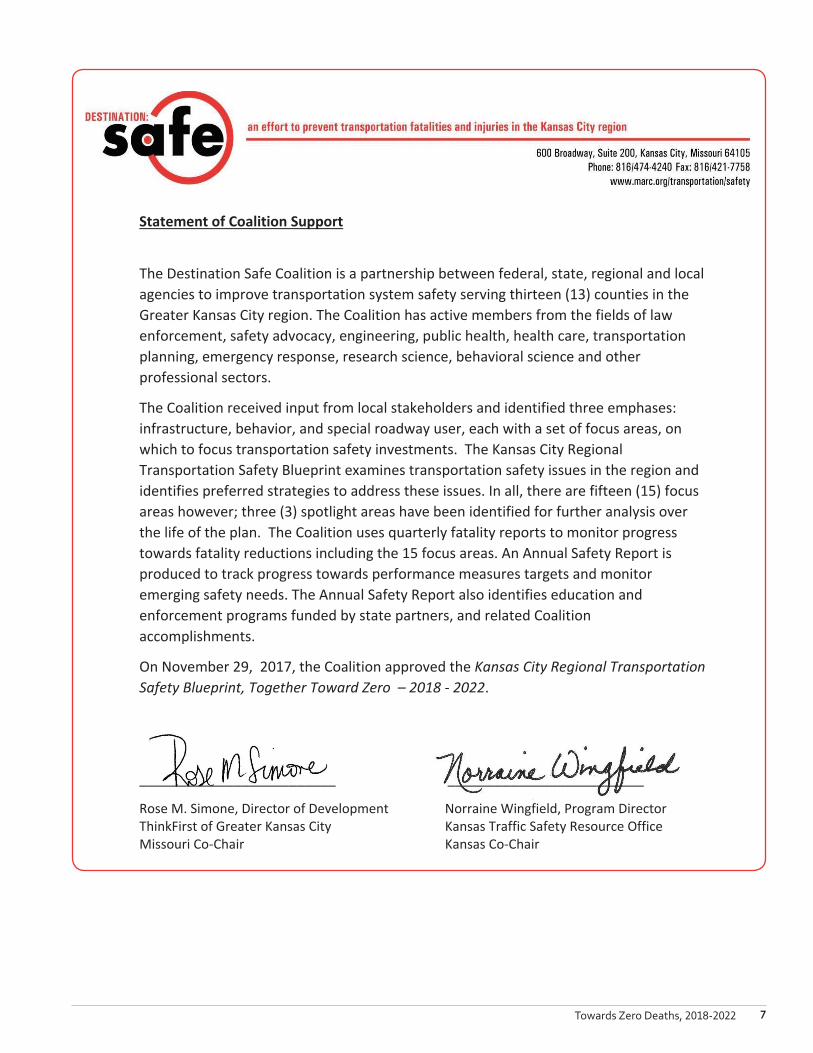
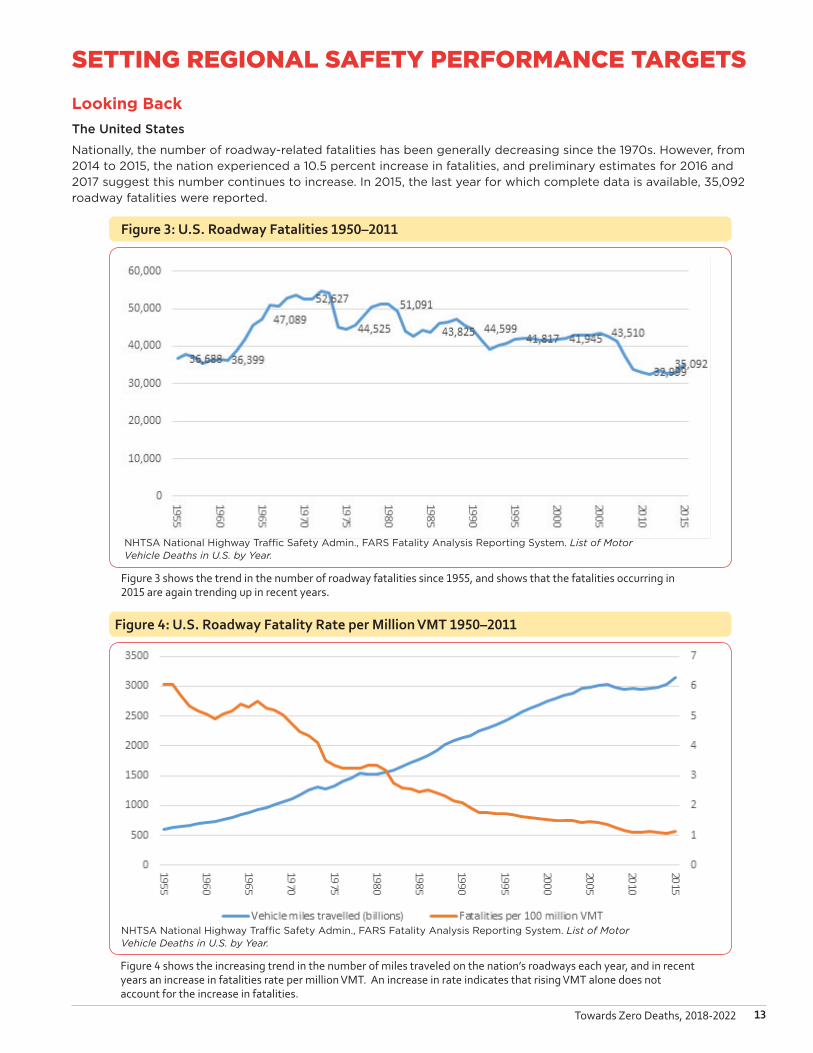
Nationally, the number of roadway-related fatalities has been generally decreasing since the 1970s. However, from 2014 to 2015, the nation experienced a 10.5 percent increase in fatalities, and preliminary estimates for 2016 and 2017 suggest this number continues to increase. In 2015, the last year for which complete data is available, 35,092 roadway fatalities were reported.
Figure 3: U.S. Roadway Fatalities 1950–2011
NHTSA National Highway Traffic Safety Admin., FARS Fatality Analysis Reporting System. List of Motor Vehicle Deaths in U.S. by Year.
Figure 3 shows the trend in the number of roadway fatalities since 1955, and shows that the fatalities occurring in 2015 are again trending up in recent years.
Figure 4 shows the increasing trend in the number of miles traveled on the nation’s roadways each year, and in recent years an increase in fatalities rate per million VMT. An increase in rate indicates that rising VMT alone does not account for the increase in fatalities.
Figure 4: U.S. Roadway Fatality Rate per Million VMT 1950–2011
NHTSA National Highway Traffic Safety Admin., FARS Fatality Analysis Reporting System. List of Motor Vehicle Deaths in U.S. by Year.
14 Destination Safe Coalition
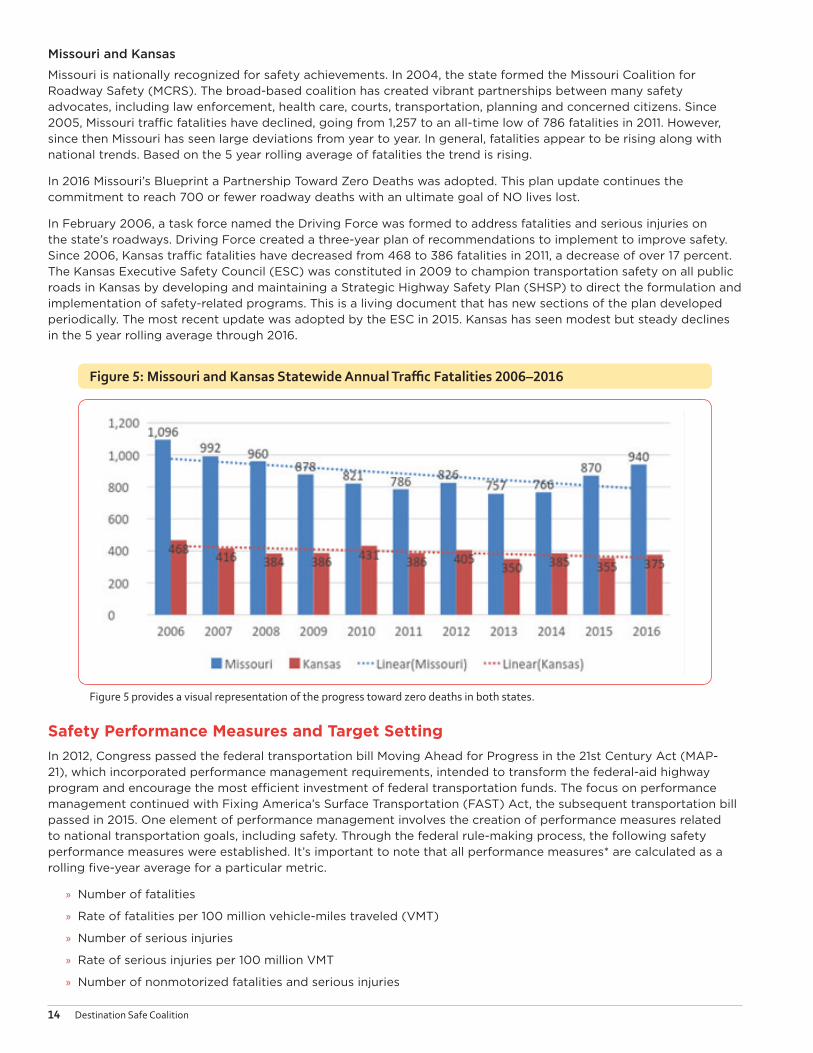
Figure 5: Missouri and Kansas Statewide Annual Traffic Fatalities 2006–2016
Missouri and Kansas
Missouri is nationally recognized for safety achievements. In 2004, the state formed the Missouri Coalition for Roadway Safety (MCRS). The broad-based coalition has created vibrant partnerships between many safety advocates, including law enforcement, health care, courts, transportation, planning and concerned citizens. Since 2005, Missouri traffic fatalities have declined, going from 1,257 to an all-time low of 786 fatalities in 2011. However, since then Missouri has seen large deviations from year to year. In general, fatalities appear to be rising along with national trends. Based on the 5 year rolling average of fatalities the trend is rising.
In 2016 Missouri’s Blueprint a Partnership Toward Zero Deaths was adopted. This plan update continues the commitment to reach 700 or fewer roadway deaths with an ultimate goal of NO lives lost.
In February 2006, a task force named the Driving Force was formed to address fatalities and serious injuries on the state’s roadways. Driving Force created a three-year plan of recommendations to implement to improve safety. Since 2006, Kansas traffic fatalities have decreased from 468 to 386 fatalities in 2011, a decrease of over 17 percent. The Kansas Executive Safety Council (ESC) was constituted in 2009 to champion transportation safety on all public roads in Kansas by developing and maintaining a Strategic Highway Safety Plan (SHSP) to direct the formulation and implementation of safety-related programs. This is a living document that has new sections of the plan developed periodically. The most recent update was adopted by the ESC in 2015. Kansas has seen modest but steady declines in the 5 year rolling average through 2016.
Figure 5 provides a visual representation of the progress toward zero deaths in both states.
Safety Performance Measures and Target Setting
In 2012, Congress passed the federal transportation bill Moving Ahead for Progress in the 21st Century Act (MAP-21), which incorporated performance management requirements, intended to transform the federal-aid highway program and encourage the most efficient investment of federal transportation funds. The focus on performance management continued with Fixing America’s Surface Transportation (FAST) Act, the subsequent transportation bill passed in 2015. One element of performance management involves the creation of performance measures related to national transportation goals, including safety. Through the federal rule-making process, the following safety performance measures were established. It’s important to note that all performance measures* are calculated as a rolling five-year average for a particular metric.
» Number of fatalities
» Rate of fatalities per 100 million vehicle-miles traveled (VMT)
» Number of serious injuries
» Rate of serious injuries per 100 million VMT
» Number of nonmotorized fatalities and serious injuries
15Towards Zero Deaths, 2018-2022
*The definition and methodology for calculating safety performance measures are available in the Federal Register.
The federal performance management rules require State Departments of Transportation and Metropolitan Planning Organizations (MPO) to establish targets for each of the performance measures. MARC, as the MPO for the Kansas City Region, will only be required to establish performance targets for the eight-county metropolitan planning area. However, the Destination Safe Leadership Team supports developing safety performance targets for the 13-county region, which are described in the following section.
Performance Trends
The Kansas City Regional Transportation Safety Blueprint has historically relied on analysis of safety trends for the previous five performance periods. These trends form the basis for safety planning and programming over the Blueprint’s five-year planning horizon. The following charts (Figures 7 through 11) describe historical trends for five safety performance measures.
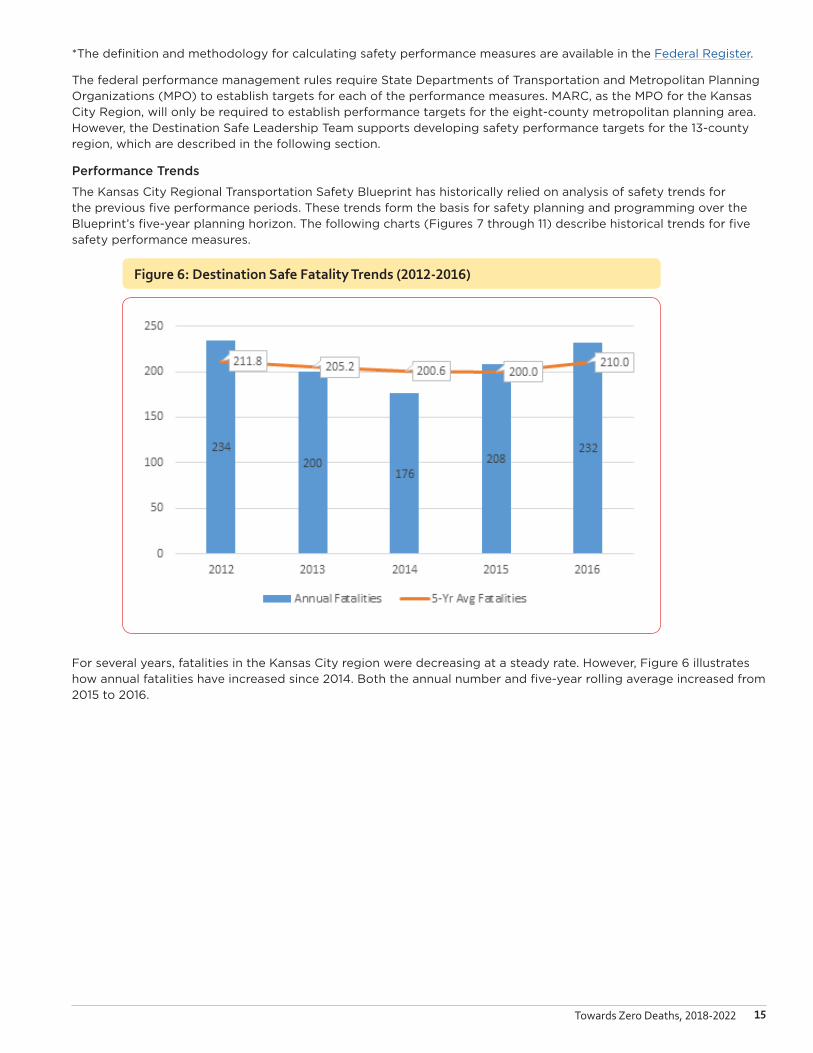
Figure 6: Destination Safe Fatality Trends (2012-2016)
For several years, fatalities in the Kansas City region were decreasing at a steady rate. However, Figure 6 illustrates how annual fatalities have increased since 2014. Both the annual number and five-year rolling average increased from 2015 to 2016.
16 Destination Safe Coalition
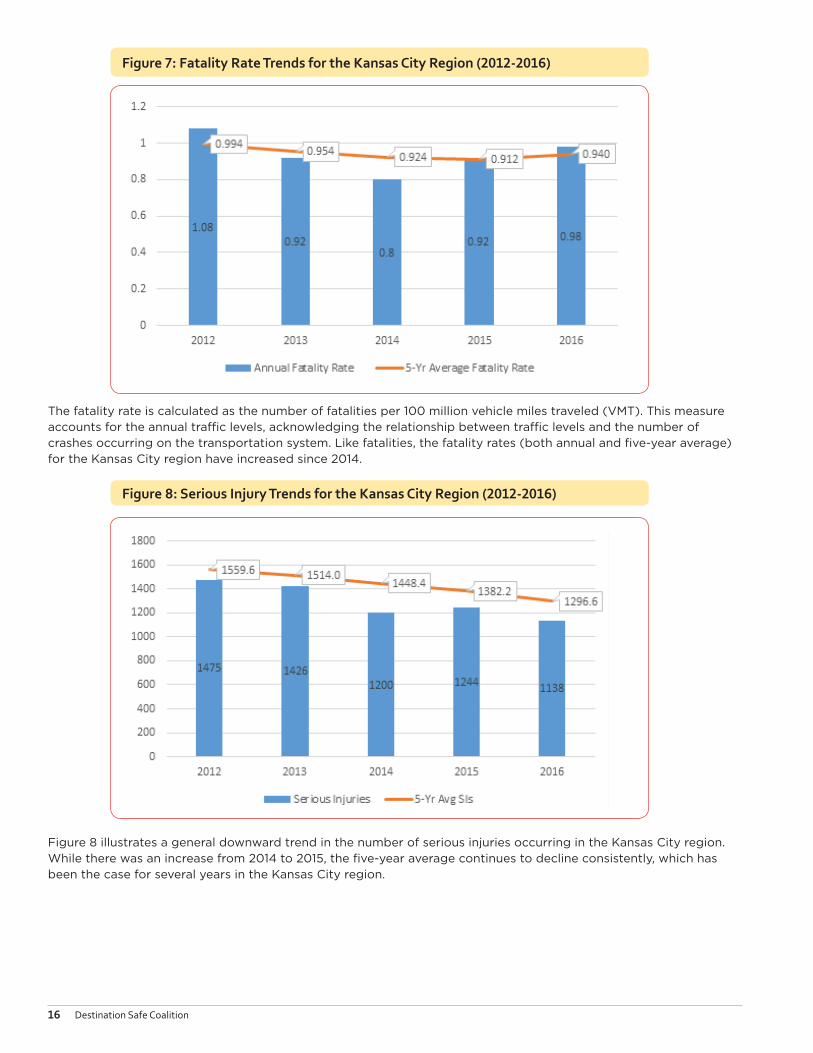
Figure 7: Fatality Rate Trends for the Kansas City Region (2012-2016)
The fatality rate is calculated as the number of fatalities per 100 million vehicle miles traveled (VMT). This measure accounts for the annual traffic levels, acknowledging the relationship between traffic levels and the number of crashes occurring on the transportation system. Like fatalities, the fatality rates (both annual and five-year average) for the Kansas City region have increased since 2014.
Figure 8: Serious Injury Trends for the Kansas City Region (2012-2016)
Figure 8 illustrates a general downward trend in the number of serious injuries occurring in the Kansas City region. While there was an increase from 2014 to 2015, the five-year average continues to decline consistently, which has been the case for several years in the Kansas City region.

17Towards Zero Deaths, 2018-2022
Figure 9: Serious Injury Rate Trends for the Kansas City Region (2012-2016)
In Figure 9, the trend for serious injury rates in the Kansas City region shows a steady decrease over the past five periods, both for the annual and five-year average values. As with all the measures, using a five-year rolling average has the effect of smoothing out fluctuations in the metrics that tend to occur one year to the next.
Safety Performance Targets
The Destination Safe Transportation Safety Data Task Team developed targets for all five safety performance measures. The process to develop targets involved several considerations.
» Trends for each measure over the past five periods.
» Statewide targets set for Kansas and Missouri.
» The anticipated effects of regional plans and programs on traffic safety.
» The anticipated effects of technology, development patterns and economic growth on safety.
The Destination Safe Leadership Team adopted the following targets on September 21, 2017. These targets will guide regional safety planning and programming efforts during the Blueprint planning horizon. Each performance measure will be monitored and reported annually. Targets are based on a five-year rolling average value. Figures 11-15 describe annual benchmarks for each measure in more detail.
Performance Measure 2018 target 2022 target
Number of fatalities 210.5 197.4
Fatality fate per 100 million VMT 0.904 0.802
Number of serious injuries 1131.5 891.9
Serious injury rate per 100 million VMT 4.886 3.630
Number of non-motorized fatalities and serious injuries 108.3 83.1

18 Destination Safe Coalition
The above targets assume the following.
» 4 percent annual decrease in the number of fatalities.
» 6 percent annual decrease in the number of serious injuries.
» 6 percent annual decrease in the number of non-motorized fatalities and serious injuries.
» 1 percent annual increase in vehicle-miles traveled (VMT).
Figure 10: Five-year Average Fatality Targets
Figure 11: Five-year Average Fatality Rate Targets

19Towards Zero Deaths, 2018-2022
Figure 12: Five-year Average Serious Injuries
Figure 13: Five-year Average Serious Injury Rate Targets
20 Destination Safe Coalition
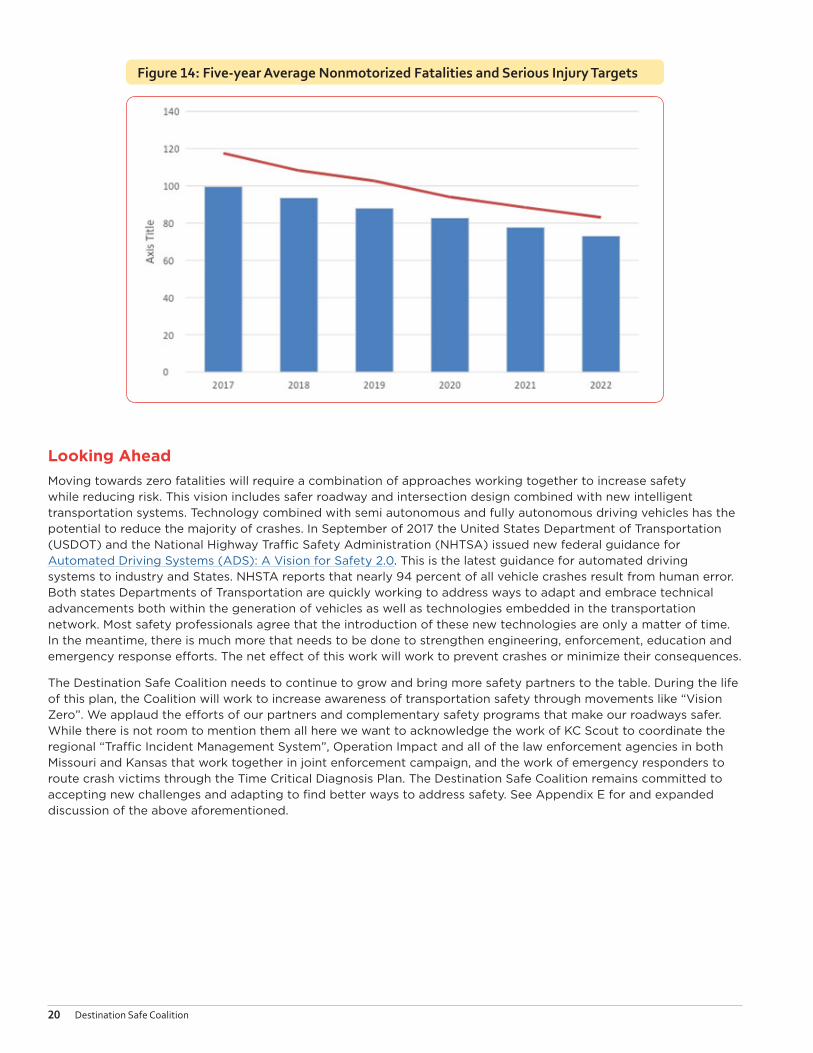
Figure 14: Five-year Average Nonmotorized Fatalities and Serious Injury Targets
Looking Ahead
Moving towards zero fatalities will require a combination of approaches working together to increase safety while reducing risk. This vision includes safer roadway and intersection design combined with new intelligent transportation systems. Technology combined with semi autonomous and fully autonomous driving vehicles has the potential to reduce the majority of crashes. In September of 2017 the United States Department of Transportation (USDOT) and the National Highway Traffic Safety Administration (NHTSA) issued new federal guidance for Automated Driving Systems (ADS): A Vision for Safety 2.0. This is the latest guidance for automated driving systems to industry and States. NHSTA reports that nearly 94 percent of all vehicle crashes result from human error. Both states Departments of Transportation are quickly working to address ways to adapt and embrace technical advancements both within the generation of vehicles as well as technologies embedded in the transportation network. Most safety professionals agree that the introduction of these new technologies are only a matter of time. In the meantime, there is much more that needs to be done to strengthen engineering, enforcement, education and emergency response efforts. The net effect of this work will work to prevent crashes or minimize their consequences.
The Destination Safe Coalition needs to continue to grow and bring more safety partners to the table. During the life of this plan, the Coalition will work to increase awareness of transportation safety through movements like “Vision Zero”. We applaud the efforts of our partners and complementary safety programs that make our roadways safer. While there is not room to mention them all here we want to acknowledge the work of KC Scout to coordinate the regional “Traffic Incident Management System”, Operation Impact and all of the law enforcement agencies in both Missouri and Kansas that work together in joint enforcement campaign, and the work of emergency responders to route crash victims through the Time Critical Diagnosis Plan. The Destination Safe Coalition remains committed to accepting new challenges and adapting to find better ways to address safety. See Appendix E for and expanded discussion of the above aforementioned.

21Towards Zero Deaths, 2018-2022
EMPHASIS & FOCUS AREAS
As part of a data-driven process, the Destination Safe Coalition gathered crash data for the region from MoDOT and KDOT and ranked the crash types and contributing factors resulting in the fatalities and serious injuries. This process allowed us to identify transportation safety spotlights and focus areas for our region.
There are 15 focus areas grouped by three emphasis: Infrastructure, Behavioral and Special User. Each emphasis or category contains five focus areas. Spotlight areas are the highest-ranking focus area within each emphasis. There are three spotlight areas. Spotlight areas will receive additional attention in the evaluation process resulting in more in-depth analysis.
Spotlight Areas
» Infrastructure: Intersections (3469, #1 overall)
» Behavioral: Aggressive Driving (3138, #2 overall)
» Special Users: Young Drivers (2653, #4 overall)
During the life of the new plan, the Transportation Safety Data Task Team will oversee the development of special reports providing in-depth analysis of the three spotlight areas.
Figure 15: Fatalities and Serious Injuries 2012-2016 by Focus Areas
Infrastructure Behavioral Special User

22 Destination Safe Coalition
The 15 focus areas chosen for inclusion in this plan each contributed more than 500 combined fatalities and serious injuries over the previous five-year period. A clear line of demarcation between these contributing factors and the others was found in the data.
In any given crash, there may be multiple contributing factors from one or more priorities affecting the outcome. For example, a crash may involve an inexperienced young driver (special user) who was distracted by an incoming text message (behavioral) while navigating a curve (infrastructure). This categorization also allows our safety partners to focus on the contributing factors and strategies over which they can have the most impact. An engineer may focus on strategies to highlight the roadway alignment or alter the curve. A policy maker may consider young driver licensing requirements. A law enforcement officer may target distracted driving. An educator may create a distracted driving program for high school students. Partners of the coalition are encouraged to direct attention and investments to focus areas that will have the greatest effect in lowering fatalities and serious injuries.
Infrastructure
The infrastructure priority emphasis addresses crash types that are most commonly attributed, at least in part, to an element of the roadway or intersection. In the Kansas City region, the most common infrastructure-related crashes are intersection, fixed object, run-off-road, horizontal curves and Head-on crashes.
Intersection crashes — Intersection crashes are those that occur at or near an intersection and are related to the presence of the intersection. Crashes are more likely to occur at intersections, both signalized and unsignalized, because multiple directions of traffic crossing paths create conflict points at intersections. The risk of crashes at intersections can be minimized through careful management of the potential conflicts, including proper signal timing, signing, striping, and driver awareness of the intersection and its traffic control. Roundabouts are particularly effective at reducing the number and severity of crashes.
Roadway crashes — Lane departure crashes are those in which a vehicle leaves the roadway (to the right or the left) or enters into another lane of travel (same or opposite direction). Run-off- road crashes are often recorded as fixed-object crashes, which occur when the vehicle strikes an object such as a tree, utility pole, or sign after leaving the roadway. On divided roadways, a vehicle that has left the roadway may cross the median and hit an opposing vehicle Head-on. Lane departure crashes are often recorded as sideswipe crashes (where the vehicle that has left its lane sideswipes a vehicle in the adjacent lane) or as Head-on crashes.
The first harmful event of a crash is the collation with another vehicle or a fixed object adjacent to the travel way. The purpose of infrastructure related safety countermeasures is to prevent a crash or mitigate the severity of the crash. The most effective counter measures warn driver that the vehicle is leaving the roadway, or prevents the vehicle from leaving the roadway. Rumble strips, guardrails, cable guards, and high fiction roadway surfaces through horizontal curves are examples of effective infrastructure safety countermeasures.
Behavioral
NHTSA reports estimate that 93 percent of all roadway crashes are due to human error or poor behavior on behalf of the driver.
Speeding, driving too fast for conditions, and following other vehicles too closely — characteristics of aggressive driving — are common behaviors that drivers exhibit and contribute to nearly half of all traffic fatalities in the region. These numbers do not include other aggressive driving behaviors such as driving on shoulders, lack of turn signal use, running red lights and provoking other motorists. Unfortunately, these behaviors contribute to many fatalities in the Kansas City region. The public’s perception is that aggressive driving behaviors are increasing. Speeding accounts for a majority of the aggressive driving related fatalities and serious injuries.
Another serious issue, not only in the Kansas City region but nationwide, is driving while intoxicated with alcohol or drugs — impaired driving. Despite years of efforts to educate the public about the effects of drinking and driving, 29 percent of all motor vehicle fatalities in the region involved impaired drivers. A portion of the population still has not internalized the consequences of this serious crime.
One of the biggest issues in the Kansas City region is unrestrained occupants in vehicles while traveling on the roadways. The percentage of fatalities in the Kansas City region involving occupants that are unbelted at the time of impact is 37 percent. Safety belt use in the region is below national levels. Kansas has passed a primary safety belt law. Missouri has passed a secondary safety belt law, meaning an officer cannot pull a motorist over simply because the motorist is not wearing a safety belt. As of August 2009, 30 states had primary laws, including Midwest states such as Minnesota, Iowa and Illinois. Other occupant protection issues — such as correctly installed child passenger
23Towards Zero Deaths, 2018-2022
safety seats and booster seats — are important for protecting the region’s most precious cargo ‒ children.
Distracted driving comes in many forms and is a significant contributor to roadway crashes resulting in fatalities and serious injuries. Anytime a person’s attention is diverted away from the primary task of driving, the likelihood of a crash increases. Due to an increase in cell phone use, texting and use of other technological devices, distracted driving has gained national attention resulting in numerous public education campaigns to curb this dangerous behavior. Fatalities involving distracted driving made up 11 percent of fatalities in the Kansas City region. Efforts are underway to improve the reporting of distracted driving on crash reports, including specific codes for different types of distractions. This information will be vital to the passage of any law restricting cellphone use while driving. Currently, fifteen states have passed a ban on the use of handheld cellphones while driving, and 47 states have a ban on texting while driving.
Unlicensed, revoked, or suspended drivers create a serious issue for law enforcement officers and law-abiding citizens’ safety and security. A significant percentage of fatalities and serious injuries involve crashes in which a driver was not properly licensed.
Special Users
People under age 25 comprise a high proportion of fatalities in the Kansas City region. This age group is referred to as young motorists (ages 15-24). It is important to understand the likelihood of a young person to be involved, injured or killed in a crash. Young drivers and their young occupants are less likely to be belted and are more likely to drive irresponsibly than other drivers and occupants. Within this age group, two sub-groups are used to further refine strategies — teens (ages 15-19) and young adults (ages 20-24).
More than 200,000 people in the Kansas City Metropolitan Area are ages 65 and over. The number of older drivers is expected to double over the next 20 years. The complex problem of maintaining mobility as one grows older is influenced by many factors including physical limitations, availability of transportation and location. All transportation users will eventually become older transportation users. Older motorists (ages 65+) represented 18 percent of all fatalities between 2012 and 2016. As the Baby Boomers reach 65 years of age, the percentage of Older Motorists involved in fatal traffic crashes is expected to grow. The Destination Safe Coalition is now looking at proactive steps that can be taken to maintain safe mobility for seniors.
Urban areas are particularly prone to conflicts between automobiles and pedestrians. The urban portions of the Kansas City region have pedestrian fatality levels similar to nationwide trends; however, it is perceived that the exposure for pedestrians in the region is relatively low. Safe travel by foot is necessary in ensuring safety for all transportation users.
Motorcycle and moped riders represent a class of transportation users that is particularly vulnerable to sustaining serious or fatal injuries in the event of a crash. Motorcycles are harder to negotiate than other vehicles, and motorists are not always looking for motorcycles. An awareness of sharing the road with motorcyclists is important to ensure the safety of this travel mode.
The movement of freight and goods through and within the Kansas City region is essential to local, state and national economies. This freight movement is typically done by large trucks. According to the FHWA Freight Analysis Framework (FAF), nearly 60 million tons of freight moved through the region in 2010. Additionally, the region is one of the top five trucking centers in the United States. Major north-south, east-west, high-speed facilities make up the backbone of the region’s transportation system, including Interstates 29, 35 and 70. Proposed developments to the Interstate 35 corridor in Texas and Interstate 49 from Louisiana to Kansas City have placed increasing demand on the region’s infrastructure. Movement of existing and proposed commercial motor vehicle traffic will continue to be important to the safety of the region’s transportation system.

24 Destination Safe Coalition
INFRASTRUCTURE
The infrastructure emphasis addresses crash types that are most commonly attributed, at least in part, to an element of the intersection, roadway or roadside. In the Kansas City region, the most common infrastructure-related crashes resulting in fatal and serious injury crashes are located near an intersection of two or more roadways. Fixed objects crashes are the second most common followed by run-off the road, horizontal curve and head-on collisions. Lane departure are common to many crashes including run-off the road, horizontal curb and Head-on. Work zone and railroad crossing crashes are not are not included in this plan however; additional information regarding these crash types are provided online at marc.org\destinationsafe.
Intersections
The region recorded 3,505 combined fatalities and serious injuries involving intersections from 2012 through 2016. While serious injuries are trending down fatalities have remained constant.
An intersection is a road junction where two or more roads either meet or cross. Intersections create opportunities for vehicle to vehicle, vehicle to pedestrian and vehicle to bicycle conflicts. Potentially 32 conflicts exist at a typical four-way intersection. While intersections represent a small part of the roadway system, they account for a large percentage of the fatal and serious injury crashes in our region. The charts below represent the fatalities and serious injuries that have occurred in the region at both signalized and unsignalized intersections. Infrastructure designs, which reduce conflict points, exposure and traffic speed are encouraged to improve intersection safety. A table of strategies are provided at the end to reduce crashes at intersections.
Figure 16: Fatalities and Serious Injuries Involving Intersections

25Towards Zero Deaths, 2018-2022
Figure 17: Fatalities Involving Intersections by State
Figure 18: Serious Injuries Involving Intersections by State
Signalized
Signalized intersections are more prevalent in urban counties of the region where it is necessary to automate traffic flow because of higher traffic volumes. While traffic signals can reduce the severity of crashes, a rise in the total number of crashes is typically expected (rear-end types generally increase). Severe crashes that occur at signalized intersections usually are a result of non-compliance with the traffic signal (running a red light).
Unsignalized
Unsignalized intersections are typically characterized by higher speeds, are located in more rural settings and rely on the drivers’ decisions. Poor decisions can be the result of driver distraction, lack of good sight distance, limited visibility, gaps in traffic, excessive speeds and non-compliance with traffic control devices (stop sign).

26 Destination Safe Coalition
Strategies to Reduce Intersection-Related Crashes
Time frame to Implement
Safety Strategy Relative Cost
Intersection type
EDUCATION
Current Provide targeted public information and education on safety problems at specific intersections
$$ All
Current Inform and educate roadway users on new or unusual intersection design and traffic controls (e.g., roundabouts, divergent diamond interchanges and flashing yellow arrows)
$$ All
Current Inform and educate roadway users on red light running $$ Signalized
ENGINEERING
Current Consider where appropriate the installation of modern roundabouts.
$$$ Signalized
Current Consider bulb outs and other traffic calming devices to improve safety for non-motorized roadway users.
$$ All
Current Restrict or eliminate turning maneuvers including U-turns and left turns, and right turns on red
$ Signalized
Current Provide lane assignments or marking at complex intersections $ All
Current Adjust timing of signals within a corridor to meet need such as encouraging a certain speed, reducing the number of stops through the corridor, or creating gaps for side street traffic at nearby signalized intersections
$ All
Current Conduct preventive maintenance program that checks retro-reflectivity and/or visibility of signs, signals and pavement markings
$ All
Current Install flashing beacons at rural stop controlled intersections $-$$ Unsignalized
Current Install splitter islands on the minor road approach to an intersection to reduce allowed turning movements (e.g., left-turn out)
$-$$ Unsignalized
Current Improve awareness and visibility of minor road approaches to intersections by providing enhanced signing (doubling, larger and brighter), pavement markings (such as a stop bar), delineation, interactive flashers, lighting, etc.
$-$$ Unsignalized
Short-term Limit number of access points to adjacent land uses near an intersection
$$ All
Current Clear sight triangles and provide roadside markers, dynamic signs or pavement markings to help drivers judge suitability of available gaps for making turning and crossing maneuvers on divided roadways
$$ Unsignalized
Current Provide traffic calming at intersection approaches through a combination of geometrics, traffic-control devices and lane narrowing
$$ All
Current Provide bypass lanes on shoulders at t-intersections $$-$$$ Unsignalized
Current Provide left-turn and right-turn acceleration lanes at divided roadway intersections
$$$ Unsignalized
Current Realign intersection approaches to reduce or eliminate intersection skew angles of approach legs
$$$ All
Current Improve turn-lane channelization and storage while, providing pedestrian refuge areas and simplified crossing movements.
$$$ Signalized

27Towards Zero Deaths, 2018-2022
Strategies to Reduce Intersection-Related Crashes
Time frame to Implement
Safety Strategy Relative Cost
Intersection type
Current Install offset left-turn and right-turn lanes $$$ All
Short-term Install innovative engineering designs (e.g., roundabouts, J-turns, continuous flow intersections, etc.)
$$$ All
Current Remove unwarranted signals $$ Signalized
Current Improve drainage or provide skid resistance in intersection and all approach legs
$$$ All
ENFORCEMENT
Current Provide targeted enforcement at high-crash intersections $ All
Current Increase enforcement of intersection violations such as stop sign and red light running
$ All
Short-term Install confirmation lights to help officers identify red light running $$ Signalized
EMERGENCY
Short-term Install traffic signal preemption for emergency vehicles $$ Signalized
Time frame: Current = Underway; Short-term = 1-2 years; Long-term = 3-5 years; Future = 6+ yearsRelative Cost: $ = Inexpensive; $$ = Low Cost; $$$ = Moderate; $$$$ = Expensive
Fixed Object
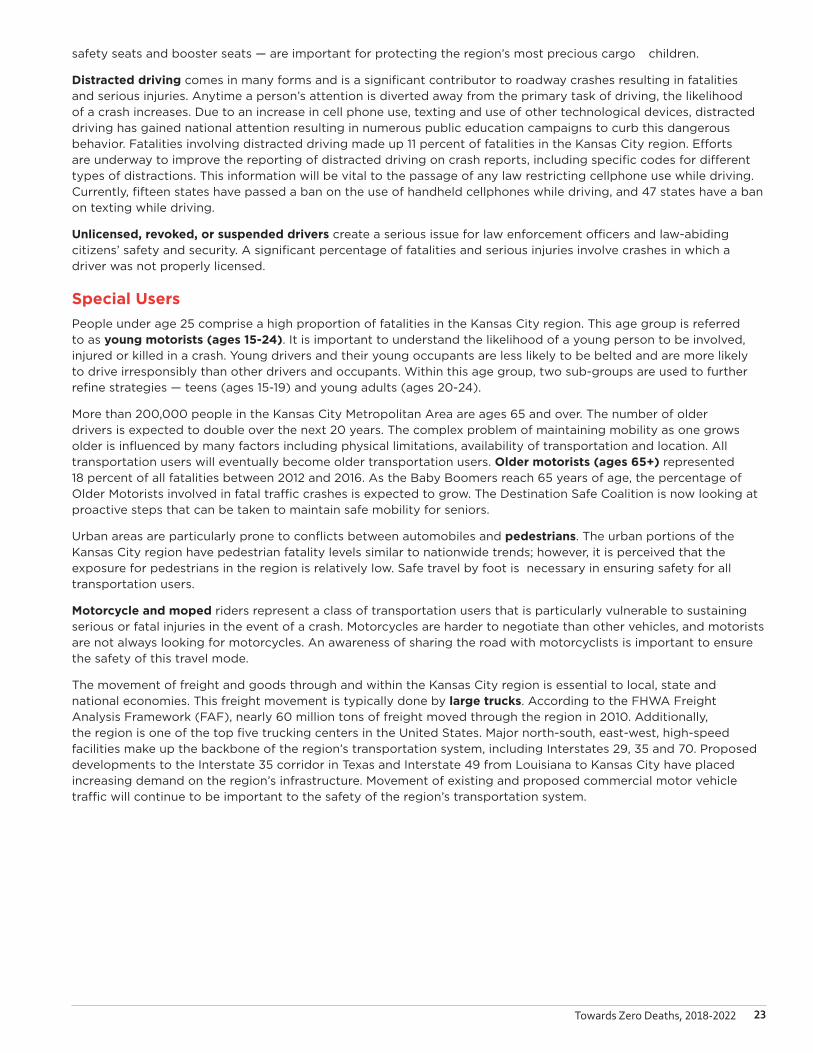
The region recorded 3,020 combined fatalities and serious injuries involving fixed objects from 2012 through 2016. While serious injuries are trending down fatalities have remained constant. In a fixed object crash, a vehicle leaves its lane and runs into a ditch, an object (a light pole or tree, for example) or a barrier (such as a guardrail). Analyzing the types of objects struck, and at what frequency, might suggest targeted countermeasures or policy changes in fixed object placements.
The preferred order for addressing fixed objects that are too close to the roadway is as follows:
» REMOVE the object. Unfortunately, this is not always an option.
» RELOCATE the object. Again, this is not always an option.
» SHIELD the object. Guardrail should only be installed if it is protecting something more hazardous than itself.
» DELINEATE the object. This option is used when the first three are not options.
National data reveals the following:
» The percent of crashes involving trees increases as traffic volume decreases
» The percent of crashes involving utility poles, signs and guardrails increases as traffic volume increases.
Regional data reveals the following:
» Of the 571 fatalities involving fixed objects, 144, or 25 percent, involved trees and 32, or six percent, involved utility poles.
» 33 percent of fatal fixed object crashes occurred in rural areas, which is similar to 30 percent for all fatal crashes.
» 29 percent of serious injury fixed object crashes occurred in rural areas, compared to 20 percent of all serious injury crashes.
The following charts represent the fatalities that have occurred in the region as a result of crashes with fixed objects.

28 Destination Safe Coalition
Figure 19: Fatalities and Serious Injuries Involving Fixed Objects
Figure 20: Fatalities Involving Fixed Objects, by State
29Towards Zero Deaths, 2018-2022
Figure 21: Serious Injuries Involving Fixed Objects, by State
See the table at the end of this section for strategies to reduce the risk of crashes with a tree, utility pole, or other fixed object, or mitigate the severity when a crash does occur.
Run-Off-Road Crashes
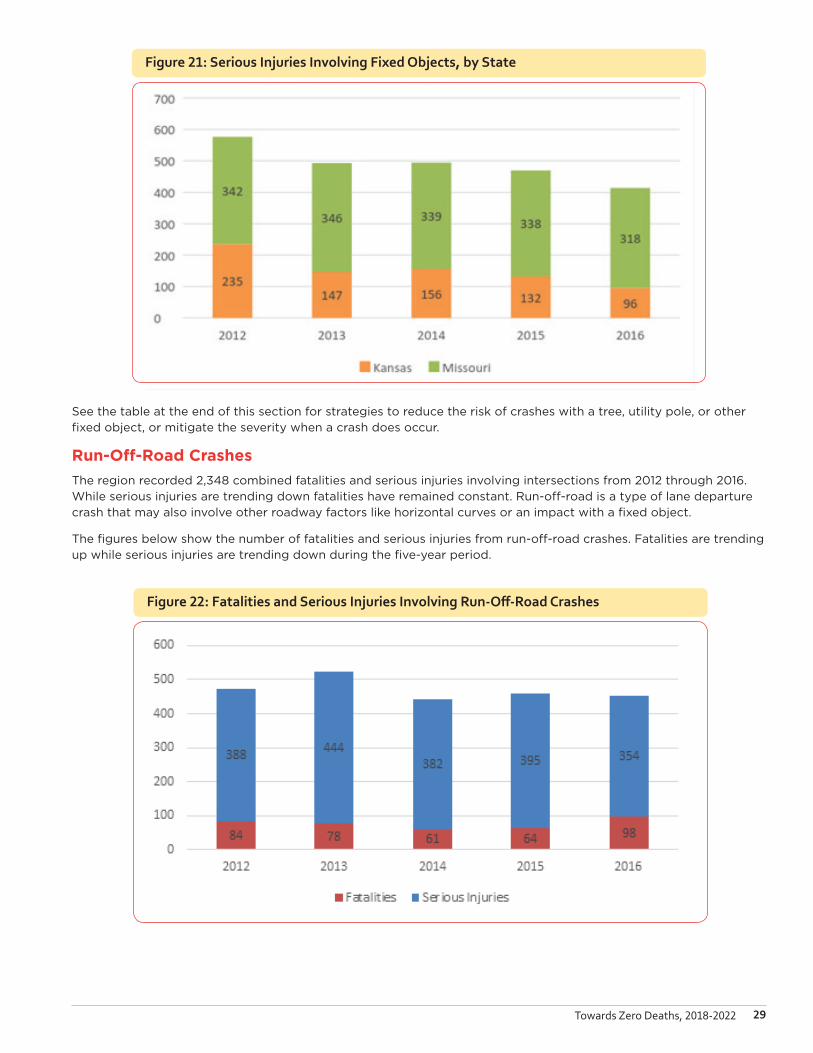
The region recorded 2,348 combined fatalities and serious injuries involving intersections from 2012 through 2016. While serious injuries are trending down fatalities have remained constant. Run-off-road is a type of lane departure crash that may also involve other roadway factors like horizontal curves or an impact with a fixed object.
The figures below show the number of fatalities and serious injuries from run-off-road crashes. Fatalities are trending up while serious injuries are trending down during the five-year period.
Figure 22: Fatalities and Serious Injuries Involving Run-Off-Road Crashes

30 Destination Safe Coalition
Figure 23: Fatalities Involving Run-Off-Road Crashes, by State
Figure 24: Serious Injuries Involving Run-Off-Road Crashes, by State
At the end of this section, a table of strategies for addressing lane departure crashes is presented that relate to run-off-road, horizontal curve, Head-on and fixed object crashes.
Horizontal Curve Crashes
Horizontal curves represent a change in the horizontal alignment or direction of a road and typically connect two tangents, or straight, sections of road (as opposed to vertical curves which change the slope.) They include everything from a 270 degree loop on a cloverleaf ramp to a very subtle bend in the road. No one solution works for every curve because the issues on an unexpected 90 degree curve in western Kansas are much different than those for a series of winding roads in the Ozarks of Missouri. Fortunately, this plan is specific to the Kansas City region where both Missouri and Kansas share similar road environments.
National data reveals the following:
» Nearly 25 percent of people who die each year in vehicle crashes are killed in crashes at curves.
» 26 percent of curve-related fatal crashes involve single vehicles leaving the roadway and striking fixed objects

31Towards Zero Deaths, 2018-2022
or overturning.
» 11 percent of curve-related fatal crashes are head-on.
Regional data reveals the following:
» 26 percent of fatal crashes involve a horizontal curve.
» 18 percent of serious injury crashes involve a horizontal curve.
The charts below represent the fatalities that have occurred in the region as a result of all horizontal curve crashes.
Figure 25: Fatalities Involving Horizontal Curves
Figure 26: Fatalities Involving Horizontal Curves, by State

32 Destination Safe Coalition
Figure 27: Fatalities Involving Horizontal Curves, by State
To address the specific safety problem at horizontal curves, there are two key objectives:
» Reduce the likelihood of a vehicle leaving its lane and either crossing the center line or leaving the roadway at a horizontal curve.
» Minimize the damage consequences of a vehicle leaving the roadway at a horizontal curve.
Head-on Crashes
A head-on crash typically occurs when a vehicle crosses a center line or a median and crashes into an approaching vehicle. A head-on crash can also occur when a driver knowingly or unknowingly travels the wrong way in a traffic lane. Head-on crashes occur as a result of a driver’s inadvertent actions — as with run-off-road encroachments — or deliberate actions such as executing a passing maneuver on a two-lane road.
The obvious physics of a head-on crash indicate it’s more likely to be severe than other crash types. Data validates this assumption. For example, between 2012 and 2016 there were 571 combined fatalities and serious injuries from head-on crashes in the region. A similar type of crash occurs when there’s a sideswipe contact between two vehicles coming from opposite directions.
National data reveals the following:
» Most fatal Head-on crashes occur in nonpassing situations.
» Most Head-on crashes are likely to result from a motorist making an “unintentional” maneuver.
Regional data reveals the following:
» 7 percent of all fatal crashes are the result of two vehicles striking head-on.
» 8 percent of all serious injury crashes are the result of two vehicles striking head-on.

33Towards Zero Deaths, 2018-2022
Figure 28: Fatalities and Serious Injuries Involving Head-on Crashes
Figure 29: Fatalities Involving Head-on Crashes, by State
Figure 30: Serious Injuries Involving Head-on Crashes, by State

34 Destination Safe Coalition
To reduce the number of fatal and serious injury head-on crashes, there are three key objectives:
» Keep vehicles from encroaching into the opposite lane.
» Minimize the likelihood of a car crashing into an oncoming vehicle.
» Reduce the severity of crashes that do occur.
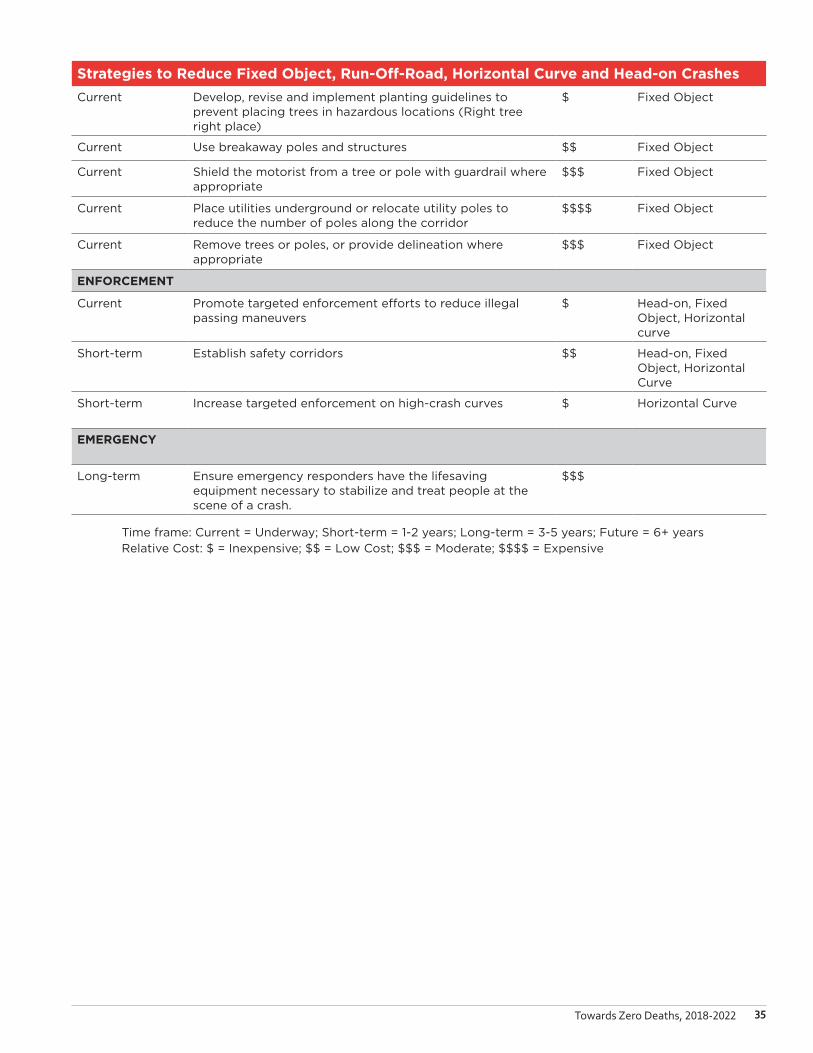
Strategies to Reduce Fixed Object, Run-Off-Road, Horizontal Curve and Head-on Crashes
Time frame to Implement
Safety Strategy Relative Cost
Crash Types Addressed
EDUCATION
Short-term Educate roadway users on the dangers of using cruise control during wet conditions
$ Head-on, Fixed Object, Horizontal Curve
Short-term Create a system to encourage reporting of hazardous obstructions or objects that restrict sight distance (e.g., overgrown trees, downed poles)
$ Fixed Object
Current Encourage companies to bury utilities $ Fixed Object
Current Encourage property owners to remove trees near the right of way
$ Fixed Object
Current Promote defensive driving training $ Head-on, Fixed Object, Horizontal Curve
Short-term Educate roadway users on proper headlight dimming principles
$ Head-on
ENGINEERING
Current Install center line rumble strips for two-lane rural roads $$ Head-on
Current Install median barriers for narrow width medians on multilane roads according to policy
$$$ Head-on
Current Maintain shoulders and edge of pavements to prevent run-off-road over recovery
$$$$ Head-on
Short-term Install new or reassess existing no-passing zones $ Head-on
Long-term Construct shared four-lane roadways in place of rural two-lane roads
$$$$ Head-on
Current Enhance delineation along the curve using center lines, edge lines, and signs such as delineators or chevrons
$$ Horizontal Curve
Current Install shoulder and/or center line rumble strips and stripes $$ Horizontal Curve, Fixed Object
Current Provide dynamic curve warning systems $$ Horizontal Curve
Current Provide skid-resistant pavement surfaces $$ Horizontal Curve
Long-term Improve or restore super elevation $$$ Horizontal Curve
Current Widen the roadway through the curve $$$$ Horizontal Curve
Short-term Include Safety Edge (or tapered pavement edge) with reconstruction or resurfacing projects
$$ Fixed Object
Current Enhance signing using fluorescent yellow sign sheeting and/or oversized signs
$$ Horizontal Curve
Current Conduct and participate in road safety audits $ Horizontal Curve
Current Install advisory speeds where appropriate $ Horizontal Curve
Current Provide adequate clear zones $$$ Fixed Object
35Towards Zero Deaths, 2018-2022
Strategies to Reduce Fixed Object, Run-Off-Road, Horizontal Curve and Head-on Crashes
Current Develop, revise and implement planting guidelines to prevent placing trees in hazardous locations (Right tree right place)
$ Fixed Object
Current Use breakaway poles and structures $$ Fixed Object
Current Shield the motorist from a tree or pole with guardrail where appropriate
$$$ Fixed Object
Current Place utilities underground or relocate utility poles to reduce the number of poles along the corridor
$$$$ Fixed Object
Current Remove trees or poles, or provide delineation where appropriate
$$$ Fixed Object
ENFORCEMENT
Current Promote targeted enforcement efforts to reduce illegal passing maneuvers
$ Head-on, Fixed Object, Horizontal curve
Short-term Establish safety corridors $$ Head-on, Fixed Object, Horizontal Curve
Short-term Increase targeted enforcement on high-crash curves $ Horizontal Curve
EMERGENCY
Long-term Ensure emergency responders have the lifesaving equipment necessary to stabilize and treat people at the scene of a crash.
$$$
Time frame: Current = Underway; Short-term = 1-2 years; Long-term = 3-5 years; Future = 6+ yearsRelative Cost: $ = Inexpensive; $$ = Low Cost; $$$ = Moderate; $$$$ = Expensive

36 Destination Safe Coalition
BEHAVIORAL
A majority of crashes in the Kansas City region can be attributed to poor behavior on behalf of the driver. Speeding, aggressive driving, driving under the influence of alcohol or driving while texting are all choices. All of these behaviors increase the risk of a crash. In other cases, the failure to buckle-up increases the risk of death or injury if one is involved in a crash. While we cannot control the actions of others, we can educate them on the consequences and we can hold them accountable for their choices. National campaigns led by the National Highway Traffic Safety Administration (NHTSA) involves both education and traffic law enforcement. Driver behavior plays a significant role in the safety of our streets. Driver behavior has been a primary emphasis of the Destination Safe Coalition and will continue to be. Each year, the Destination Safe Leadership Team identifies education and law enforcement activities to fund through monies provided by KDOT and MoDOT.
Aggressive Driving
Aggressive driving is a serious problem on our roadways. What is aggressive driving? Aggressive driving can be malicious in nature when individuals commit a combination of moving traffic offenses so as to endanger other persons or property. For the purposes of this plan, we define aggressive driving as speeding, driving too fast for conditions and following other vehicles too closely.
Aggressive driving is the leading contributing factor to roadway fatalities and serious injuries in the region. Based on a five-year average from 2012-2016, aggressive driving was reported in 48 percent of all crashes resulting in fatalities and 41 percent of serious injuries in our region. These behaviors contribute to many fatalities in the Kansas City region — and sadly, they are preventable. A majority of these fatalities occur in Jackson County. Fatalities and serious injuries attributed to aggressive driving are trending down over the five-year period.
Figure 31: Fatalities and Serious Injuries Involving Aggressive Driving

37Towards Zero Deaths, 2018-2022
Figure 32: Fatalities Involving Aggressive Driving, by State
Figure 33: Serious Injuries Involving Aggressive Driving, by State
Aggressive Driving Safety Strategies
Time frame to Implement
Safety Strategy Relative Cost
Potential Partners
EDUCATION
Current Implement public information and education efforts that target problem corridors and at-risk demographics
$ KDOT, KHP, MARC, MoDOT, MSHP
Current Encourage local municipalities to remove work zone signs when no construction activities are taking place to restore motorists' reliability of these messages
$ KDOT, Local gov'ts, MoDOT
Current Publicize and inform motorists of major road construction efforts in early spring through local media, flyers, public meetings, websites, Kansas City Scout, and other public involvement and awareness techniques
$ KC Scout, KDOT, MARC, MoDOT, RideshareKC

38 Destination Safe Coalition
Aggressive Driving Safety Strategies
Current Educate roadway users on the dangers of aggressive driving and the rules of the road through public or private driver's education courses
$$ Driving schools, KDOT, KHP, MoDOT, MSHP
Short-term Display travel times and roadway condition status through the Kansas City Scout traffic management system (i.e., changeable message boards and web-site)
$$$ KC Scout
Current Implement traffic signal coordination and synchronization that improves traffic flow and safety
$$ KDOT, Local gov'ts, MoDOT, OGL
Long-term Utilize portable changeable message boards in work zones with accurate lane closure and traffic gridlock information
$$$ KDOT, Local gov'ts, MoDOT
Long-term Develop a regional 511 system that will contain roadway conditions in Kansas and Missouri
$$$ KC Scout, KDOT, MARC, MoDOT
ENGINEERING
Short-term Educate the public on traffic engineering issues $ KDOT, MoDOT, Local gov'ts
Long-term Identify appropriate context-sensitive, traffic-calming, and design countermeasures to reduce speeding
$$$ KDOT, MoDOT, Local gov'ts
ENFORCEMENT
Current Expand speed enforcement in work zones and identified problem corridors
$ KHP, Local law enforcement, MSHP
Current Increase enforcement of vehicles following too closely to each other
$ KHP, Local law enforcement, MSHP
Current Identify corridors where car racing is an issue and target with enforcement
$ KHP, Local law enforcement, MSHP
Long-term Support the Data-Driven Approaches to Crime and Traffic Safety (DDACTS)
$ KHP, Local law enforcement, MSHP
EMERGENCY
Current Continue incident management operations along heavily traveled corridors in the Kansas City region
$ KC Scout, KDOT, KHP, MoDOT, MSHP
Current Continue support of Motorist Assist programs $$$ KC Scout, KDOT, KHP, MoDOT, MSHP
Impaired Driving
Impaired driving continues to be a major traffic safety issue both nationally and regionally. In the United States, alcohol-impaired motor vehicle crashes cost more than an estimated $37 billion annually. In 2016, 10,497 people died in alcohol-impaired driving crashes — one every 50 minutes. (Source: NHTSA)
Despite all the attention, resources and public policies devoted to this problem, over 300 lives have been lost in the Kansas City region during the past five years as a result of impaired driving. From 2012-2016, almost 30 percent of traffic fatalities and 14 percent of serious injuries involved impaired drivers. On a more positive note, there has been a consistent downward trend in annual fatalities and serious injuries during this time period. . For individual counties, however, the downward trend is not as apparent because the numbers tend to fluctuate from one year to the next.
Impaired driving is a destructive societal problem that will require a complex set of strategies to address. There are a variety of strategies involving education, enforcement, and technology that can help reduce the number of impaired drivers and improve roadway safety. More efforts are needed to enforce impaired driving laws and to prosecute offenders — especially those who repeatedly offend.
Time frame: Current = Underway; Short-term = 1-2 years; Long-term = 3-5 years; Future = 6+ yearsRelative Cost: $ = Inexpensive; $$ = Low Cost; $$$ = Moderate; $$$$ = Expensive
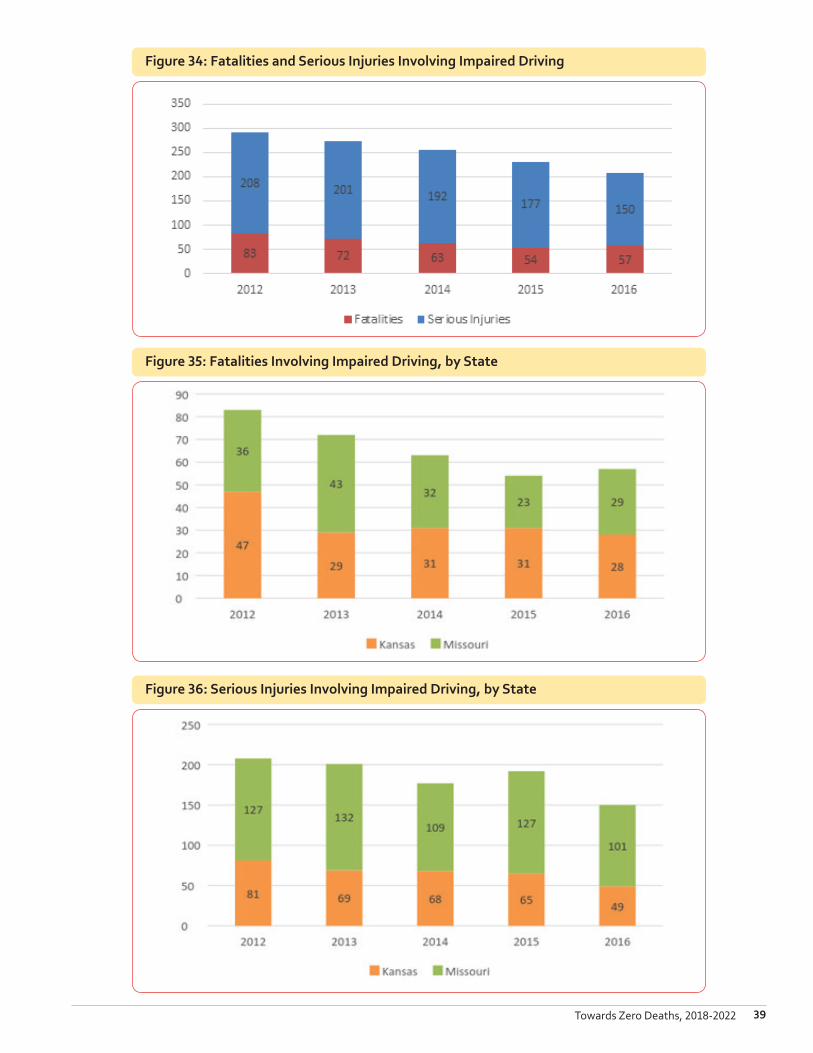
39Towards Zero Deaths, 2018-2022
Figure 34: Fatalities and Serious Injuries Involving Impaired Driving
Figure 35: Fatalities Involving Impaired Driving, by State
Figure 36: Serious Injuries Involving Impaired Driving, by State
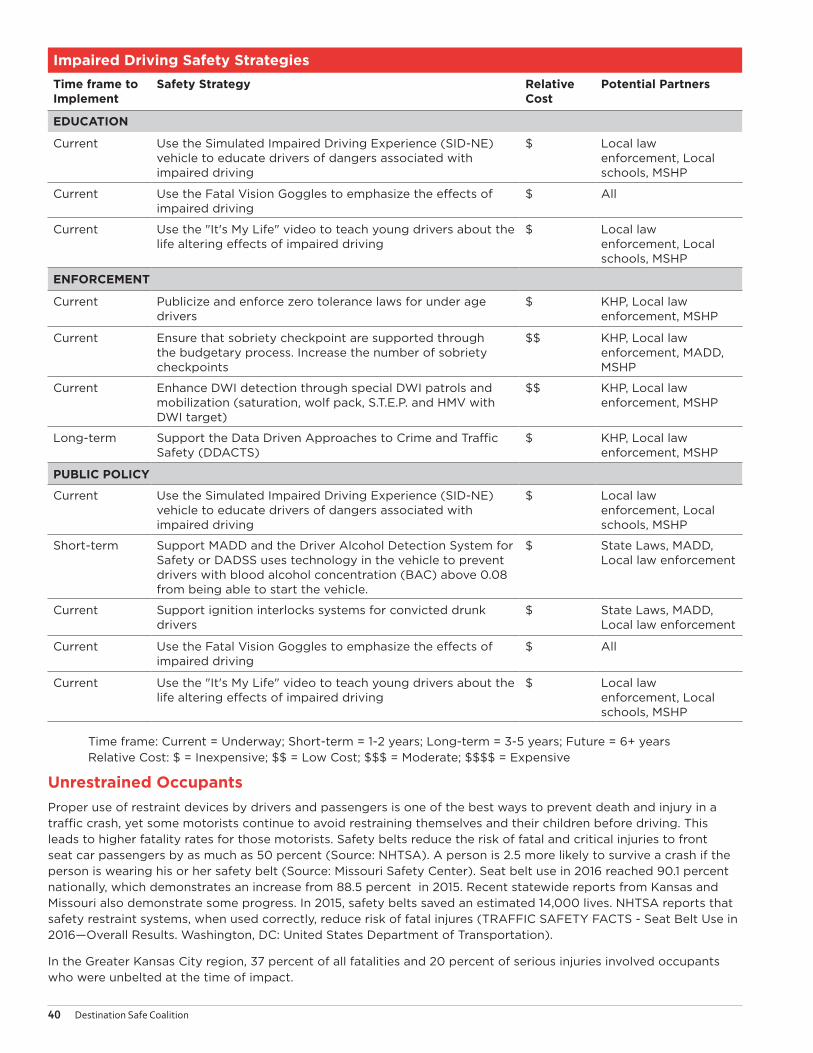
40 Destination Safe Coalition
Impaired Driving Safety Strategies
Time frame to Implement
Safety Strategy Relative Cost
Potential Partners
EDUCATION
Current Use the Simulated Impaired Driving Experience (SID-NE) vehicle to educate drivers of dangers associated with impaired driving
$ Local law enforcement, Local schools, MSHP
Current Use the Fatal Vision Goggles to emphasize the effects of impaired driving
$ All
Current Use the "It's My Life" video to teach young drivers about the life altering effects of impaired driving
$ Local law enforcement, Local schools, MSHP
ENFORCEMENT
Current Publicize and enforce zero tolerance laws for under age drivers
$ KHP, Local law enforcement, MSHP
Current Ensure that sobriety checkpoint are supported through the budgetary process. Increase the number of sobriety checkpoints
$$ KHP, Local law enforcement, MADD, MSHP
Current Enhance DWI detection through special DWI patrols and mobilization (saturation, wolf pack, S.T.E.P. and HMV with DWI target)
$$ KHP, Local law enforcement, MSHP
Long-term Support the Data Driven Approaches to Crime and Traffic Safety (DDACTS)
$ KHP, Local law enforcement, MSHP
PUBLIC POLICY
Current Use the Simulated Impaired Driving Experience (SID-NE) vehicle to educate drivers of dangers associated with impaired driving
$ Local law enforcement, Local schools, MSHP
Short-term Support MADD and the Driver Alcohol Detection System for Safety or DADSS uses technology in the vehicle to prevent drivers with blood alcohol concentration (BAC) above 0.08 from being able to start the vehicle.
$ State Laws, MADD, Local law enforcement
Current Support ignition interlocks systems for convicted drunk drivers
$ State Laws, MADD, Local law enforcement
Current Use the Fatal Vision Goggles to emphasize the effects of impaired driving
$ All
Current Use the "It's My Life" video to teach young drivers about the life altering effects of impaired driving
$ Local law enforcement, Local schools, MSHP
Unrestrained Occupants
Proper use of restraint devices by drivers and passengers is one of the best ways to prevent death and injury in a traffic crash, yet some motorists continue to avoid restraining themselves and their children before driving. This leads to higher fatality rates for those motorists. Safety belts reduce the risk of fatal and critical injuries to front seat car passengers by as much as 50 percent (Source: NHTSA). A person is 2.5 more likely to survive a crash if the person is wearing his or her safety belt (Source: Missouri Safety Center). Seat belt use in 2016 reached 90.1 percent nationally, which demonstrates an increase from 88.5 percent in 2015. Recent statewide reports from Kansas and Missouri also demonstrate some progress. In 2015, safety belts saved an estimated 14,000 lives. NHTSA reports that safety restraint systems, when used correctly, reduce risk of fatal injures (TRAFFIC SAFETY FACTS - Seat Belt Use in 2016—Overall Results. Washington, DC: United States Department of Transportation).
In the Greater Kansas City region, 37 percent of all fatalities and 20 percent of serious injuries involved occupants who were unbelted at the time of impact.
Time frame: Current = Underway; Short-term = 1-2 years; Long-term = 3-5 years; Future = 6+ yearsRelative Cost: $ = Inexpensive; $$ = Low Cost; $$$ = Moderate; $$$$ = Expensive
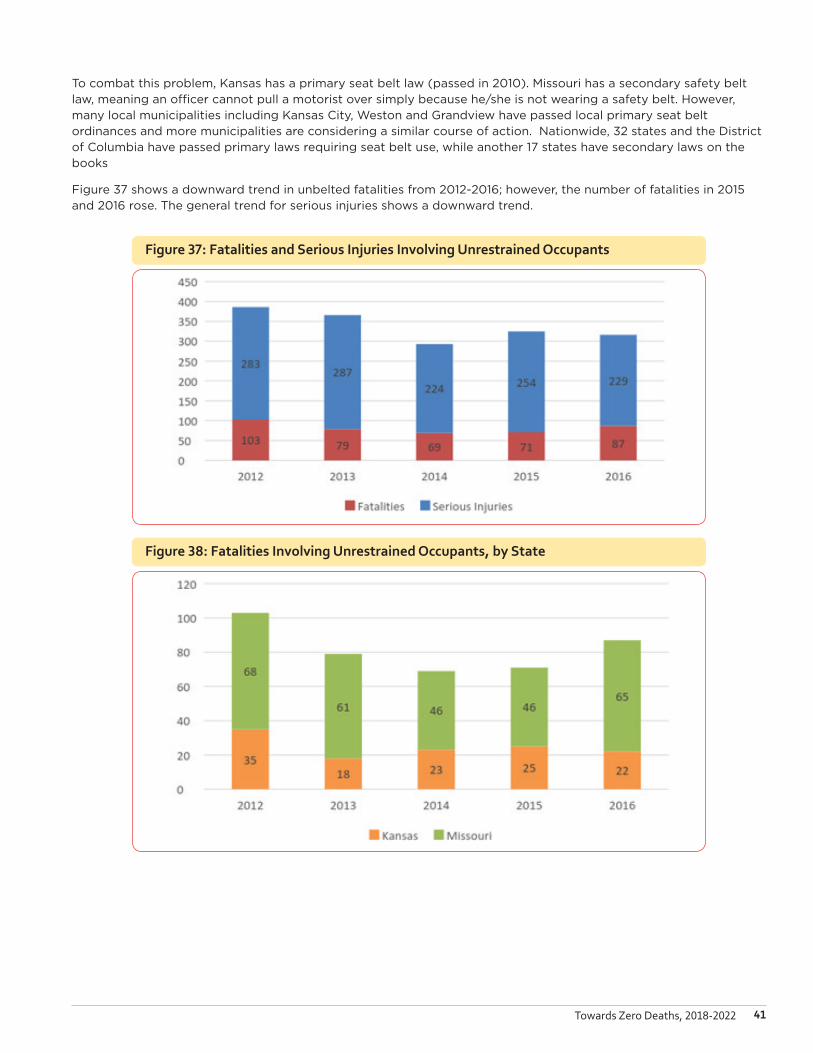
41Towards Zero Deaths, 2018-2022
To combat this problem, Kansas has a primary seat belt law (passed in 2010). Missouri has a secondary safety belt law, meaning an officer cannot pull a motorist over simply because he/she is not wearing a safety belt. However, many local municipalities including Kansas City, Weston and Grandview have passed local primary seat belt ordinances and more municipalities are considering a similar course of action. Nationwide, 32 states and the District of Columbia have passed primary laws requiring seat belt use, while another 17 states have secondary laws on the books
Figure 37 shows a downward trend in unbelted fatalities from 2012-2016; however, the number of fatalities in 2015 and 2016 rose. The general trend for serious injuries shows a downward trend.
Figure 37: Fatalities and Serious Injuries Involving Unrestrained Occupants
Figure 38: Fatalities Involving Unrestrained Occupants, by State

42 Destination Safe Coalition
Figure 39: Serious Injuries Involving Unrestrained Occupants, by State
Unrestrained Occupants Safety Strategies
Time frame to Implement
Safety Strategy Relative Cost
Potential Partners
EDUCATION
Current Educate young drivers about the importance of safety belt use
$ DMVs, driving schools, local law enforcement, local schools, ThinkFirst
Current Educate parents, caregivers and grandparents about proper selection and installation of child safety seats and booster seats
$ Child passenger safety technicians, Medical/public health professionals, Safe Kids, Safety and Health Council of Western Missouri & Kansas
Current Expand public information and education campaigns to educate the public and target groups about the importance of occupant protection
$ All
Current Use videos to educate young drivers about the importance of safety belt use
$ MSHP
Current Use the seat belt convincer and rollover simulators to educate drivers about the importance of safety belt use
$ Local law enforcement, MSHP, KHP
Current Increase emphasis on special occupant protection mobilizations (public information and Strategic Traffic Enforcement Program - S.T.E.P. campaigns)
$ KDOT, KHP, local law enforcement, MoDOT, MSHP
Current Make available child safety seats and booster seats for low-income families
$$ Local hospitals, Safe Kids, Safety and Health Council of Western Missouri & Kansas
Short-term Educate law enforcement about the primary use occupant protection component of the graduated driver license (GDL) in Missouri
$ Local law enforcement, MSHP, Think-First
Short-term Educate the Missouri GDL recipients about the mandatory safety belt use component of the law
$ Driving schools, Missouri DMV
Short-term Obtain and develop educational programs centered on seat belt convincers
$ KHP, local law enforcement, MSHP

43Towards Zero Deaths, 2018-2022
Unrestrained Occupants Safety Strategies
ENGINEERING
Current Encourage the cities and counties to post seat belt signs at entry points near speed limit signs
$ MoDOT
ENFORCEMENT
Current Strictly enforce the primary use occupant protection component of GDL in Missouri
$ Local law enforcement, MSHP
Current Strictly enforce the primary child seat law in both Kansas and Missouri
$ KHP, local law enforcement, MSHP
Current Strictly enforce secondary occupant protection in Missouri
$ KHP, local law enforcement, MSHP
PUBLIC POLICY
Current Continue to support Missouri Primary Seat belt Law
$ Local law enforcement, MSHP, Destination Safe
Current Encourage all local governments located in the Missouri Destination Safe Region to pass local primary seat belt ordinances
$ Destination Safe
Distracted Driving
According to www.distracteddriving.gov, the official United States government website for distracted driving, distracted driving is a dangerous epidemic on America’s roadways. In 2015 alone, 3,477 people were killed in distracted driving crashes.
There are three main types of distraction:
» Manual — taking your hands off the wheel.
» Visual — taking your eyes off the road.
» Cognitive — taking your mind off the job of driving.
Texting while driving takes your eyes off the road for about 4.6 seconds. This is the equivalent, at 55 mph, of driving the length of an entire football field, blind. At any given daylight moment across America, approximately 660,000 drivers are using cell phones or manipulating electronic devices while driving, a number that has held steady since 2010. Distracted driving involves not only cell phone use, but eating, talking to other passengers, adjusting a music device, grooming and many other unsafe practices. As technology continues to evolve in our society, the potential for many forms of distraction while driving will continue to grow. Young drivers are at most risk; however, all drivers on the road are susceptible to becoming the victim of someone else’s inability to concentrate on their driving. The best way to combat distracted driving is by educating the public on the dangers of driving distracted and ways to prevent distracted driving fatalities and serious injuries.
To understand the prevalence of distracted driving behavior, Destination Safe sponsored a visual observation survey. The Missouri Safety Center conducted a Distracted Driving Pilot Survey from October 29 through November 4, 2012, in Jackson and Johnson counties of Missouri. The survey’s purpose was to collect direct observational data on distracted driving behavior (i.e., cell phone use, texting, “other” distractions or no distractions.) The results have yielded valuable information about the frequency of distracted driving behavior. A total of 6,438 drivers were observed; 85 percent of all drivers observed had no distraction while 15 percent had an exhibited distraction of some type.
Regionally, 15.5 percent of all fatalities involve distracted driving. Within the Greater Kansas City region, the number of fatalities and serious injuries resulting from distracted driving has continued to fluctuate. This may be due, in part, to an inability to determine definitively whether a crash involved inattention. The Destination Safe Coalition believes distracted driving is a serious motor-vehicle issue and will continue to establish strategies that will decrease the numbers of future deaths and injuries resulting from distracted driving. The regional trend over the five-year period indicates a decrease in fatalities and serious injuries associated with this focus area. However, the years 2015 and 2016 show increase in fatalities.
Time frame: Current = Underway; Short-term = 1-2 years; Long-term = 3-5 years; Future = 6+ yearsRelative Cost: $ = Inexpensive; $$ = Low Cost; $$$ = Moderate; $$$$ = Expensive

44 Destination Safe Coalition
Figure 40: Fatalities and Serious Injuries Involving Distracted Driving
Figure 41: Fatalities Involving Distracted Driving, by State
Figure 42: Serious Injuries Involving Distracted Driving, by State

45Towards Zero Deaths, 2018-2022
Distracted Driving Safety Strategies
Time frame to Implement
Safety Strategy Relative Cost
Potential Partners
EDUCATION
Current Raise awareness of the dangers of distracted driving and the state laws which ban certain activities
$ KDOT, Local gov'ts, MARC, MoDOT
Current Incorporate inattentive driving issues into CDL driver training classes
$ Driving schools, KDOT, MoDOT, OOIDA
Current Educate roadway users and employers on the dangers of distracted and fatigued driving
$ Driving schools, KDOT, MoDOT, Private industry
ENGINEERING
Current Deploy shoulder, edge line, and center line rumble strips along the region's interstates, freeways, expressways, and rural roadways
$$$ KDOT, MoDOT
Current Provide advance warning of unexpected situations (i.e. "Red Signal Ahead" interactive warning)
$$$ KDOT, Local gov'ts, MoDOT
Short-term Ensure an appropriate median barrier is in place along divided highways
$$$$ KDOT, MoDOT
ENFORCEMENT
Current Enforce Kansas ban on cell phone use for novice drivers and texting for all drivers. Enforce Missouri ban on texting for novice drivers
$$ KHP, Local law enforcement, MSHP
PUBLIC POLICY
Current Amend Missouri law to include a ban on texting for all drivers
$ MoDOT, MHSP
Short-term Partner with public and corporate entities to adopt policies that regulate use of cell phones and other electronic devices
$ KDOT, MoDOT, Private industry
Unlicensed, Revoked or Suspended Drivers
Drivers who are unlicensed or have had their license revoked or suspended create a serious issue for law enforcement and law-abiding citizens’ safety and security. A significant percentage of fatalities can be attributed to crashes in which a driver was not properly licensed. The AAA Foundation for Traffic Safety released a study in 2011, Unlicensed to Kill, that examined data for drivers involved in fatal crashes from 2007-2009 and found that 18.2 percent of fatal crashes involved a driver who was unlicensed or invalidly licensed. Regionally, 24 percent of all fatalities and 18 percent of serious injuries involved unlicensed, revoked or suspended drivers.
Time frame: Current = Underway; Short-term = 1-2 years; Long-term = 3-5 years; Future = 6+ yearsRelative Cost: $ = Inexpensive; $$ = Low Cost; $$$ = Moderate; $$$$ = Expensive

46 Destination Safe Coalition
Figure 44: Fatalities Involving Unlicensed, Revoked or Suspended Drivers, by State
Figure 45: Serious Injuries Involving Unlicensed, Revoked or Suspended Drivers, by State
Figure 43: Fatalities and Serious Injuries Involving Unlicensed, Revoked or Suspended Drivers

47Towards Zero Deaths, 2018-2022
Unlicensed, Revoked or Suspended Drivers Safety Strategies
Time frame to Implement
Safety Strategy Relative Cost
Potential Partners
EDUCATION
Current Educate drivers about the consequences of continuing to drive after a license is revoked or suspended
$ KHP, Local law enforcement, MSHP
ENFORCEMENT
Current Conduct safety checkpoints in high-risk areas and corridors
$ KHP, Local law enforcement, MSHP
Short-term If provided, distribute an unlicensed, revoked or suspended driver identification list to local law enforcement
$ DMVs
Current Increase the use of license plate readers to identify unlicensed or revoked offenders
$$ KHP, Local law enforcement, MSHP
PUBLIC POLICY
Current Support efforts that improve bicycle and pedestrian safety
$$ KDOT, Local gov'ts, MARC, MoDOT
Current Support public policy or administrative changes that help identify and/or restrict the unlicensed, revoked or suspended driver (i.e. impound vehicle, impound license plate, increase sanctions, etc.)
$ All
Current Support legislation that restricts the mobility of offenders through vehicle modifications (i.e. ignition interlock device)
$$$ All
Short-term Encourage coordinated transportation and land use plans that will create a more comprehensive community design
$ KDOT, Local gov'ts, MARC, MoDOT
Future To encourage a less hostile commuting environment, improve other travel modes in the region that reduce one's dependence upon driving automobiles by supporting an improved regional transit system described in Smart Moves and regional trails described in MetroGreen
$$$$ KCATA, KDOT, Local gov'ts, MARC, MoDOT, The Jo, UG Transit
Time frame: Current = Underway; Short-term = 1-2 years; Long-term = 3-5 years; Future = 6+ yearsRelative Cost: $ = Inexpensive; $$ = Low Cost; $$$ = Moderate; $$$$ = Expensive

48 Destination Safe Coalition
SPECIAL USERS
Special users of the roadway comprise special transportation modes, vehicle types and driver related characteristics associated with driver experience and driver age. This part of the plan describes relative national, state and local level data about each of the special user focus groups. Each focus group has its own set of safety strategies.
Young Motorists (Ages 15-24)
Young people represent about 14 percent of the United States population; however, they account for around 30 percent ($19 billion) of the total cost of motor vehicle injuries among males, and 28 percent of the total cost of motor vehicle injuries among females (CDC 2013). Per mile driven, teen drivers ages 16-19 are three times more likely than drivers aged 20 and older to be in a fatal crash (CDC 2015). Motor vehicle mortality rates for Kansas City Metropolitan youth are seven percent higher than mortality rates of all ages. Johnson (KS) and Leavenworth (KS) counties showed an increase in total fatalities and serious injuries in the past five-year average while all other counties remained statistically stable or showed decreases. Data from Destination Safe Kansas counties showed an increase in aggressive driving, unbelted occupants and distracted driving among young adults on the road, while Missouri saw a decrease in each of these categories. The factors contributing to these higher crash rates in Kansas include a lack of driving experience and inadequate driving skills, excessive driving during nighttime, risk taking behavior, poor driving judgment and decision-making skills, drinking and driving, and distractions from teenage passengers. The 2011 National YRBS showed for the first time that one of every three (33 percent) students had texted or e-mailed while driving a car or other vehicle during the past 30 days.
One third of young drivers (ages 15-24) do not wear their safety belts. At a 79 percent use rate, Missouri is still six percent below the national average of 85 percent seat belt use (Missouri Coalition for Roadway Safety, 2011). Ninth through twelfth grade, males are less likely (15.1 percent) to wear safety belts while being a passenger. While there is not data specific to youth drivers, 22 percent of occupants of all fatal and serious injury crashes across the Destination Safe region (2008-2012) were unbelted. Compared with other age groups, teens have the lowest rate of safety belt use. In 2011, only 54 percent of high school students reported they always wear safety belts when riding with someone else (CDC 2013).
While one in ten high school teen drivers report driving under the influence of alcohol, this percentage has decreased by more than half (54 percent) over the last two decades. At a national level, the National Institute on Alcohol Abuse and Alcoholism (NIAAA) presents data compiled by the Alcohol Epidemiologic Data System (AEDS) on underage drinking among youth ages 12–20 for 1991–2011. Figure 391 provides much needed insight into prevalence of drinking among these age cohorts. The percentage of youth that report drinking has fallen significantly over the past two decades.
Figure 46: Monthly Underage (12-20) Alcohol Consumption, 1991-2011
’91 ’92 ’93 ’94 ’95 ’96 ’97 ’98 ’99 ’00 ’01 ’02 ’03 ’04 ’05 ’06 ’07 ’08 ’09 ’10 ’11
Source: National Institute on Alcohol Abuse and Alcoholism (NIAAA) presents data compiled by the Alcohol Epidemiologic Data System (AEDS)

49Towards Zero Deaths, 2018-2022
In 2014, 17 percent of drivers aged 16 to 20 involved in fatal motor vehicle crashes had a BAC of .08 percent or higher.(NHTSA Traffic Safety Facts 2014 Data) In a national survey conducted in 2011, 24 percent of teens reported that, within the previous month, they had ridden with a driver who had been drinking alcohol, and 8 percent reported having driven after drinking alcohol within the same one-month period. In 2010, half of teen deaths from motor vehicle crashes occurred between 3:00 PM and midnight and 55 percent occurred on Friday, Saturday or Sunday.
The Destination Safe area has seen decreases in the number of serious injuries over all with significant progress being seen in Missouri. Fatalities are trending up. As a special user group, young drivers are still much more likely to be involved in a traffic related crash. Many of the poor decisions such as driving without buckling up or riding with someone who has been drinking will remain a focus of Destination Safe and its partners.
The involvement of people under the age of 25 in transportation safety must be understood from two perspectives. Not only are they more likely to be involved in crashes because of their tendency to display more irresponsible driving behaviors but also more likely to be injured or fatally wounded in a crash.
Regional discussions about youth and young adult safety issues center on educating new drivers who lack experience and may exhibit less responsible driving behaviors. Other strategies have included tougher license requirements including graduated driver license (GDL). The GDL gradually allows the young driver more driving responsibilities after completing a certain number of driving hours and/or educational requirements. Missouri’s current GDL law became effective on January 1, 2007, and includes passenger restrictions, a nighttime driving restriction and stricter safety belt provisions. Kansas passed a similar GDL law effective January 1, 2010. The downward trend in fatalities per 10,000 population can be attributed to working to educate young drivers and passing new laws.
National, state and regional attention still focuses on young drivers because they represent a significant portion of traffic fatalities and disabling injuries.
Figure 47: Fatalities and Serious Injuries Involving Young Motorists

50 Destination Safe Coalition
Figure 48: Fatalities Involving Young Motorists, by State
Figure 49: Serious Injuries Involving Young Motorists, by State

51Towards Zero Deaths, 2018-2022
Young Motorists Safety Strategies
Time frame to Implement
Safety Strategy Relative Cost
Potential Partners
EDUCATION
Current Educate young and novice roadway users on all aspects of driving safety
$ DMVs, Driving schools, Local schools
Current Increase safety belt use among young drivers and passengers using programs like Battle of the Belt, SIDNE vehicle, public service announcement competitions, etc.
$ KDOT, KHP, Local law enforcement, MoDOT, MSHP
Current Encourage the importance of driver education pro-grams through public and private offerings and incorporating components into existing curriculums or web-based education
$$ Driving schools, KDOT, MoDOT
ENFORCEMENT
Current Expand enforcement targeting young drivers along high-risk corridors
$ KHP, MSHP, Local law enforcement
Short-term Educate and train local law enforcement about the Graduated Drivers License (GDL) law requirements in Missouri (occupant protection,
$ DMVs
PUBLIC POLICY
Current Support efforts to monitor, and if appropriate, enhance the Graduated Drivers License Law in Kansas
$ All
Current Support efforts to monitor, and if appropriate, enhance the Graduated Drivers License Law in Missouri.
$ All
Older Motorists (Ages 65 and over)
The complex issue of maintaining mobility as one grows older is influenced by many factors including physical limitations, availability of transportation and location. All transportation users will eventually become older transportation users. Aging issues are becoming more prevalent in the Kansas City region in discussions with funding health care and other quality-of-life issues. Furthermore, over 200,000 people in the Kansas City Metropolitan Area are ages 65 and over and that number is expected to double during the next 20 years.
Many older adults rely on a transportation system geared to the automobile. This dependence on a singular mode isolates older adults when no other forms of transportation are available. Older drivers have greater issues with sight, mobility and other physical limitations. It’s also harder for older transportation users to recover from a crash, so their injuries are often more significant, if not fatal.
It’s important to consider the safety issues of older adults and mobility from two perspectives. One is determining the likelihood of older drivers to be involved in a crash. This is primarily related to physical limitations that occur as one ages. The other safety perspective is to consider the older adult population’s likelihood of sustaining injuries or fatal injuries in a crash, whether the older adult is a driver, passenger, pedestrian or some other form of transportation user.
For this discussion, an older adult is someone age 65 or older. According to NHTSA, older adults made up 15 percent of the total U.S. resident population (47.8 million) in 2015 and 18 percent of all licensed drivers in 2015; additionally, this number has grown since then and is expected to continue growing as the Baby Boomer generation continues aging.
Older drivers were involved in 10 to 13 percent of crashes in a given year which is a substantial involvement in all crashes. Motorists age 65 and older were involved in about 18 percent of fatalities on average in the region. This percentage is slightly above national levels (16 percent).
In 2015, 13 percent of
all traffic fatalities in
the U.S. were among people
aged 65 or older.
Time frame: Current = Underway; Short-term = 1-2 years; Long-term = 3-5 years; Future = 6+ yearsRelative Cost: $ = Inexpensive; $$ = Low Cost; $$$ = Moderate; $$$$ = Expensive

52 Destination Safe Coalition
According to the Missouri Coalition for Roadway Safety’s Missouri’s Blueprint A Partnership Toward Zero Deaths, the number of Missourians aged 65 or older will make up more than 21 percent of the population by 2030. That growth will bring the total number of older adults to an estimated 1.4 million. The proportion of older adults 65 or over in Missouri’s population will grow to on in four residents. Regional data from the past five years show the change in total fatalities has remained flat but serious injuries are trending up.
Figure 50: Fatalities and Serious Injuries Involving Older Motorists
Figure 51: Fatalities Involving Older Motorists, by State

53Towards Zero Deaths, 2018-2022
Figure 52: Serious Injuries Involving Older Motorists, by State
Older Motorists Safety Strategies
Time frame to Implement
Safety Strategy Relative Cost
Potential Partners
ENGINEERING
Current As appropriate, review the Federal Highway Administration’s (FHWA) Older Driver Design Handbook and integrate into existing standards, including best practices for design and facilities and roadway visibility features
$ Communities for All Ages, Destination Safe
Current Identify and share best practices for pedestrian de-sign guidelines that address and promote senior mobility
$ Communities for All Ages, Destination Safe
Current Examine signal phase and time to determine if changes (such as protected left phase and longer clearance intervals) are needed
$ KDOT, local governments, MoDOT,
Current Encourage roadway design and traffic management to consider the older motorist and make roadways safer for everyone
$ KDOT, local governments, MARC MoDOT, PTRPC
Long-term Replace old signs with larger, more retroreflective signs during regular sign maintenance
$$$ KDOT, local governments, MoDOT
Long-term Provide advance warning, guide and name signs. Consider internally lit signs in appropriate urban areas.
$$$ KDOT, local governments, MoDOT
Long-term Provide advanced warning, guide and name signs. Consider internally lit signs in appropriate urban areas.
$$$ KBPRC, KDOT, Local Governments, MoDOT
Long-term Improve roadway lighting in needed urban and rural areas
$$$ KDOT, local governments, MoDOT,
Future Upgrade the region’s traffic signals onto mast arms that improve driver visibility and provide all-red clearance intervals
$$$$ KDOT, local governments, MoDOT

54 Destination Safe Coalition
Older Motorists Safety Strategies
ENFORCEMENT
Short-term Partner with the Kansas Executive Safety Council and Missouri Coalition for Roadway Safety to evaluate the need for law enforcement training programs in the Destination Safe service area
$$ Communities for All Ages, Destination Safe
Long-term Promote safe driving and mobility of older adults through licensing and enforcement, through in-creasing the knowledge of licensing personnel and law enforcement about recognition, assessment and reporting of failing older motorists
$$$ Communities for All Ages, Destination Safe
EMERGENCY RESPONSE
Short-term Expand the use and awareness of existing programs and technologies to assist emergency responders
Destination Safe
EDUCATION
Current Raise awareness of the safety, access and mobility needs of aging drivers and pedestrians among stakeholders
$ Communities for All Ages, Destination Safe
Current Promote proven examples of vehicle adaptations and advanced technology systems for older motorists to compensate for some age-related abilities that can lead to unsafe driving.
$ Communities for All Ages, Destination Safe
Current Support public education campaign for older motorist’s safety that address the value of prevention strategies, early recognition of failing drivers, referrals, and transportation options
$ Communities for All Ages, Destination Safe
Current Promote safety belt use among older motorists and passengers through educational campaigns
$ KDOT, KHP, MoDOT, MSHP
Short-term Coordinate and collaborate with area agencies on aging, local senior centers, AARP and others to implement educational programs
$$ Area agencies on aging, AARP, KDOT, MARC, MoDOT
Short-term Partner with the medical community to educate older motorists, their family and friends about driving risks associated with certain prescription drugs and physical conditions
$ KDOT, local governments, MoDOT, medical community
PUBLIC POLICY
Long-term Promote land-use principles included in the Region-al Plan for Sustainable Development, and policies to develop land-use guidelines
$$$ Local governments, MARC
Long-term Support advocacy capacity for alternatives to personal transportation
$$$ Advocacy organizations, MARC Senior Mobility Advisory Council
Assess state laws and policies regarding older driver licensing: renewal procedures, medical advisory boards, promote alternative transportation programs at the legislative level, promote safer roadways at the local and state government levels, and promote public awareness of older motorist safety.
Senior Mobility Advisory Council
Time frame: Current = Underway; Short-term = 1-2 years; Long-term = 3-5 years; Future = 6+ yearsRelative Cost: $ = Inexpensive; $$ = Low Cost; $$$ = Moderate; $$$$ = Expensive

55Towards Zero Deaths, 2018-2022
Motorcycle/Moped Riders
Motorcycle and moped riders represent a class of transportation users that is particularly vulnerable to sustaining serious or fatal injuries in the event of a crash. All motorists need to be aware of these vulnerable roadway users and should share the road in order to ensure their safety. Furthermore, riders of motorcycles and mopeds should strive to make themselves visible to all motorists.
Between 2012 and 2016, motorcycle and moped riders accounted for about 16 percent of all fatalities and 14 percent of serious injuries in the Kansas City region. According to the 2010 American Community Survey (ACS) five-year estimates, only 0.2 percent of workers used motorcycles for their journey to work in the Kansas City, MO-KS Metropolitan Statistical Area (MSA). Despite the fact that ACS data only relates to work trips, it nonetheless seems reasonable to conclude that motorcycle and moped riders are overrepresented in roadway fatalities and serious injuries in comparison to their overall numbers on the road. It is also important to note that the annual number and rate of motorcycle/moped fatalities has generally held steady for the past five years despite a regional decrease in total fatalities during the same time period.
Data reveals that the number of fatalities and serious injuries involving motorcycle/moped riders have held steady for the past five years.
Figure 53: Fatalities and Serious Injuries Involving Motorcycle/Moped Riders
Figure 54: Fatalities Involving Motorcycle/Moped Riders, by State

56 Destination Safe Coalition
Figure 55: Serious Injuries Involving Motorcycle/Moped Riders, by State
Motorcycle/Moped Riders Safety Strategies
EDUCATION
Current Educate roadway users on motorcycle performance, visibility, helmet use and sharing the road with motorcyclists
$ Driving Schools, KDOT, MoDOT
Current Promote awareness of interactive simulation tools for motorcyclist training
$$ KHP, Local Law Enforcement, Driving Schools, MHSP
ENFORCEMENT
Current Enforce helmet law in Missouri for all riders including citations for nonconforming helmets
$ Local Missouri Law Enforcement, MSHP
PUBLIC POLICY
Current Support efforts to maintain and enhance all-rider helmet law in Missouri
$ All
Current Support efforts to pass all-rider helmet law in Missouri
$ All
Time frame: Current = Underway; Short-term = 1-2 years; Long-term = 3-5 years; Future = 6+ yearsRelative Cost: $ = Inexpensive; $$ = Low Cost; $$$ = Moderate; $$$$ = Expensive
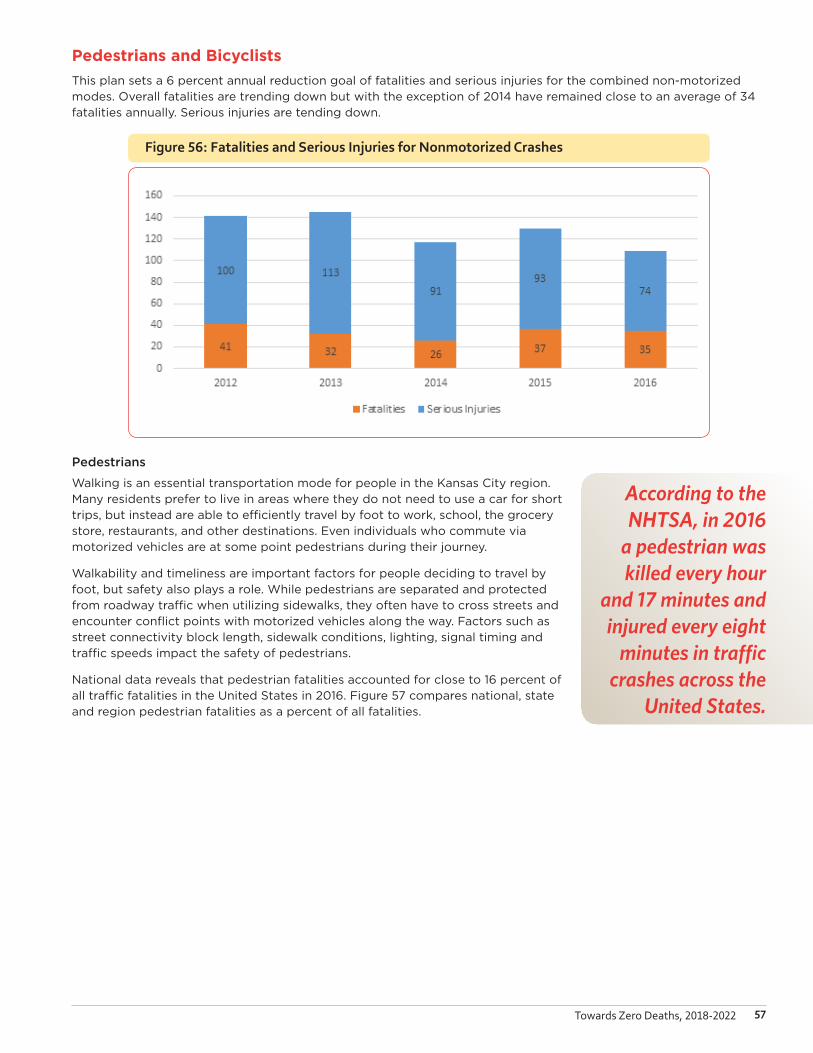
57Towards Zero Deaths, 2018-2022
Pedestrians and Bicyclists
This plan sets a 6 percent annual reduction goal of fatalities and serious injuries for the combined non-motorized modes. Overall fatalities are trending down but with the exception of 2014 have remained close to an average of 34 fatalities annually. Serious injuries are tending down.
Figure 56: Fatalities and Serious Injuries for Nonmotorized Crashes
Pedestrians
Walking is an essential transportation mode for people in the Kansas City region. Many residents prefer to live in areas where they do not need to use a car for short trips, but instead are able to efficiently travel by foot to work, school, the grocery store, restaurants, and other destinations. Even individuals who commute via motorized vehicles are at some point pedestrians during their journey.
Walkability and timeliness are important factors for people deciding to travel by foot, but safety also plays a role. While pedestrians are separated and protected from roadway traffic when utilizing sidewalks, they often have to cross streets and encounter conflict points with motorized vehicles along the way. Factors such as street connectivity block length, sidewalk conditions, lighting, signal timing and traffic speeds impact the safety of pedestrians.
National data reveals that pedestrian fatalities accounted for close to 16 percent of all traffic fatalities in the United States in 2016. Figure 57 compares national, state and region pedestrian fatalities as a percent of all fatalities.
According to the NHTSA, in 2016
a pedestrian was killed every hour
and 17 minutes and injured every eight
minutes in traffic crashes across the
United States.

58 Destination Safe Coalition
Figure 57: Pedestrian Fatalities as a Percentage of Total Crash Fatalities
Regional data reveals that the total number of pedestrian fatalities declined slightly over the 2012-2016 period. Pedestrian serious injuries declined but had a spike in 2013. While pedestrians make up a smaller share of the total individuals involved in vehicular crashes in the region, they’re still important as most everyone becomes a pedestrian at some point throughout the day.
Figure 58: Fatalities and Serious Injuries Involving Pedestrians
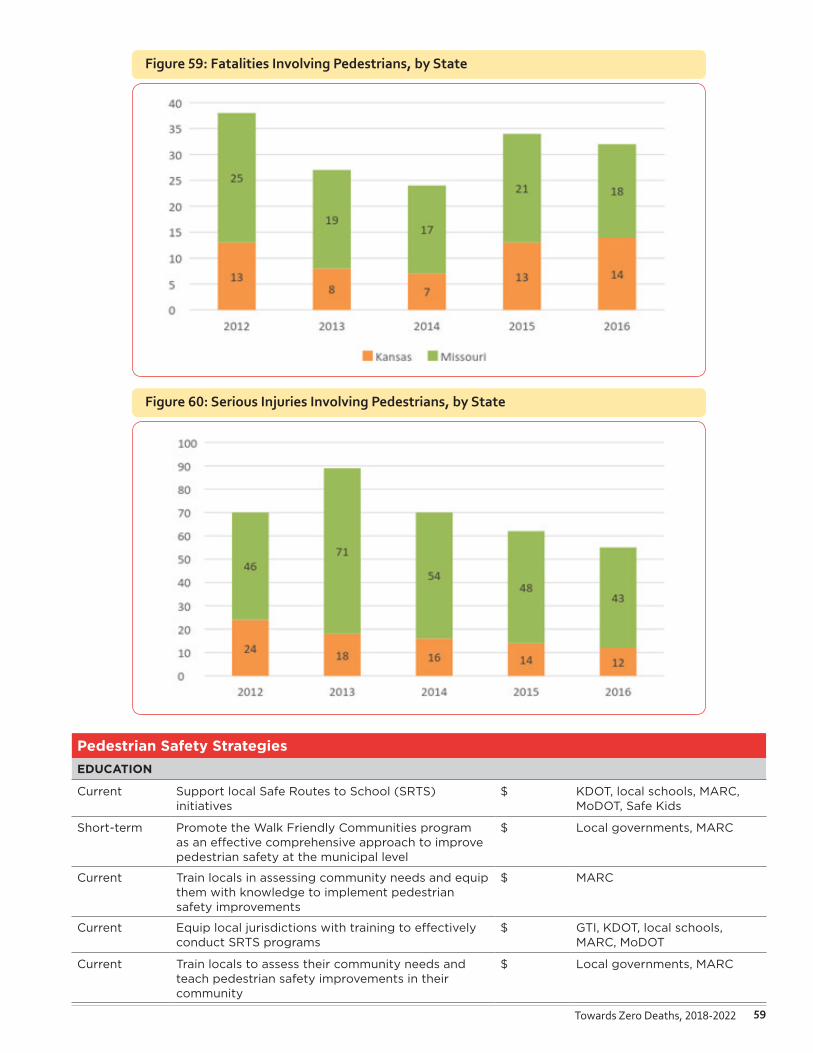
59Towards Zero Deaths, 2018-2022
Figure 59: Fatalities Involving Pedestrians, by State
Figure 60: Serious Injuries Involving Pedestrians, by State
Pedestrian Safety Strategies
EDUCATION
Current Support local Safe Routes to School (SRTS) initiatives
$ KDOT, local schools, MARC, MoDOT, Safe Kids
Short-term Promote the Walk Friendly Communities program as an effective comprehensive approach to improve pedestrian safety at the municipal level
$ Local governments, MARC
Current Train locals in assessing community needs and equip them with knowledge to implement pedestrian safety improvements
$ MARC
Current Equip local jurisdictions with training to effectively conduct SRTS programs
$ GTI, KDOT, local schools, MARC, MoDOT
Current Train locals to assess their community needs and teach pedestrian safety improvements in their community
$ Local governments, MARC
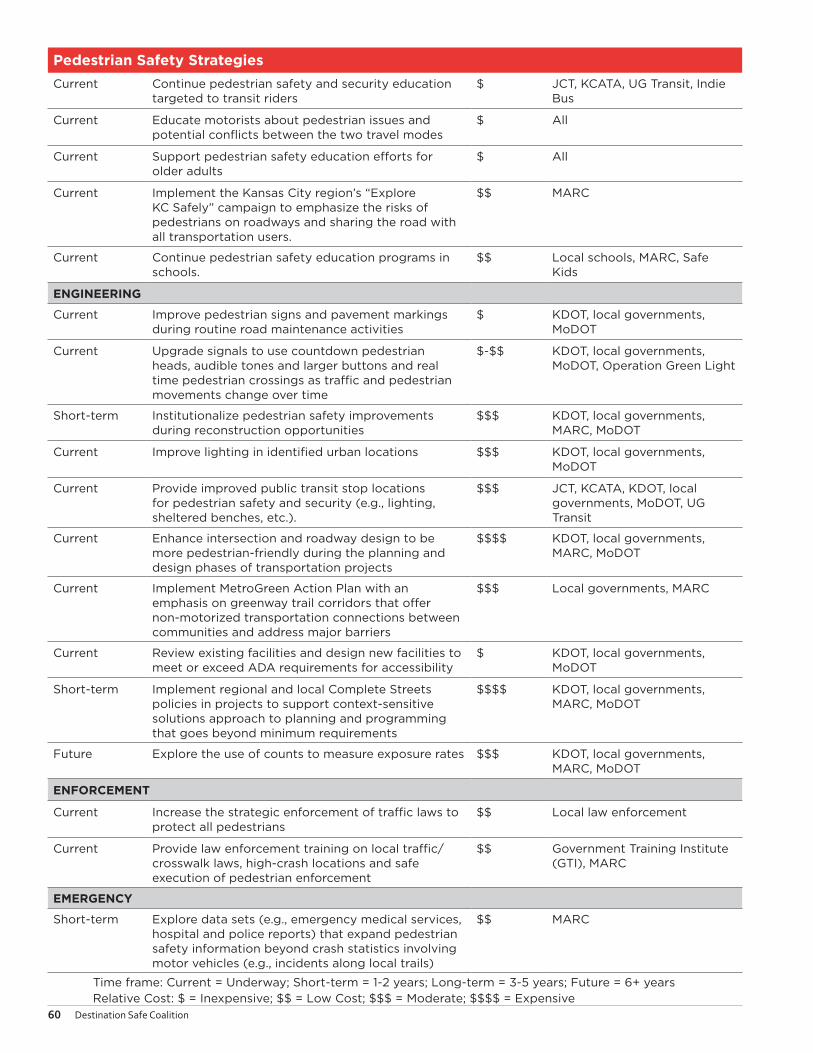
60 Destination Safe Coalition
Pedestrian Safety Strategies
Current Continue pedestrian safety and security education targeted to transit riders
$ JCT, KCATA, UG Transit, Indie Bus
Current Educate motorists about pedestrian issues and potential conflicts between the two travel modes
$ All
Current Support pedestrian safety education efforts for older adults
$ All
Current Implement the Kansas City region’s “Explore KC Safely” campaign to emphasize the risks of pedestrians on roadways and sharing the road with all transportation users.
$$ MARC
Current Continue pedestrian safety education programs in schools.
$$ Local schools, MARC, Safe Kids
ENGINEERING
Current Improve pedestrian signs and pavement markings during routine road maintenance activities
$ KDOT, local governments, MoDOT
Current Upgrade signals to use countdown pedestrian heads, audible tones and larger buttons and real time pedestrian crossings as traffic and pedestrian movements change over time
$-$$ KDOT, local governments, MoDOT, Operation Green Light
Short-term Institutionalize pedestrian safety improvements during reconstruction opportunities
$$$ KDOT, local governments, MARC, MoDOT
Current Improve lighting in identified urban locations $$$ KDOT, local governments, MoDOT
Current Provide improved public transit stop locations for pedestrian safety and security (e.g., lighting, sheltered benches, etc.).
$$$ JCT, KCATA, KDOT, local governments, MoDOT, UG Transit
Current Enhance intersection and roadway design to be more pedestrian-friendly during the planning and design phases of transportation projects
$$$$ KDOT, local governments, MARC, MoDOT
Current Implement MetroGreen Action Plan with an emphasis on greenway trail corridors that offer non-motorized transportation connections between communities and address major barriers
$$$ Local governments, MARC
Current Review existing facilities and design new facilities to meet or exceed ADA requirements for accessibility
$ KDOT, local governments, MoDOT
Short-term Implement regional and local Complete Streets policies in projects to support context-sensitive solutions approach to planning and programming that goes beyond minimum requirements
$$$$ KDOT, local governments, MARC, MoDOT
Future Explore the use of counts to measure exposure rates $$$ KDOT, local governments, MARC, MoDOT
ENFORCEMENT
Current Increase the strategic enforcement of traffic laws to protect all pedestrians
$$ Local law enforcement
Current Provide law enforcement training on local traffic/crosswalk laws, high-crash locations and safe execution of pedestrian enforcement
$$ Government Training Institute (GTI), MARC
EMERGENCY
Short-term Explore data sets (e.g., emergency medical services, hospital and police reports) that expand pedestrian safety information beyond crash statistics involving motor vehicles (e.g., incidents along local trails)
$$ MARC
Time frame: Current = Underway; Short-term = 1-2 years; Long-term = 3-5 years; Future = 6+ yearsRelative Cost: $ = Inexpensive; $$ = Low Cost; $$$ = Moderate; $$$$ = Expensive

61Towards Zero Deaths, 2018-2022
Bicyclists
Bicycling is a common transportation mode for people in the Kansas City region because it’s both cost-effective and time-efficient for traveling short to moderate distances. In addition, bicycling provides the users health benefits, the environment air quality benefits, and the region financial benefits for reducing the frequency of maintaining roadways.
Bicyclists on roadways, by law, are vehicles with the same rights and responsibilities as motorized vehicles; consequently, bicyclists face greater safety risks compared to other roadway users. Bicyclists are significantly less protected in the event of a crash compared to automobile drivers. Factors such as accessibility, visibility, and awareness are important to the safety of bicyclists throughout the region. The total share of bicycle trips is not known. The U.S. Census Bureau which measures work-based trips reported that bicycle commuting increased significantly, 42 percent in Kansas City from 2011 to 2012, compared with just a 10 percent increase nation-wide.
Figure 61: Fatalities and Serious Injuries Involving Bicyclists
Bicyclists Safety Strategies
EDUCATION
Current Support the Kansas City region’s ExploreKC campaign as part of Destination Safe to emphasize the risks to bicyclists on roadways and sharing the road with all transportation users
$ MARC
Current Increase and support bicycle safety education programs in elementary schools through Safe Routes to School (SRTS)
$ KDOT, local schools, MARC, MoDOT, Safe Kids, BikeWalkKC
Current Equip local jurisdictions with training to effectively conduct bicycle rodeos
$ Government Training Institute, MARC
Current Educate motorists of bicyclist issues and potential conflicts between travel modes
$ All
Current Train locals in assessing community needs, and equip them with knowledge to implement bicycle safety improvements
$ MARC
ENGINEERING
Long-term Support regional efforts to expand a regional, connected network of trails for recreation and travel
$$$$ MARC
Long-term Expand bicycle facilities through dedicated bike lanes, off-road trails, signs and other infrastructure expansions that provide safer accommodations for bicyclists
$$$$ KDOT, local governments, MARC, MoDOT

62 Destination Safe Coalition
Bicyclists Safety Strategies
Short-term Implement regional and local Complete Streets policies in projects to support context-sensitive solutions approach to planning and programming that goes beyond minimum requirements
$$$$ KDOT, local governments, MARC, MoDOT
Future Make connections to regionally significant bicycle facilities identified in MARC’s Regional Bikeway Plan
$$$ KDOT, local governments, MARC, MoDOT
Future Explore the use of counts to measure exposure rates $$$ KDOT, local governments, MARC, MoDOT
ENFORCEMENT
Current Enforce traffic laws to manage speeding and maintain rules of the road protecting bicyclists
$ Local governments
EMERGENCY
Current Monitor the number of bicyclist fatalities throughout the year in the Kansas City region
$ MARC
Current Explore data sets (e.g., EMS, hospital and public reports) that expand bicycle safety information beyond crash statistics involved motor vehicles (e.g., incidents along local trails)
$ MARC, safety partners
Large Trucks
Large trucks are defined as trucks with a gross vehicle weight rating (GVWR) greater than 10,000 pounds, including single-unit trucks and truck tractors. The primary purpose of these vehicles is the movement of freight. Within the generalized “large truck” category, important operational and functional distinctions exist between “Medium Duty trucks” (10,001 to 26,000 pounds) and “Heavy Duty trucks” (26,001+ pounds) trucks. For example, drivers of Medium Duty trucks, unlike drivers of Heavy Duty trucks, are often not required to possess a Commercial Driver’s License (CDL).
In 2015, 433,000 large trucks were involved in crashes in the United States, resulting in 4,067 deaths or approximately 12 percent of all fatalities, and about 116,000 serious injuries according to the 2015 NHTSA report, Traffic Safety Facts: Large Trucks: 2015.
According to MARC staff analysis of 2011 traffic volumes, large trucks account for approximately 14 percent of total traffic on major highways in the Kansas City region. On certain highways, truck traffic measured as much as 35 percent. From 2012-2016, the average annual number of large truck fatalities for the Destination Safe region was 27. Over the period 2012-2016 fatalities and serious injuries are trending down.
Figure 62: Fatalities and Serious Injuries Involving Large Trucks
Time frame: Current = Underway; Short-term = 1-2 years; Long-term = 3-5 years; Future = 6+ yearsRelative Cost: $ = Inexpensive; $$ = Low Cost; $$$ = Moderate; $$$$ = Expensive

63Towards Zero Deaths, 2018-2022
Figure 63: Fatalities Involving Large Trucks, by State
Figure 64: Serious Injuries Involving Large Trucks, by State
From 2008-2012, there appears to be a downward trend in the annual number of serious injuries resulting from large truck crashes. However, the number of annual fatalities in the same period has been steady from one year to the next. Jackson County, Missouri and Johnson County, Kansas, the two counties with the greatest amount of annual VMT, tend to have the largest number of annual fatalities and disabling injuries. Strategies and countermeasures to reduce the overall number of large truck crashes should be prioritized to reduce the number and severity of large truck crashes.

64 Destination Safe Coalition
Large Trucks Safety Strategies
EDUCATION
Current Continue to consider freight movements and commercial vehicles during the transportation planning process
$ KDOT, MARC, MoDOT, PTRPC
Current Consider the impacts of proposed freight routes (I-49) and existing corridors (I-35, I-70, I-29, U.S. 71) on the region's transportation system safety
$ KDOT, MARC, MoDOT, PTRPC
Current Maintain local contact and coordination with Federal Motor Carrier Safety Administration and other agencies, e.g., Owner Operator Independent Drivers Association
$ All
Current Educate roadways users about sharing the road with commercial vehicles
$ KDOT, MoDOT, Owner Operator Independent Drivers Association
Current Support legislation that strengthens commercial driver license requirements
$ All
Current Support legislation that increases and strengthens truck maintenance programs and inspection performance
$ All
ENGINEERING
Short-term Identify high-crash corridors and implement appropriate engineering countermeasures
$$-$$$$ KDOT, MARC, MoDOT, PTRPC
Time frame: Current = Underway; Short-term = 1-2 years; Long-term = 3-5 years; Future = 6+ yearsRelative Cost: $ = Inexpensive; $$ = Low Cost; $$$ = Moderate; $$$$ = Expensive

65Towards Zero Deaths, 2018-2022
Appendix A: Regional Transportation Safety Data by County
This appendix provides a regional break-down of the regional fatality and serious injury data by county. Because these numbers are small and can be highly variable from year to year, especially in the rural counties, fatalities and serious injuries are presented together to provide a more stable picture of the factors involved in serious crashes in each county.
These figures and tables are provided as a resource to city and county engineers and decision-makers who want to know how the priorities in their county may differ from the region as a whole. For example, young motorists are involved in more crashes than any other factor analyzed in Johnson County, Kansas, but fall to the fourth or fifth most frequently involved factor in other counties. For this reason, safety advocates and decision makers may choose to dedicate more funding toward enforcement and education for young motorists than other counties would choose to do.

66 Destination Safe Coalition
Figure 65: Johnson County, Kansas, Crash Statistics for 2012-2016
Johnson County, Kansas
Fatalities and Serious Injuries 2012 2013 2014 2015 2016 Total
Intersection 359 345 187 169 216 1,276
Young Motorists (15-24) 109 123 80 66 60 438
Fixed Object 112 85 89 76 50 412
Aggressive 91 71 70 73 48 353
Run-Off-Road 73 90 63 59 53 338
Distracted 61 62 62 62 40 287
Older Motorists (65+) 46 53 29 48 47 223
Seat Belt Use (Unbelted) 46 80 29 31 33 219
Impaired 41 55 50 41 26 213
Horizontal Curves 42 44 38 25 36 185
Unlicensed, Revoked, or Suspended Drivers 37 51 34 23 38 183
Motorcycles/Mopeds 51 31 31 32 30 175
Pedestrian 21 12 13 13 14 73
Large Trucks 15 15 13 9 12 64
Head-On 7 19 15 6 15 62
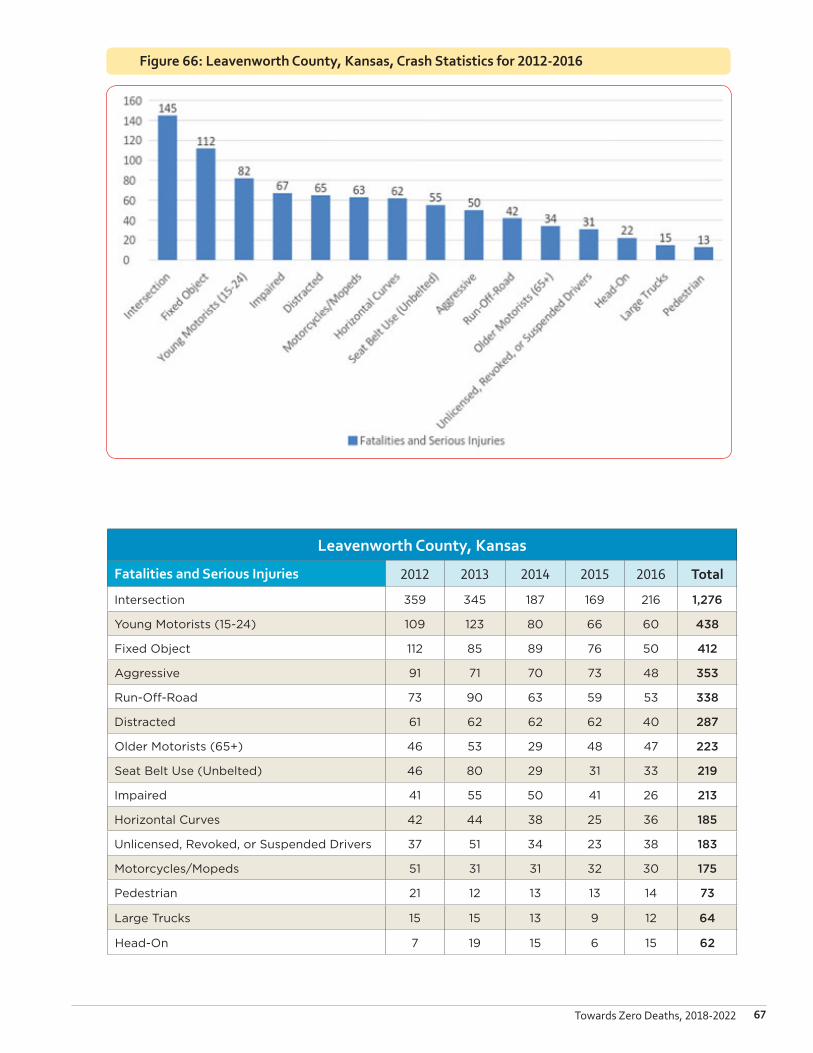
67Towards Zero Deaths, 2018-2022
Figure 66: Leavenworth County, Kansas, Crash Statistics for 2012-2016
Leavenworth County, Kansas
Fatalities and Serious Injuries 2012 2013 2014 2015 2016 Total
Intersection 359 345 187 169 216 1,276
Young Motorists (15-24) 109 123 80 66 60 438
Fixed Object 112 85 89 76 50 412
Aggressive 91 71 70 73 48 353
Run-Off-Road 73 90 63 59 53 338
Distracted 61 62 62 62 40 287
Older Motorists (65+) 46 53 29 48 47 223
Seat Belt Use (Unbelted) 46 80 29 31 33 219
Impaired 41 55 50 41 26 213
Horizontal Curves 42 44 38 25 36 185
Unlicensed, Revoked, or Suspended Drivers 37 51 34 23 38 183
Motorcycles/Mopeds 51 31 31 32 30 175
Pedestrian 21 12 13 13 14 73
Large Trucks 15 15 13 9 12 64
Head-On 7 19 15 6 15 62

68 Destination Safe Coalition
Figure 67: Miami County, Kansas, Crash Statistics for 2012-2016
Miami County, Kansas
Fatalities and Serious Injuries 2012 2013 2014 2015 2016 Total
Aggressive 19 6 15 14 13 67
Intersection 15 13 19 15 3 65
Fixed Object 16 13 10 8 15 62
Seat Belt Use (Unbelted) 19 7 8 15 11 60
Impaired 21 6 11 10 10 58
Distracted 7 7 11 7 8 40
Unlicensed, Revoked, or Suspended Drivers 13 4 6 9 8 40
Young Motorists (15-24) 11 4 5 7 6 33
Older Motorists (65+) 7 5 6 7 8 33
Horizontal Curves 5 6 8 5 9 33
Run-Off-Road 10 3 4 4 3 24
Motorcycles/Mopeds 10 5 5 2 2 24
Pedestrian 4 4 1 4 4 17
Large Trucks 1 1 3 7 0 12
Head-On 5 1 1 1 1 9
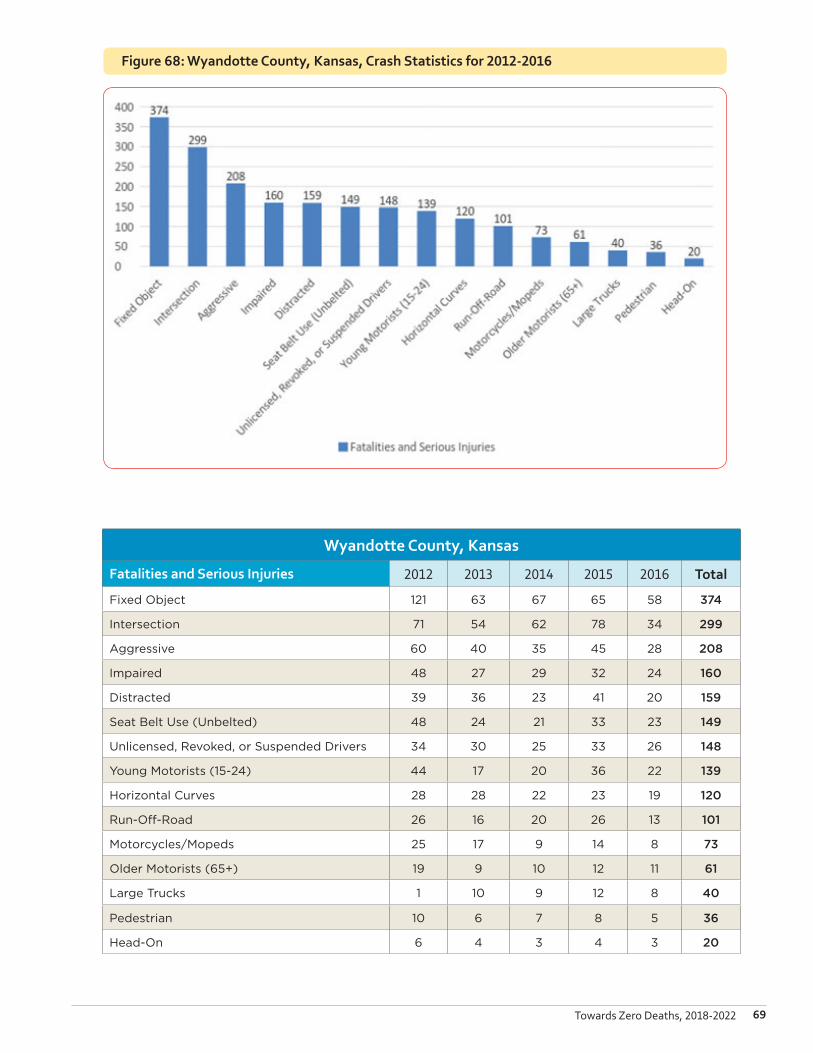
69Towards Zero Deaths, 2018-2022
Figure 68: Wyandotte County, Kansas, Crash Statistics for 2012-2016
Wyandotte County, Kansas
Fatalities and Serious Injuries 2012 2013 2014 2015 2016 Total
Fixed Object 121 63 67 65 58 374
Intersection 71 54 62 78 34 299
Aggressive 60 40 35 45 28 208
Impaired 48 27 29 32 24 160
Distracted 39 36 23 41 20 159
Seat Belt Use (Unbelted) 48 24 21 33 23 149
Unlicensed, Revoked, or Suspended Drivers 34 30 25 33 26 148
Young Motorists (15-24) 44 17 20 36 22 139
Horizontal Curves 28 28 22 23 19 120
Run-Off-Road 26 16 20 26 13 101
Motorcycles/Mopeds 25 17 9 14 8 73
Older Motorists (65+) 19 9 10 12 11 61
Large Trucks 1 10 9 12 8 40
Pedestrian 10 6 7 8 5 36
Head-On 6 4 3 4 3 20

70 Destination Safe Coalition
Figure 69: Cass County, Missouri, Crash Statistics for 2012-2016
Cass County, Missouri
Fatalities and Serious Injuries 2012 2013 2014 2015 2016 Total
Aggressive 28 29 25 31 36 149
Young Motorists (15-24) 20 24 22 20 32 118
Run-Off-Road 18 19 20 27 30 114
Fixed Object 21 17 17 27 31 113
Seat Belt Use (Unbelted) 9 22 12 19 19 81
Horizontal Curves 11 18 13 9 18 69
Impaired 11 16 8 9 18 62
Older Motorists (65+) 11 14 9 12 14 60
Intersection 12 12 8 10 17 59
Unlicensed, Revoked, or Suspended Drivers 12 13 6 6 20 57
Distracted 6 9 8 11 4 38
Large Trucks 5 9 9 5 9 37
Motorcycles/Mopeds 10 3 7 6 8 34
Head-On 4 1 4 5 8 22
Pedestrian 5 4 4 2 4 19

71Towards Zero Deaths, 2018-2022
Figure 70: Clay County, Missouri, Crash Statistics for 2012-2016
Clay County, Missouri
Fatalities and Serious Injuries 2012 2013 2014 2015 2016 Total
Aggressive 81 60 62 58 64 325
Young Motorists (15-24) 77 54 49 50 40 270
Intersection 65 57 41 57 48 268
Fixed Object 57 50 50 42 53 252
Run-Off-Road 54 48 46 37 47 232
Horizontal Curves 33 32 29 29 31 154
Unlicensed, Revoked, or Suspended Drivers 22 27 27 36 31 143
Older Motorists (65+) 30 30 25 26 31 142
Seat Belt Use (Unbelted) 36 20 26 33 24 139
Motorcycles/Mopeds 34 24 20 26 25 129
Impaired 26 13 14 20 17 90
Head-On 20 14 19 14 15 82
Distracted 18 15 19 15 8 75
Large Trucks 8 14 12 11 13 58
Pedestrian 9 10 5 5 11 40
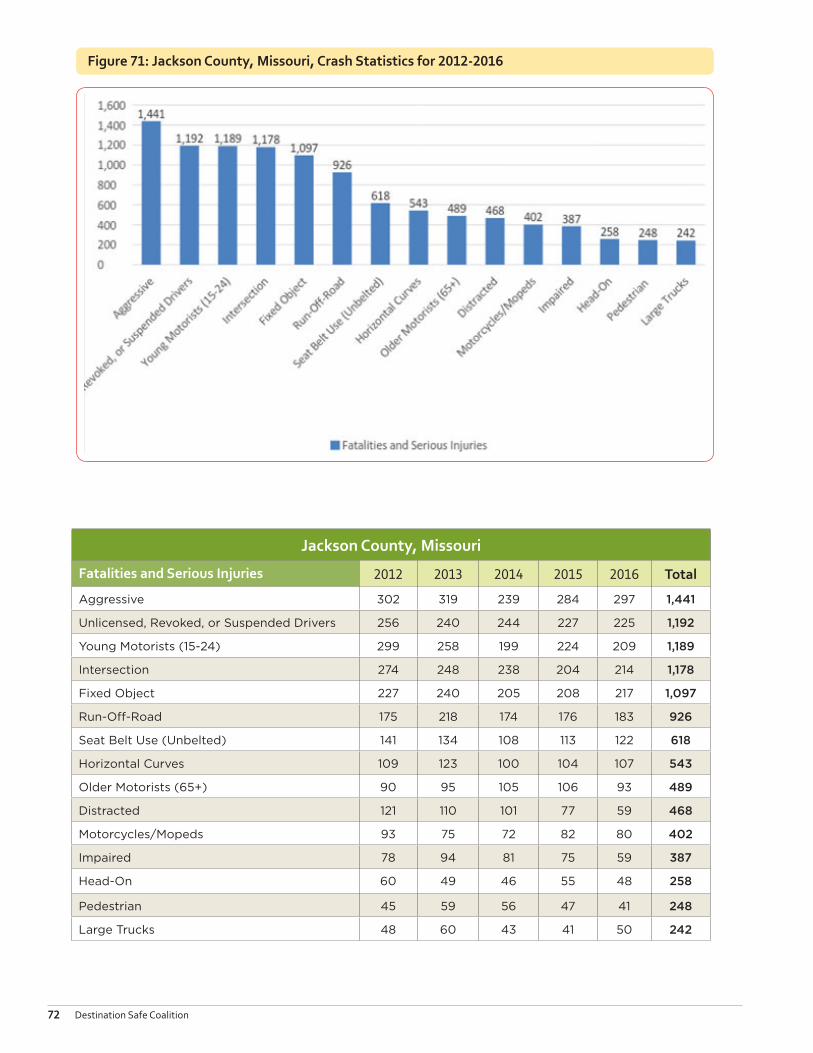
72 Destination Safe Coalition
Figure 71: Jackson County, Missouri, Crash Statistics for 2012-2016
Jackson County, Missouri
Fatalities and Serious Injuries 2012 2013 2014 2015 2016 Total
Aggressive 302 319 239 284 297 1,441
Unlicensed, Revoked, or Suspended Drivers 256 240 244 227 225 1,192
Young Motorists (15-24) 299 258 199 224 209 1,189
Intersection 274 248 238 204 214 1,178
Fixed Object 227 240 205 208 217 1,097
Run-Off-Road 175 218 174 176 183 926
Seat Belt Use (Unbelted) 141 134 108 113 122 618
Horizontal Curves 109 123 100 104 107 543
Older Motorists (65+) 90 95 105 106 93 489
Distracted 121 110 101 77 59 468
Motorcycles/Mopeds 93 75 72 82 80 402
Impaired 78 94 81 75 59 387
Head-On 60 49 46 55 48 258
Pedestrian 45 59 56 47 41 248
Large Trucks 48 60 43 41 50 242

73Towards Zero Deaths, 2018-2022
Figure 72: Johnson County, Missouri, Crash Statistics for 2012-2016
Johnson County, Missouri
Fatalities and Serious Injuries 2012 2013 2014 2015 2016 Total
Fixed Object 25 32 15 40 27 139
Aggressive 25 31 20 31 21 128
Run-Off-Road 18 27 17 33 29 124
Young Motorists (15-24) 21 24 6 30 21 102
Seat Belt Use (Unbelted) 14 19 8 20 17 78
Horizontal Curves 14 10 9 18 17 68
Intersection 14 28 3 10 13 68
Unlicensed, Revoked, or Suspended Drivers 23 12 8 13 7 63
Impaired 13 19 5 6 8 51
Motorcycles/Mopeds 10 6 7 8 8 39
Older Motorists (65+) 7 8 3 6 10 34
Distracted 6 9 4 1 8 28
Head-On 6 3 1 3 3 16
Large Trucks 1 5 3 2 5 16
Pedestrian 3 2 1 5 0 11

74 Destination Safe Coalition
Figure 73: Lafayette County, Missouri, Crash Statistics for 2012-2016
Lafayette County, Missouri
Fatalities and Serious Injuries 2012 2013 2014 2015 2016 Total
Aggressive 27 20 25 31 19 122
Run-Off-Road 26 23 19 30 13 111
Fixed Object 21 20 19 33 11 104
Seat Belt Use (Unbelted) 17 11 12 21 9 70
Young Motorists (15-24) 12 11 18 14 6 61
Horizontal Curves 13 12 9 9 9 52
Unlicensed, Revoked, or Suspended Drivers 7 8 8 8 5 36
Impaired 5 5 5 15 3 33
Intersection 8 5 1 9 3 26
Older Motorists (65+) 8 4 3 8 3 26
Large Trucks 4 4 3 5 2 18
Motorcycles/Mopeds 3 4 2 2 5 16
Distracted 7 2 3 1 0 13
Head-On 5 3 2 0 1 11
Pedestrian 2 5 1 1 0 9

75Towards Zero Deaths, 2018-2022
Figure 74: Pettis County, Missouri, Crash Statistics for 2012-2016
Pettis County, Missouri
Fatalities and Serious Injuries 2012 2013 2014 2015 2016 Total
Fixed Object 18 20 33 24 14 109
Aggressive 20 17 23 23 17 100
Run-Off-Road 18 19 26 21 13 97
Young Motorists (15-24) 12 16 18 19 18 83
Seat Belt Use (Unbelted) 16 11 28 12 15 82
Intersection 8 7 14 15 9 53
Unlicensed, Revoked, or Suspended Drivers 11 11 5 8 17 52
Distracted 14 6 16 5 8 49
Impaired 8 9 14 7 8 46
Horizontal Curves 7 6 10 12 9 44
Older Motorists (65+) 2 7 9 12 10 40
Large Trucks 4 2 5 9 9 29
Motorcycles/Mopeds 7 6 3 5 5 26
Head-On 7 3 7 0 9 26
Pedestrian 1 5 0 4 1 11

76 Destination Safe Coalition
Figure 75: Platte County, Missouri, Crash Statistics for 2012-2016
Platte County, Missouri
Fatalities and Serious Injuries 2012 2013 2014 2015 2016 Total
Fixed Object 29 34 28 23 29 143
Run-Off-Road 25 30 24 22 37 138
Aggressive 27 31 17 24 25 124
Horizontal Curves 21 17 14 19 18 89
Young Motorists (15-24) 21 16 9 12 20 78
Unlicensed, Revoked, or Suspended Drivers 20 19 13 8 13 73
Seat Belt Use (Unbelted) 12 12 9 9 19 61
Motorcycles/Mopeds 9 10 10 10 13 52
Impaired 10 11 6 9 9 45
Intersection 5 5 8 9 7 34
Distracted 5 7 1 3 12 28
Head-On 13 3 5 1 6 28
Large Trucks 2 9 6 2 9 28
Older Motorists (65+) 3 8 3 7 6 27
Pedestrian 3 3 4 3 1 14

77Towards Zero Deaths, 2018-2022
Figure 76: Ray County, Missouri, Crash Statistics for 2012-2016
Ray County, Missouri
Fatalities and Serious Injuries 2012 2013 2014 2015 2016 Total
Aggressive 5 2 15 11 15 48
Run-Off-Road 7 3 10 9 11 40
Fixed Object 8 3 9 9 11 40
Seat Belt Use (Unbelted) 6 5 7 7 5 30
Young Motorists (15-24) 5 3 7 6 8 29
Impaired 5 2 5 6 6 24
Horizontal Curves 3 1 6 4 6 20
Distracted 3 2 7 2 3 17
Intersection 1 1 6 5 3 16
Motorcycles/Mopeds 0 1 5 2 3 11
Unlicensed, Revoked, or Suspended Drivers 3 1 3 2 0 9
Older Motorists (65+) 1 1 3 3 0 8
Head-On 3 4 0 0 0 7
Large Trucks 0 0 3 1 2 6
Pedestrian 1 0 0 1 3 5

78 Destination Safe Coalition
Figure 77: Saline County, Missouri, Crash Statistics for 2012-2016
Saline County, Missouri
Fatalities and Serious Injuries 2012 2013 2014 2015 2016 Total
Aggressive 11 19 18 13 3 64
Fixed Object 12 13 17 9 12 63
Run-Off-Road 10 17 16 7 11 61
Seat Belt Use (Unbelted) 5 13 13 5 8 44
Young Motorists (15-24) 6 9 16 5 7 43
Horizontal Curves 5 5 12 4 6 32
Impaired 7 6 3 3 2 21
Distracted 6 9 3 2 0 20
Large Trucks 4 0 8 6 1 19
Intersection 1 2 7 4 4 18
Unlicensed, Revoked, or Suspended Drivers 7 3 1 4 1 16
Older Motorists (65+) 0 3 3 3 4 13
Motorcycles/Mopeds 4 1 1 4 1 11
Head-On 2 3 3 0 0 8
Pedestrian 2 2 0 1 0 5

79Towards Zero Deaths, 2018-2022
100 VMT 100 million vehicle miles traveled
Four Es Education, Engineering, Enforcement, Emergency Services
AAA American Automobile Association
APWA American Public Works Association
BAC Blood alcohol content
BPAC MARC’s Bicycle-Pedestrian Advisory Committee
CA Cass County, Missouri
CDL Commercial Driver’s License
CL Clay County, Missouri
CMV Commercial Motor Vehicles
CPST Child Passenger Safety Technician
DMV Department of Motor Vehicles
DWI Driving While Intoxicated
EMS Emergency Medical Services
FARS Fatality Analysis Reporting System
FHWA Federal Highway Administration
FMCSA Federal Motor Carriers Safety Administration
FTA Federal Transit Administration
GDL Graduated Drivers License
GIS Geographic Information System
GTI MARC’s Government Training Institute
HMV Hazardous Moving Violation
ITS Intelligent Transportation System
JA Jackson County, Missouri
JCT Johnson County Transit (The JO)
JO Johnson County, Kansas or Johnson County, Missouri
KCATA Kansas City Area Transportation Authority (The Metro)
KCITE Institute of Transportation Engineers — Kansas City Chapter
KC Scout Kansas City Scout
KDOT Kansas Department of Transportation
KHP Kansas Highway Patrol
Ks/Kan. Kansas
LA Lafayette County, Missouri
LETSACLaw Enforcement Traffic Safety Advisory Council
LRTP Long-Range Transportation Plan
LV Leavenworth County, Kan.
MARC Mid-America Regional Council
MAP-21 Moving Ahead for Progress in the 21st Century
Appendix B: Acronyms and Abbreviations

80 Destination Safe Coalition
MEMC MARC’s Metropolitan Emergency Managers Committee
MI Miami County, Kansas
MO/Mo. Missouri
MoDOT Missouri Department of Transportation
MSHP Missouri State Highway Patrol
NCHRP National Cooperative Highway Research Program
NHTSA National Highway Traffic Safety Administration
NTD National Transit Database
OGL Operation Green Light
OL Operation Lifesaver
OOIDA Owner Operator Independent Drivers Association
PD Police Department
PTRPC Pioneer Trails Regional Planning Commission
PE Pettis County, Missouri
PL Platte County, Missouri
RA Ray County, Missouri
RPC Regional planning commission/council
RSA Road safety assessment
SA Saline County, Missouri
Safe Kids Safe Kids Johnson County and Safe Kids Metro KC
SHC Safety and Health Council of Western Missouri and Kansas
SHSP Strategic Highway Safety Plan
SIDNE Simulated Impaired Driving Experience
SRTS Safe Routes to School
S.T.E.P. State Traffic Enforcement Program
TRCC Traffic Records Coordinating Committee
TSP Transportation Safety Planning
TTPC MARC’s Total Transportation Policy Committee
UG Transit Unified Government of Wyandotte County/Kansas City, Kan., Transit
VMT Vehicle Miles Traveled
WY Wyandotte County, Kansas
YRBS Youth Risk Behavior System
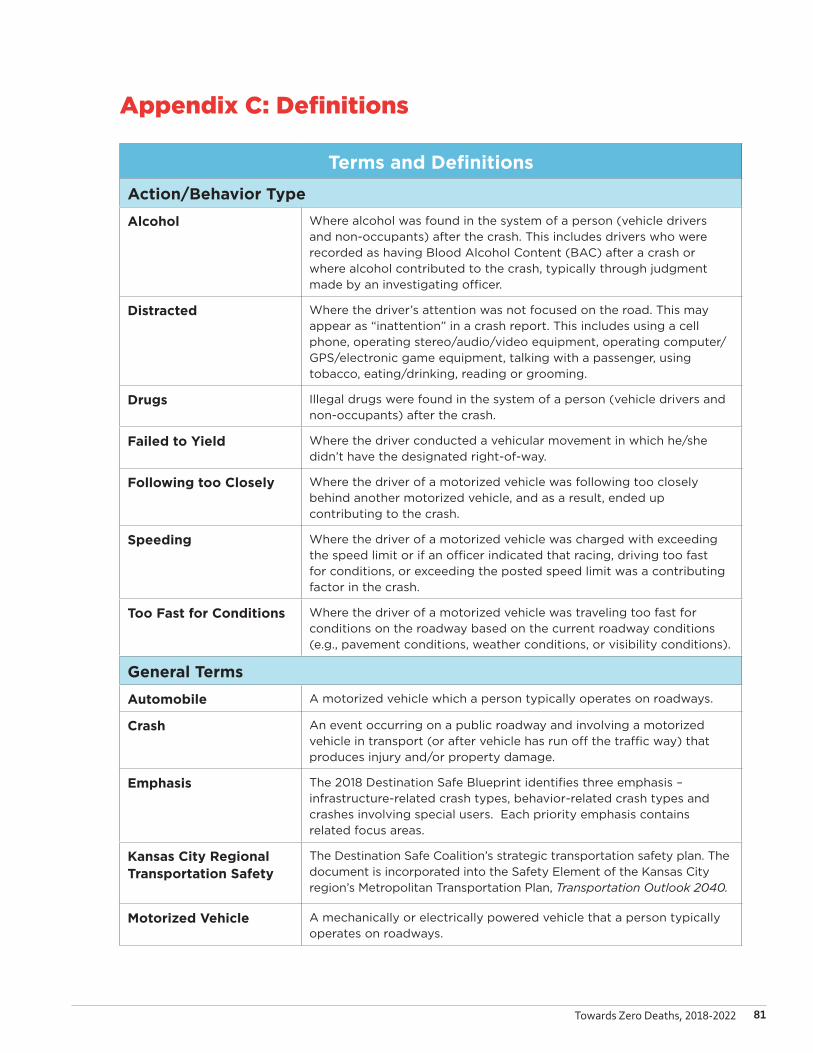
81Towards Zero Deaths, 2018-2022
Appendix C: Definitions
Terms and Definitions
Action/Behavior Type
Alcohol Where alcohol was found in the system of a person (vehicle drivers and non-occupants) after the crash. This includes drivers who were recorded as having Blood Alcohol Content (BAC) after a crash or where alcohol contributed to the crash, typically through judgment made by an investigating officer.
Distracted Where the driver’s attention was not focused on the road. This may appear as “inattention” in a crash report. This includes using a cell phone, operating stereo/audio/video equipment, operating computer/GPS/electronic game equipment, talking with a passenger, using tobacco, eating/drinking, reading or grooming.
Drugs Illegal drugs were found in the system of a person (vehicle drivers and non-occupants) after the crash.
Failed to Yield Where the driver conducted a vehicular movement in which he/she didn’t have the designated right-of-way.
Following too Closely Where the driver of a motorized vehicle was following too closely behind another motorized vehicle, and as a result, ended up contributing to the crash.
Speeding Where the driver of a motorized vehicle was charged with exceeding the speed limit or if an officer indicated that racing, driving too fast for conditions, or exceeding the posted speed limit was a contributing factor in the crash.
Too Fast for Conditions Where the driver of a motorized vehicle was traveling too fast for conditions on the roadway based on the current roadway conditions (e.g., pavement conditions, weather conditions, or visibility conditions).
General Terms
Automobile A motorized vehicle which a person typically operates on roadways.
Crash An event occurring on a public roadway and involving a motorized vehicle in transport (or after vehicle has run off the traffic way) that produces injury and/or property damage.
Emphasis The 2018 Destination Safe Blueprint identifies three emphasis – infrastructure-related crash types, behavior-related crash types and crashes involving special users. Each priority emphasis contains related focus areas.
Kansas City Regional Transportation Safety
The Destination Safe Coalition’s strategic transportation safety plan. The document is incorporated into the Safety Element of the Kansas City region’s Metropolitan Transportation Plan, Transportation Outlook 2040.
Motorized Vehicle A mechanically or electrically powered vehicle that a person typically operates on roadways.

82 Destination Safe Coalition
Terms and Definitions
Primary Safety Belt Law A law that permits law enforcement officials to ticket unrestrained motorists without another traffic offense taking place.
Region A geographic area defined by physical or human characteristics.
Restraint Device A device, such as a safety belt or car seat, that’s used to secure an occupant of a motorized vehicle against harmful movement that may result during a crash or sudden stop.
Secondary Safety Belt Law
A law that permits law enforcement officials to ticket unrestrained motorists only while stopped for other traffic citations/violations such as speeding.
Injury Type
Serious Injury Any nonfatal injury which prevents the injured person from walking, driving or continuing normal activities the person was capable of performing prior to the crash. Disabling injuries are commonly referred to as serious injuries.
Fatality Death to a person (resulting from crash-related injuries) occurring within 30 days of the crash.
Organizations
Destination Safe Coalition
A partnership of local agencies and various community sectors (e.g., law enforcement, engineers, safety advocates, public health officials, citizens, trauma room nurses, transit coordinators, public works managers, emergency services providers, bicycle/pedestrian advocates, local officials, planners and others) involved in improving transportation system safety in the Kansas City region.
Kansas Department of Transportation
A state government organization in charge of maintaining public roadways of the state of Kansas.
Mid-America Regional Council
A nonprofit association of city and county governments and the metropolitan planning organization (MPO) for the bistate Kansas City region. MARC provides transportation-planning services for eight counties — Johnson, Leavenworth Miami and Wyandotte in Kansas; and Cass, Clay, Jackson and Platte in Missouri. MARC serves as the regional planning commission (RPC) for Ray County in Missouri.
Missouri Coalition for Roadway Safety
A partnership of safety advocates in the state of Missouri who focus on creating safer roads, reducing traffic fatalities, and addressing traffic crashes through their Blueprint to SAVE MORE LIVES guide. Organizations include law enforcement, educators, emergency responders and engineers.
Missouri Department of Transportation
A state government organization in charge of maintaining public roadways of the state of Missouri.
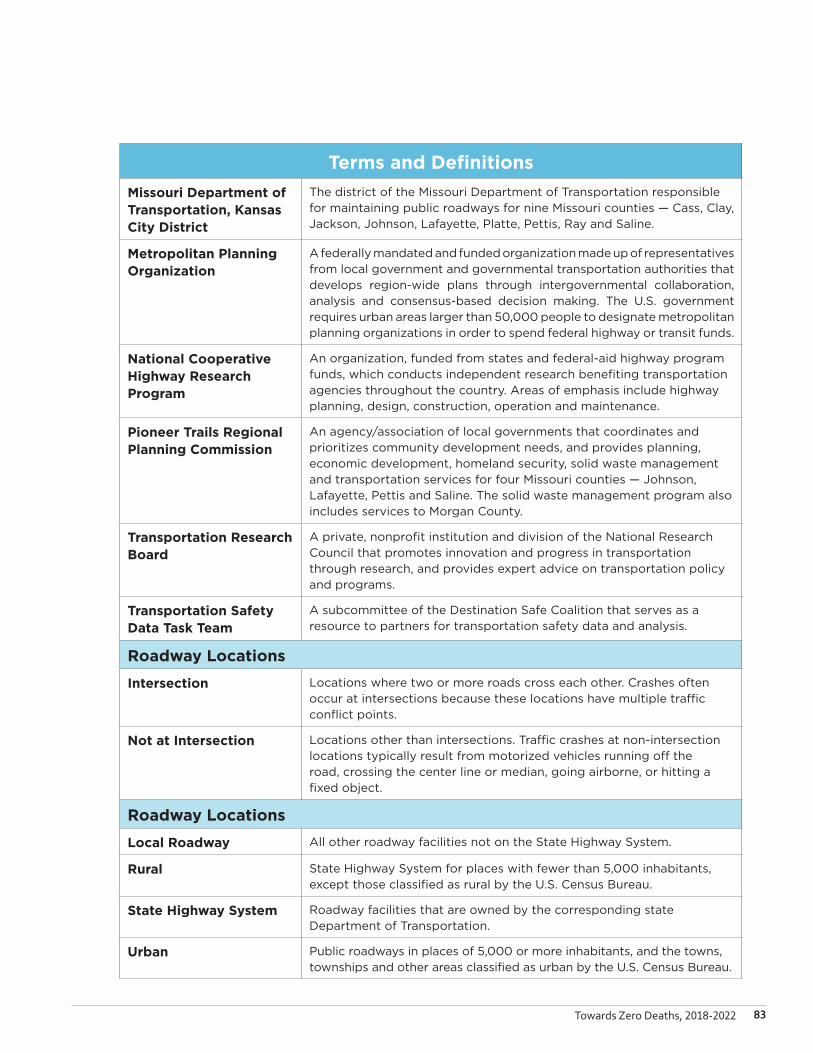
83Towards Zero Deaths, 2018-2022
Terms and Definitions
Missouri Department of Transportation, Kansas City District
The district of the Missouri Department of Transportation responsible for maintaining public roadways for nine Missouri counties — Cass, Clay, Jackson, Johnson, Lafayette, Platte, Pettis, Ray and Saline.
Metropolitan Planning Organization
A federally mandated and funded organization made up of representatives from local government and governmental transportation authorities that develops region-wide plans through intergovernmental collaboration, analysis and consensus-based decision making. The U.S. government requires urban areas larger than 50,000 people to designate metropolitan planning organizations in order to spend federal highway or transit funds.
National Cooperative Highway Research Program
An organization, funded from states and federal-aid highway program funds, which conducts independent research benefiting transportation agencies throughout the country. Areas of emphasis include highway planning, design, construction, operation and maintenance.
Pioneer Trails Regional Planning Commission
An agency/association of local governments that coordinates and prioritizes community development needs, and provides planning, economic development, homeland security, solid waste management and transportation services for four Missouri counties — Johnson, Lafayette, Pettis and Saline. The solid waste management program also includes services to Morgan County.
Transportation Research Board
A private, nonprofit institution and division of the National Research Council that promotes innovation and progress in transportation through research, and provides expert advice on transportation policy and programs.
Transportation Safety Data Task Team
A subcommittee of the Destination Safe Coalition that serves as a resource to partners for transportation safety data and analysis.
Roadway Locations
Intersection Locations where two or more roads cross each other. Crashes often occur at intersections because these locations have multiple traffic conflict points.
Not at Intersection Locations other than intersections. Traffic crashes at non-intersection locations typically result from motorized vehicles running off the road, crossing the center line or median, going airborne, or hitting a fixed object.
Roadway Locations
Local Roadway All other roadway facilities not on the State Highway System.
Rural State Highway System for places with fewer than 5,000 inhabitants, except those classified as rural by the U.S. Census Bureau.
State Highway System Roadway facilities that are owned by the corresponding state Department of Transportation.
Urban Public roadways in places of 5,000 or more inhabitants, and the towns, townships and other areas classified as urban by the U.S. Census Bureau.

84 Destination Safe Coalition
Terms and Definitions
User Type
Aggressive Driver A driver operating a motorized vehicle in an aggressive, antagonistic, selfish, pushy or impatient manner — often unsafely — that directly affects other drivers. This includes traffic crashes where the reporting officer indicated exceeding the posted speed limit, driving too fast for conditions, and/or following other vehicles too closely as a contributing factor in the crash.
Impaired Driver A driver who is under the influence of alcohol and/or other drugs while operating a motorized vehicle. This includes traffic crashes where the reporting officer reported the driver having a blood alcohol concentration (BAC) of 0.08 grams per deciliter (g/dL) or higher, or if the officer felt the use of alcohol and/or other drugs contributed to the crash.
Motorcyclists Transportation users operating a motorcycle, motorized bicycle or moped on roadways.
Pedestrian A non-occupant of motorized vehicles. This includes people who travel on foot or use a wheelchair. A pedestrian can also be a person who intentionally exits a vehicle and then is struck by another vehicle.
Unrestrained Motorist An occupant of a motorized vehicle (driver or passengers) not wearing a safety belt or restraint device.
Youth and Young Adult Motorists
Drivers (ages 15–24 years old) of motorized vehicles.
Vehicle Type
Large Truck A motorized vehicle with a gross vehicle weight rating (GVWR) greater than 10,000 pounds, including single-unit trucks and truck tractors.
Motorcycle A motor vehicle operated on two or three wheels. This includes motorized bicycles and mopeds.
Vehicle Type A series of motor vehicle body types that have been grouped together because of their design similarities.
85Towards Zero Deaths, 2018-2022
Appendix D: Coalition Roles and Responsibilities
Revised and Adopted September 21, 2017
Coalition’s Purpose
The Coalition exists to reduce fatalities and serious injuries resulting from roadway crashes by developing, implementing and enhancing a comprehensive transportation safety blueprint for the bistate Kansas City metro and surrounding rural areas. The Coalition works to achieve performance measure targets identified in the Destination Safe Kansas City Regional Transportation Safety Blueprint (Regional Blueprint).
Our Vision
Together Toward Zero – Destination Safe Coalition partners are working together to create the safest transportation system possible, a region with zero crash related deaths and a culture of safety where, every life counts and one death is too many.
Supporting Strategies:
» Growing and Enduring Partnerships
» Meaningful Safety Analysis and Research
» Strong Public and Private Safety Policy
» Robust Law Enforcement Programs
» Effective Public Education Programs
» Infrastructure and Technology that Support Multi-modal Safety
» Efficient Emergency Response and Traffic Incident Management
» Land Use That Supports Transit Mobility To Reduce VMT
Coalition’s Regional Service Area
The Destination Safe Regional Service Area includes the counties of Johnson, Leavenworth, Miami and Wyandotte in Kansas and Cass, Clay, Jackson, Johnson, Lafayette, Pettis, Platte, Ray and Saline in Missouri.
Open Records and Open Meetings
All meetings of the Leadership Team and Task Teams of the Destination Safe Coalition will comply with open records and open meetings laws in the states of Kansas and Missouri.
Interested individuals, members and non-members, are encouraged to attend and provide input at Leadership Team and Task Team meetings.
Leadership Team Roles & Responsibilities
Leadership Team’s Purpose
The Leadership Team functions as the decision-making body of the Coalition. The Leadership Team will be responsible for developing and adopting a regional blueprint and guiding the annual activities of the Destination Safe Coalition. In addition to these core activities, the Leadership Team will collaborate with area transportation safety partners to coordinate resources.
The Leadership Team reviews applications to fund education and enforcement strategies and programs consistent with the priorities of the Regional Blueprint. They recommend funding based on prioritization of projects to both MoDOT and KDOT authorities.
Leadership Team Membership
In 2003, Destination Safe partners spent a year among transportation engineers and planners to become acquainted with the Kansas City region’s transportation safety partners and build rapport. During this time, the group compiled an inventory of current efforts in the region, and a strong need for regional collaboration among professional
86 Destination Safe Coalition
disciplines conducting transportation safety improvement efforts became evident. In 2004, the Leadership Team was formed to direct efforts of the Destination Safe Coalition.
The initial members of the Leadership Team were selected through several Coalition planning meetings involving local law enforcement, traffic and operations engineers, and transportation planners. More than 250 individuals or organizations were identified as potential Leadership Team members, including local recipients of Section 402 Highway Safety Funds, then the list was narrowed down to approximately 40 organizations. The initial members represent a diverse range of professional backgrounds, safety leadership, geographic influence and urban-rural dynamics across the Kansas City region’s transportation safety spectrum.
Membership on the Leadership Team represents interests that improve surface transportation safety throughout the Kansas City region. Leadership Team members primarily work in the four Es of transportation safety: education, engineering, enforcement, and emergency services, but Leadership Team membership is not restricted to only those four professional areas.
The membership includes local, regional, state and federal representatives from the following professional disciplines or organizations (This list is not considered all-inclusive):
» Ambulance and Emergency Medical Providers
» Bicycle and Pedestrian Safety Organizations
» Commercial Trucking Associations
» Departments of Transportation
» Engineering and Transportation Associations
» Fire Departments
» Highway Patrols
» Hospitals
» Injury Prevention & Trauma Prevention Organizations
» Insurance Companies
» Intelligent Transportation System Operators
» Lawyer Associations
» Law Enforcement Associations
» Police Departments
» Public Works Departments
» Railroad Crossing Safety Organizations
» Regional Planning Councils
» Research and Development Institutions
» Safety Councils
» Sheriff’s Departments
» Transit Providers
» Traffic Incident Management System operators
Leadership Team Membership
Leadership Team membership may change to reflect community needs and transportation safety priorities. Recommendations for new members are brought forth before the Leadership Team for discussion and approval.
Separate membership is encouraged of local and state government subdivisions of responsibility including but not limited to engineering and enforcement authorities. There should be clear distinction of primary work.
Organizations are eligible to request membership after attending three meetings of the Leadership Team in the current fiscal year. Applications must be received two weeks before a scheduled Leadership Team meeting. The application must identify an individual to represent the organization and an alternate. All applications will be presented for approval at a Leadership Team meeting. If approved, the member organization will become part of the Leadership Team with voting rights. Member organizations will retain voting rights provided their designated member or alternate are present at two meetings per fiscal year (July 1 to June 30), beyond the annual programming
87Towards Zero Deaths, 2018-2022
meeting. If a voting member organization loses voting rights, they may be reinstated after attending two additional meetings beyond the programming meeting.
Leadership Team Co-Chairs
The Leadership Team is co-chaired by two members, one representing Kansas and one representing Missouri. The co-chairs shall serve for a period of two years (or longer) and may vote along with the rest of the Leadership Team members.
Nominations for co-chairs will be accepted from the Leadership Team membership. A majority of voting members must be present to select co-chairs.
Leadership Team Voting Procedures
A quorum of eleven (11) voting members of the Leadership Team must be present to adopt or reject any matter. When a quorum is present, a simple majority may adopt or reject any matter brought for a vote before the Leadership Team.
Leadership Team Meetings
Regular Leadership Team meetings will convene bimonthly, as needed, on a date and time to be determined by Leadership Team co-chairs. Agendas of future Leadership Team meetings will be sent out via e-mail before the meeting date.
Operations Managers Roles & Responsibilities
Operations Managers Purpose
The purpose of Operations Managers is to provide technical assistance, records management and expertise to the Leadership Team and Task Teams of the Destination Safe Coalition.
Operations Managers Composition
Operations Managers will consist of one staff member from each of the following organizations:
» Mid-America Regional Council (MARC)
» Kansas Department of Transportation (KDOT)
» Missouri Department of Transportation (MoDOT)
» Pioneer Trails Regional Planning Commission (PTRPC)
Operations Managers Responsibilities
Operations Managers’ responsibilities are outlined in the Roles & Responsibilities of the Destination Safe Coalition by each responsible agency. Although these responsibilities are minimum requirements for the Coalition’s work, additional responsibilities may be needed and should be determined by the Operations Managers and the appropriate management of each agency.
All agencies will perform the following duties:
» Provide a staff contact concerning Coalition needs.
» Attend and participate in Leadership Team meetings when feasible.
» Attend Task Team meetings as needed.
» Recommend Task Team participants and monitor Leadership Team membership.
» Coordinate public information concerning news releases, media advisories and other announcements of the Leadership Team or Task Teams.
» Support efforts of the coalition to secure resources and administer those grants as received.
» Agree on personnel to take summary notes at Leadership Team meetings.
Mid-America Regional Council’s (MARC) responsibilities:
» Compile crash information from KDOT and MoDOT into a regional database.
» Act as a Coalition representative and resource in Kansas and Missouri counties.
» Coordinate the development and implementation of the Destination Safe Kansas City Regional Transportation Safety Blueprint with the Safety Chapter of MARC’s Metropolitan Transportation Plan (MTP).
88 Destination Safe Coalition
» Monitor opportunities to coordinate the Regional Blueprint with Kansas and Missouri’s Strategic Highway Safety Plans (SHSP).
» Maintain contact information of Leadership Team membership and Task Team participants.
» Maintain and update information on the Coalition web page and social media channels as needed. The Operational Managers may approve other Destination Safe partners to lead or share in the responsibility of maintaining and updating social media accounts or website information.
» Maintain a regional calendar of Destination Safe meeting dates accessible via the Internet.
» Send out meeting notices and agendas of the Leadership Team and Task Teams by e-mail.
» Engage the Leadership Team in the identification of state legislative topics concerning transportation safety.
» Maintain a primary file location of meeting agendas and summaries of the Coalition.
» Organize information for Leadership Team and Task Team meetings as needed.
» Issue the Destination Safe call for education and enforcement project applications.
Kansas Department of Transportation’s (KDOT) Responsibilities:
» Provide Kansas crash data as requested by safety partners and public.
» Provide Kansas crash data and analysis as requested by other Operations Managers, Leadership Team members, or Task Team participants for coalition related reports and research.
» Act as a Coalition representative and resource in the Kansas counties.
» Coordinate the development and implementation of the Regional Blueprint with the Kansas Strategic Highway Safety Plan (SHSP).
» Maintain a primary file location containing paperwork and forms regarding the allocation of Kansas 402 funding of Destination Safe partners.
» Organize information for Leadership Team and Task Team meetings as needed.
Missouri Department of Transportation’s (MoDOT) Responsibilities:
» Provide Missouri crash data as requested by safety partners and public.
» Provide Missouri crash data and analysis as requested by other Operations Managers, Leadership Team members, or Task Team participants for coalition related reports and research.
» Act as a Coalition representative and resource in the Missouri counties.
» Coordinate the development and implementation of the Regional Blueprint along with the Missouri Strategic Highway Safety Plan (SHSP).
» Maintain a primary file location containing paperwork and forms regarding the allocation of Missouri’s Blueprint funding.
» Organize information for Leadership Team and Task Team meetings as needed.
Pioneer Trails Regional Planning Commission (PTRPC) Responsibilities:
» Monitor crash information from MoDOT for Johnson, Lafayette, Pettis and Saline counties.
» Act as a Coalition representative and resource for Johnson, Lafayette, Pettis and Saline counties.
» Coordinate the development of the Regional Blueprint in the PTRPC area.
» Monitor opportunities to coordinate the Regional Blueprint with Missouri’s Strategic Highway Safety Plan (SHSP).
» Organize information for Leadership Team and Task Team meetings as needed.
Task Teams Roles & Responsibilities
Task Teams Purpose
The Task Teams of the Destination Safe Coalition will develop and implement strategies that improve transportation safety in the Kansas City region. Specific Task Teams will not be detailed in the Destination Safe Coalition’s Roles & Responsibilities, but Task Teams will be formed and disbanded at the discretion of the Leadership Team’s co-

89Towards Zero Deaths, 2018-2022
chairs. This structure will allow the Coalition to address changing, emerging and high-priority transportation safety problems as needed.
Task Team Membership
There will be no established membership of any Task Team, but it is recommended that Task Teams be composed of an odd number of participants (i.e., three members, five members, etc.). Leadership Team members, Operations Managers and safety partners are encouraged to participate in Task Teams.
Task Team Chair
A Task Team Chair is responsible for guiding a Task Team in developing possible strategies and implementing funded strategies that improve transportation safety in the Kansas City region. A Task Team Chair will regularly update the Leadership Team and Operations Managers on progress, seek assistance from Operations Managers and implement Leadership Team direction and advice.
Task Team Voting Procedures
It is expected that the Task Teams will come to a consensus on issues and strategies to implement, and voting procedures will be used only to decide matters that may stall Task Team efforts. A simple majority may adopt or reject any matter brought for a vote before the Task Team. The Leadership Team must ratify all Task Team decisions, unless the Leadership Team has provided specific direction.
Task Team Meetings
Task Teams will meet at the frequency determined by the Task Team Chair to fulfil their duties.
Amendments of Roles & Responsibilities
These Roles & Responsibilities may be amended at any Leadership Team meeting by a majority vote.

90 Destination Safe Coalition
There are eight supporting strategies adopted by the Leadership Team to further the work of the Destination Safe Coalition. Supporting strategies derive from the Roles and Responsibilities adopted on September 21, 2017. Each strategy expands upon Specific, Measureable, Achievable, Realistic and Timely (SMART) actions for the 2018-2022 Regional Blueprint plan period. This document will be used to guide our work and will be reviewed regularly to evaluate progress.
Eight Supporting Strategies
1. Growing and Enduring Partnerships
Working together, we are able to achieve more. It is important for the health of the Coalition to attract new members, to increase effectiveness at the local and regional level. It is typical for participation in a coalition to ebb and flow. Membership and attendance is one way to measure the health of a coalition. The Coalition maintains membership records for the Leadership Team and determines active or inactive status based on attendance.
Healthy coalitions have a common goal that brings organizations together. Healthily coalitions represent a range organizations and experts. Our Coalition seeks to attract experts from the fields of engineering, education and emergency response. Strong coalitions endure and adapt to change.
Objectives
1.A — Increase the share of active member organizations to 50 percent by the end of 2018, 55 percent by 2019 and 60 percent by 2020. Maintain 60 percent active membership participation or higher.
1.B — Grow the number of active members to 40 or higher by 2022.
2. Meaningful Safety Analysis and Research
Safety analytical work is the foundation of a data-driven decision making process. This work supports decision-makers’ tasked with the allocation and distribution of limited resources. The aim is to make wise use of resources to have the greatest effect to reduce roadway fatalities and serious injuries. This work is part of the problem identification, counter measure selection and evaluation phases of the data-driven process. Setting Safety Performance Measure Targets provides a way to measure progress towards desired outcomes. The primary dataset is crash reports; however, the use of other relevant and trusted datasets should be incorporated for meaningful safety analysis and research to occur. This area of work is continuously evolving to understand fatalities and serious injury crash prevention.
Objectives
2.A — Conduct an in-depth study of the three spotlight areas: intersections, aggressive driving (speeding), youth & young adults per the Regional Blueprint, during the life of the plan 2018-2022.
2.B — Provide Regional Fatality Reports on a quarterly basis, over the life of the plan.
2.C — Develop an Annual Safety Report to address Safety Performance Measure Targets, and to document the work the Destination Safe Coalition.
3. Strong Public and Private Safety Policy
The Destination Safe Coalition is a regional voice for transportation safety in the Greater Kansas City service area defined by 13 Counties, (9 Missouri and 4 Kansas Counties). We provide a forum to address safety policy in both public and private sectors. Active work in these sectors will create a culture of safety that institutionalizes practices affecting daily operations. This change must transcend jurisdictional boundaries.
Appendix E: Coalition Work Plan 2018-2022

91Towards Zero Deaths, 2018-2022
Objectives
3.A — Develop state safety legislative agendas for Missouri and Kansas annually over the life of the plan.
3.B — Encourage local municipalities to adopt a Vision Zero approach with the goal of covering 50 percent of population in the Destination Safe service area by 2022.
3.C — Promulgate model corporate travel policies that promote a culture of safety and monitor the proliferation through 2022.
4. Robust Law Enforcement Programs
Law Enforcement programs are essential to developing and maintaining a culture of safe travel behavior. The National Highway Traffic Safety Administration (NHTSA) reports that 94 percent of all crashes involve human error or behavior as the leading contributing factor. Research by NHTSA has demonstrated that law enforcement campaigns are most effective when combined with public awareness campaigns to create high-visibility exposure.
Objectives
4.A — Encourage law enforcement agencies in the Greater Kansas City area to participate in the Operation Impact program.
4.B — Encourage local law enforcement to apply for funding through the Destination Safe call for projects to fund traffic enforcement.
4.C — Monitor traffic enforcement operations outcomes of Destination Safe generated campaigns.
5. Effective Public Education Programs
The hallmark of an effect education program is a positive change in behavior that creates a culture of safe travel. Strategic programs focus on high-risk demographics such as youth and young adult drivers. Programs focus on behavioral issues to increase safety by: use of safety belts, avoiding aggressive driving, drunk/drugged driving and distracted driving. Additional issues may be included. Public education programs also play an important role in increasing awareness of law enforcement campaigns to maximize effectiveness.
Objectives
5.A — Promote public education programs that target high-risk demographics.
5.B — Promote messages that focus awareness on high-risk travel behaviors.
5.C — Monitor and evaluate educational programs performance measures
6. Infrastructure and Technology that Support Multi-modal Safety
Safe infrastructure design prevents crashes or reduces the severity of crashes using a number of safety principles. Crashes can be avoided by separating travel modes, minimizing exposure and reducing conflict points. The severity of crashes can be achieved by redirecting the angle of impact, by absorbing the force of the collision, or by reducing the speed of a crash. Safety design countermeasures must be evaluated and deployed based a context sensitive approach combined with a data-driven approach. Technology that supports safety is not new. The application of technology such as seat belts, and airbags have had significant safety benefits. The rate of technological advancements has increased making the introduction of autonomous and semi-autonomous vehicles an imminent reality. Many vehicles already on the road use technologies including crash avoidance breaking and lane departure warning systems. Many believe that new technologies will have significant safety benefits by removing human error and risky driving.
Objectives
6.A — Promote complete streets policy and design that support safety design principles. By 2022, 75 percent of the population in the Destination Safe serve area should live in a community that has adopted a Compete Streets Policy.
6.B — Monitor new technologies that support safety over the life of the plan.
6.C — Encourage state legislation and local government ordinances permitting the operation of autonomous driving vehicles.
92 Destination Safe Coalition
7. Efficient Emergency Response and Traffic Incident Management
After a crash has occurred, a quick response is required to prevent deaths and limit additional complications from serious injuries. The goal is to minimize response time after a crash through quick arrival of EMS and transport to the appropriate hospital. Safety professionals refer to this as the “golden hour”. EMS agencies uses a robust system to properly access and route crash victims to appropriate trauma centers according to the MARCER Time Critical Diagnosis Plan. The Kansas City Scout’s Traffic Incident Management (TIM) Program coordinates the resources of public agencies and private sector partners to detect, respond to, and remove traffic incidents to get traffic moving again as safely and quickly as possible. This program establishes protocols for communications, responder roles, responsibilities and procedures. Highly trained law enforcement, EMS and tow truck operators work as a team reach victim(s) while managing traffic to prevent secondary crashes and protect the safety of the responding personnel.
Objectives
7.A — Support the continued TIM Program of Kansas City Scout.
7.B — Support the continued efforts of the MARCER Time Critical Diagnosis Plan for Emergency Medical Service agencies and hospitals in the Greater Kansas City region.
8. Land Use That Supports Transit Mobility To Reduce VMT
Land use has a profound effect on transportation systems and safety. The mix of land use, density of development and proximity of trip origins and destination (O/D) determine the availability of transportation mode options. Low density development induces more auto traffic. This approach requires transportation networks with multiple lanes and high speeds to reduce travel time. The alternative model supports compact, denser land uses that offer mixed land uses were proximity of O/Ds allow for pedestrian, bicycle or transit as viable options. Lower VMT results in safer transportation systems with fewer serious injuries and fatalities. MARC supports cross cutting programs that promote transit oriented development, better transit service, pedestrian and bicycle friendly communities.
Objectives
8.A — Support MARC activity centers and corridors strategy.
8.B — Support the implementation of Smart Moves 3.0m the regional transit vision.
8.C — Support Regional Bikeway System/MetroGreen implementation.

93Towards Zero Deaths, 2018-2022
600 Broadway, Suite 200 • Kansas City, MO 64105-1659
Phone: 816/474-4270 • Fax: 816/421-7758 • www.marc.org
This document is exempt under discovery or admission under 23 USC § 409. The collection of safety
data in the Kansas City region is encouraged to actively address safety issues on regional, local and
site-specific levels. Congress has enacted a law, 23 USC § 409, which prohibits the discovery or admission
of crash and safety data from being admitted into evidence in a federal or state court proceeding. This
document contains wording, charts, tables, graphs, lists and diagrams for the purpose of identifying
and evaluating safety enhancements in the Kansas City region. These materials are protected under
23 USC § 409. Congress’ rationale behind 23 USC § 409 is that safety data is compiled and collected to help
prevent future crashes, injuries and deaths on our nation’s transportation system.