To my mother and my father… - unina.itwpage.unina.it/danilo.ciliberti/doc/Bochicchio.pdf ·...
78
Wind tunnel tests of a modular aircraft model Candidate: Nicola Bochicchio (matr.517/985) Pag. | 1 To my mother and my father…
Transcript of To my mother and my father… - unina.itwpage.unina.it/danilo.ciliberti/doc/Bochicchio.pdf ·...
Wind tunnel tests of a modular aircraft model
Candidate: Nicola Bochicchio (matr.517/985) Pag. | 1
To my mother and my father…

Wind tunnel tests of a modular aircraft model
Candidate: Nicola Bochicchio (matr.517/985) Pag. | 2
INDEX
FIGURE INDEX ............................................................................................................... 4
TABLE INDEX ................................................................................................................. 7
CHAPTER 1 - INTRODUCTION ......................................................................................... 8
1.1 Overview on the directional stability and scope of the work ........................... 8
1.2 Advantages of a modular model ..................................................................... 16
1.3 The problem of the minimum control speed ................................................... 18
CHAPTER 2 - THE EXPERIMENTAL MODULAR MODEL .................................................. 22
2.1 Introduction to the model ................................................................................ 22
2.2 Wing ................................................................................................................ 26
2.3 Fuselage nose .................................................................................................. 26
2.4 Fuselage cabin ................................................................................................. 28
2.5 Vertical tail ...................................................................................................... 28
2.6 Fuselage tail-cone ........................................................................................... 30
2.7 Horizontal tail ................................................................................................. 32
2.8 Other small components ................................................................................. 32
CHAPTER 3 - APPROACH TO WIND TUNNEL TESTING ................................................... 34
3.1 Introduction .................................................................................................... 34
3.2 Wind tunnel of the DII ................................................................................... 36
3.3 Instrumentation .............................................................................................. 39
3.3.1 Measurement instrumentation .................................................................. 39
3.3.2 Control instrumentation ........................................................................... 42
3.3.3 Acquisition and elaboration ..................................................................... 42
3.4 Setup issues .................................................................................................... 44

Wind tunnel tests of a modular aircraft model
Candidate: Nicola Bochicchio (matr.517/985) Pag. | 3
3.4.1 Center of gravity location ........................................................................ 44
3.4.2 Stiffening of the sting .............................................................................. 45
3.5 Setup of the wind tunnel ................................................................................. 47
3.5.1 Verification of the balance readings ......................................................... 47
3.5.2 Scale effect and trip strips ......................................................................... 50
3.6 Wind tunnel corrections .................................................................................. 51
CHAPTER 4 - WIND TUNNEL TESTS .............................................................................. 53
4.1 Reference system ............................................................................................ 53
4.2 Test procedure ................................................................................................. 54
4.1.1 Setup of the configuration ......................................................................... 54
4.1.2 Data acquisition ........................................................................................ 54
4.1.3 Data elaboration and storage ..................................................................... 55
4.3 The experimental tests campaign .................................................................... 57
4.3.1 Preliminary tests ....................................................................................... 57
4.3.2 Configurations results ............................................................................... 58
4.3.3 Mutual aerodynamic interference effect ................................................... 69
REFERENCES ................................................................................................................ 77
ACKNOWLEDGEMENT/RINGRAZIAMENTI ..................................................................... 78

Wind tunnel tests of a modular aircraft model
Candidate: Nicola Bochicchio (matr.517/985) Pag. | 4
FIGURE INDEX
Fig 1. 1 – Asymmetric flight notation and the straight slip ......................................... 8
Fig 1. 2 – A body of revolution in potential flow t angle of attack ........................... 11
Fig 1. 3 – Yawing moment of vertical tail ................................................................. 11
Fig 1. 4 - Principal geometric parameter ................................................................... 12
Fig 1. 5 – Typical regional turboprop aircraft ........................................................... 15
Fig 1. 6 – Layout of configurations investigated ....................................................... 16
Fig 1. 7 – Some configurations .................................................................................. 17
Fig 1. 8 – Example of aircraft vertical tail ................................................................. 18
Fig 1. 9 – Most important forces and moments acting on the airplane while using the
rudder to counteract the asymmetric thrust and while keeping the wing level. ......... 19
Fig 1. 10 – Yaw moment due to asymmetric power .................................................. 20
Fig 1. 11 - Chart to preliminary select the vertical tail area Sv according to airborne
minimum control speed limit ..................................................................................... 21
Fig 2. 1 – Model main dimensions (units in mm) ...................................................... 23
Fig 2. 2 – Model exploded view. The markings correspond to the items of Tab 2.1 23
Fig 2. 3 – Sanded parts ............................................................................................... 25
Fig 2. 4 – Metals parts ............................................................................................... 25
Fig 2. 5 - Wing ........................................................................................................... 25
Fig 2. 6 – Fuselage nose: (a) CAD image; (b) manufactured component ................ 27
Fig 2. 7 – Fuselage cabin ........................................................................................... 27
Fig 2. 8 – Two covers Fig 2. 9 – Countersunk to keep wing in high/low position ... 27
Fig 2. 10 - (a) Vertical tails comparison (ARv=1 - 1.5 - 2); (b) Vertical plate. ......... 29
Fig 2. 11 – (a) Fuselage tail cones; (b) Sterns of the tail cones ................................. 29
Fig 2. 12 - ftc fz r parameter .................................................................................. 31
Fig 2. 13 – Vertical tail assembly with load cell ....................................................... 31
Fig 2. 14 – Loads path with the vertical tail load cell ................................................ 31
Fig 2. 15 – Horizontal tail: (A) Body mounted; (B) Tail mounted ............................ 33
Fig 2. 16 – Covers aluminium sheets ......................................................................... 33

Wind tunnel tests of a modular aircraft model
Candidate: Nicola Bochicchio (matr.517/985) Pag. | 5
Fig 2. 17 – Iron interface plate ................................................................................... 33
Fig 2. 18 – Tail-cone stern fillet ................................................................................ 33
Fig 3. 1 - Main subsonic wind tunnel facility ............................................................ 36
Fig 3. 2 - Plane form and geometric dimensions of the DII’s wind tunnel facility ... 37
Fig 3. 3 - Lateral directional strain gage balance ....................................................... 40
Fig 3. 4 - The off-center load cell .............................................................................. 40
Fig 3. 5 - Inclinometer ............................................................................................... 40
Fig 3. 6 – Potentiometer ............................................................................................. 43
Fig 3. 7 – Sideslip mechanism ................................................................................... 43
Fig 3. 8 – Spartan system 16 channels ....................................................................... 43
Fig 3. 9 - Model with lead cylinder in the fuselage nose ........................................... 46
Fig 3. 10 - Sting stiffened ......................................................................................... 46
Fig 3. 11 – Test of the off-center load cell ................................................................. 49
Fig 3. 12 – Flow visualization on vertical tail ........................................................... 49
Fig 3. 13 – Flow visualization on wing ..................................................................... 49
Fig 4. 1 – Reference system ....................................................................................... 53
Fig 4. 2 – Location of the reference point .................................................................. 56
Fig 4. 3 – Preliminary tests (Trip strips) .................................................................... 57
Fig 4. 4 – Positions of the horizontal plane. .............................................................. 59
Fig 4. 5 – BH_WH_V20_H5 configuration ............................................................... 59
Fig 4. 6 – a) BH; b) BH_V15; c) BH_V15_H1 ....................................................... 62
Fig 4. 7 – CN versus β ............................................................................................... 63
Fig 4. 8 – CN_vertical versus β ................................................................................. 63
Fig 4. 9 – Croll versus β ............................................................................................. 64
Fig 4. 10 - BH_WH_V15_H1 .................................................................................... 65
Fig 4. 11 - BH_WL_V15_H1 .................................................................................... 65
Fig 4. 12 – CN versus β for indicated configurations ................................................ 66
Fig 4. 13 – CN_v for indicated configurations .......................................................... 66
Fig 4. 14 . Croll versus β for indicated configurations .............................................. 67
Wind tunnel tests of a modular aircraft model
Candidate: Nicola Bochicchio (matr.517/985) Pag. | 6
Fig 4. 15 – Effect of wing position respect the fuselage in sideslip conditions ......... 67
Fig 4. 16 – Effect of the wing position on the CN ..................................................... 68
Fig 4. 17 – Effect of the wing position on the Croll .................................................. 68
Fig 4. 18 – BH_V10 ................................................................................................... 69
Fig 4. 19 – BH_V15 ................................................................................................... 69
Fig 4. 20 – BH_V20 ................................................................................................... 70
Fig 4. 21 – CN_beta and Croll_beta versus ARv ...................................................... 71
Fig 4. 22 – Interference factors .................................................................................. 71
Fig 4. 23 – bv/dfv ........................................................................................................ 72
Fig 4. 24 – Lift curve slope of the isolated vertical tailplane .................................... 72
Fig 4. 25 – Example of WBV configuration with high wing .................................... 73
Fig 4. 26 – Example of WBV configuration with low wing ...................................... 73
Fig 4. 27 – Effect wing position on CNβ ................................................................... 74
Fig 4. 28 - Effect wing position on CNβv .................................................................... 74
Fig 4. 29 - h
v
zb
parameter .................................................................................... 75
Fig 4. 30 – Empennage configurations ...................................................................... 75
Fig 4. 31 – Aerodynamic interference factor due to the horizontal stabilizer on the
vertical tailplane. (High wing) ................................................................................... 76
Fig 4. 32 – Aerodynamic interference factor due to the horizontal stabilizer on the
vertical tailplane. (Low wing) .................................................................................... 76

Wind tunnel tests of a modular aircraft model
Candidate: Nicola Bochicchio (matr.517/985) Pag. | 7
TABLE INDEX
Tab. 1. 1 – Large turboprop aircraft main characteristics .......................................... 14
Tab. 2. 1 – Bill of materials. Surface and volume are reported only for the machined
components. ............................................................................................................... 24
Tab. 2. 2 – Prolab 65 properties. ................................................................................ 24
Tab. 2. 3 - Wing’s characteristics .............................................................................. 26
Tab. 2. 4 – Dimensions of the fuselage components ................................................. 26
Tab. 2. 5 – Dimensions of the lifting surface of the model. ...................................... 28
Tab 3. 1 – Wind tunnel of the DII, main characteristics ............................................ 36
Tab 3. 2 - Estimation of pitching moment contributes of weight and lift .................. 46
Wind tunnel tests of a modular aircraft model
Candidate: Nicola Bochicchio (matr.517/985) Pag. | 8
CHAPTER 1 - INTRODUCTION
1.1 OVERVIEW ON THE DIRECTIONAL STABILITY AND SCOPE
OF THE WORK
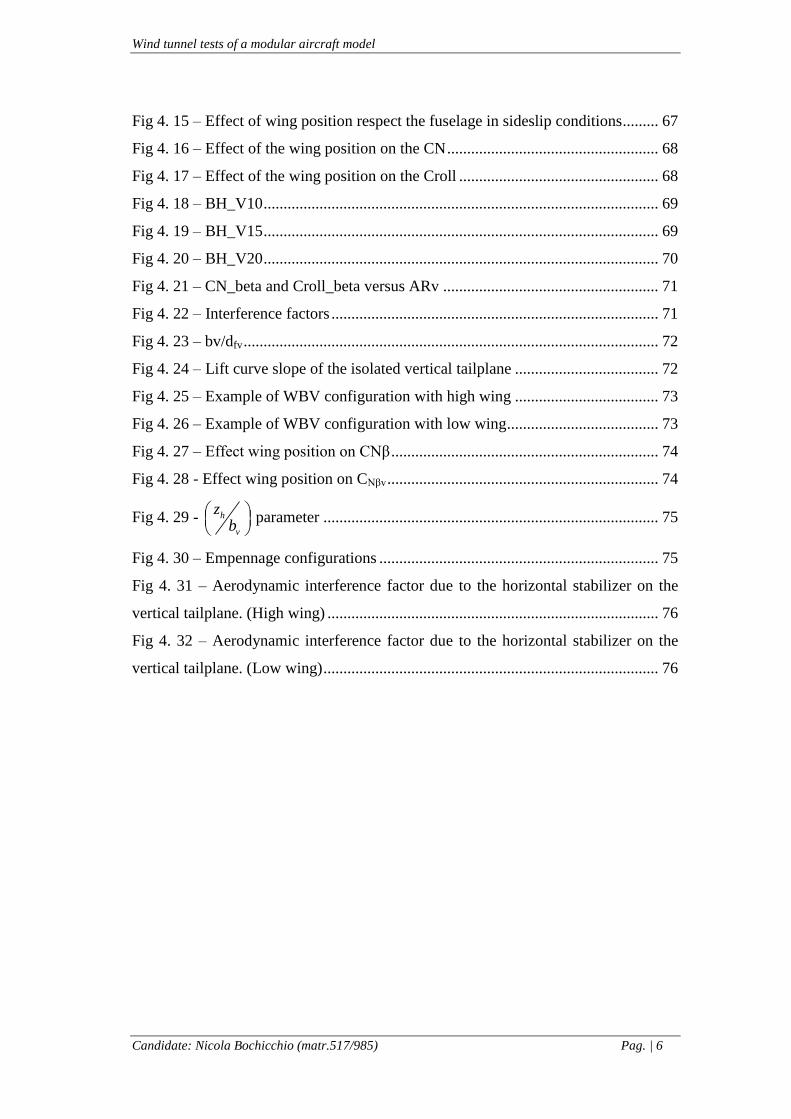
In order to investigate the characteristics of an airplane it is necessary to
consider the case when its flight path no longer lies in the plane of symmetry. This
means that, as shown in Fig. 1.1, the relative wind will be making some angle to the
airplane's center line. This angle is called the angle of sideslip β and it is assumed to
be positive in sign when the relative wind strikes on the right of the pilot.
Fig 1. 1 – Asymmetric flight notation and the straight slip
The angle of sideslip, β, is equal to 1sin ( )v V
or for the small angles encountered in
normal flight ( )v V . It should be noted that, for the curved flight paths shown,
the angle of yaw, ψ, is defined as the angular displacement of the airplane's center
line from some azimuth direction taken as zero at some given instant of time, and ψ
does not equal β. For instance in a 360-degree turn the airplane has yawed 360

Wind tunnel tests of a modular aircraft model
Candidate: Nicola Bochicchio (matr.517/985) Pag. | 9
degrees, but may have had no sideslip during the entire maneuver. For sideslips
during which a straight path is maintained, the angle of yaw, ψ, is equal in magnitude
but apposite in sign to the angle of sideslip, β. Considerable confusion has arisen
because of the misunderstanding of the terms yaw and sideslip. In most cases
the term yaw is used to define the angle of the relative wind to the plane of
symmetry, which although incorrect in certain phases of the problem is perfectly
permissible if the straight flight path conditions are maintained (Ref. [1]).
The static directional stability of the airplane is its tendency to develop
restoring moments when disturbed from its equilibrium angle of sideslip, usually
taken as zero. The static problem, then, is the study of the airplane's yawing
moments developed because of sideslip, to see if the yawing moment so
developed will tend to reduce the sideslip or increase it. The static directional
stability can be developed as was the static longitudinal stability, by summing up
the stability contributions of the component parts of the airplane. Each of these
components produces yawing moments when flying at angles of sideslip, and the
study of the variation of the total yawing moment with angle of sideslip gives the
magnitude of the directional stability.
As it has been done in all other phases of aerodynamics the yawing moment
coefficient will be discussed instead of the dimensional yawing moment. The
coefficient is obtained by dividing the yawing moment by the dynamic pressure
q, the wing area S and the wing span b:
N
NC
q S b
The directional stability of the airplane can be assessed if a curve of yawing
moment coefficient CN with β is obtained for any given airplane. A positive slope
of this curve is required for static directional stability. The derivation NdC d
will be given in the short-hand notation NC
and will be given per degree.
The desirable level of directional stability in terms of the criterion NC
, is very
difficult to express in general terms. There have been practically no cases
Wind tunnel tests of a modular aircraft model
Candidate: Nicola Bochicchio (matr.517/985) Pag. | 10
reported of airplanes having too much directional stability. For normal airplane
configurations directional stability levels of NC
between .0015 deg-1
and .0020
deg-1
have been considered good, with NC
=0.0005 deg-1
a lower limit [1]. As
mentioned above, in order to obtain the final variation analytically, the magnitude
of the contributions from the major components must be developed analytically and
then summed up.
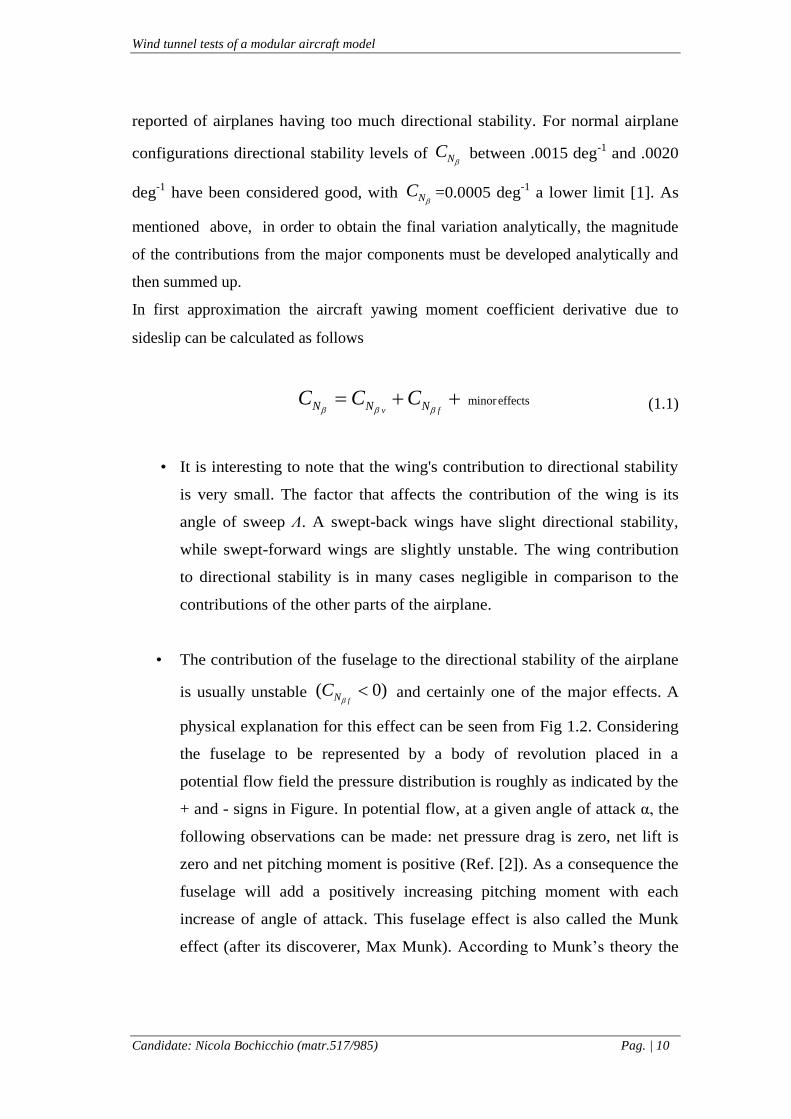
In first approximation the aircraft yawing moment coefficient derivative due to
sideslip can be calculated as follows
minoreffectsv fN N NC C C
(1.1)
• It is interesting to note that the wing's contribution to directional stability
is very small. The factor that affects the contribution of the wing is its
angle of sweep Λ. A swept-back wings have slight directional stability,
while swept-forward wings are slightly unstable. The wing contribution
to directional stability is in many cases negligible in comparison to the
contributions of the other parts of the airplane.
• The contribution of the fuselage to the directional stability of the airplane
is usually unstable ( 0)fNC
and certainly one of the major effects. A
physical explanation for this effect can be seen from Fig 1.2. Considering
the fuselage to be represented by a body of revolution placed in a
potential flow field the pressure distribution is roughly as indicated by the
+ and - signs in Figure. In potential flow, at a given angle of attack α, the
following observations can be made: net pressure drag is zero, net lift is
zero and net pitching moment is positive (Ref. [2]). As a consequence the
fuselage will add a positively increasing pitching moment with each
increase of angle of attack. This fuselage effect is also called the Munk
effect (after its discoverer, Max Munk). According to Munk’s theory the
Wind tunnel tests of a modular aircraft model
Candidate: Nicola Bochicchio (matr.517/985) Pag. | 11
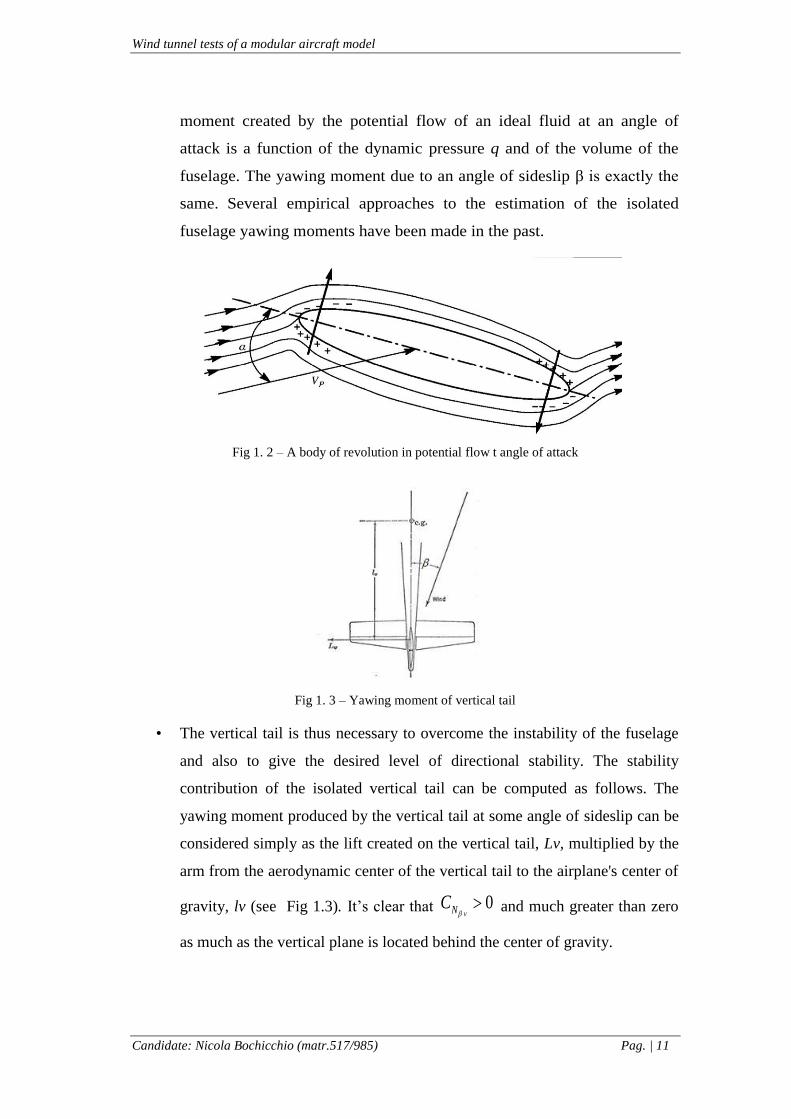
moment created by the potential flow of an ideal fluid at an angle of
attack is a function of the dynamic pressure q and of the volume of the
fuselage. The yawing moment due to an angle of sideslip β is exactly the
same. Several empirical approaches to the estimation of the isolated
fuselage yawing moments have been made in the past.
Fig 1. 2 – A body of revolution in potential flow t angle of attack
Fig 1. 3 – Yawing moment of vertical tail
• The vertical tail is thus necessary to overcome the instability of the fuselage
and also to give the desired level of directional stability. The stability
contribution of the isolated vertical tail can be computed as follows. The
yawing moment produced by the vertical tail at some angle of sideslip can be
considered simply as the lift created on the vertical tail, Lv, multiplied by the
arm from the aerodynamic center of the vertical tail to the airplane's center of
gravity, lv (see Fig 1.3). It’s clear that 0vNC
and much greater than zero
as much as the vertical plane is located behind the center of gravity.

Wind tunnel tests of a modular aircraft model
Candidate: Nicola Bochicchio (matr.517/985) Pag. | 12
It’s paramount now highlight that the directional stability of the combination of
vertical tail plus fuselage is usually different from the sum of the two isolated
components discussed so far. More generally, as it said also extends to the case
of the complete aircraft configuration and it is due to the aerodynamic
interference among all aircraft components.
In particular, our attention is focused on the vertical tail plane because it plays
the role of the stabilizing surface. The aircraft directional stability provided by the
vertical tail is influenced by:
a. the fuselage cross-flow encountered in sideslip;
b. the horizontal tail position and size;
c. the wing-body wake and the sidewash effect.
a. Effect of the fuselage
A body in sideslip exhibits a flow characteristic similar to a cylinder in an airflow.
For potential flow the peak local velocity occurs at the top at the cylinder and is
equal to twice the free-stream cross-flow velocity. Actually, separation exists on the
leeward side, reducing the peak velocity from the potential-flow value. Anyway, the
velocity decays to the free-stream cross-flow value with distance from the body
surface. Thus, tail-body combinations with large bodies and small tails have a greater
effectiveness per unit area than combinations with large tails and small bodies and
this trend is exhibited by test data. The fuselage directly alters the vertical tail
incidence because of the cross-flow around the body. The principal geometric
parameter governing this interference is the ratio of the vertical tail span bv to
fuselage height dfv, representing the relative size between the vertical stabilizer and
the fuselage section where the former is located.
Fig 1. 4 - Principal geometric parameter

Wind tunnel tests of a modular aircraft model
Candidate: Nicola Bochicchio (matr.517/985) Pag. | 13
b. Effect of the horizontal plane
The presence of a horizontal panel in the vicinity of a vertical panel causes a change
in the pressure loading of the latter if the horizontal panel is at a height where the
vertical panel has an appreciable gradient, i.e. at a relatively high or low position.
Test data substantiate the greater effectiveness of horizontal panels in these positions
and the relative ineffectiveness of horizontal panel at the midspan position on the
vertical panel (cruciform empennage configuration). At subsonic speeds the vehicle
body and horizontal tail affect the flow on the vertical tail in such a way as to
increase the effectiveness of the vertical tail. This phenomenon, known as the end-
plate effect, is represented by an effective change in panel aspect ratio required to
give the same lift effectiveness as the actual panel in the presence of the other vehicle
components (Ref. [3]).
c. Effect of the wing
For a wing-body combination there are two contributions to the sidewash present at a
vertical tail: that due to the body and that due to the wing.
The sidewash due to the fuselage arises from the side force developed on the
fuselage at some angle of sideslip. As a result of this side force, a vortex system is
produced, which in turn induces lateral-velocity components at the vertical tail. This
effect, analogous to the downwash in the longitudinal plane, indirectly affects the
incidence of the vertical tail because of the generation of the vortex system. This
sidewash from the body causes a destabilizing flow in the airstream beside the body.
Above and below the fuselage, however, the flow is stabilizing.
The sidewash arising from a wing in yaw is small compared to that of a body. The
flow above the wake centerline moves inboard and the flow below the wake
centerline moves outboard.
For conventional aircraft the combination of the wing-body flow fields is such as to
cause almost no sidewash effect below the wake centreline (Ref. [3]).
At this point, it is possible therefore to understand the aim of this thesis. The purpose
of this work is the experimental investigation of a modular aircraft model in the wind
Wind tunnel tests of a modular aircraft model
Candidate: Nicola Bochicchio (matr.517/985) Pag. | 14
tunnel of our department to provide data about aerodynamics interference among
aircraft components in sideslip condition.
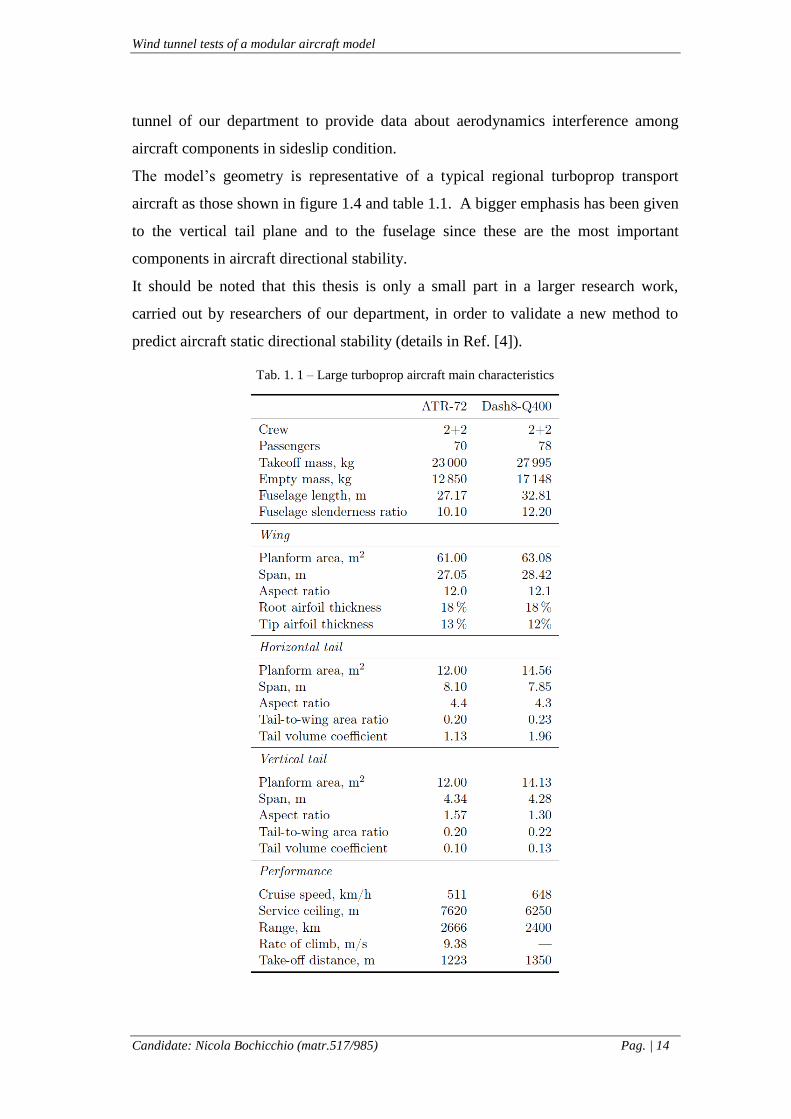
The model’s geometry is representative of a typical regional turboprop transport
aircraft as those shown in figure 1.4 and table 1.1. A bigger emphasis has been given
to the vertical tail plane and to the fuselage since these are the most important
components in aircraft directional stability.
It should be noted that this thesis is only a small part in a larger research work,
carried out by researchers of our department, in order to validate a new method to
predict aircraft static directional stability (details in Ref. [4]).
Tab. 1. 1 – Large turboprop aircraft main characteristics

Wind tunnel tests of a modular aircraft model
Candidate: Nicola Bochicchio (matr.517/985) Pag. | 15
Fig 1. 5 – Typical regional turboprop aircraft

Wind tunnel tests of a modular aircraft model
Candidate: Nicola Bochicchio (matr.517/985) Pag. | 16
1.2 ADVANTAGES OF A MODULAR MODEL
As will be better explained in chapter 2, the modular aircraft model that has
been tested in the wind tunnel of our department has the following features
(schematically summarized in Fig 1.6) :
a. the wing is straight and untapered with a fixed aspect ratio and with the
possibility to provide 3 positions on the fuselage (low, middle, high);
b. the fuselage is a narrow body with a circular section and with three different
tail cones differentiated by the parameter ftc fz r ;
c. three vertical tail planes with the same sweep angle but different aspect ratio
(ARv=1 , ARv=1.5 and ARv=2) have been considered;
d. the horizontal stabilizer is straight and untapered with a fixed aspect ratio
and several possible positions.
)b
)c
)a
)b
Fig 1. 6 – Layout of configurations investigated
Wind tunnel tests of a modular aircraft model
Candidate: Nicola Bochicchio (matr.517/985) Pag. | 17
The range of the geometric parameters investigated includes the typical regional
turbopropeller airplane layout.
A modular aircraft model, such as the one object of our study, ensures various
advantages among which the most important are the following:
I. possibility to consider partial aircraft configurations, for example body-
vertical (BV), wing-body (WB), wing-body-vertical (WBV);
II. several wing positions, vertical tail plane aspect ratios, horizontal tail plane
positions and three fuselages can be arranged in many different combinations
(Fig 1.6) in order to investigate many configurations of the typical regional
turboprop transport aircraft with a small number of interchangeable
components;
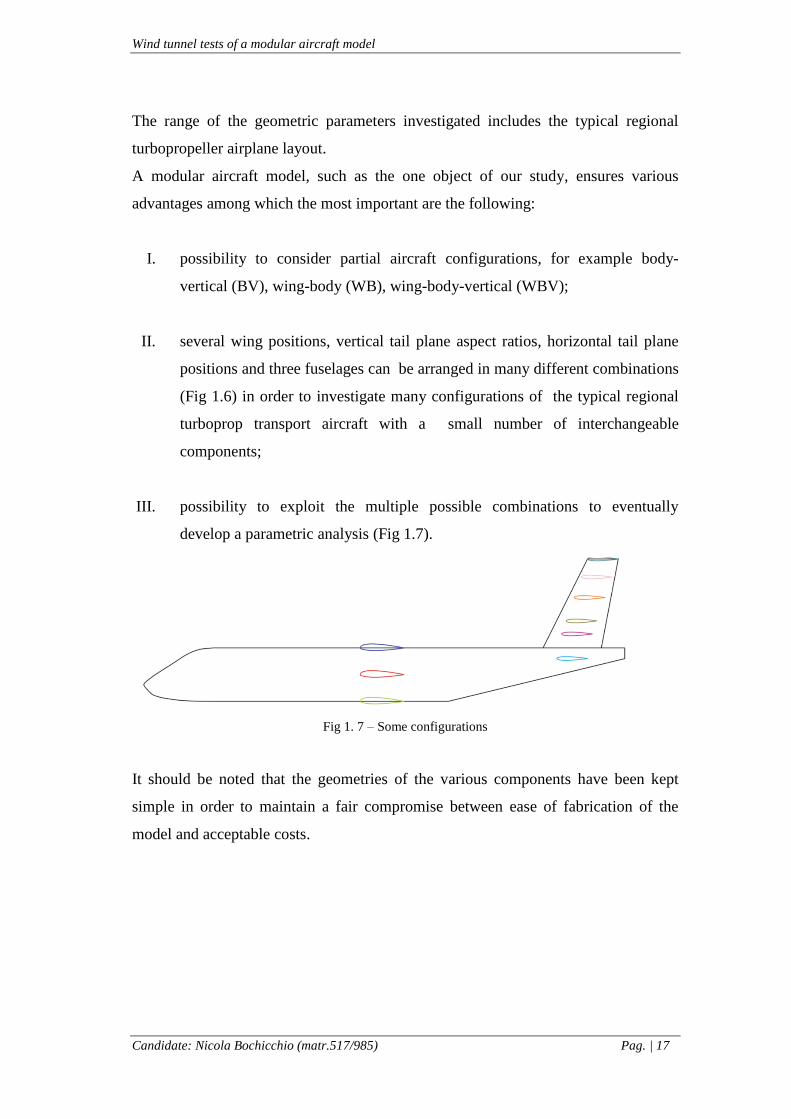
III. possibility to exploit the multiple possible combinations to eventually
develop a parametric analysis (Fig 1.7).
Fig 1. 7 – Some configurations
It should be noted that the geometries of the various components have been kept
simple in order to maintain a fair compromise between ease of fabrication of the
model and acceptable costs.

Wind tunnel tests of a modular aircraft model
Candidate: Nicola Bochicchio (matr.517/985) Pag. | 18
1.3 THE PROBLEM OF THE MINIMUM CONTROL SPEED
As highlighted by aeronautic engineering textbooks, the vertical tail plane (Fig
1.8) must provide aircraft directional equilibrium, stability and control in all flight
conditions. Landing in a strong crosswind or take-off with one engine inoperative
(OEI) are critic conditions defined by authorities that are usually employed in the
preliminary sizing of the vertical tail plane, in which the aerodynamic interference of
other aircraft components (wing, fuselage, and horizontal tail plane) must be
accounted, otherwise it could lead to a heavier and more costly component (if
oversized) or to insufficient directional stability (if undersized).
Fig 1. 8 – Example of aircraft vertical tail
For multiengined airplanes the critical design condition for the rudder is nearly
always the low-speed flight condition with full asymmetric power. In fact, the failure
of one engine at low air speed will create a heavy yawing moment that must be
overcome by the rudder in order to maintain flight at zero sideslip (Ref. [1]).

Wind tunnel tests of a modular aircraft model
Candidate: Nicola Bochicchio (matr.517/985) Pag. | 19
About that, Minimum control speed VMC is the calibrated airspeed, at which, when
the critical engine is suddenly made inoperative, it is possible to maintain control of
the airplane with that engine still inoperative, and maintain straight flight with an
angle of bank of not more than 5°.
The airborne minimum control speed may not exceed 1.13 times the reference stall
speed hence it affects the take-off field length, which must be kept as low as possible,
otherwise payload could be reduced on short runways. Here it is sufficient to say
that, in OEI condition, the vertical tail has to counteract the airplane asymmetrical
thrust. Forces and moments acting on the airplane in OEI conditions are shown in
Fig 1.9.
Fig 1. 9 – Most important forces and moments acting on the airplane while using the rudder to
counteract the asymmetric thrust and while keeping the wing level.

Wind tunnel tests of a modular aircraft model
Candidate: Nicola Bochicchio (matr.517/985) Pag. | 20
The propeller-driven engine generates a thrust which decreases with airspeed and
the yawing moment due to the asymmetric thrust can be given as follows (Ref [1]),
signs are omitted:
(1.2) a p
TV
(1.3) a p
T y yN T l lV
The rudder at full throw gives a yawing moment (signs are omitted):
(1.4) 21
2 rv N rN V S b C
(1.5) r v
v vN L r v
S lC C
S b
where
rNC is the rudder control power
vLC is the lift curve slope of the vertical tail;
r
r
is the rudder effectiveness; v is the dynamic pressure ratio
v vS l
S b
is the vertical tail volume coefficient;
Basically, semi-empirical methods provide a way to calculate aircraft directional
stability and control by including the effects of the wing, fuselage and horizontal tail
in the CLαv term. The rudder control may be approximated as:
Fig 1. 10 – Yaw moment due to asymmetric power

Wind tunnel tests of a modular aircraft model
Candidate: Nicola Bochicchio (matr.517/985) Pag. | 21
(1.6) r vN N rC C
where the static stability derivative vNC
includes the above-mentioned effects.
Thus, the calculation of directional control authority can be calculated, at least in a
first approximation, from the directional static stability derivative. It is important to
note that equation 1.6 is an approximation because the effects of aerodynamic
interference are not the same of the static stability case.
However, once it has been estimated vNC
, the intersection of the two curves
TOT sN f V V and
TOv sN f V V can be used to a preliminary vertical tail
surface sizing, according to airborne minimum control speed.
Fig 1. 11 - Chart to preliminary select the vertical tail area Sv according to airborne minimum control
speed limit
Wind tunnel tests of a modular aircraft model
Candidate: Nicola Bochicchio (matr.517/985) Pag. | 22
CHAPTER 2 - THE EXPERIMENTAL MODULAR MODEL
2.1 INTRODUCTION TO THE MODEL
As mentioned in Chapter 1, the purpose of this thesis is the experimental
investigation of a modular aircraft model in the wind tunnel of our department to
provide data about aerodynamics interference among aircraft components in sideslip
condition.
The aircraft model for the wind tunnel has been designed to have interchangeable
components, since the objective of the experimental investigations is to provide
aerodynamic data (force and moment coefficients) for many configurations. The
modular model has also been designed easy to setup quickly in order to switch
among configurations in a short time.
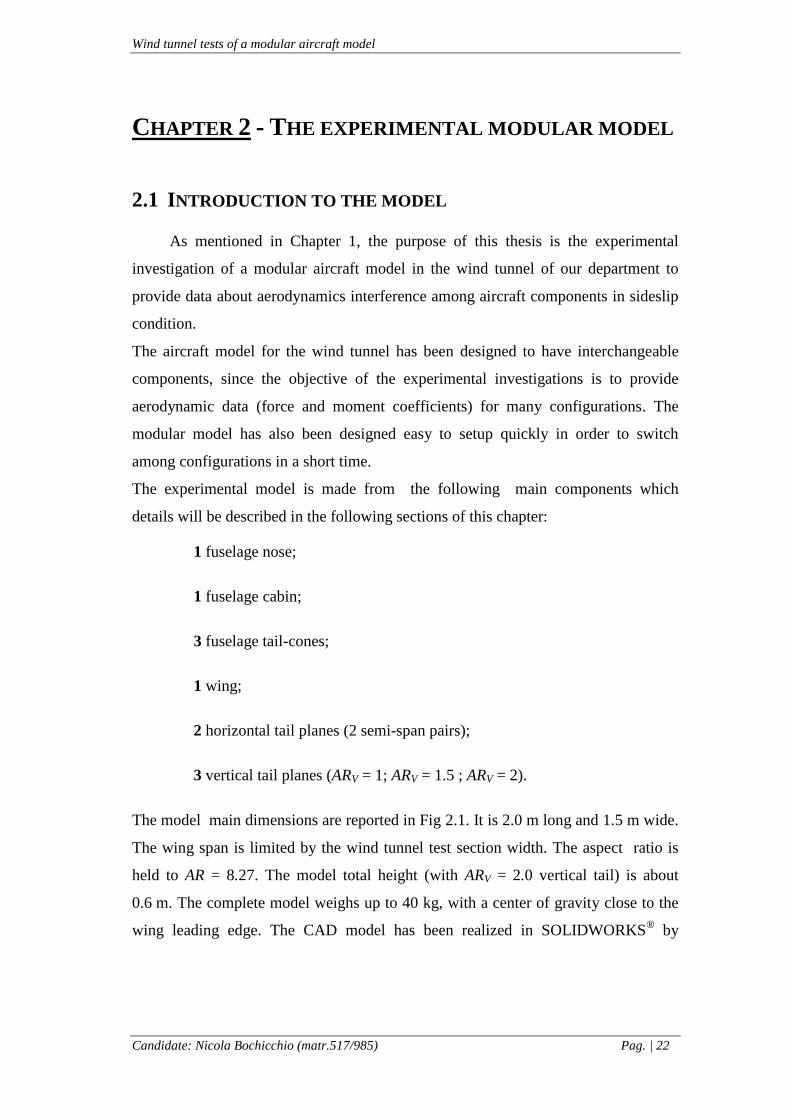
The experimental model is made from the following main components which
details will be described in the following sections of this chapter:
1 fuselage nose;
1 fuselage cabin;
3 fuselage tail-cones;
1 wing;
2 horizontal tail planes (2 semi-span pairs);
3 vertical tail planes (ARV = 1; ARV = 1.5 ; ARV = 2).
The model main dimensions are reported in Fig 2.1. It is 2.0 m long and 1.5 m wide.
The wing span is limited by the wind tunnel test section width. The aspect ratio is
held to AR = 8.27. The model total height (with ARV = 2.0 vertical tail) is about
0.6 m. The complete model weighs up to 40 kg, with a center of gravity close to the
wing leading edge. The CAD model has been realized in SOLIDWORKS® by

Wind tunnel tests of a modular aircraft model
Candidate: Nicola Bochicchio (matr.517/985) Pag. | 23
researchers of our department. The complete list of the components is reported in
Fig 2.2 and Tab 2.1.
Fig 2. 1 – Model main dimensions (units in mm)
Fig 2. 2 – Model exploded view. The markings correspond to the items of Tab 2.1

Wind tunnel tests of a modular aircraft model
Candidate: Nicola Bochicchio (matr.517/985) Pag. | 24
Tab. 2. 1 – Bill of materials. Surface and volume are reported only for the machined components.
Items are shown in Figure 2.2
The CAD model has subsequently been mainly realized by computer numerical
control (CNC) milling. The company that has been chosen for the manufacturing is
NAET Srl (www.naetsrl.it) located in Villa Literno (CE), Italy. The non-metal parts
are made from a high density machinable polyurethane slab named PROLAB 65
(Tab 2.2).
Tab. 2. 2 – Prolab 65 properties.
Property Unit Value
Color n.a. brown
Density at 23 ◦C g/cm3 0.65
Hardness Shore D1 63
Flexural modulus MPa 1000
Flexural strength MPa 34
Compressive strength MPa 28
Wind tunnel tests of a modular aircraft model
Candidate: Nicola Bochicchio (matr.517/985) Pag. | 25
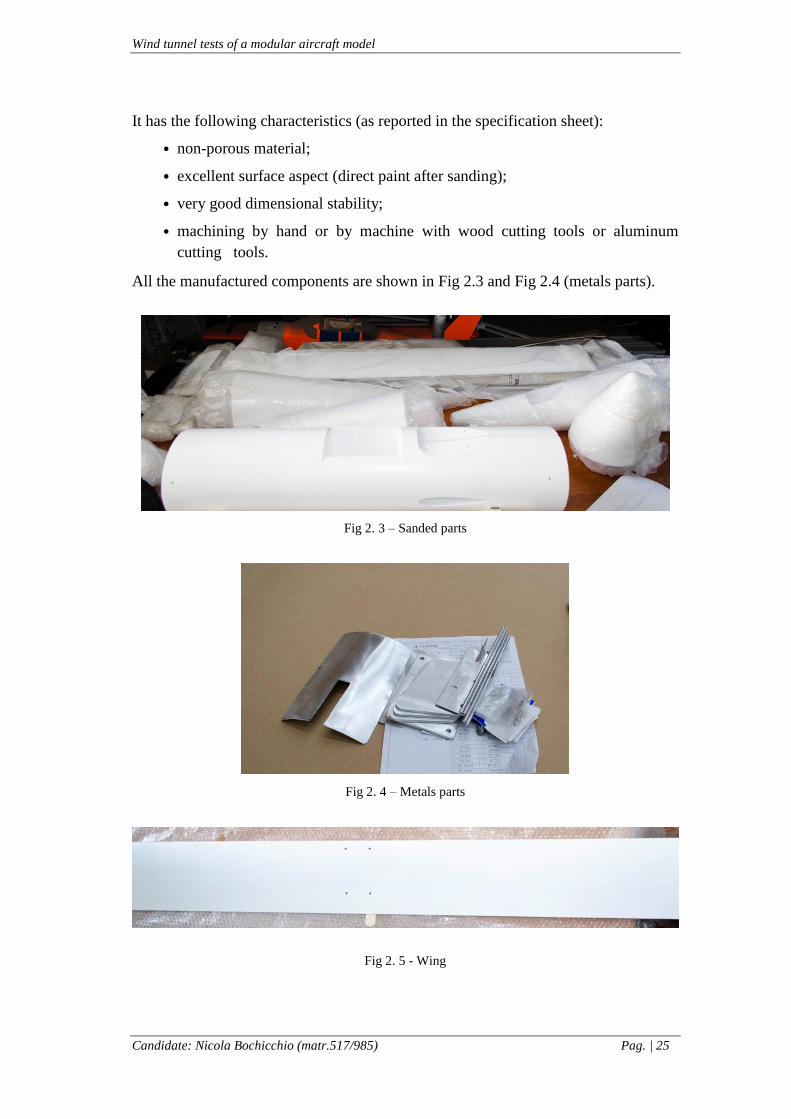
It has the following characteristics (as reported in the specification sheet):
• non-porous material;
• excellent surface aspect (direct paint after sanding);
• very good dimensional stability;
• machining by hand or by machine with wood cutting tools or aluminum
cutting tools.
All the manufactured components are shown in Fig 2.3 and Fig 2.4 (metals parts).
Fig 2. 3 – Sanded parts
Fig 2. 4 – Metals parts
Fig 2. 5 - Wing
Wind tunnel tests of a modular aircraft model
Candidate: Nicola Bochicchio (matr.517/985) Pag. | 26
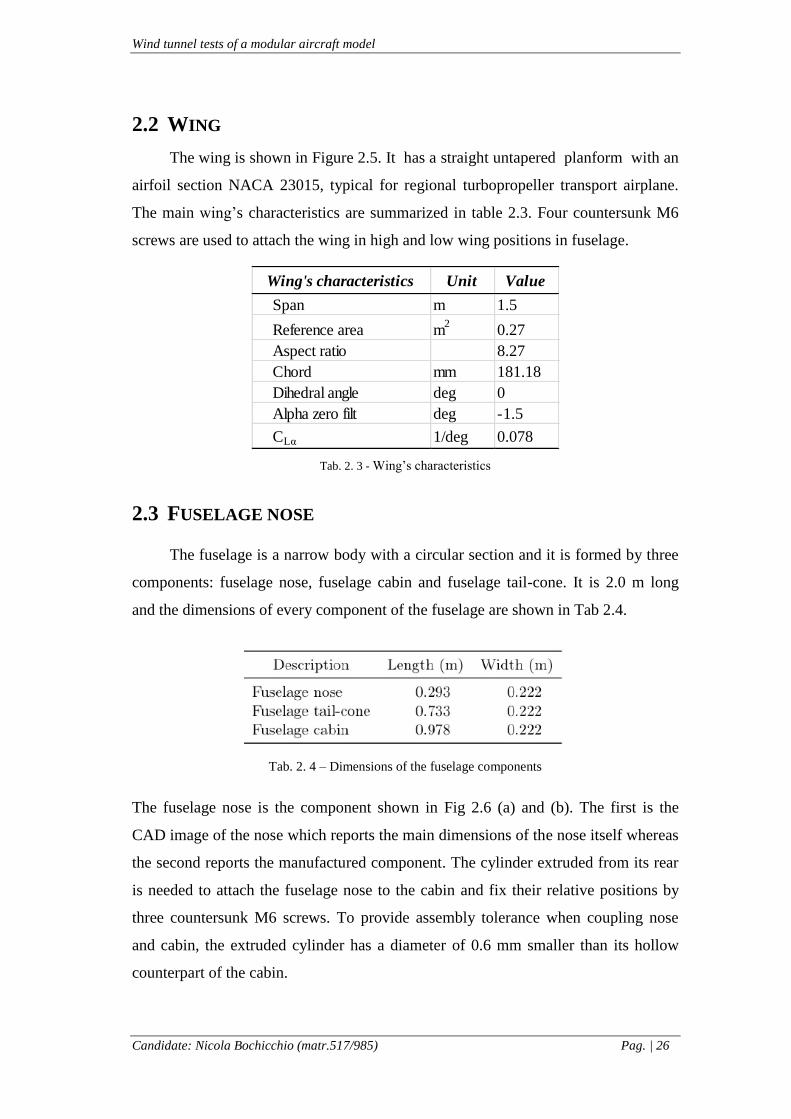
2.2 WING
The wing is shown in Figure 2.5. It has a straight untapered planform with an
airfoil section NACA 23015, typical for regional turbopropeller transport airplane.
The main wing’s characteristics are summarized in table 2.3. Four countersunk M6
screws are used to attach the wing in high and low wing positions in fuselage.
Tab. 2. 3 - Wing’s characteristics
2.3 FUSELAGE NOSE
The fuselage is a narrow body with a circular section and it is formed by three
components: fuselage nose, fuselage cabin and fuselage tail-cone. It is 2.0 m long
and the dimensions of every component of the fuselage are shown in Tab 2.4.
Tab. 2. 4 – Dimensions of the fuselage components
The fuselage nose is the component shown in Fig 2.6 (a) and (b). The first is the
CAD image of the nose which reports the main dimensions of the nose itself whereas
the second reports the manufactured component. The cylinder extruded from its rear
is needed to attach the fuselage nose to the cabin and fix their relative positions by
three countersunk M6 screws. To provide assembly tolerance when coupling nose
and cabin, the extruded cylinder has a diameter of 0.6 mm smaller than its hollow
counterpart of the cabin.
Wing's characteristics Unit Value
Span m 1.5
Reference area m2
0.27
Aspect ratio 8.27
Chord mm 181.18
Dihedral angle deg 0
Alpha zero filt deg -1.5
CLα 1/deg 0.078

Wind tunnel tests of a modular aircraft model
Candidate: Nicola Bochicchio (matr.517/985) Pag. | 27
Fig 2. 6 – Fuselage nose: (a) CAD image; (b) manufactured component
Fig 2. 7 – Fuselage cabin
Fig 2. 8 – Two covers Fig 2. 9 – Countersunk to keep wing in high/low position
( )a( )b

Wind tunnel tests of a modular aircraft model
Candidate: Nicola Bochicchio (matr.517/985) Pag. | 28
2.4 FUSELAGE CABIN
The fuselage cabin (Fig 2.7) is the central component to which all the other
main parts are linked. It is substantially a cylinder 0.733 m long with a diameter of
0.222 m as shown in Tab 2.4.
It provides housing for the wind tunnel balance, obtained by hollowing the central,
lower part. It allows the wing to be placed in low, mid, and high position. Four
countersunk M6 screws have been provided to keep the wing in high and low wing
positions (see Fig 2.9), whereas to prevent the wing to slide from the mid position, a
pin may be inserted through the fuselage from above.
Under the wing position, the continuity of the fuselage cabin’s surface is ensured by
means of two covers. These little components are shown in Fig 2.8 and are marked as
24 and 25 in Tab 2.1.
2.5 VERTICAL TAIL
Three vertical tails, shown in Fig 2.10 (a), are used for the experimental
investigation of the model in the wind tunnel of our department. They have the same
planform and the same leading edge sweep angle LE = 26.6° . The airfoil section is
a NACA 0012. Their main characteristics, together with those of all lifting surfaces
of the model, are summarized in the Tab 2.5.
Tab. 2. 5 – Dimensions of the lifting surface of the model.
(Items ID are shown in Fig 2.2)
As can be seen from the above table, the root section chord is the same for the three
planforms, the taper ratio λ varies from 0.53 to 0.73, and the aspect ratios ARV
investigated are 1.0, 1.5, and 2.0.

Wind tunnel tests of a modular aircraft model
Candidate: Nicola Bochicchio (matr.517/985) Pag. | 29
As it can be seen from Fig 2.10 (a), each planform presents pairs of holes at several
span stations. These are used to insert horizontal tail spars to get different empennage
configurations.
The vertical tail is linked to the fuselage
by a plate, acting as a structural web and
shown virtually in Fig 2.10 (b), which is
sunk in the former.
Fig 2. 10 - (a) Vertical tails comparison (ARv=1 - 1.5 - 2); (b) Vertical plate.
Fig 2. 11 – (a) Fuselage tail cones; (b) Sterns of the tail cones
( )a
( )b
( )a
( )b

Wind tunnel tests of a modular aircraft model
Candidate: Nicola Bochicchio (matr.517/985) Pag. | 30
2.6 FUSELAGE TAIL-CONE
Three different fuselage tail cones, shown in Figure 2.11, are provided to
investigate the effects of the wing-body wake on the empennage. Each tail cone is
0.733 m long (see Tab 2.4) but have a different value of the parameter ftc fz r ,
where fr is the radius of the fuselage cabin, while the meaning of ftcz is clear by
looking at Fig 2.12. The tail cone is a crucial component, because it must:
• support the empennage
• be stiff enough to not be deformed under aerodynamic loads
• be easily handled during the change of configuration
• not weigh too much on the fuselage cabin
In order to get experimental data about the vertical tail in various aircraft
configurations, a solution allowing the direct measure of the aerodynamic force on
the empennage has been designed.
More in detail, the vertical stabilizer must be attached to a separate load cell, which,
in turn, is attached to the fuselage. For this purpose each tail cone is provided of an
appropriate space to allow load cell and empennage mounting (see Fig 2.13). It
provides enough volume to protect the load cell and supporting plates from the
aerodynamic flow. Moreover, there is a duct to allow the take out the data acquisition
cable through a slot on the bottom fuselage surface. The slot continues on the
fuselage cabin allowing the cable to be taken to the wind tunnel balance sting, thus
avoiding aerodynamics interference, and then to the acquisition system.
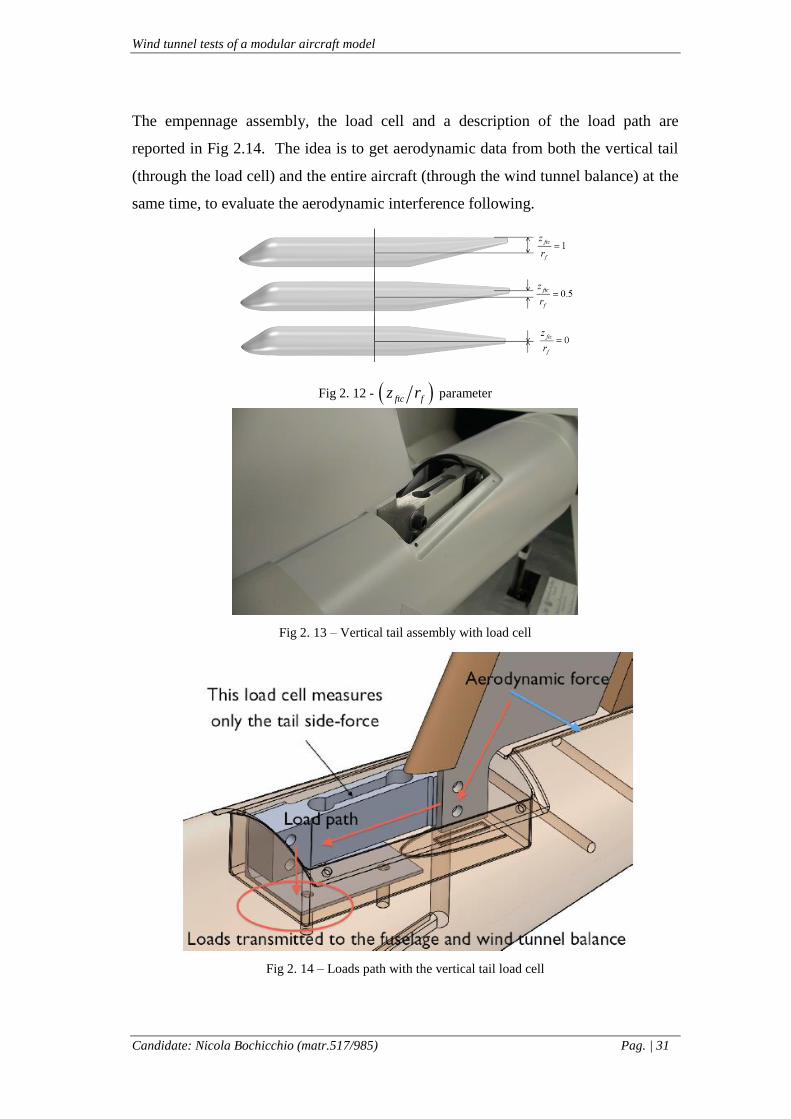
As shown in Fig 2.13, the only constraint between the vertical tail and the fuselage is
the load cell (that will be described in Chap 3), which is linked to the fuselage on one
side and to the vertical stabilizer on the other side. Thus, the latter is suspended on
the load cell, since no contact can be allowed with the fuselage to avoid the direct
transmission of the aerodynamic loads from the tail to the body, in order to measure
the aerodynamic forces acting on the vertical tail in a given aircraft configuration.
For this reason, an empty space few millimetres thick between the vertical tail root
section and the fuselage has been provided.
Wind tunnel tests of a modular aircraft model
Candidate: Nicola Bochicchio (matr.517/985) Pag. | 31
The empennage assembly, the load cell and a description of the load path are
reported in Fig 2.14. The idea is to get aerodynamic data from both the vertical tail
(through the load cell) and the entire aircraft (through the wind tunnel balance) at the
same time, to evaluate the aerodynamic interference following.
Fig 2. 12 - ftc fz r parameter
Fig 2. 13 – Vertical tail assembly with load cell
Fig 2. 14 – Loads path with the vertical tail load cell

Wind tunnel tests of a modular aircraft model
Candidate: Nicola Bochicchio (matr.517/985) Pag. | 32
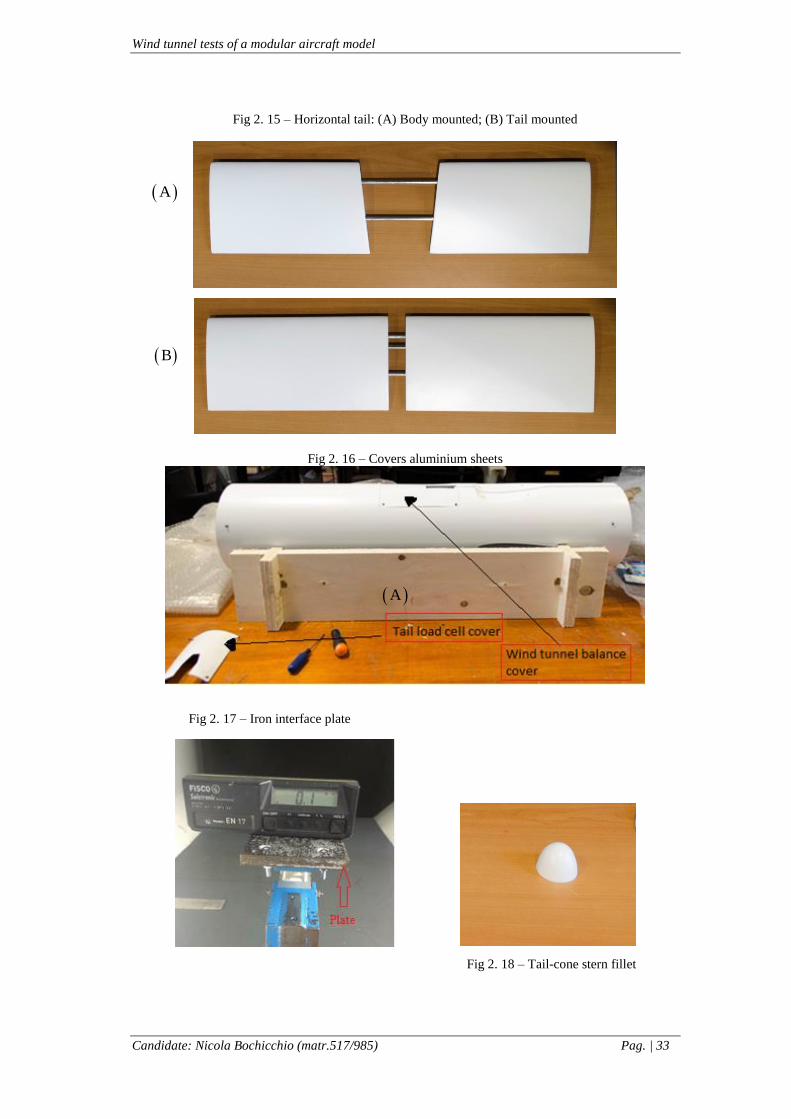
2.7 HORIZONTAL TAIL
As already mentioned in section 2.1, there are two pairs of horizontal tail semi-span,
shown in the following figures:
• one for the body-mounted tail configuration, see Fig. 2.15 (A);
• the other for the tail-mounted configuration, see Fig 2.15 (B).
Both have a NACA 0012 as airfoil section but the former has been cut such to be fit
on the fuselage tail-cone.
The two horizontal tails are straight and untapered with a fixed aspect ratio
ARH = 4.1. Both have a chord 0.128 m long, a surface of 0.055 m2 and a span of
0.521 m.
As it can be seen from Fig 2.15 (A) and (B), the tail spars are two aluminium bars
that are fixed to one side and locked each other on the other side by two M2 screw.
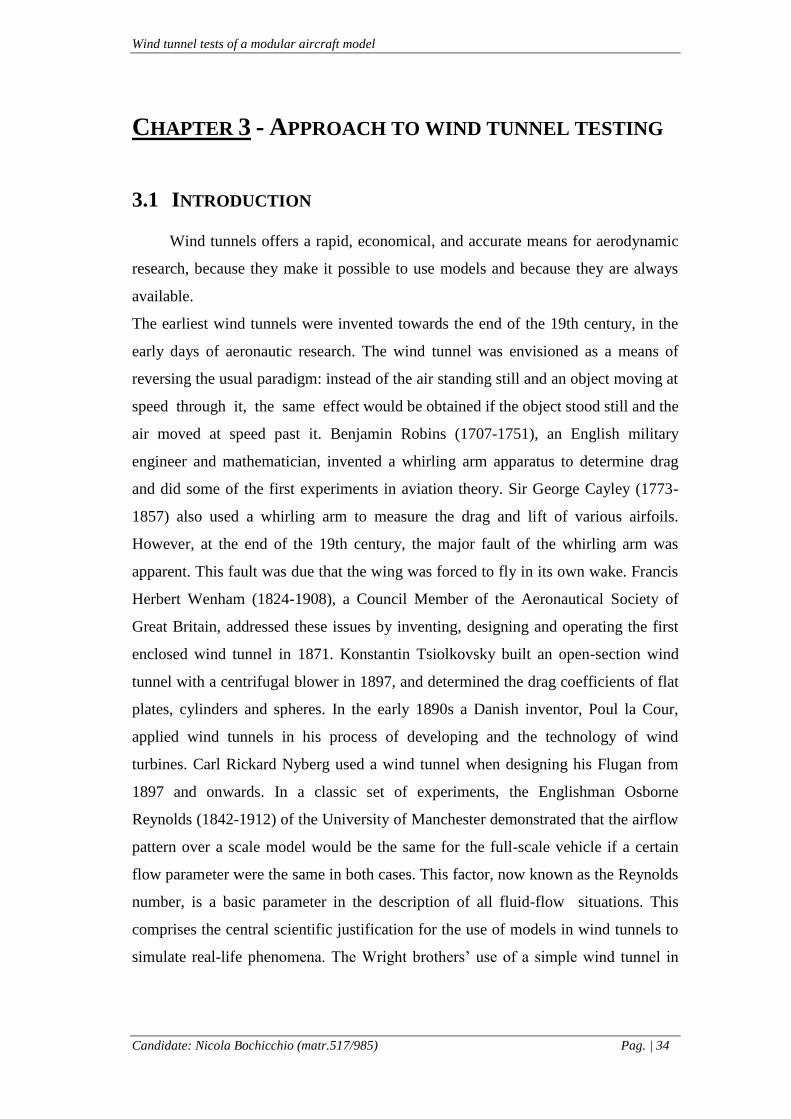
2.8 OTHER SMALL COMPONENTS
There are other small components that are not described in the previous sections:
• the wind tunnel balance and the tail load cell are covered by folded metal
sheets, shown Fig 2.16;
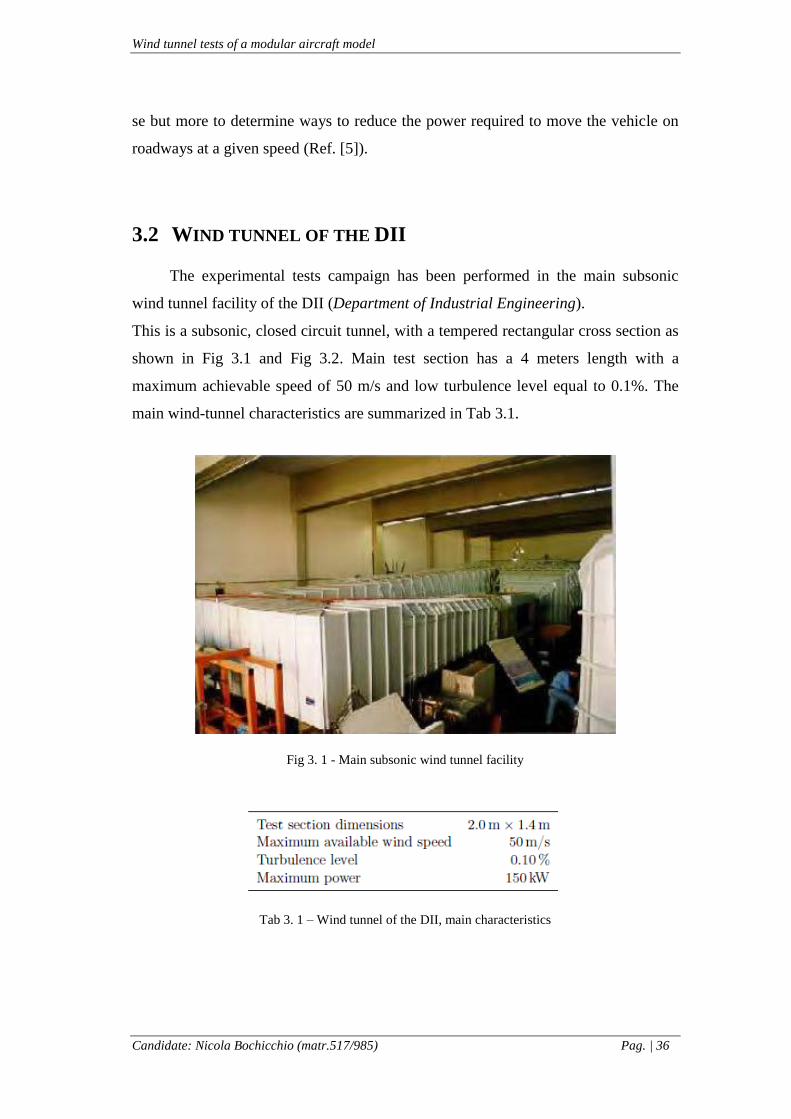
• the tail-cone stern can be filleted by adding the components shown in the
Fig 2.18;
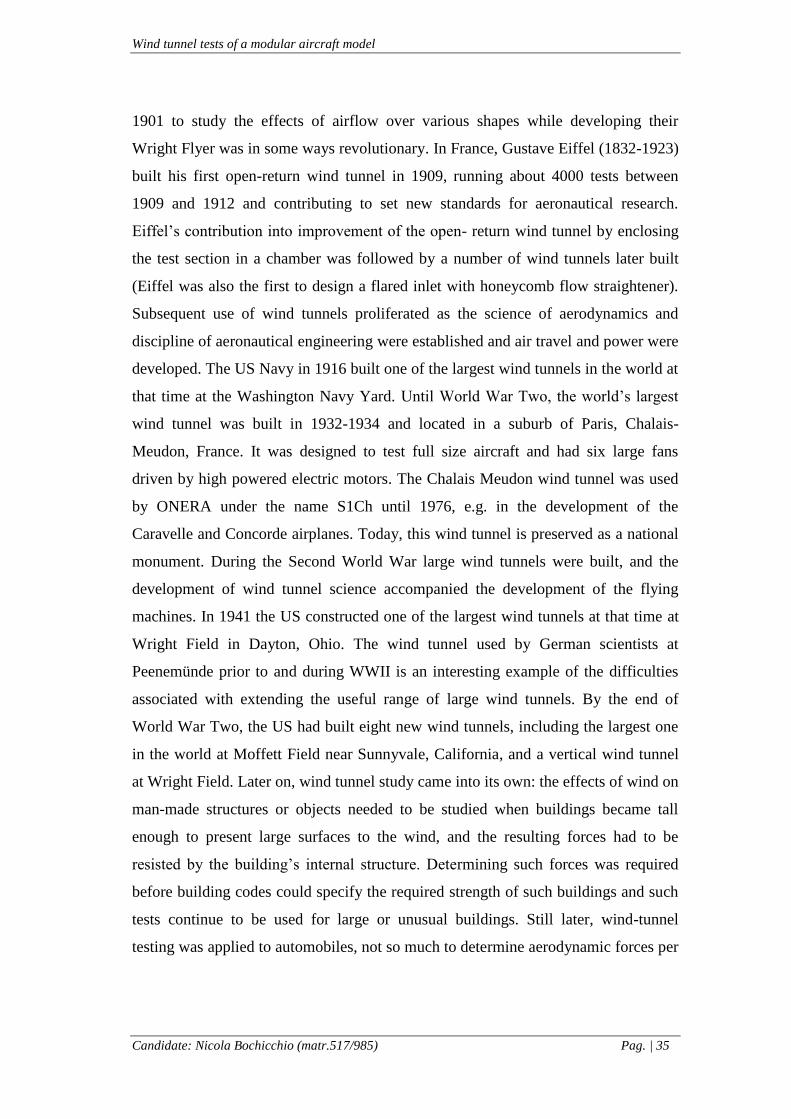
• between the model and the lateral-directional wind tunnel balance there is an
iron interface plate shown in Fig 2.17;
• the T-tail configuration presents an additional element, which must be
attached on the vertical tail tip to provide a constraint for the horizontal
stabilizer.
Wind tunnel tests of a modular aircraft model
Candidate: Nicola Bochicchio (matr.517/985) Pag. | 33
Fig 2. 15 – Horizontal tail: (A) Body mounted; (B) Tail mounted
Fig 2. 16 – Covers aluminium sheets
Fig 2. 17 – Iron interface plate
Fig 2. 18 – Tail-cone stern fillet
A
A
B
Wind tunnel tests of a modular aircraft model
Candidate: Nicola Bochicchio (matr.517/985) Pag. | 34
CHAPTER 3 - APPROACH TO WIND TUNNEL TESTING
3.1 INTRODUCTION
Wind tunnels offers a rapid, economical, and accurate means for aerodynamic
research, because they make it possible to use models and because they are always
available.
The earliest wind tunnels were invented towards the end of the 19th century, in the
early days of aeronautic research. The wind tunnel was envisioned as a means of
reversing the usual paradigm: instead of the air standing still and an object moving at
speed through it, the same effect would be obtained if the object stood still and the
air moved at speed past it. Benjamin Robins (1707-1751), an English military
engineer and mathematician, invented a whirling arm apparatus to determine drag
and did some of the first experiments in aviation theory. Sir George Cayley (1773-
1857) also used a whirling arm to measure the drag and lift of various airfoils.
However, at the end of the 19th century, the major fault of the whirling arm was
apparent. This fault was due that the wing was forced to fly in its own wake. Francis
Herbert Wenham (1824-1908), a Council Member of the Aeronautical Society of
Great Britain, addressed these issues by inventing, designing and operating the first
enclosed wind tunnel in 1871. Konstantin Tsiolkovsky built an open-section wind
tunnel with a centrifugal blower in 1897, and determined the drag coefficients of flat
plates, cylinders and spheres. In the early 1890s a Danish inventor, Poul la Cour,
applied wind tunnels in his process of developing and the technology of wind
turbines. Carl Rickard Nyberg used a wind tunnel when designing his Flugan from
1897 and onwards. In a classic set of experiments, the Englishman Osborne
Reynolds (1842-1912) of the University of Manchester demonstrated that the airflow
pattern over a scale model would be the same for the full-scale vehicle if a certain
flow parameter were the same in both cases. This factor, now known as the Reynolds
number, is a basic parameter in the description of all fluid-flow situations. This
comprises the central scientific justification for the use of models in wind tunnels to
simulate real-life phenomena. The Wright brothers’ use of a simple wind tunnel in
Wind tunnel tests of a modular aircraft model
Candidate: Nicola Bochicchio (matr.517/985) Pag. | 35
1901 to study the effects of airflow over various shapes while developing their
Wright Flyer was in some ways revolutionary. In France, Gustave Eiffel (1832-1923)
built his first open-return wind tunnel in 1909, running about 4000 tests between
1909 and 1912 and contributing to set new standards for aeronautical research.
Eiffel’s contribution into improvement of the open- return wind tunnel by enclosing
the test section in a chamber was followed by a number of wind tunnels later built
(Eiffel was also the first to design a flared inlet with honeycomb flow straightener).
Subsequent use of wind tunnels proliferated as the science of aerodynamics and
discipline of aeronautical engineering were established and air travel and power were
developed. The US Navy in 1916 built one of the largest wind tunnels in the world at
that time at the Washington Navy Yard. Until World War Two, the world’s largest
wind tunnel was built in 1932-1934 and located in a suburb of Paris, Chalais-
Meudon, France. It was designed to test full size aircraft and had six large fans
driven by high powered electric motors. The Chalais Meudon wind tunnel was used
by ONERA under the name S1Ch until 1976, e.g. in the development of the
Caravelle and Concorde airplanes. Today, this wind tunnel is preserved as a national
monument. During the Second World War large wind tunnels were built, and the
development of wind tunnel science accompanied the development of the flying
machines. In 1941 the US constructed one of the largest wind tunnels at that time at
Wright Field in Dayton, Ohio. The wind tunnel used by German scientists at
Peenemünde prior to and during WWII is an interesting example of the difficulties
associated with extending the useful range of large wind tunnels. By the end of
World War Two, the US had built eight new wind tunnels, including the largest one
in the world at Moffett Field near Sunnyvale, California, and a vertical wind tunnel
at Wright Field. Later on, wind tunnel study came into its own: the effects of wind on
man-made structures or objects needed to be studied when buildings became tall
enough to present large surfaces to the wind, and the resulting forces had to be
resisted by the building’s internal structure. Determining such forces was required
before building codes could specify the required strength of such buildings and such
tests continue to be used for large or unusual buildings. Still later, wind-tunnel
testing was applied to automobiles, not so much to determine aerodynamic forces per
Wind tunnel tests of a modular aircraft model
Candidate: Nicola Bochicchio (matr.517/985) Pag. | 36
se but more to determine ways to reduce the power required to move the vehicle on
roadways at a given speed (Ref. [5]).
3.2 WIND TUNNEL OF THE DII
The experimental tests campaign has been performed in the main subsonic
wind tunnel facility of the DII (Department of Industrial Engineering).
This is a subsonic, closed circuit tunnel, with a tempered rectangular cross section as
shown in Fig 3.1 and Fig 3.2. Main test section has a 4 meters length with a
maximum achievable speed of 50 m/s and low turbulence level equal to 0.1%. The
main wind-tunnel characteristics are summarized in Tab 3.1.
Fig 3. 1 - Main subsonic wind tunnel facility
Tab 3. 1 – Wind tunnel of the DII, main characteristics

Wind tunnel tests of a modular aircraft model
Candidate: Nicola Bochicchio (matr.517/985) Pag. | 37
Fig 3. 2 - Plane form and geometric dimensions of the DII’s wind tunnel facility
The main components of the closed circuit tunnel are shown in the Fig 3.2 and are
described in the following. Capitals letters refer to the sections of Fig 3.2.
Test section: it is 4 m long, 2 m wide and 1.4 m high. Its cross section is
rectangular, with blunted edges and with an area of 2.68 m2. Sections from A
to B;
Diffusers: there are three diffusers in order to slow down the airflow coming
from the test chamber. The first diffuser (B-C) has a length of about 5 m and
an expansion angle of about 3° and it links the last section of the test chamber
to first corner. The second diffuser (D-E) is placed between the first two
corners and has a length of about 1.8 m. The last diffuser (G-I) is the longest
one (about 12.3 m) and increases the tunnel section having an expansion
angle of about 3°. It is places between the second and third corner;
Screen: it is placed immediately before the first corner (section C) with the
aim to protect the turning vanes against any possible object or scraps that
could be lost by the model in the test section. The screen has squared cells of
about 13 mm for edge;

Wind tunnel tests of a modular aircraft model
Candidate: Nicola Bochicchio (matr.517/985) Pag. | 38
Corners: the first corner (C-D) is placed behind the first diffuser and has a
constant section with turning vanes with a chord of about 450 mm and a
maximum thickness of about 14.4%. The second corner (E-F) is placed
behind the fan and is equipped with tabs having a chord of about 490 mm and
maximum thickness of about 13.3%. The second corner section is slightly
divergent, such as the third and fourth corner. The third corner (L-I) has
diverters with a chord of 925 mm and maximum thickness of 17.3%, while
the fourth corner (L-M) tabs have a length of 875 mm with a maximum
thickness of 18.3%;
Fan: it is placed immediately ahead of the second corner (D-E). Upstream the
six blades propeller, a four blade flow straightener ring is placed. The ogive
of the fan has a maximum diameter of 700 mm;
Stagnation chamber: it has a length of 0.035 m and it is placed ahead of the
nozzle. Section M;
Honeycomb flow straighteners: they are elliptical section cells placed at the
beginning of the stagnation chamber. Section M;
Mesh screen: it has the function to reduce the turbulence axial component of
the flow in the test section allowing a turbulence level of 0.10%;
Nozzle: it has a length of 3.56 m, with an inlet section of about 12.7 m2 and
an outlet section of 2.7 m2, with a ratio of 4.83. Sections from M to N.
Wind tunnel tests of a modular aircraft model
Candidate: Nicola Bochicchio (matr.517/985) Pag. | 39
3.3 INSTRUMENTATION
The instrumentation used to perform the experimental test campaign can be
divided in: measurement, control, data acquisition and elaboration.
3.3.1 Measurement instrumentation
This instrumentation consists of an internal lateral-directional strain gage
balance for the measurement of aerodynamic forces and moments, an off-center load
cell in order to have the direct measure of the aerodynamic force acting on the
vertical tail, a Venturi system to measure the dynamic pressure, an inclinometer to
read the longitudinal attitude of the model, a potentiometer to measure the sideslip
angle and finally a temperature probe to measure the static temperature in the test
section. Some details are given in the following:
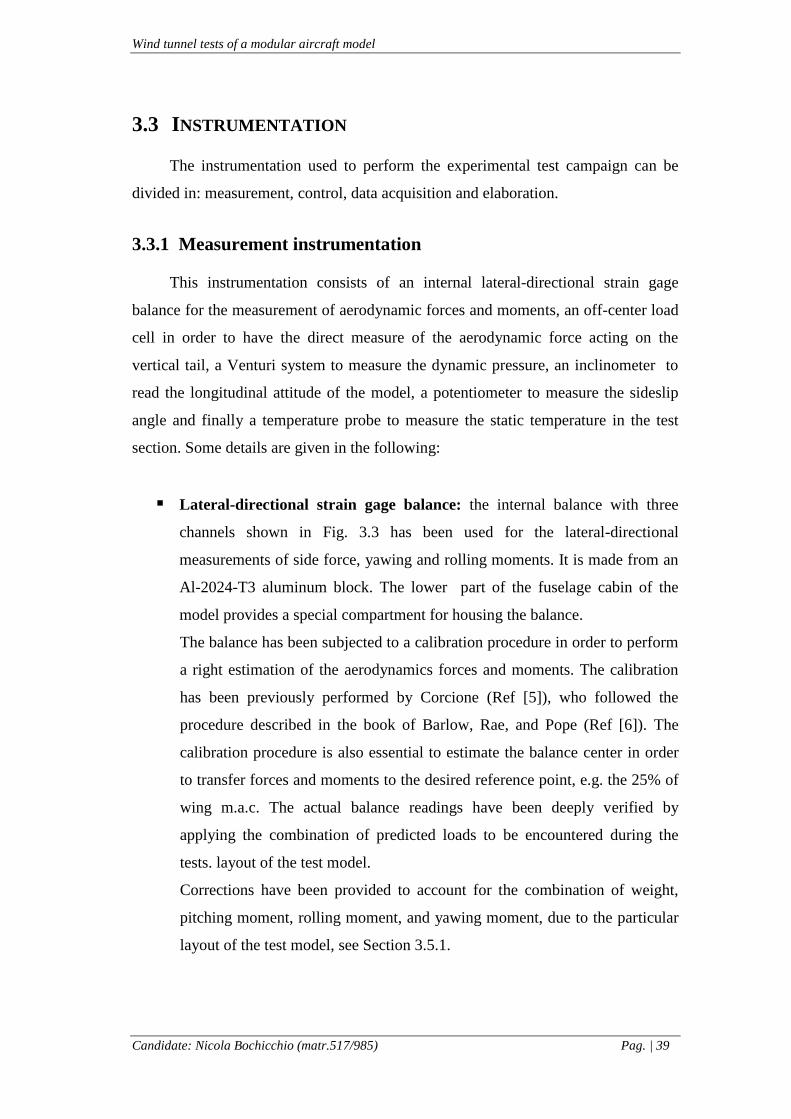
Lateral-directional strain gage balance: the internal balance with three
channels shown in Fig. 3.3 has been used for the lateral-directional
measurements of side force, yawing and rolling moments. It is made from an
Al-2024-T3 aluminum block. The lower part of the fuselage cabin of the
model provides a special compartment for housing the balance.
The balance has been subjected to a calibration procedure in order to perform
a right estimation of the aerodynamics forces and moments. The calibration
has been previously performed by Corcione (Ref [5]), who followed the
procedure described in the book of Barlow, Rae, and Pope (Ref [6]). The
calibration procedure is also essential to estimate the balance center in order
to transfer forces and moments to the desired reference point, e.g. the 25% of
wing m.a.c. The actual balance readings have been deeply verified by
applying the combination of predicted loads to be encountered during the
tests. layout of the test model.
Corrections have been provided to account for the combination of weight,
pitching moment, rolling moment, and yawing moment, due to the particular
layout of the test model, see Section 3.5.1.

Wind tunnel tests of a modular aircraft model
Candidate: Nicola Bochicchio (matr.517/985) Pag. | 40
Fig 3. 3 - Lateral directional strain gage balance
Off-center load cell: it is a Picotronik AAC model, used to directly measure
the side force generated by the vertical tail. It is made from aluminium alloy
and it has 15 Kgf full scale, with 2.0mV/V ±10% nominal sensitivity. Its
dimensions are 130 x 30 x 22mm. The load cell can measure forces in the
side direction, colored in white in Fig 3.4. Its location on the model has been
discussed in the chapter 2 (exactly Section 2.6) and has been shown in Fig
2.13 and Fig 2.14, whereas its calibration are discussed in Section 3.5.1.
Fig 3. 4 - The off-center load cell
Fig 3. 5 - Inclinometer

Wind tunnel tests of a modular aircraft model
Candidate: Nicola Bochicchio (matr.517/985) Pag. | 41
Venturi: the wind tunnel of the DII is equipped with 4 static pressure probe
placed on both faces of both initial and final sections of the convergent. A
pressure transducer (with a F.S. of 2500 Pa and an accuracy of 2-3 Pa)
measures the static pressure variation between these sections and through the
continuity equation obtains the dynamic pressure at the exit of the nozzle.
Several tests without the model in the test section and at different air speeds,
have shown that the dynamic pressure at the end of the nozzle is not equal to
the test section dynamic pressure, but the linear fit shown in Eq. 3.1 has be
found:
1,09eff meansq q (3.1)
Because it is impossible to use a Pitot probe to measure the dynamic
pressure in the test section in presence of the scale model (the test section
should be long enough to guarantee that the measure is not affected by the
pressure field produced by the model in the test section), the only available
measure of the dynamic pressure is obtained by the Venturi, thus the above
equation is assumed to be valid also in presence of the scale model in the test
section.
Inclinometer: it is the uni-axial tilt Sensor CXLA01, produced by CrossBow
(San Jose, CA-USA) and shown in Fig 3.5. The sensor measures the
component of the acceleration of gravity that lies in the plane of the
instrument reference face. The inclinometer has been integral mounted with
the sting on which the balance is fixed on.
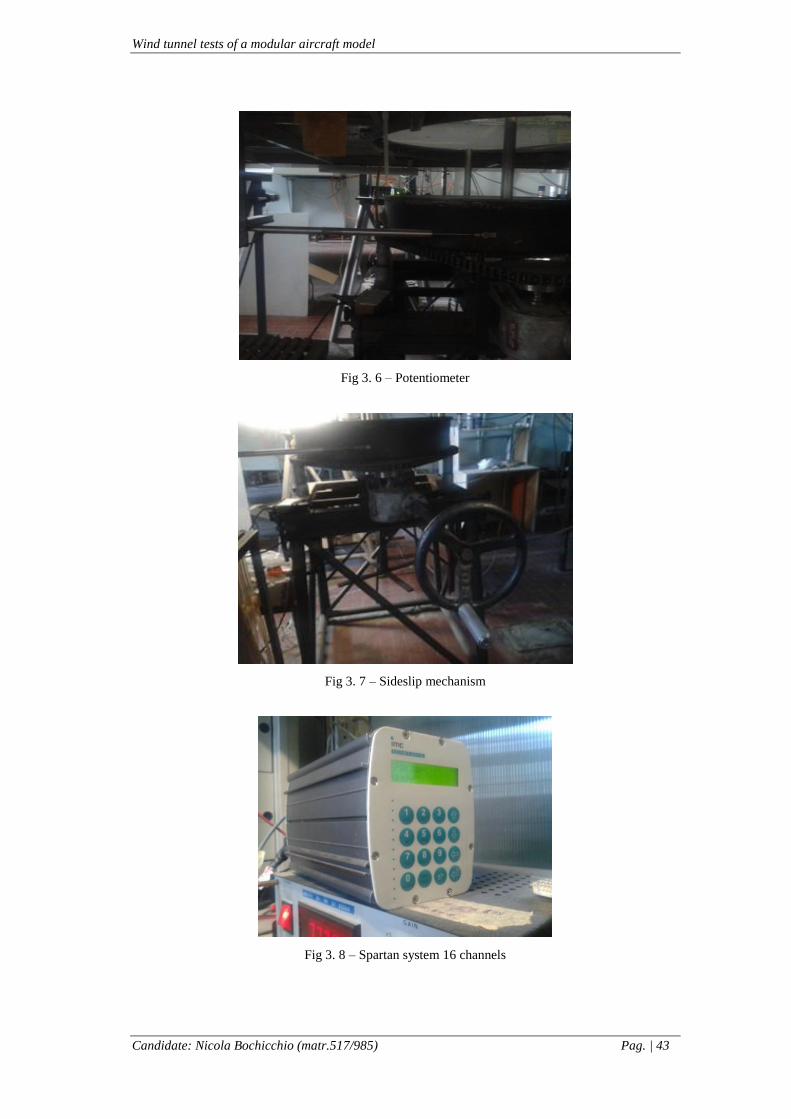
Potentiometer for the sideslip angle: the sideslip angle has been measured
through the use of a potentiometer (shown in Fig 3.6) with an accuracy of
0.1°. Once installed, the available range for the sideslip angle β is from -15°
to 25°. The sideslip angle is assumed to be positive in sign when the airflow
comes from the left wing the model. This is the opposite of the usual
convention because of the operator’s point of view of the test chamber.

Wind tunnel tests of a modular aircraft model
Candidate: Nicola Bochicchio (matr.517/985) Pag. | 42
Temperature probe: it consists of a flush wall-mounted probe for the
measurement of the static temperature in order to determine the true test
section speed through the use of Bernoulli’s incompressible equation and to
obtain the mass density through the equation of state. The temperature
measurements are also needed to take under control the heating of the strain
gage sensors that are affected by temperature change, which during a test
ranges from 30° to 50°, depending on the environment temperature too.
3.3.2 Control instrumentation
The control instrumentation used in this test campaign is shown in Fig 3.7. It
consists of a kinematic mechanism (manhandle by the operator) with a crank handle
fixed at the end of a horizontal shaft acting as worm-screw. This shaft transmits the
rotatory motion to the vertical axis of a small diameter gear wheel. The rotatory
motion is then transmitted to a larger gear wheel through a steel chain reducing the
angular velocity of the model. A steel plate, which is at level with the floor, is fixed
to the axis of the second gear wheel. The steel plate allows the whole assembly sting-
balance-model to rotate.
3.3.3 Acquisition and elaboration
This instrumentation for acquisition and elaboration consists in:
a 16 channels device for the acquisition and conversion into 16 bit
(SPARTAN system, produced by Imc Data Works) of output data coming
from the measurement instrumentation;
a Desktop PC with Windows XP, provided with an interface software for the
A/D converter;
a software for the elaboration and visualization of the acquired data. The
software, named WT6, has been developed at the DII laboratory by ADAG
research group.
Wind tunnel tests of a modular aircraft model
Candidate: Nicola Bochicchio (matr.517/985) Pag. | 43
Fig 3. 6 – Potentiometer
Fig 3. 7 – Sideslip mechanism
Fig 3. 8 – Spartan system 16 channels

Wind tunnel tests of a modular aircraft model
Candidate: Nicola Bochicchio (matr.517/985) Pag. | 44
3.4 SETUP ISSUES
Before starting the experimental tests campaign two issues had to be solved:
model’s center of gravity location and stiffening of the sting.
3.4.1 Center of gravity location
For the model investigated, the balance is located in a hollowing forward of the
wing. The balance center is obviously the point with respect to which are measured
the global aerodynamic forces and moment. This point is located at about 0.71 m,
along the longitudinal axis, to the fuselage nose. In the original design configuration
the center of gravity of the model was located between the wing aerodynamic center
and the leading edge, at about 0.91 m along the longitudinal axis to the fuselage
nose. Because the center of gravity of the model does not correspond to the balance
center, the original mass distribution produced, in the complete configuration
(WBVH, with ARV = 2), a positive pitching moment of about:
_ 39 0.2 8 initialpitch W initial cg cbM W x x kg m kg m (3.2)
Since this pitching moment could have penalized the accuracy of the lateral-
directional measurements, the location of the model’s center of gravity has been
suitably modified. To move the center of gravity closer to the balance center, a lead
cylinder of about 9.1 Kg was inserted in the fuselage. This balancing mass was
internally made to the laboratory of the DII from the fusion of lead pieces of various
shapes and it has the following dimensions: diameter 0.12 m and height
0.11 m.
With the abovementioned process, the weight passed from 39 initialW Kg to
48 finalW Kg but the moment arm of the weight force from the balance center was
reduced to 0.05 finalcg cbx x m . Therefore, the new mass distribution produced a
positive pitching moment of about:
_ 48 0.05 2.4 finalpitch W final cg cbM W x x kg m kg m (3.3)

Wind tunnel tests of a modular aircraft model
Candidate: Nicola Bochicchio (matr.517/985) Pag. | 45
This value is much more acceptable than the initial one for the purposes of our
measurements. Furthermore, since the wing’s profile is not symmetrical and there is
an inevitable offset between the lift and the balance center, it will be further reduced
by the pitching moment contribution of the wing lift.
Fig 3.9 and Tab 3.2 summarize the situation at different alpha values and V = 40 m/s
(sea level ρ = 1.225 Kg/m3).
In order to make only a preliminary estimation the contribute of the horizontal tail
has been neglected. Moreover the horizontal tail’s profile is symmetrical and we are
interested at the case of not angle of attack.
As we seen from the Tab 3.2, in the worst case, for the model aircraft in its complete
configuration at no angle of attack and at wind speed of 40 m/s, the pitching moment
respect the balance center is about 1.8 Kgf m.
3.4.2 Stiffening of the sting
The lateral-directional strain gage balance is mounted on a steel sting and the
assembly sting-balance is, in turn, linked to a rigid metal support placed below the
floor of the test section. The sting was internally made to the laboratory of the DII
and it has a rectangular section.
As said in the previous section, the addition of a balancing mass have brought the
total weight to about 48 kgf. For this reason, the sting of the balance has been
stiffened by soldering an appropriate iron plate on its side (see Fig. 3.10).
This allowed to make much more rigid the assembly sting-balance and reduce
unpleasant vibrations that could affect the experimental measures.
The stiffening process described has been realized in the laboratory of the DII under
the technical supervision of skilled workers in this field.

Wind tunnel tests of a modular aircraft model
Candidate: Nicola Bochicchio (matr.517/985) Pag. | 46
Tab 3. 2 - Estimation of pitching moment contributes of weight and lift
Fig 3. 9 - Model with lead cylinder in the fuselage nose
Fig 3. 10 - Sting stiffened
α (deg) Weight (Kg) Mom. (Kg m)
0 48 +2.4
2 48 +2.4
5 48 +2.4
WEIGHT
(arm from the cb: Δxweight=0.05m)
α (deg) Lift (Kg) Mom. (Kg m)
0 2.9 -0.6
2 6.7 -1.34
5 12.4 -2.48
WING LIFT
(arm from the cb: Δxlift=0.20m)
α (deg) Z-Force (Kg) Mom. (Kg m)
0 -45.1 +1.80
2 -41.3 +1.06
5 -35.6 -0.08
TOTAL FORCE AND MOMENT
(Z-axis positive in the positive lift direction)
Wind tunnel tests of a modular aircraft model
Candidate: Nicola Bochicchio (matr.517/985) Pag. | 47
3.5 SETUP OF THE WIND TUNNEL
A preliminary setup of the wind tunnel instrumentation, as well as of the test
model, is needed before any operation.
The measurement, control, and elaboration instrumentation must be checked. In
particular, the wind-tunnel balance readings must be verified. Then, the model can be
mounted in the test section and the whole assembly can be verified in place. Finally,
the effects of low Reynolds number can be measured and corrected.
3.5.1 Verification of the balance readings
The internal strain gage balance is a very delicate item. Its readings must be
checked prior to every test campaign, since it is the main, if not the unique, source of
measurement. This is also essential in order to apply the transportation of forces and
moment from the balance center to the desired reference pole for the reduction of the
aerodynamic forces and moments.
The verification consists in applying known loads in several positions and acquiring
the balance readings. If the acquired data are not consistent with the applied loads,
corrections must be provided from the former, e.g. by plotting regression lines that
are best fit curves on the charts of gathered data in all load conditions.
The balance readings have been verified in numerous cases, by varying the weight on
the balance center, the pitching, yawing, and rolling moments, and the side force
applied at several distances from the balance center, in both horizontal and vertical
directions. Most of the loads have been applied for the weight and pitching moment
conditions discussed in the previous sections.
Results provided that the yawing moment N is not affected by the eccentricity of the
applied loads, whereas the sideforce Y and the rolling moment ℒ do, suggesting the
following correction:
corr mea corns Y rYY Y err N err (3.4)
0.98corr meas err N (3.5)

Wind tunnel tests of a modular aircraft model
Candidate: Nicola Bochicchio (matr.517/985) Pag. | 48
Where
corrY is the sideforce corrected for the effects of yawing and rolling moments
meansY is the uncorrected sideforce read by the wind tunnel software
Yerr N is the sideforce error due to the applied yawing moment N
orrY cerr is the sideforce error due to the corrected rolling moment corr
meas is the measured rolling moment
err N is the rolling moment error due to the applied yawing moment N
The error functions are defined as
3 20.0034 0.0040 0.0821Yerr N N N N (3.6)
3 20.0025 0.0109 0.1118err N N N N (3.7)
0.24corr orrY cerr (3.8)
which allow the correct results in output.
Finally, the off-center load cell (Section 3.3.1) has been calibrated. The
procedure is very simple, since it is a single axis load cell. Its end with the
acquisition cable has been fixed to a rigid constraint, with the sensible side parallel to
the ground. At the other end a known mass has been suspended. From the tension
read on the PC display, the tare constant has been calculated from the simple
relationship:
cellForce K Tension (3.9)
where cellK has the dimension of Kgf/V. The tare has then been verified by
mounting the cell in the fuselage tail-cone and the vertical tail on the cell and
applying a known mass in several positions to check the load cell readings. The
installation of the off-center cell has been already described in Section 2.6 and shown
in Fig 2.13 and Fig 2.14. Fig 3.11, instead, shows the test of the off-center load cell
with the application of a know mass.

Wind tunnel tests of a modular aircraft model
Candidate: Nicola Bochicchio (matr.517/985) Pag. | 49
Fig 3. 11 – Test of the off-center load cell
Fig 3. 12 – Flow visualization on vertical tail
Fig 3. 13 – Flow visualization on wing
Wind tunnel tests of a modular aircraft model
Candidate: Nicola Bochicchio (matr.517/985) Pag. | 50
3.5.2 Scale effect and trip strips
The term scale effects refers to differences that arise when the fluid dynamic
dimensionless parameters, mainly the Reynolds number, are not the same in low
speed wind tunnel tests and flight operations. Reynolds number is defined as
ReVc
(3.10)
where ρ is the air density, V is the air speed, c is the wing mean aerodynamic chord
(which is the reference length) and μ is the viscosity of the air. For the model
investigated c = 0.182 m and all tests have been performed at a wind speed of about
40 m/s (the maximum available wind speed is about 50 m/s) with a Reynolds
number of about 500 000.
For a large turbopropeller aircraft, the characteristic wing chord c is between 2.5 and
3.0 m, while the entire aircraft can be 30 m long. It is clear that full Reynolds number
are not easily achievable in a wind tunnel, also because of power requirements (see
again Tab 3.1), unless the air temperature is decreased to reduce its viscosity and the
total pressure is increased to arise the air density, as done in high speed wind tunnels.
Since the Reynolds number of low-speed wind tunnels cannot be the same of flight
conditions, other artifices are needed to replicate the boundary layer of the full scale
aircraft, otherwise laminar separations will affect the measurements. A simple and
effective mean to comply with this need is the trip strip, which is an artificial
roughness added to the model to fix the location of the transition from a laminar to
turbulent boundary layer on the model. A correct installation prevents the realization
of laminar bubbles and their consequences on the aerodynamic behaviour of the
model. Trip strips made of adhesive tape with triangular edges have been placed on
all components of the aircraft in order to promote the transition of the flow. The
thickness and the right position of the trip strips has been estimated by tests of flow
visualization through the use of fluorescent oil, as shown in Fig 3.12 and Fig. 3.13.
Results lead to the conclusion that two layers of tape are sufficient to get the
boundary layer transition at the desired place. The location of the trip strips is at
about 5% local chord for wing and horizontal tail, even closer to the leading edge for
the vertical tail, whereas they have been placed at 20% nose length on the fuselage.

Wind tunnel tests of a modular aircraft model
Candidate: Nicola Bochicchio (matr.517/985) Pag. | 51
3.6 WIND TUNNEL CORRECTIONS
In wind tunnel testing there are some constraints due by the nature of the tunnel
itself. While there is no difference in having the model at rest and the air moving
around it, the distances of some or all of the stream boundaries from the article under
test are usually less than the corresponding distances for actual operations. In
addition, the flow properties in the test section may not be the same in space and
time. To include appropriate corrections, the following effects must be considered:
Horizontal buoyancy. It refers to a variation of static pressure along the test
section when no model is present. It produces a drag force analogous to the
hydrostatic force on objects in a stationary fluid in a uniform gravitational
field.
Solid blockage. It is linked to the volume occupied by the model in the test
section. This is the most influent effect, since it produces a variation in
oncoming dynamic pressure. Essentially, the wind tunnel is a tube where the
model in the test section “chokes” the flow. This effect produces surface
stresses larger than the corresponding free-air operations. The stress
distribution is assumed to be unchanged.
Wake blockage. Every body immersed in a moving fluid has a wake, which
size is function of the body shape and (in wind tunnel testing) of the ratio
between the wake area and the tunnel area. The wake has a mean velocity
lower than the free stream. According to the law of continuity, the velocity
outside the wake in a closed tunnel must be higher than the free stream. By
Bernoulli’s principle, the higher velocity in the main stream has a lowered
pressure. As the boundary layer on the model (which later becomes the wake)
grows, the model is put in a pressure gradient, hence there is a velocity
increment on the model.

Wind tunnel tests of a modular aircraft model
Candidate: Nicola Bochicchio (matr.517/985) Pag. | 52
Streamlines curvature. It refers to an alteration to the curvature of the
streamlines of the flow about a body in a wind tunnel as compared to the
corresponding curvature in an infinite stream. In a closed tunnel, the lift,
pitching moment, hinge moments, and angle of attack are increased.
Normal downwash change. It refers to the component of induced flow in the
lift direction at the test article and it is due to the finite distances to the
boundaries. In a closed jet, the lift produced is too large and the drag too
small at a given geometric angle of attack, corresponding to a smaller
downwash.
Spanwise downwash distortion. It refers to an alteration to the local angle of
attack along the span of a lifting wing. In a closed test section the angle of
attack near the wingtips of a model with large span are increased, making the
tip stall start at a lower geometric angle of attack. This effect becomes
negligible if the model span is less than 0.8 the tunnel width.
Tail downwash change. It refers to an alteration to the normal downwash
behind the wing, so that the static stability is unnaturally increased.
These effects, in particular the solid blockage and the wake blockage, have been
assessed for the model in all configurations and inserted in the wind tunnel software
to have in output both the corrected and uncorrected values.
The solid blockage coefficients useful to apply the wind tunnel corrections has been
determined on the basis of the aircraft components volumes as suggested by Barlow,
Rae, and Pope (Ref [6]).
Wind tunnel tests of a modular aircraft model
Candidate: Nicola Bochicchio (matr.517/985) Pag. | 53
CHAPTER 4 - WIND TUNNEL TESTS
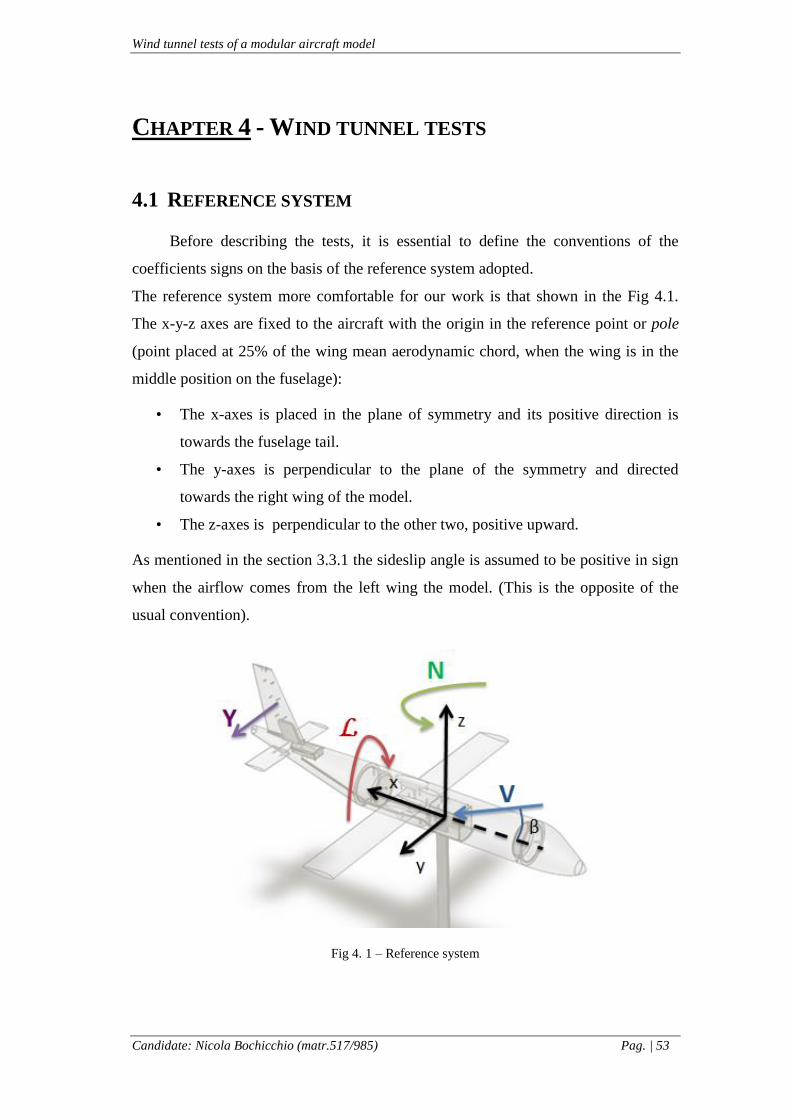
4.1 REFERENCE SYSTEM
Before describing the tests, it is essential to define the conventions of the
coefficients signs on the basis of the reference system adopted.
The reference system more comfortable for our work is that shown in the Fig 4.1.
The x-y-z axes are fixed to the aircraft with the origin in the reference point or pole
(point placed at 25% of the wing mean aerodynamic chord, when the wing is in the
middle position on the fuselage):
• The x-axes is placed in the plane of symmetry and its positive direction is
towards the fuselage tail.
• The y-axes is perpendicular to the plane of the symmetry and directed
towards the right wing of the model.
• The z-axes is perpendicular to the other two, positive upward.
As mentioned in the section 3.3.1 the sideslip angle is assumed to be positive in sign
when the airflow comes from the left wing the model. (This is the opposite of the
usual convention).
Fig 4. 1 – Reference system

Wind tunnel tests of a modular aircraft model
Candidate: Nicola Bochicchio (matr.517/985) Pag. | 54
4.2 TEST PROCEDURE
The typical experimental test is structured as follow:
Setup of the configuration
Data acquisition
Data elaboration and storage
4.1.1 Setup of the configuration
The test’s list has also been made in order to switch among configurations in a
short time. The objective is to consider partial aircraft configurations and
subsequently the complete aircraft configuration in order to provide data about
aerodynamics interference among aircraft components in sideslip condition.
4.1.2 Data acquisition
The data acquisition procedure is stepped as follows:
• The tunnel is set on and led to the operative conditions.
• The model is set at the zero sideslip condition. The operator acquires the data
at each attitude after a waiting time of about 3 second to grant a stationary
condition of the flow. The acquisition software samples data at 100 Hz,
printing at video the mean value of the last 200 acquired data.
• Once the zero sideslip conditions have been acquired, the model is turned at
the about -6° sideslip with a step of 2°. Subsequently the operator brings back
the model to the initial attitude and the sampling continues till the sideslip
angle of about +12°, with a sampling step of about 2°. During a test the
operator must monitor values of the sideslip angle on the PC and on a special
bearing scale positioned on the floor of the test chamber.

Wind tunnel tests of a modular aircraft model
Candidate: Nicola Bochicchio (matr.517/985) Pag. | 55
4.1.3 Data elaboration and storage
The aerodynamic force and moment coefficients are calculated by the acquired
measurement of forces and dynamic pressures.
To these coefficients two different corrections have been applied:
• Wind tunnel corrections. As already discussed in section 3.6, the wind
tunnel walls presence produce a lateral constraint to the flow pattern about
the body, this is known as solid blockage. The solid blockage leads to an
increase of the dynamic pressure, increasing all forces and moment at a given
sideslip angle. Wind tunnel walls produce also a constraint for the wake,
known as wake blockage, which increases with the wake size. In Tab 4.1 are
reported solid blockage and wake blockage coefficients useful to apply the
wind tunnel corrections.
Solid blockage for combinations
Config. V Av 1.0 V Av 1.5 V Av 2.0
BV 0.010219 0.010257 0.010281
WBV 0.011272 0.011310 0.011334
WBVH 0.011411 0.011449 0.011473
BVH 0.010358 0.010395 0.010419
WB 0.011114 0.011114 0.011114
Wake blockage for combinations
Config. V Av 1.0 V Av 1.5 V Av 2.0
BV 0.000051 0.000070 0.000085
WBV 0.000764 0.000775 0.000783
WBVH 0.000839 0.000850 0.000858
BVH 0.000093 0.000095 0.000097
WB 0.000730 0.000730 0.000730
Tab. 4. 1 – Solid and wake blockage coefficients for the wind tunnel corrections.

Wind tunnel tests of a modular aircraft model
Candidate: Nicola Bochicchio (matr.517/985) Pag. | 56
• Moments transfer. The point placed at 25% of the wing mean aerodynamic
chord, when the wing is in the middle position on the fuselage, has been
chosen as the reference point for the calculation of the aerodynamic forces
and moments. Since the balance center does not coincide with the chosen
reference point, the aerodynamic moments must be transferred to the desired
reference point.
Fig 4.2 schematically illustrates the location of the reference point, its
distances from the balance center and the distances of the aerodynamic center
of the various vertical tails investigated from the balance center.
The transfer of the rolling and yawing moment from the balance center to the
chosen reference point can be expressed as shown in Eq 4.1 and Eq. 4.2:
pole cb yN N F x (4.1)
pole cb yF z (4.2)
where the quantities ∆x=-199.30 mm and ∆z = 30.60 mm are the longitudinal
and vertical distances of the chosen reference point from the balance center
respectively.
Fig 4. 2 – Location of the reference point

Wind tunnel tests of a modular aircraft model
Candidate: Nicola Bochicchio (matr.517/985) Pag. | 57
4.3 THE EXPERIMENTAL TESTS CAMPAIGN
4.3.1 Preliminary tests
The preliminary tests is for the valuation of the scale effects. As already discussed in
the section 3.6, trip strips have been placed on all components of the aircraft in order
to promote the transition of the flow. Transitional strips have been placed about 5%
of local chord, both on the lower and upper surface, for wing and horizontal tail,
even closer to the leading edge for the vertical tail, whereas they have been placed at
20% nose length on the fuselage. The thickness adopted is about 0.2 mm (two layers
of tape).
Fig 4.3 show the effects of the trip strips on the global yawing moment coefficient at
two different values of velocity.
Fig 4. 3 – Preliminary tests (Trip strips)
-0.08
-0.06
-0.04
-0.02
0
0.02
0.04
0.06
0.08
0.1
0.12
-15 -10 -5 0 5 10 15 20
CN
beta (deg)
STRIP - V=35m/s
STRIP - V=30m/s
NO STRIP
Wind tunnel tests of a modular aircraft model
Candidate: Nicola Bochicchio (matr.517/985) Pag. | 58
4.3.2 Configurations results
The results were collected from 49 configurations that include two different
positions of the wing respect to the fuselage (high and low wing), variation in shape
of the vertical tail’s planform and variations of the position of the horizontal plane.
The experimental tests campaign involved only the fuselage tail cone with the
parameter 1ftc fz r , symbolically indicated as Body High (BH).
The vertical tails have been labeled as V10, V15 V20 according to the aspect ratio
value, ARv=1.0, ARv=1.5 and ARv=2.0.
The wing’s position respect to the fuselage has been labeled as WH (Wing high) or
WL (Wing Low).
The position of the horizontal plane has been labeled according to the figure 4.3,
where H5 identifies the T-tail configuration, H2, H3 and H4 identify the cruciform
configurations while H1 identifies the body mounted tail configuration. (The
cruciform configuration H2 was planned only for the vertical tail with ARv=2.0).
The Fig 4.5 shows the configuration with high wing, vertical tail of ARv=20 and T-
empennage. According to the notation above mentioned it is labeled with the ID:
BH_WH_V20_H5
For each configuration the yawing moment coefficient, the rolling moment
coefficient, and the lateral-directional stability derivatives has been measured.
All the tested configurations, together with lateral-directional stability derivatives are
shown in the Tab 4.2 .
Thanks to the adoption of the off-center load cell, it was measured also the contribute
of the vertical tailplane on the directional stability derivative.
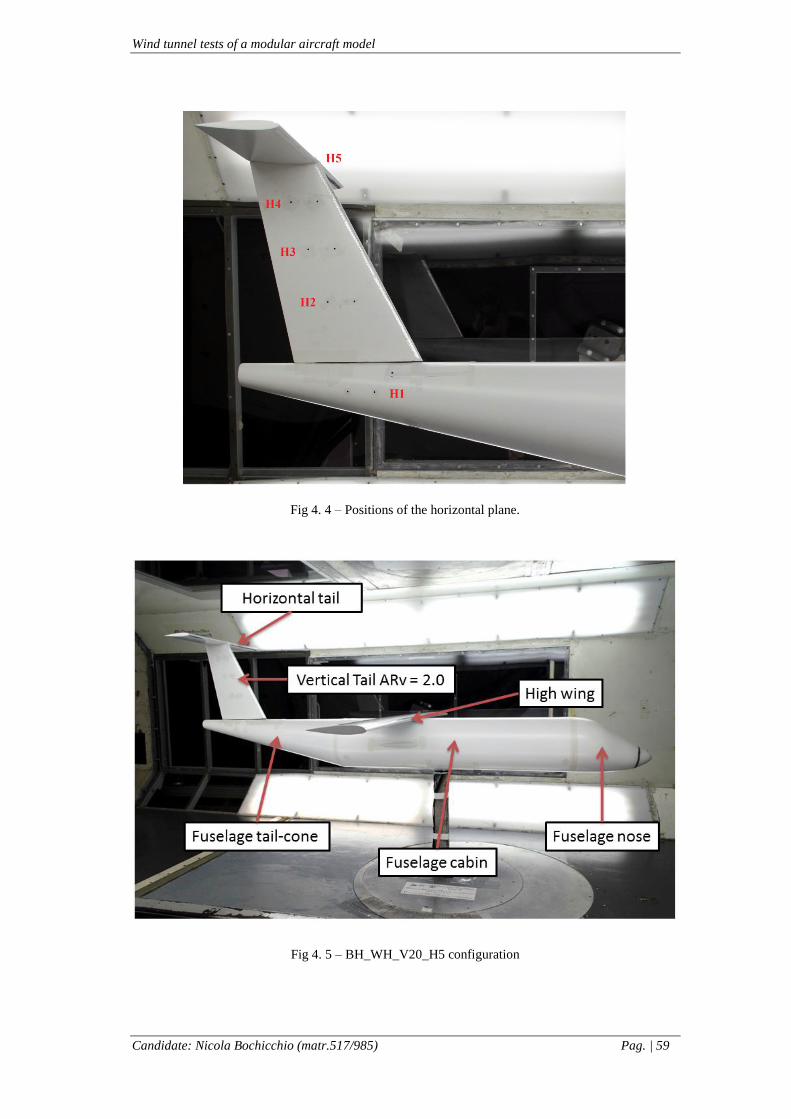
Wind tunnel tests of a modular aircraft model
Candidate: Nicola Bochicchio (matr.517/985) Pag. | 59
Fig 4. 4 – Positions of the horizontal plane.
Fig 4. 5 – BH_WH_V20_H5 configuration
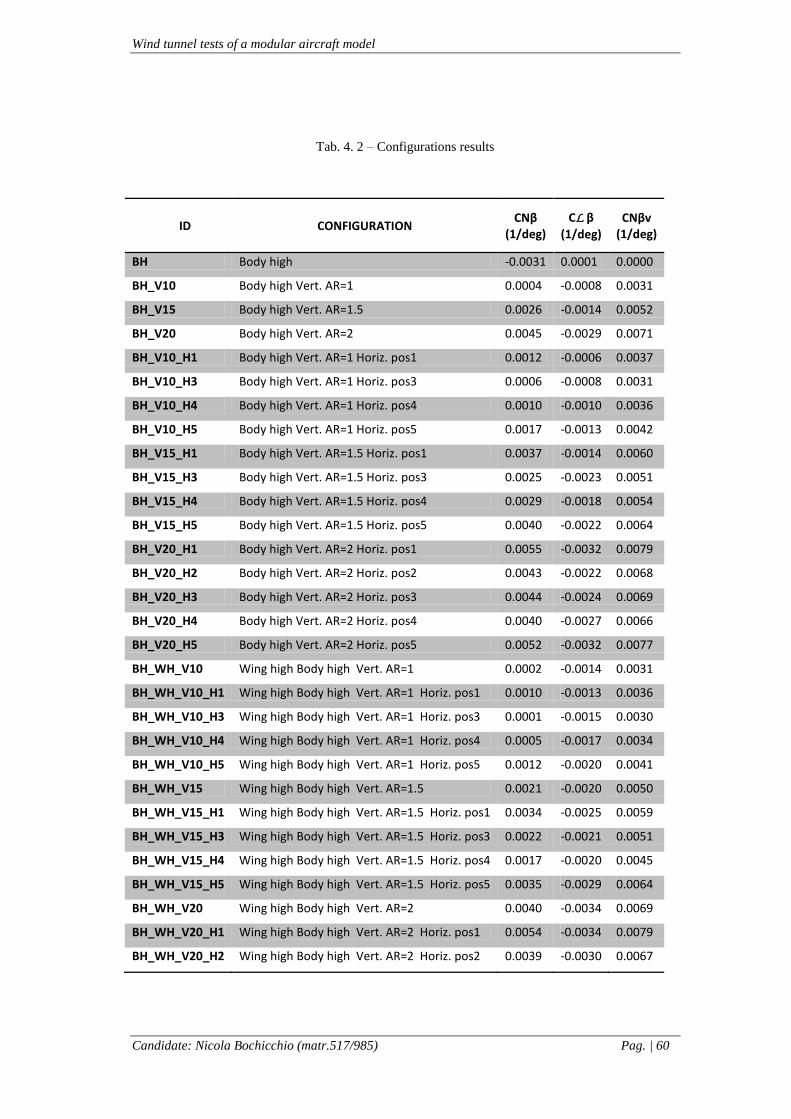
Wind tunnel tests of a modular aircraft model
Candidate: Nicola Bochicchio (matr.517/985) Pag. | 60
Tab. 4. 2 – Configurations results
ID CONFIGURATION CNβ
(1/deg) CL β
(1/deg) CNβv
(1/deg)
BH Body high -0.0031 0.0001 0.0000
BH_V10 Body high Vert. AR=1 0.0004 -0.0008 0.0031
BH_V15 Body high Vert. AR=1.5 0.0026 -0.0014 0.0052
BH_V20 Body high Vert. AR=2 0.0045 -0.0029 0.0071
BH_V10_H1 Body high Vert. AR=1 Horiz. pos1 0.0012 -0.0006 0.0037
BH_V10_H3 Body high Vert. AR=1 Horiz. pos3 0.0006 -0.0008 0.0031
BH_V10_H4 Body high Vert. AR=1 Horiz. pos4 0.0010 -0.0010 0.0036
BH_V10_H5 Body high Vert. AR=1 Horiz. pos5 0.0017 -0.0013 0.0042
BH_V15_H1 Body high Vert. AR=1.5 Horiz. pos1 0.0037 -0.0014 0.0060
BH_V15_H3 Body high Vert. AR=1.5 Horiz. pos3 0.0025 -0.0023 0.0051
BH_V15_H4 Body high Vert. AR=1.5 Horiz. pos4 0.0029 -0.0018 0.0054
BH_V15_H5 Body high Vert. AR=1.5 Horiz. pos5 0.0040 -0.0022 0.0064
BH_V20_H1 Body high Vert. AR=2 Horiz. pos1 0.0055 -0.0032 0.0079
BH_V20_H2 Body high Vert. AR=2 Horiz. pos2 0.0043 -0.0022 0.0068
BH_V20_H3 Body high Vert. AR=2 Horiz. pos3 0.0044 -0.0024 0.0069
BH_V20_H4 Body high Vert. AR=2 Horiz. pos4 0.0040 -0.0027 0.0066
BH_V20_H5 Body high Vert. AR=2 Horiz. pos5 0.0052 -0.0032 0.0077
BH_WH_V10 Wing high Body high Vert. AR=1 0.0002 -0.0014 0.0031
BH_WH_V10_H1 Wing high Body high Vert. AR=1 Horiz. pos1 0.0010 -0.0013 0.0036
BH_WH_V10_H3 Wing high Body high Vert. AR=1 Horiz. pos3 0.0001 -0.0015 0.0030
BH_WH_V10_H4 Wing high Body high Vert. AR=1 Horiz. pos4 0.0005 -0.0017 0.0034
BH_WH_V10_H5 Wing high Body high Vert. AR=1 Horiz. pos5 0.0012 -0.0020 0.0041
BH_WH_V15 Wing high Body high Vert. AR=1.5 0.0021 -0.0020 0.0050
BH_WH_V15_H1 Wing high Body high Vert. AR=1.5 Horiz. pos1 0.0034 -0.0025 0.0059
BH_WH_V15_H3 Wing high Body high Vert. AR=1.5 Horiz. pos3 0.0022 -0.0021 0.0051
BH_WH_V15_H4 Wing high Body high Vert. AR=1.5 Horiz. pos4 0.0017 -0.0020 0.0045
BH_WH_V15_H5 Wing high Body high Vert. AR=1.5 Horiz. pos5 0.0035 -0.0029 0.0064
BH_WH_V20 Wing high Body high Vert. AR=2 0.0040 -0.0034 0.0069
BH_WH_V20_H1 Wing high Body high Vert. AR=2 Horiz. pos1 0.0054 -0.0034 0.0079
BH_WH_V20_H2 Wing high Body high Vert. AR=2 Horiz. pos2 0.0039 -0.0030 0.0067

Wind tunnel tests of a modular aircraft model
Candidate: Nicola Bochicchio (matr.517/985) Pag. | 61
BH_WH_V20_H3 Wing high Body high Vert. AR=2 Horiz. pos3 0.0039 -0.0035 0.0068
BH_WH_V20_H4 Wing high Body high Vert. AR=2 Horiz. pos4 0.0042 -0.0038 0.0071
BH_WH_V20_H5 Wing high Body high Vert. AR=2 Horiz. pos5 0.0051 -0.0047 0.0079
BH_WL_V10 Wing low Body high Vert. AR=1 0.0009 0.0008 0.0033
BH_WL_V10_H1 Wing low Body high Vert. AR=1 Horiz. pos1 0.0016 0.0008 0.0038
BH_WL_V10_H3 Wing low Body high Vert. AR=1 Horiz. pos3 0.0010 0.0006 0.0032
BH_WL_V10_H4 Wing low Body high Vert. AR=1 Horiz. pos4 0.0014 0.0004 0.0037
BH_WL_V10_H5 Wing low Body high Vert. AR=1 Horiz. pos5 0.0021 0.0000 0.0044
BH_WL_V15 Wing low Body high Vert. AR=1.5 0.0030 -0.0004 0.0053
BH_WL_V15_H1 Wing low Body high Vert. AR=1.5 Horiz. pos1 0.0041 -0.0001 0.0062
BH_WL_V15_H3 Wing low Body high Vert. AR=1.5 Horiz. pos3 0.0031 -0.0003 0.0053
BH_WL_V15_H4 Wing low Body high Vert. AR=1.5 Horiz. pos4 0.0029 -0.0003 0.0051
BH_WL_V15_H5 Wing low Body high Vert. AR=1.5 Horiz. pos5 0.0044 -0.0015 0.0066
BH_WL_V20 Wing low Body high Vert. AR=2 0.0051 -0.0013 0.0074
BH_WL_V20_H1 Wing low Body high Vert. AR=2 Horiz. pos1 0.0062 -0.0020 0.0083
BH_WL_V20_H2 Wing low Body high Vert. AR=2 Horiz. pos2 0.0049 -0.0018 0.0072
BH_WL_V20_H3 Wing low Body high Vert. AR=2 Horiz. pos3 0.0051 -0.0012 0.0073
BH_WL_V20_H4 Wing low Body high Vert. AR=2 Horiz. pos4 0.0048 -0.0018 0.0071
BH_WL_V20_H5 Wing low Body high Vert. AR=2 Horiz. pos5 0.0066 -0.0027 0.0087
After the list of the tested configurations it is interesting to compare the trend of the
yawing moment coefficient, the rolling moment coefficient and the yawing moment
coefficient for isolated fuselage, a body-vertical tail configuration and this latter
configuration with also the horizontal tail..
The body isolated is shown in the Fig 4.6 a).
The body-vertical chosen configuration is BH_V15 and is shown in Fig 4.6 b).
For these latter we have considered the body mounted tail configuration that is
labeled with ID: BH_V15_H1 and is shown in the Fig 4.6 c).

Wind tunnel tests of a modular aircraft model
Candidate: Nicola Bochicchio (matr.517/985) Pag. | 62
Fig 4. 6 – a) BH; b) BH_V15; c) BH_V15_H1
BH
BH_V15
BH_V15_H1

Wind tunnel tests of a modular aircraft model
Candidate: Nicola Bochicchio (matr.517/985) Pag. | 63
Fig 4. 7 – CN versus β
Fig 4. 8 – CN_vertical versus β
-0.08
-0.06
-0.04
-0.02
0
0.02
0.04
0.06
0.08
-10 -5 0 5 10 15 20 25
CN
beta (deg)
BH
BH_V15
BH_V15_H1
-0.06
-0.04
-0.02
0
0.02
0.04
0.06
0.08
0.1
0.12
-10 -5 0 5 10 15 20 25
CN
ve
rtic
al t
ail
beta (deg)
BH
BH_V15
BH_V15_H1
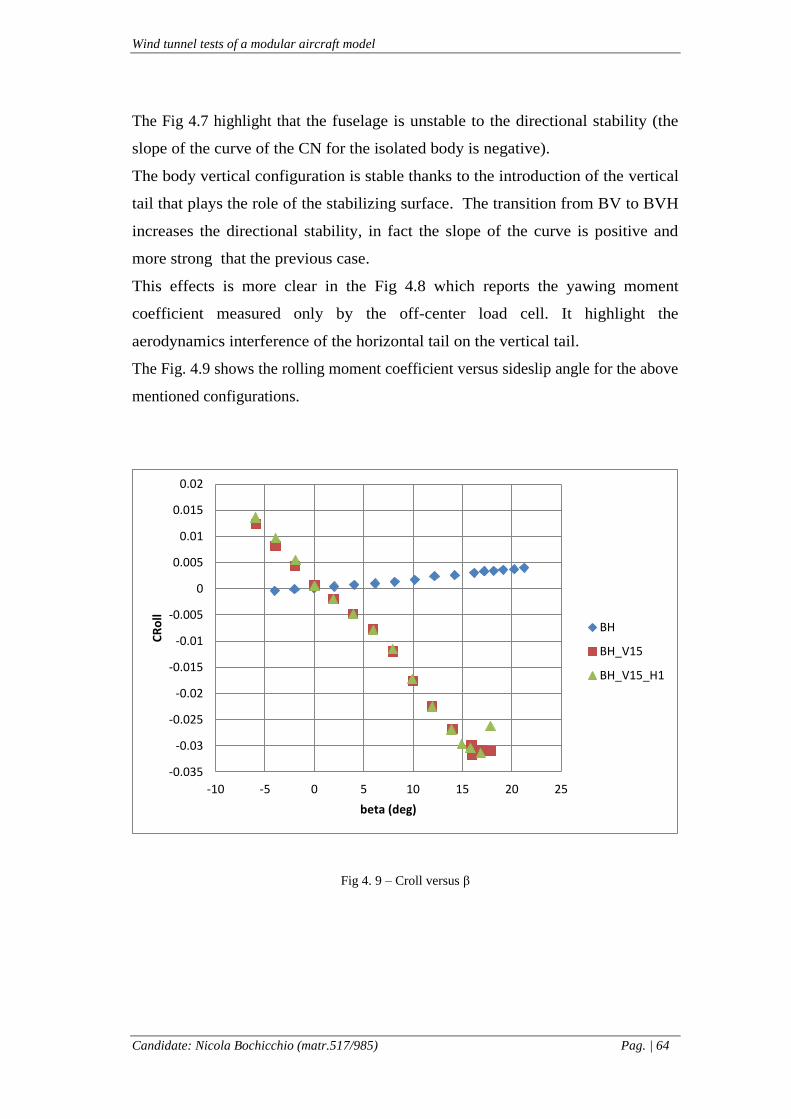
Wind tunnel tests of a modular aircraft model
Candidate: Nicola Bochicchio (matr.517/985) Pag. | 64
The Fig 4.7 highlight that the fuselage is unstable to the directional stability (the
slope of the curve of the CN for the isolated body is negative).
The body vertical configuration is stable thanks to the introduction of the vertical
tail that plays the role of the stabilizing surface. The transition from BV to BVH
increases the directional stability, in fact the slope of the curve is positive and
more strong that the previous case.
This effects is more clear in the Fig 4.8 which reports the yawing moment
coefficient measured only by the off-center load cell. It highlight the
aerodynamics interference of the horizontal tail on the vertical tail.
The Fig. 4.9 shows the rolling moment coefficient versus sideslip angle for the above
mentioned configurations.
Fig 4. 9 – Croll versus β
-0.035
-0.03
-0.025
-0.02
-0.015
-0.01
-0.005
0
0.005
0.01
0.015
0.02
-10 -5 0 5 10 15 20 25
CR
oll
beta (deg)
BH
BH_V15
BH_V15_H1

Wind tunnel tests of a modular aircraft model
Candidate: Nicola Bochicchio (matr.517/985) Pag. | 65
It is now interesting evaluate the effect of the wing on the yawing moment
coefficient curve and on the rolling moment coefficient curve.
The Fig 4.10 and 4.11 show the configurations BH_WH_V15_H1 and
BH_WL_V15_H1.
Fig 4. 10 - BH_WH_V15_H1
Fig 4. 11 - BH_WL_V15_H1
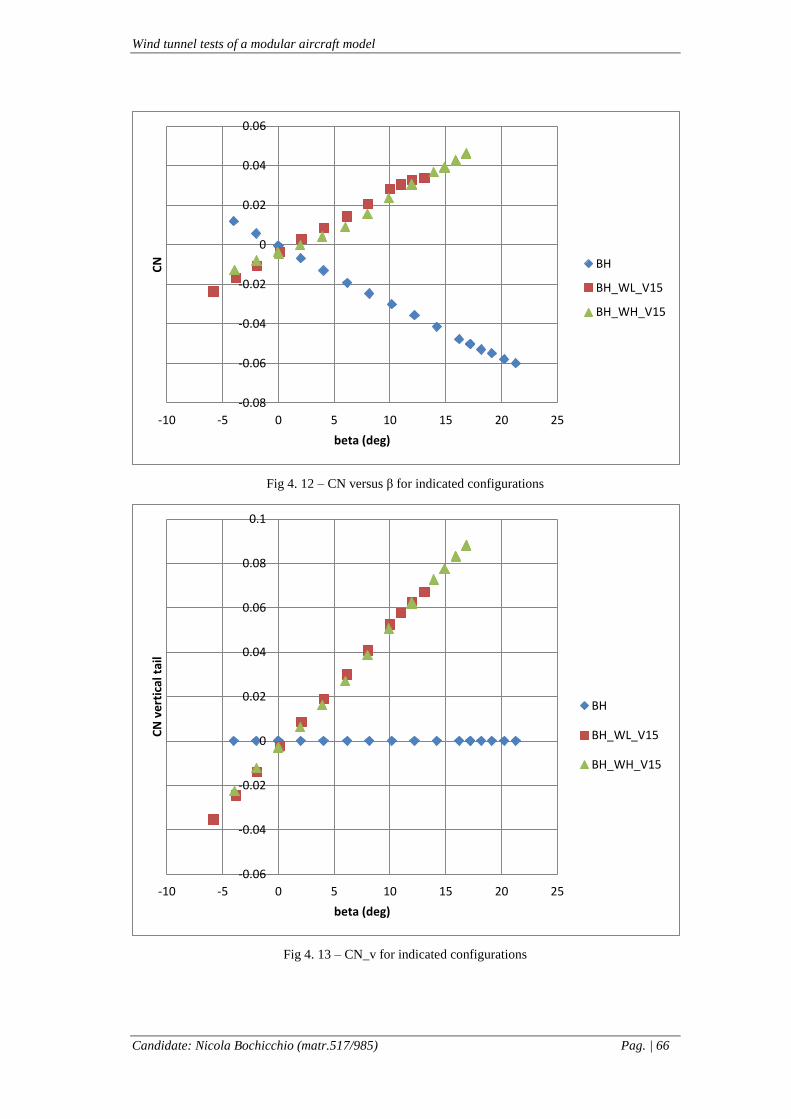
Wind tunnel tests of a modular aircraft model
Candidate: Nicola Bochicchio (matr.517/985) Pag. | 66
Fig 4. 12 – CN versus β for indicated configurations
Fig 4. 13 – CN_v for indicated configurations
-0.08
-0.06
-0.04
-0.02
0
0.02
0.04
0.06
-10 -5 0 5 10 15 20 25
CN
beta (deg)
BH
BH_WL_V15
BH_WH_V15
-0.06
-0.04
-0.02
0
0.02
0.04
0.06
0.08
0.1
-10 -5 0 5 10 15 20 25
CN
ve
rtic
al t
ail
beta (deg)
BH
BH_WL_V15
BH_WH_V15

Wind tunnel tests of a modular aircraft model
Candidate: Nicola Bochicchio (matr.517/985) Pag. | 67
Fig 4. 14 . Croll versus β for indicated configurations
The Fig 4.16 and Fig 4.17 show the effect of the position of the wing on the yawing
moment coefficient curve versus β and on the rolling moment coefficient curve
versus β.
We can see that the complete configuration with low wing has the slope of the
yawing moment coefficient curve positive and stronger than that of the same
configuration but with high wing.
The configuration BH_WH_V15_H1 has more lateral static stability respect the
configuration BH_WL_V15_H1. This phenomenon can be easily explained looking
the Fig. 4.17 A) and B).
Fig 4. 15 – Effect of wing position respect the fuselage in sideslip conditions
-0.07
-0.06
-0.05
-0.04
-0.03
-0.02
-0.01
0
0.01
-10 -5 0 5 10 15 20 25
CR
oll
beta (deg)
BH
BH_WL_V15
BH_WH_V15
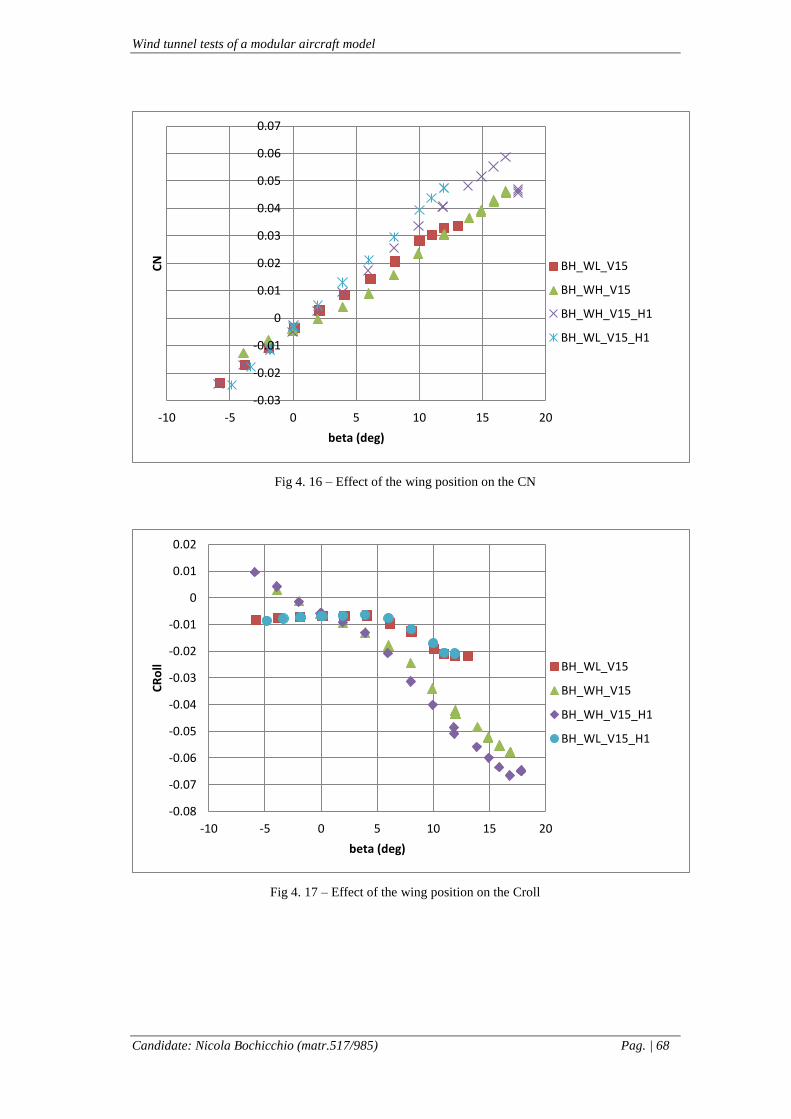
Wind tunnel tests of a modular aircraft model
Candidate: Nicola Bochicchio (matr.517/985) Pag. | 68
Fig 4. 16 – Effect of the wing position on the CN
Fig 4. 17 – Effect of the wing position on the Croll
-0.03
-0.02
-0.01
0
0.01
0.02
0.03
0.04
0.05
0.06
0.07
-10 -5 0 5 10 15 20
CN
beta (deg)
BH_WL_V15
BH_WH_V15
BH_WH_V15_H1
BH_WL_V15_H1
-0.08
-0.07
-0.06
-0.05
-0.04
-0.03
-0.02
-0.01
0
0.01
0.02
-10 -5 0 5 10 15 20
CR
oll
beta (deg)
BH_WL_V15
BH_WH_V15
BH_WH_V15_H1
BH_WL_V15_H1

Wind tunnel tests of a modular aircraft model
Candidate: Nicola Bochicchio (matr.517/985) Pag. | 69
4.3.3 Mutual aerodynamic interference effect
Body-vertical tail mutual interference effects
It is particularly important show the mutual interference effects between fuselage and
vertical tail in sideslip condition. For this scope we have tested in wind tunnel the
isolated fuselage and the combination body-vertical varying the aspect ratio ARv.
Fig 4. 18 – BH_V10
Fig 4. 19 – BH_V15
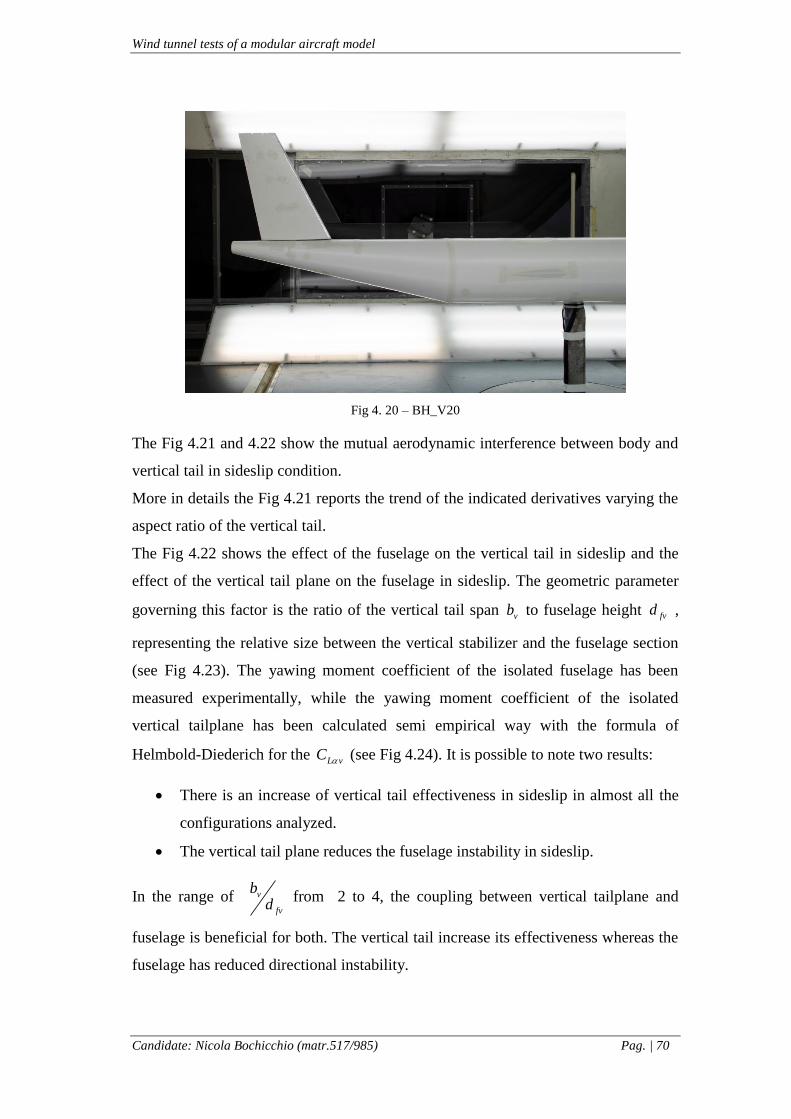
Wind tunnel tests of a modular aircraft model
Candidate: Nicola Bochicchio (matr.517/985) Pag. | 70
Fig 4. 20 – BH_V20
The Fig 4.21 and 4.22 show the mutual aerodynamic interference between body and
vertical tail in sideslip condition.
More in details the Fig 4.21 reports the trend of the indicated derivatives varying the
aspect ratio of the vertical tail.
The Fig 4.22 shows the effect of the fuselage on the vertical tail in sideslip and the
effect of the vertical tail plane on the fuselage in sideslip. The geometric parameter
governing this factor is the ratio of the vertical tail span vb to fuselage height fvd ,
representing the relative size between the vertical stabilizer and the fuselage section
(see Fig 4.23). The yawing moment coefficient of the isolated fuselage has been
measured experimentally, while the yawing moment coefficient of the isolated
vertical tailplane has been calculated semi empirical way with the formula of
Helmbold-Diederich for the L vC (see Fig 4.24). It is possible to note two results:
There is an increase of vertical tail effectiveness in sideslip in almost all the
configurations analyzed.
The vertical tail plane reduces the fuselage instability in sideslip.
In the range of v
fv
bd
from 2 to 4, the coupling between vertical tailplane and
fuselage is beneficial for both. The vertical tail increase its effectiveness whereas the
fuselage has reduced directional instability.
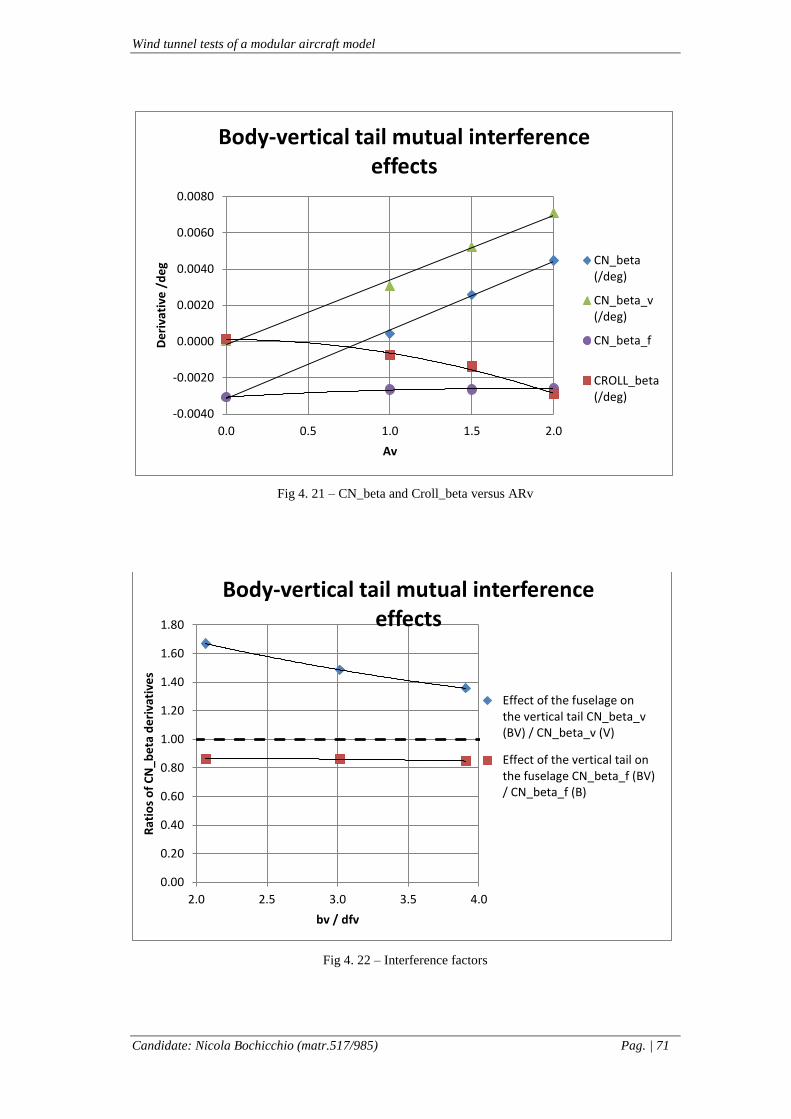
Wind tunnel tests of a modular aircraft model
Candidate: Nicola Bochicchio (matr.517/985) Pag. | 71
Fig 4. 21 – CN_beta and Croll_beta versus ARv
Fig 4. 22 – Interference factors
-0.0040
-0.0020
0.0000
0.0020
0.0040
0.0060
0.0080
0.0 0.5 1.0 1.5 2.0
De
riva
tive
/d
eg
Av
Body-vertical tail mutual interference effects
CN_beta(/deg)
CN_beta_v(/deg)
CN_beta_f
CROLL_beta(/deg)
0.00
0.20
0.40
0.60
0.80
1.00
1.20
1.40
1.60
1.80
2.0 2.5 3.0 3.5 4.0
Rat
ios
of
CN
_be
ta d
eri
vati
ves
bv / dfv
Body-vertical tail mutual interference effects
Effect of the fuselage onthe vertical tail CN_beta_v(BV) / CN_beta_v (V)
Effect of the vertical tail onthe fuselage CN_beta_f (BV)/ CN_beta_f (B)
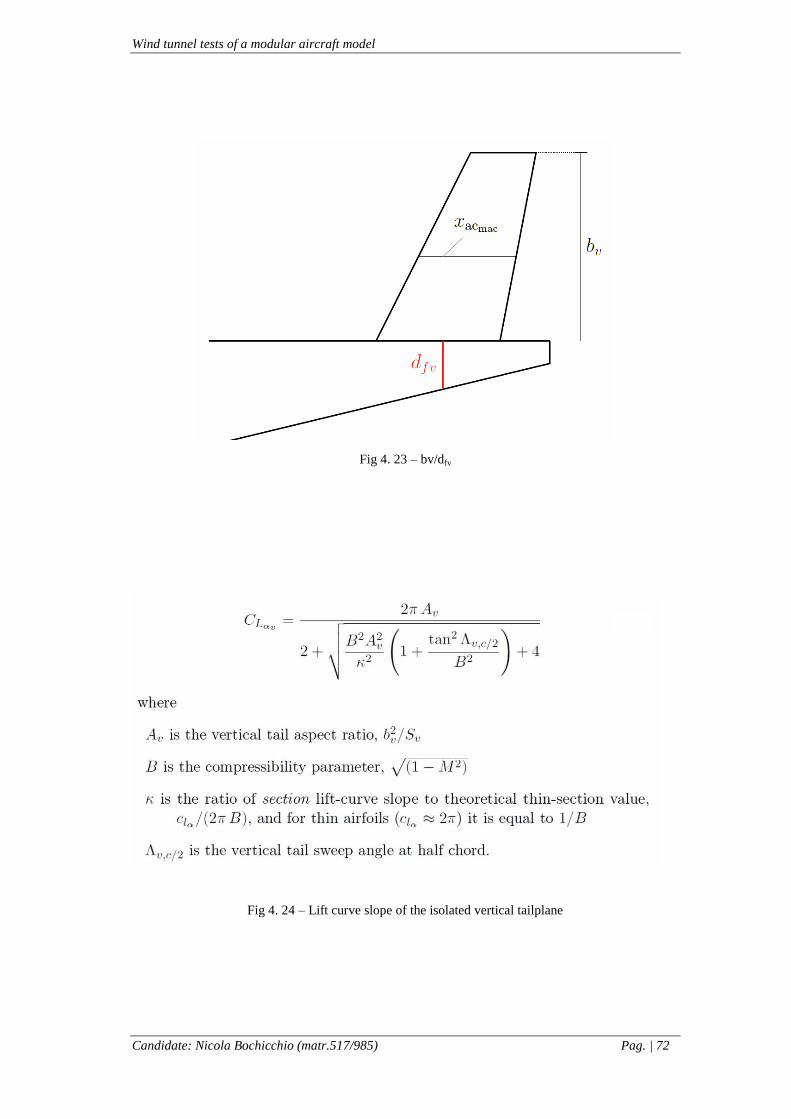
Wind tunnel tests of a modular aircraft model
Candidate: Nicola Bochicchio (matr.517/985) Pag. | 72
Fig 4. 23 – bv/dfv
Fig 4. 24 – Lift curve slope of the isolated vertical tailplane
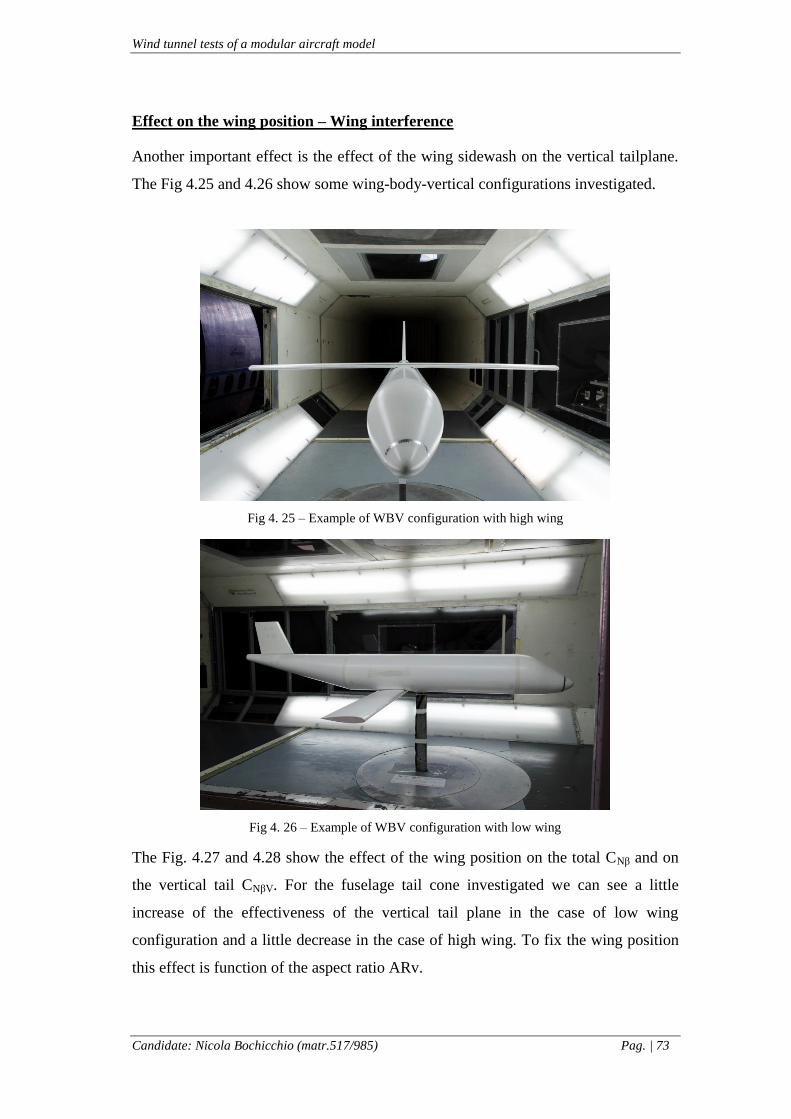
Wind tunnel tests of a modular aircraft model
Candidate: Nicola Bochicchio (matr.517/985) Pag. | 73
Effect on the wing position – Wing interference
Another important effect is the effect of the wing sidewash on the vertical tailplane.
The Fig 4.25 and 4.26 show some wing-body-vertical configurations investigated.
Fig 4. 25 – Example of WBV configuration with high wing
Fig 4. 26 – Example of WBV configuration with low wing
The Fig. 4.27 and 4.28 show the effect of the wing position on the total CNβ and on
the vertical tail CNβV. For the fuselage tail cone investigated we can see a little
increase of the effectiveness of the vertical tail plane in the case of low wing
configuration and a little decrease in the case of high wing. To fix the wing position
this effect is function of the aspect ratio ARv.
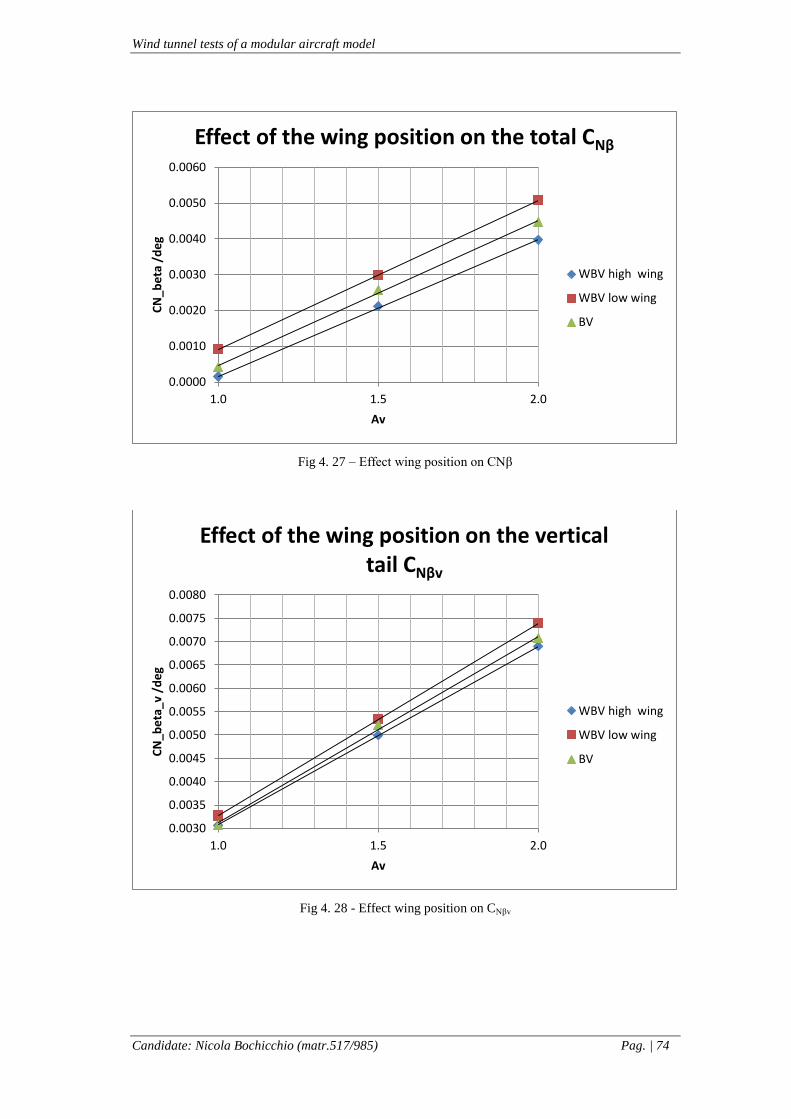
Wind tunnel tests of a modular aircraft model
Candidate: Nicola Bochicchio (matr.517/985) Pag. | 74
Fig 4. 27 – Effect wing position on CNβ
Fig 4. 28 - Effect wing position on CNβv
0.0000
0.0010
0.0020
0.0030
0.0040
0.0050
0.0060
1.0 1.5 2.0
CN
_be
ta /
de
g
Av
Effect of the wing position on the total CNβ
WBV high wing
WBV low wing
BV
0.0030
0.0035
0.0040
0.0045
0.0050
0.0055
0.0060
0.0065
0.0070
0.0075
0.0080
1.0 1.5 2.0
CN
_be
ta_v
/d
eg
Av
Effect of the wing position on the vertical tail CNβv
WBV high wing
WBV low wing
BV
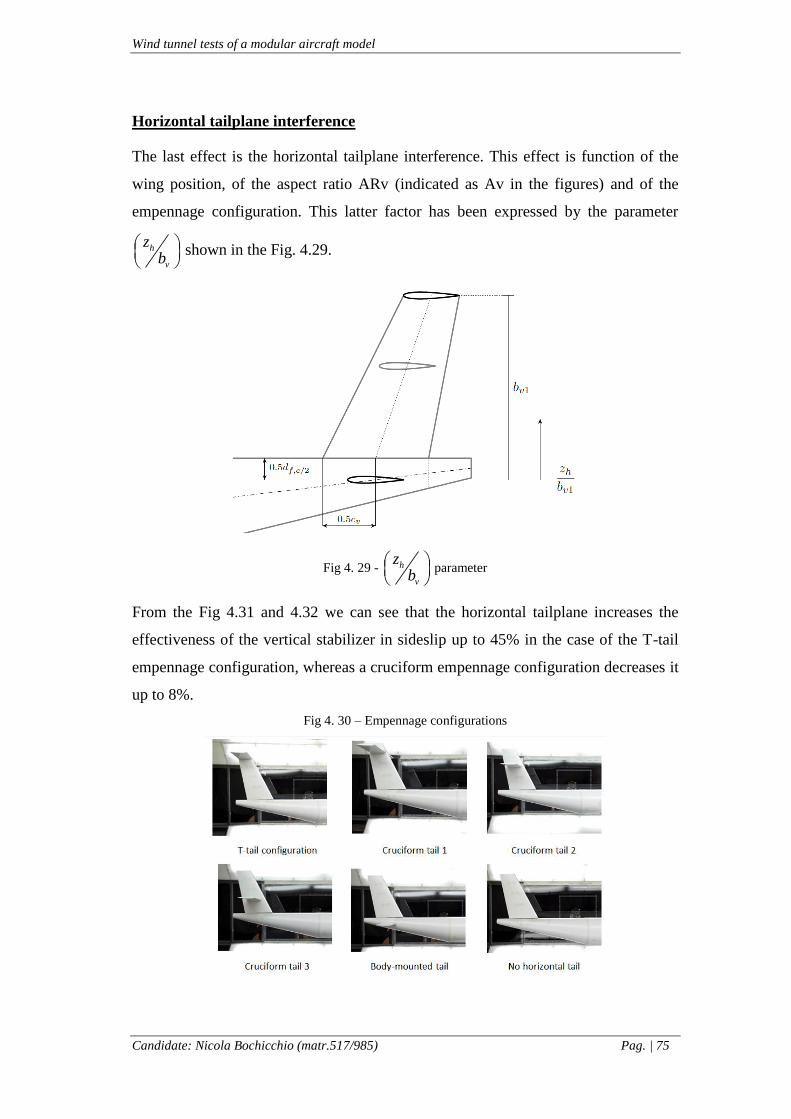
Wind tunnel tests of a modular aircraft model
Candidate: Nicola Bochicchio (matr.517/985) Pag. | 75
Horizontal tailplane interference
The last effect is the horizontal tailplane interference. This effect is function of the
wing position, of the aspect ratio ARv (indicated as Av in the figures) and of the
empennage configuration. This latter factor has been expressed by the parameter
h
v
zb
shown in the Fig. 4.29.
Fig 4. 29 - h
v
zb
parameter
From the Fig 4.31 and 4.32 we can see that the horizontal tailplane increases the
effectiveness of the vertical stabilizer in sideslip up to 45% in the case of the T-tail
empennage configuration, whereas a cruciform empennage configuration decreases it
up to 8%.
Fig 4. 30 – Empennage configurations
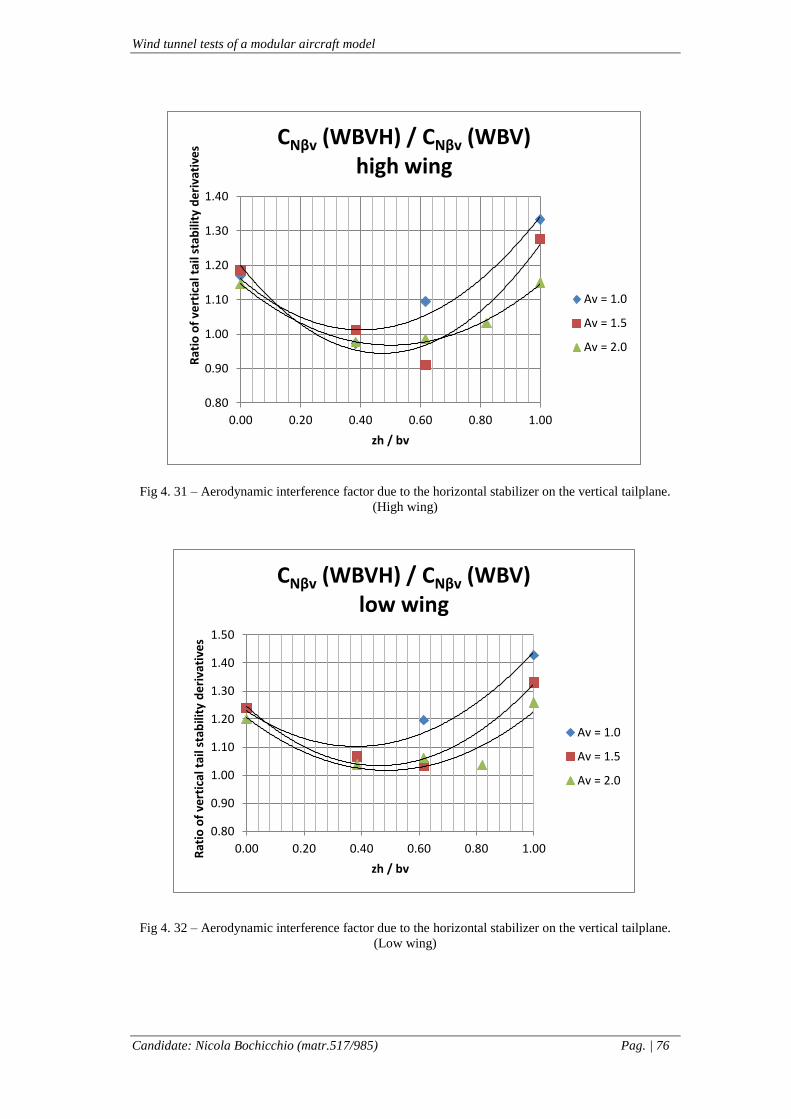
Wind tunnel tests of a modular aircraft model
Candidate: Nicola Bochicchio (matr.517/985) Pag. | 76
Fig 4. 31 – Aerodynamic interference factor due to the horizontal stabilizer on the vertical tailplane.
(High wing)
Fig 4. 32 – Aerodynamic interference factor due to the horizontal stabilizer on the vertical tailplane.
(Low wing)
0.80
0.90
1.00
1.10
1.20
1.30
1.40
0.00 0.20 0.40 0.60 0.80 1.00
Rat
io o
f ve
rtic
al t
ail s
tab
ility
de
riva
tive
s
zh / bv
CNβv (WBVH) / CNβv (WBV) high wing
Av = 1.0
Av = 1.5
Av = 2.0
0.80
0.90
1.00
1.10
1.20
1.30
1.40
1.50
0.00 0.20 0.40 0.60 0.80 1.00Rat
io o
f ve
rtic
al t
ail s
tab
ility
de
riva
tive
s
zh / bv
CNβv (WBVH) / CNβv (WBV) low wing
Av = 1.0
Av = 1.5
Av = 2.0

Wind tunnel tests of a modular aircraft model
Candidate: Nicola Bochicchio (matr.517/985) Pag. | 77
REFERENCES
[1] C. D. Perkins, R.E. Hage. Airplane performance stability and control. Wiley,
New York, 1949.
[2] J. Roskam. Airplane Flight Dynamics And Automatic Flight Controls - Part I.
Darcorporation.
[3] R. D. Finck. USAF Stability and Control DATCOM. AFWAL-TR 83-3048,
McDonnell Douglas Corporation, Wright-Patterson Air Force Base, Ohio, 1978.
[4] P. Della Vecchia, F. Nicolosi and D. Ciliberti. Aircraft directional stability
prediction method by CFD. In 33rd
AIAA Applied Aerodynamics Conference, 2015.
[5] S. Corcione. Design guidelines, Experimental Investigation and Numerical
Analysis of a New Twin Engine Commuter Aircraft. Ph.D. thesis, Università degli
Studi di Napoli “Federico II”, 2015.
[6] J. B. Barlow, W. H. Rae, and A. Pope. Low-speed wind tunnel testing. Wiley,
New York, 3rd
edition, 1999.

Wind tunnel tests of a modular aircraft model
Candidate: Nicola Bochicchio (matr.517/985) Pag. | 78
ACKNOWLEDGEMENT/RINGRAZIAMENTI
Ci tengo a ringraziare:
• Il prof Fabrizio Nicolosi per l’opportunità di crescita che mi ha concesso
grazie a questo lavoro sperimentale dal grande interesse scientifico e tecnico.
• Il mio correlatore, l’ing. Danilo Ciliberti, per aver condiviso con me la sua
esperienza sperimentale ma, soprattutto, per il suo continuo supporto morale
e didattico durante tutto il lavoro svolto.
• Gli ingegneri Salvatore Corcione, Pierluigi Della Vecchia e Vincenzo per i
preziosi consigli e per l’aiuto fornitoci durante le prove in galleria.
• Il tecnico di laboratorio, Antonio, per la sua preziosa esperienza e continua
disponibilità.
Nicola