
To evaluate the quality of learning outcome in HTE -an European model- Leonardo da Vinci - Pilot...
71
To evaluate the quality of To evaluate the quality of learning outcome in HTE learning outcome in HTE -an European model- -an European model- Leonardo da Vinci - Pilot Project Ex.Per.O EXpectations and PERceptions Of Quality in HTE
-
Upload
marylou-tyler -
Category
Documents
-
view
217 -
download
1
Transcript of To evaluate the quality of learning outcome in HTE -an European model- Leonardo da Vinci - Pilot...

To evaluate the quality of learning To evaluate the quality of learning outcome in HTEoutcome in HTE
-an European model--an European model-
Leonardo da Vinci - Pilot Project
Ex.Per.OEXpectations and PERceptions Of Quality in HTE
The ExPerO- ProjectThe ExPerO- Project
• Pilot Project -Leonardo da Vinci (UE)• ITALIA, BÃLGARIJA, LIETUVA, ESPAÑA, SLOVENIJA • Different kinds of partners :
– Research InstitutionsResearch Institutions: University of Trieste- Turin Polytechnic (IT)- Kaunas Technology University (LT), IREL (SI), DIA Sport (BL).
– Vocational SchoolsVocational Schools: ITI Malignani (IT), IPPSAR Borsellino (IT), STUCOM (ES), Tehniski Solci Center Nova Gorica (SI), Srednja poklicna in tehnicna kmetijsko zivilsk (SI), Rysininku Mokykla (LT),
– Quality Consulence CompanyQuality Consulence Company: GOVAQ (ES) – Critical FriendCritical Friend: IRRE Veneto (IT)
• Contest: High Technical Education courses
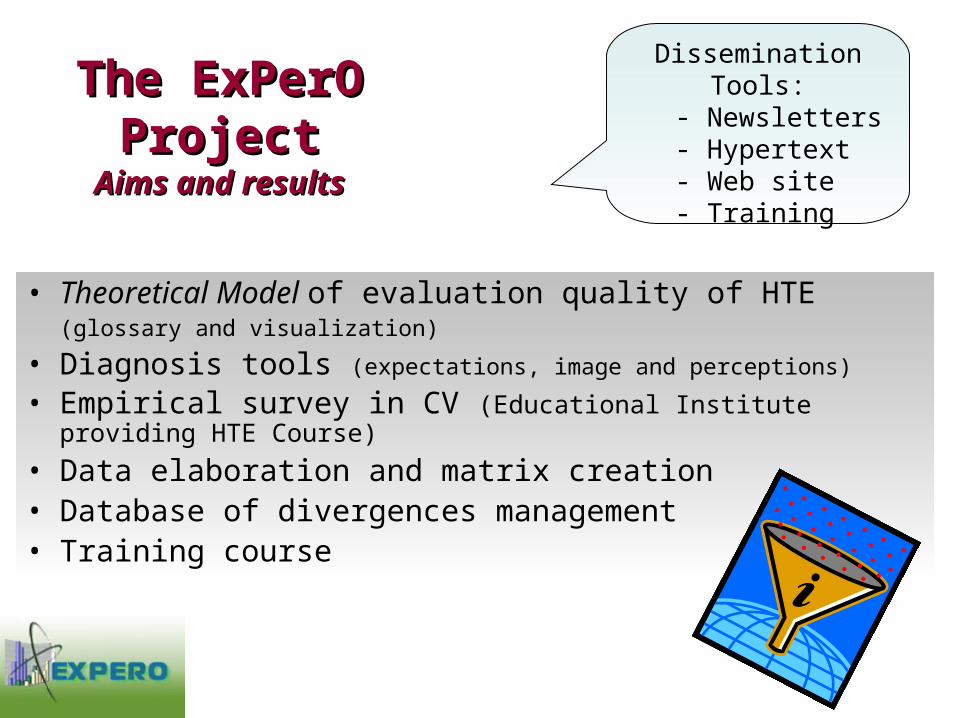
The ExPerO The ExPerO ProjectProject
Aims and resultsAims and results
• Theoretical Model of evaluation quality of HTE (glossary and
visualization) • Diagnosis tools (expectations, image and perceptions)
• Empirical survey in CV (Educational Institute providing HTE Course)
• Data elaboration and matrix creation• Database of divergences management• Training course
Dissemination Tools:- Newsletters- Hypertext- Web site- Training

Key theoretical conceptsKey theoretical concepts
• Learning outcome vs Learning process• The Stakeholders
• Quality school service evaluation:
– Expectations and perceptions– Quality of HTE institute image – Quality Service vs Customer Satisfaction
• Two areas: SHOULD and IS• The quality indicators of learning outcome and
stakeholders
Template
eito o servizio nel complesso?

Learning outcomeLearning outcome (of HTE) (of HTE)
The focus is on learning outcome, as the main result of educational service. Educational outcome ≠ Organizational processes
“The integrate system of competencies acquired in attending a HTE course by a
trainee. It’s composed by knowledge, skills and professional behaviour.”
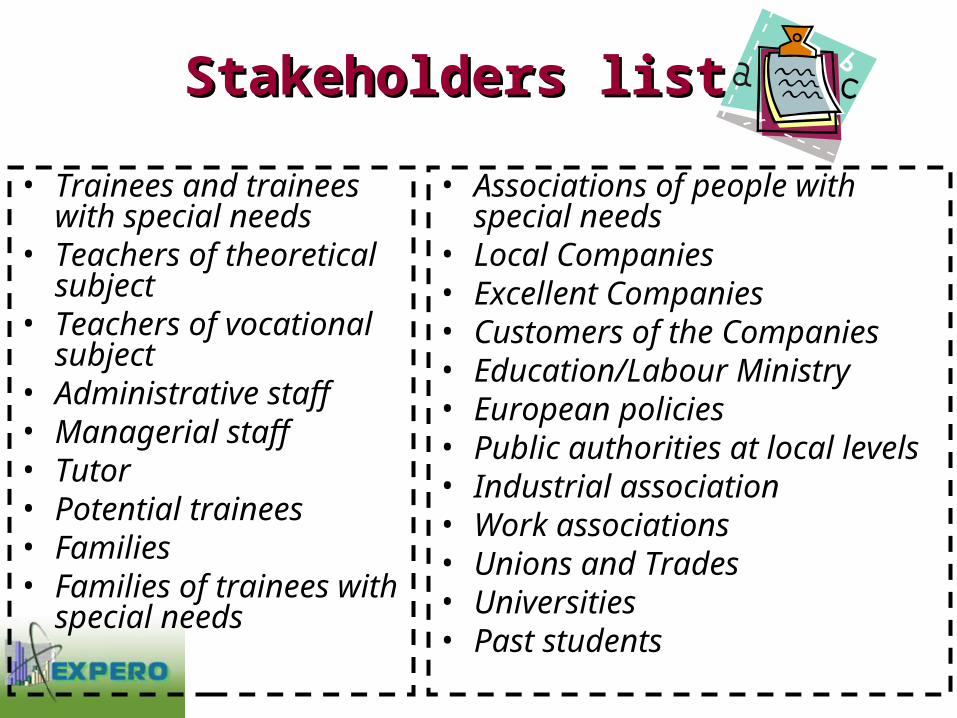
Stakeholders listStakeholders list
• Trainees and trainees with special needs
• Teachers of theoretical subject
• Teachers of vocational subject
• Administrative staff• Managerial staff• Tutor• Potential trainees• Families• Families of trainees with
special needs
• Associations of people with special needs
• Local Companies• Excellent Companies• Customers of the Companies• Education/Labour Ministry • European policies• Public authorities at local levels• Industrial association• Work associations• Unions and Trades• Universities• Past students

StakeholdersStakeholders
– External (companies, associations, etc.)
Trainer
Tutor
Factory Ministry
Parents
− Trainees (participating in the training)
− Internal (teachers, tutors, employees, etc.)
3 main categoriesFocus on students with special needs.
Trainees
Different types of expectation
“Expectation” is not a monolithic concept; it can be declined in different ways.
The most important are:
Expectation as predictive standard
Expectation as ideal standard
Will happenExpectation as predictive standard (Boulding, Kalra, Staelin and Zeithaml, 1993).
This kind of expectation is focalized on the sure forecast about what is going to happen (will happen) in the next match with the service or with the company.
This kind of expectation is usually used in the costumer satisfaction studies.

Should happen
Expectation as ideal standard
(Boulding, Kalra, Staelin and Zeithaml, 1993).
This kind of expectation is what the customer would obtain (should happen) in the next match with the service or with the company.
This kind of expectation is usually used in the service quality models.

Ideal standard versus Desires
If we ask a desire about a service, the answer could be unrealistic, far from what is possible.
Instead, considering expectation as ideal standard, the requested opinion is more realistic and pragmatic. It is rooted on past experience but, at the same time, it looks to the situation in an improving way. ROOTED ON
PAST EXPERIENCES
LOOKING FOR A BETTER SITUATION
It is important to underline the difference between expectation as ideal standard and desires.

ImageImage• It is a vehicle of meaning able to create values and virtual
worlds (immaterial side). • It has to be linked with the real characteristics of the service
(material side).• It becomes the social memory of the service, able to give
identity and make the difference among other similar services.
Through a validated questionnaire to be submitted to trainees stakeholders and external stakeholders.
How to measure it?How to measure it? QI (Quality of Image)

OPOP - - Organisational ProcessesOrganisational ProcessesQR-EXQR-EX-- Expectation of Results Expectation of Results
QIQI - - Quality of Quality of ImageImage
QCQC - - Quality of Competencies Quality of Competencies SRSR - Satisfaction of Results - Satisfaction of ResultsQR-PERQR-PER-- Perception of ResultsPerception of Results
STK- I
STK- T
STK- E
Internal (teachers, tutors, employees, etc.)
Trainees (participating in the training)
External (companies, customers, vocational association, ministry, EU…)
QRQREX PER
SR
OP
QI
QC

Quality indicators of learning outcomeQuality indicators of learning outcome Ideal Expectation OP- Organisational ProcessesOP- Organisational Processesabout organisational processes (should)
Evaluation of quality results (2)- Expectation of results (should) QR-EXQR-EX– Quality of ResultsQuality of Results
Values associated to the institute’s image QI - Quality of the ImageQI - Quality of the Image
Evaluation of competencies acquired on attending HTE course- Difference between initial QC- Quality of CompetenciesQC- Quality of Competencies
and final status
Trainees satisfaction of the learning outcome - Relation between expectations (will) SR-SR- Satisfaction of ResultsSatisfaction of Results and perceptions
Evaluation of quality results (1)– Perception of results QR-PER-QR-PER- Quality of ResultsQuality of Results

Summarising…Summarising…
Focus on Service Quality approachFocus on Learning Outcome (not the quality of the
whole service)
Expectation = Ideal Expectation (not the foreseen)
Satisfaction of results includes the expectations without direct questions.
Different kinds of stakeholders (I-STK, T-STK and E-
STK), with different needs and perceptions.

The The glossaryglossary
The glossary contains the technical words used in the theoretical model. It is a very useful
tool to realise the diagnosis.

Diagnosis

To weight the stakeholdersTo weight the stakeholders
Categories of stakeholder Score
Potential students
Special needs Ass./families
Companies
Customers
Vocational Ass/ Chamber of C.
University
Ministry
EC
Total 1000
When the weight is zero, it means that the category is
NOT important for the HTE…
It is NOT a stakeholder at all!

the MSExcel® fileINPUT
Introduce in the following cells the weights attributed to each stakeholder. Sum of weigths must be equal to 1000.
potential trainees special needs companies customers vocational universities ministry eu
Weights 150 0 350 25 125 100 50 200
neglig. level 0,571428571 1 0 0,928571429 0,642857143 0,714285714 0,857142857 0,428571429Introduce in the following cells the scores (from 1 to 100) attributed to each subindicators for each stakeholder.
potential trainees special needs companies customers vocational universities ministry eu
Competencies 25 50 78 99 18 15 4 98
Declining to future needs 90 80 90 88
Employability 70 15 95 95 80 80
Dropout 70 70
Credits system 80 85 80 80
Introduce in the following cells the scores (from 1 to 100) attributed to SR (Satisfaction Results) and QI (Quality of image).
SR 96
QI 88
1st step:To weight the stakeholders
1000 scores with check

Categories of stakeholder sample
Internal (teachers,
administrative, tutors) 10 -12 people, each personnel
category should be represented
Trainees (+ special needs) 10 (+10)
Potential students 5
Special needs Ass./families 3
Companies 3
Customers 3
Vocational Ass/ Chamber of Commerce/ Trade Unions
3
University 1
Ministry & EC Documental analysis
2nd step: to choose the people for the
sample
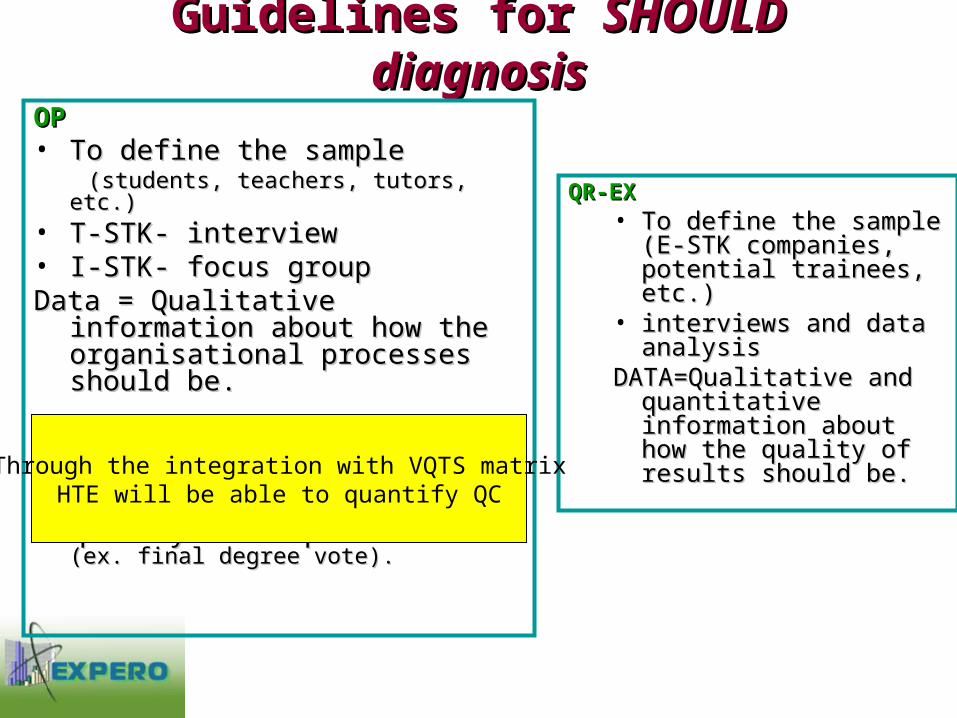
Guidelines for Guidelines for SHOULD diagnosisSHOULD diagnosis
OPOP • To define the sample To define the sample (students, teachers, tutors, etc.)(students, teachers, tutors, etc.)• T-STK- interviewT-STK- interview• I-STK- focus groupI-STK- focus groupData = Qualitative information about Data = Qualitative information about
how the how the organisationalorganisational processes processes should be.should be.
QCQC• Choice of indicators in order to Choice of indicators in order to
measure the quality of competencies measure the quality of competencies (ex. final degree vote).(ex. final degree vote).
QR-EXQR-EX • To define the sample (E-To define the sample (E-
STK companies, STK companies, potential trainees, etc.)potential trainees, etc.)
• interviews and data interviews and data analysisanalysis
DATA=Qualitative and DATA=Qualitative and quantitative information quantitative information about how the quality of about how the quality of results should be.results should be.
Through the integration with VQTS matrixHTE will be able to quantify QC

OPOP - - Organisational ProcessesOrganisational ProcessesQR-EXQR-EX-- Expectation of Results Expectation of Results
QIQI - - Quality of Quality of ImageImage
STK- I
STK- T
STK- EQRQREX
OP
QI

Data collection Data collection andand storage storage
Tools:Tools:• Semi structured interview Semi structured interview ((QR, SR, OPQR, SR, OP))
• Questionnaire Questionnaire (QI)
• Focus Group Focus Group (OP)
• Documental Analysis Documental Analysis (EC – Ministerial expectation)
Third step: to manage the survey


Annex A – focus group grid
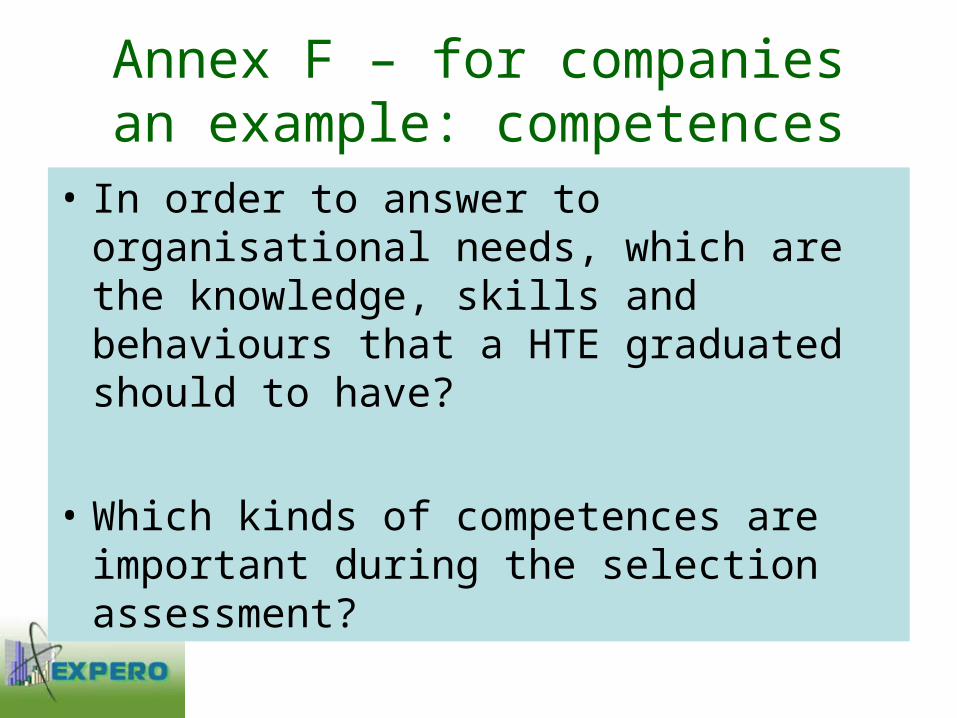
Annex F – for companiesan example: competences
• In order to answer to organisational needs, which are the knowledge, skills and behaviours that a HTE graduated should to have?
• Which kinds of competences are important during the selection assessment?

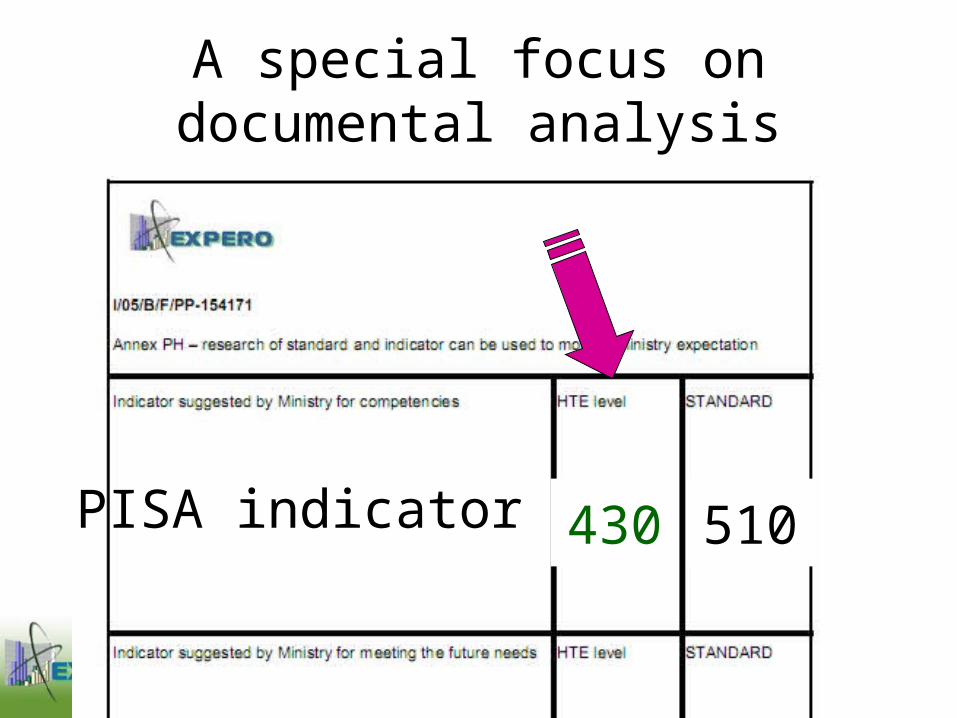
HowHow to use the documental analysis? to use the documental analysis?
• To identify expectations of Education Ministry and EC
• Deep analysis of the documents.
• To define indicators of expected quality
• To measure the adherence between HTE results and expected levels.

A special focus on documental analysis
PISA indicator Average
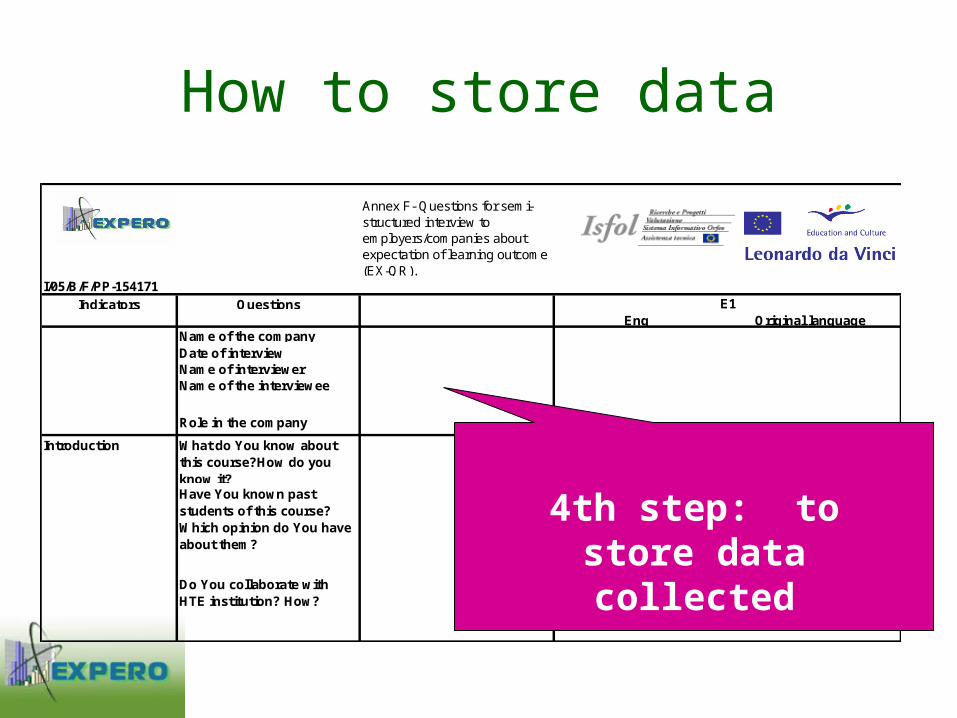
How to store data
Annex F- Questions for semi-structured interview to employers/companies about expectation of learning outcome (EX-QR).
I/05/B/F/PP-154171
Indicators QuestionsEng Original language
Name of the companyDate of interviewName of interviewerName of the interviewee
Role in the company
Introduction What do You know about this course?How do you know it?Have You known past students of this course? Which opinion do You have about them?
Do You collaborate with HTE institution? How?
E1
4th step: to store data collected
Guidelines for Guidelines for Image diagnosisImage diagnosis
QI- Quality of ImageQI- Quality of Image– To use the same sample of QR or, for a wider To use the same sample of QR or, for a wider
analysis, adding more E-STK.analysis, adding more E-STK.– T-STK and E-STK: QuestionnaireT-STK and E-STK: Questionnaire
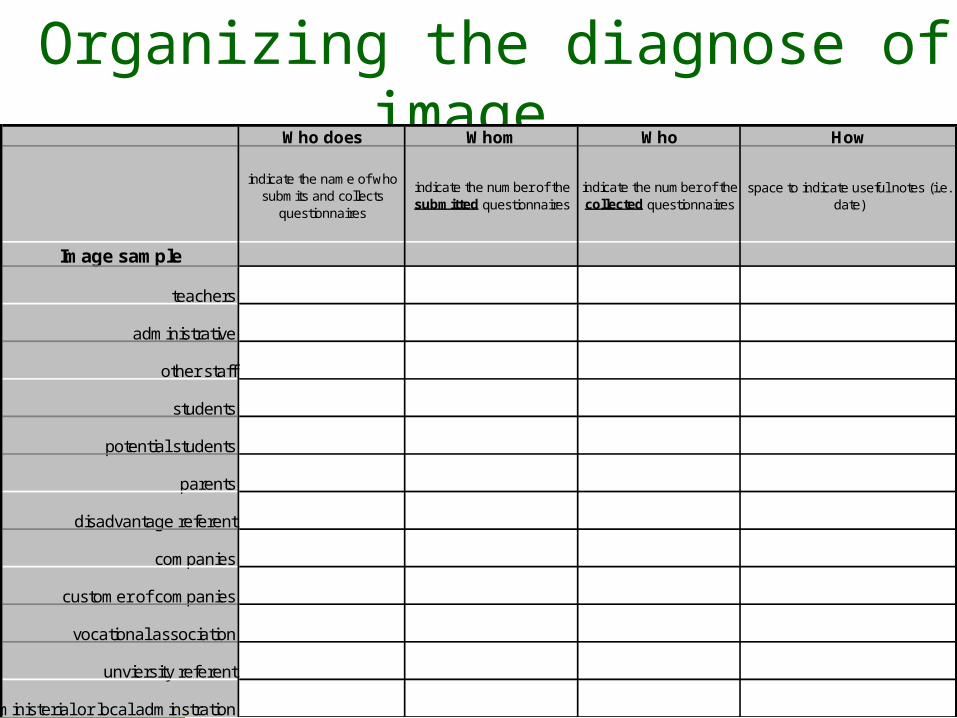
Organizing the diagnose of image… Who does Whom Who How
indicate the name of who submits and collects
questionnaires
indicate the number of the submitted questionnaires
indicate the number of the collected questionnaires
space to indicate useful notes (i.e. date)
Image sample
teachers
administrative
other staff
students
potential students
parents
disadvantage referent
companies
customer of companies
vocational association
unviersity referent
ministerial or local adminstration

Image questionnaire
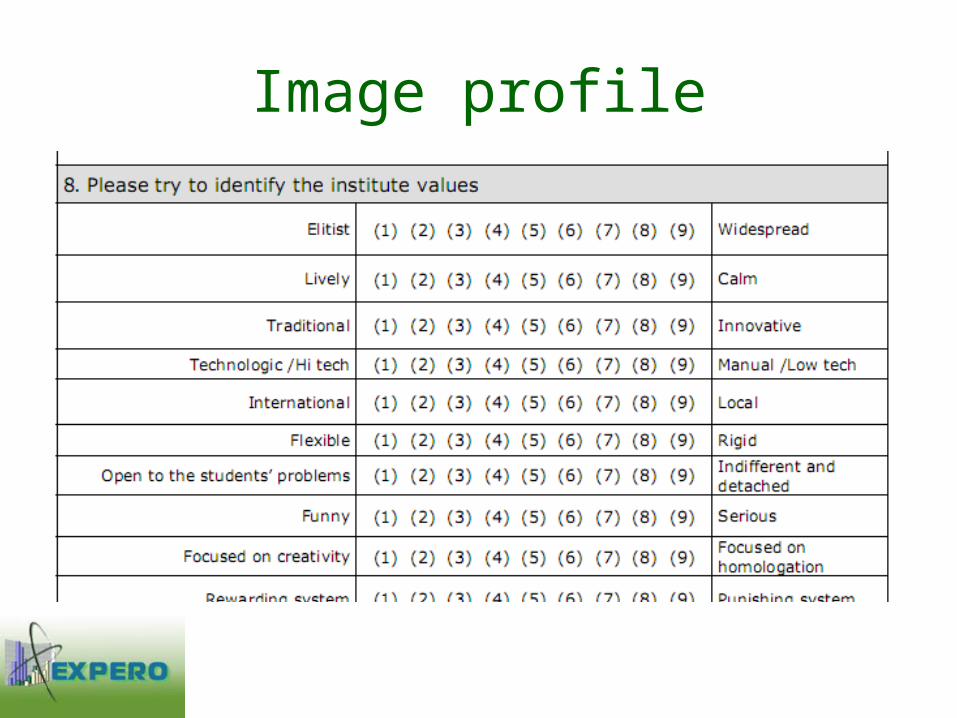
Image profile
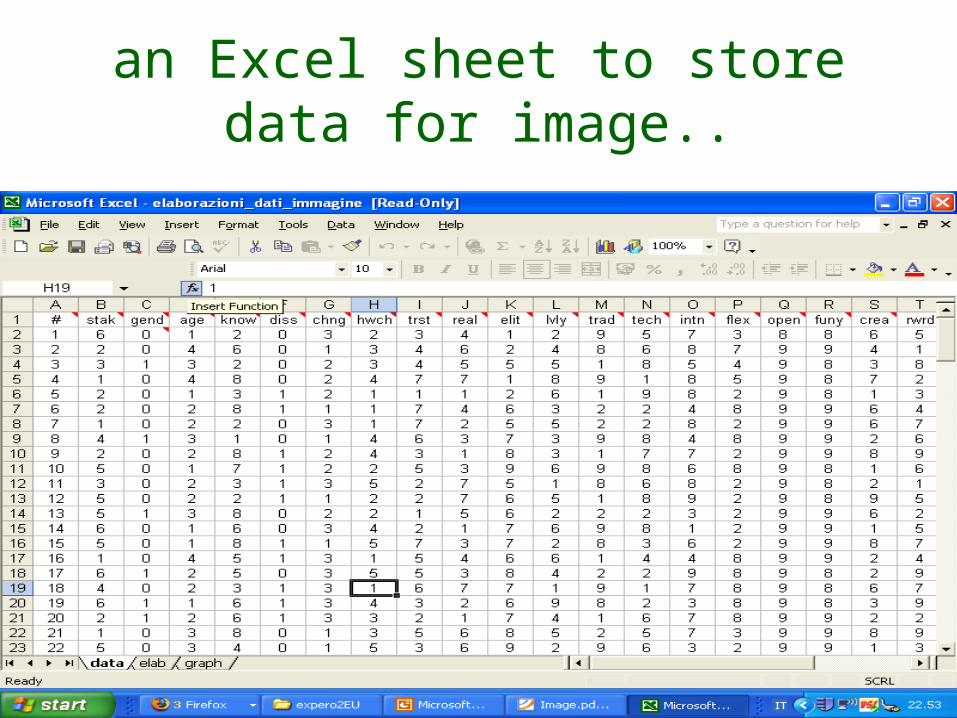
an Excel sheet to store data for image..
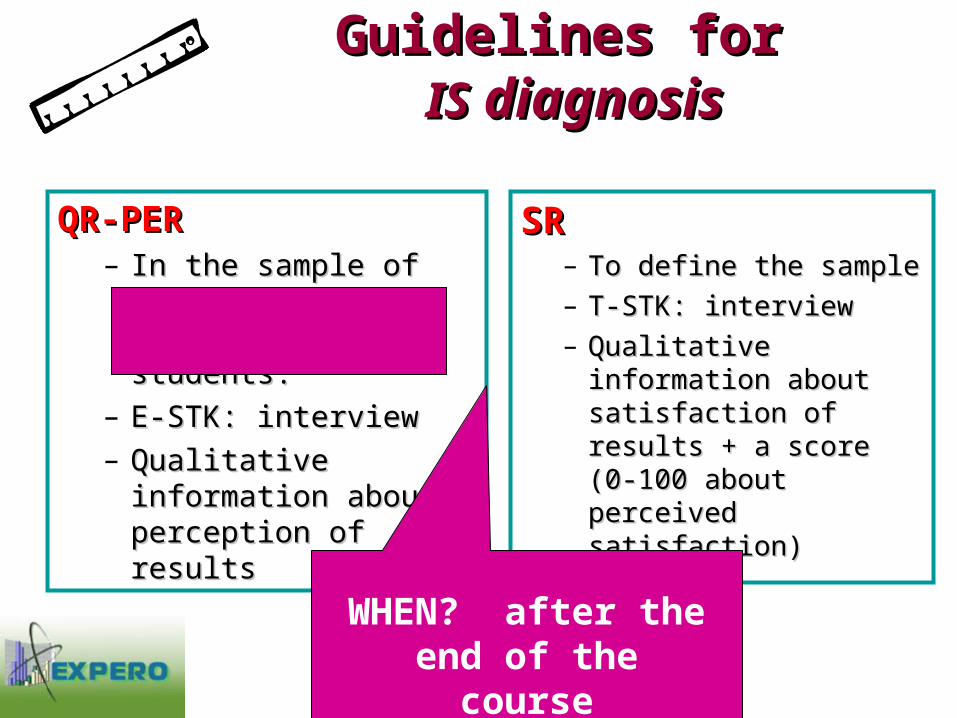
SRSR – To define the sampleTo define the sample– T-STK: interviewT-STK: interview– Qualitative information Qualitative information
about satisfaction of about satisfaction of results + a score (0-results + a score (0-100 about perceived 100 about perceived satisfaction)satisfaction)
Guidelines forGuidelines for ISIS diagnosis diagnosis
QR-PERQR-PER– In the sample of QR-EX In the sample of QR-EX
choose choose onlyonly who has who has known HTE students.known HTE students.
– E-STK: interviewE-STK: interview– Qualitative information Qualitative information
about perception of about perception of resultsresults
WHEN? after the end of the course

QCQC - - Quality of Competencies Quality of Competencies SRSR - Satisfaction of Results - Satisfaction of ResultsQR-PERQR-PER-- Perception of ResultsPerception of Results
STK- I
STK- T
STK- EQRQR PER
SRQI
QC
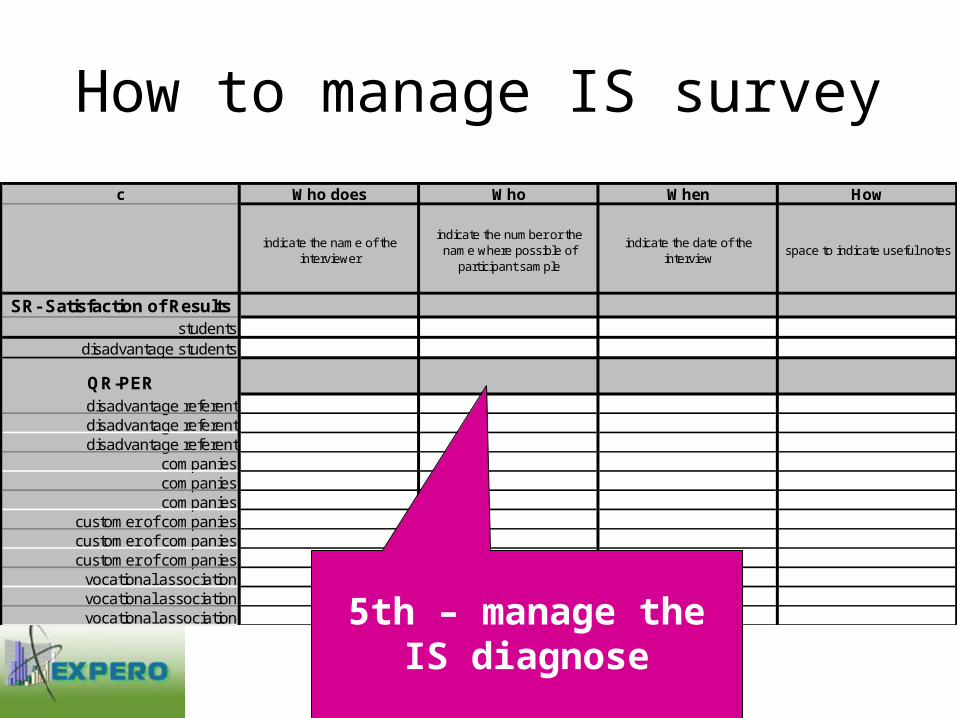
How to manage IS survey
c Who does Who When How
indicate the name of the interviewer
indicate the number or the name where possible of
participant sample
indicate the date of the interview
space to indicate useful notes
SR- Satisfaction of Resultsstudents
disadvantage students
QR-PERdisadvantage referentdisadvantage referentdisadvantage referent
companiescompaniescompanies
customer of companiescustomer of companiescustomer of companies
vocational associationvocational associationvocational association 5th – manage the
IS diagnose

Annex PF – to companies
6th – to collect data

To store data
7th – to store data
A special focus on documental analysis
PISA indicator 430 510
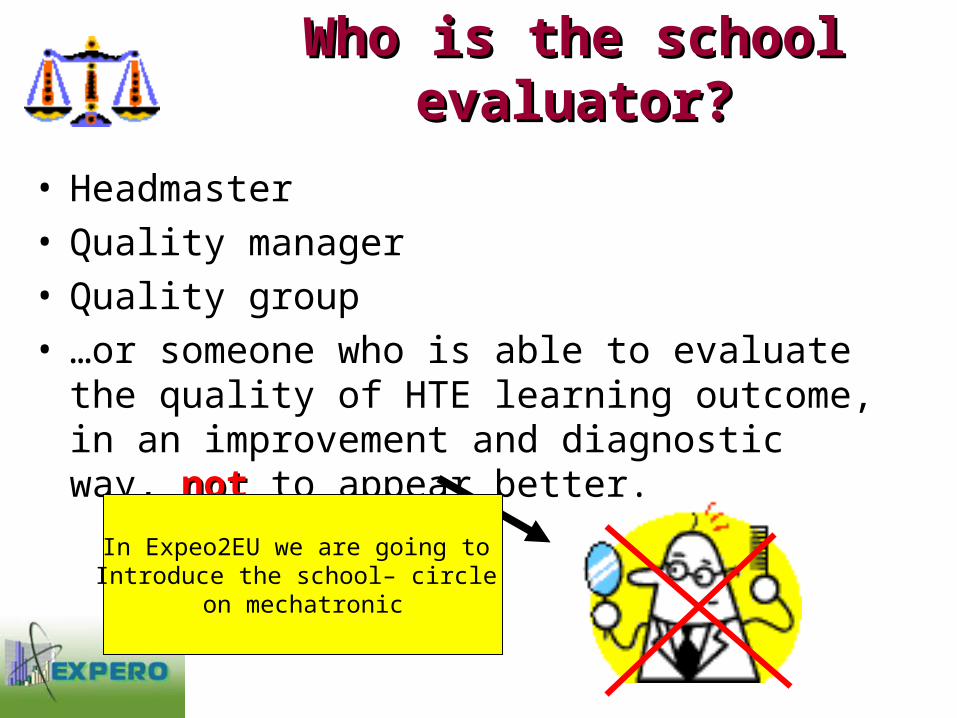
Who is the school evaluator?Who is the school evaluator?
• Headmaster • Quality manager• Quality group• …or someone who is able to evaluate the quality
of HTE learning outcome, in an improvement and diagnostic way, notnot to appear better.
In Expeo2EU we are going to Introduce the school– circle
on mechatronic

-QR- -QR- Data elaboration Data elaboration
Sub- indicators of QRSub- indicators of QR
• Competencies
• Credit system• Meeting the future needs (emerging occupation-
trade sector)
• Employability
• Dropout

Sub-indicator: competencies Sub-indicator: competencies
The competence is the basic unit of the expertise that a worker has got and it includes:
1. cognitive competence involving the use of theory and concepts (to know);
2. functional competence (skills or know-how), in a specific work area, learning or social activity (to know how to do);
3. personal competence involving knowing how to conduct oneself in a specific situation (to know being);
4. ethical competence involving the owning specific personal and professional values (to know staying with others).
Sub-indicator: credit system Sub-indicator: credit system
A credits system represents the volume of learning outcomes, in a measurable form.
It may be characterised by its size and relative importance, expressed in general by credit points (or credits) or other factors.

Sub-indicator: meeting the future needs Sub-indicator: meeting the future needs (emerging occupation- trade sector(emerging occupation- trade sector))
It consists in the adaptability of the HTE course to the change of the demands in the labour markets (in the occupations, sectors, and trades).
– to create or to adapt the courses to these future needs responding at the market demands so that companies receive well prepared workers
Sub-indicator: employabilitySub-indicator: employability
It looks at the real trend of the employment in connection with the competencies, learnt by the students through the HTE course.
– It is important to know if the job is in the same field of the course.
– It refers to the number of trainees who find a jobthanks to the attendance of the HTE course. – This indicator is generally analysed checking thedestination of trainees, 3 or 6 months after the end of HTE course.
Sub-indicator: dropoutSub-indicator: dropout
It represents the real trend of the student’s amount who attended the course considering who withdraws before completing the HTE training.
– The early school leavers (drop-outs) is considered a vulnerable group.
– The knowledge about this phenomenon is very important in addressing the future policy.

How to evaluate How to evaluate QRQR??
• Quality Evaluator• To analyse data collected
• Reading the collected expectations for each stakeholder for each sub-indicator.
• Reading the collected perceptions for each stakeholder for each sub-indicator. Proposing an evaluation, answering to the question:
““How much we are fitting the How much we are fitting the expectations of this category expectations of this category
of stakeholder in this of stakeholder in this subindicator?” 0-100subindicator?” 0-100
If there is not collected data
(empty field), the evaluator is called to use his/her personal
knowledge
In Expeo2EU we are going to Introduce the school– circle
on mechatronic
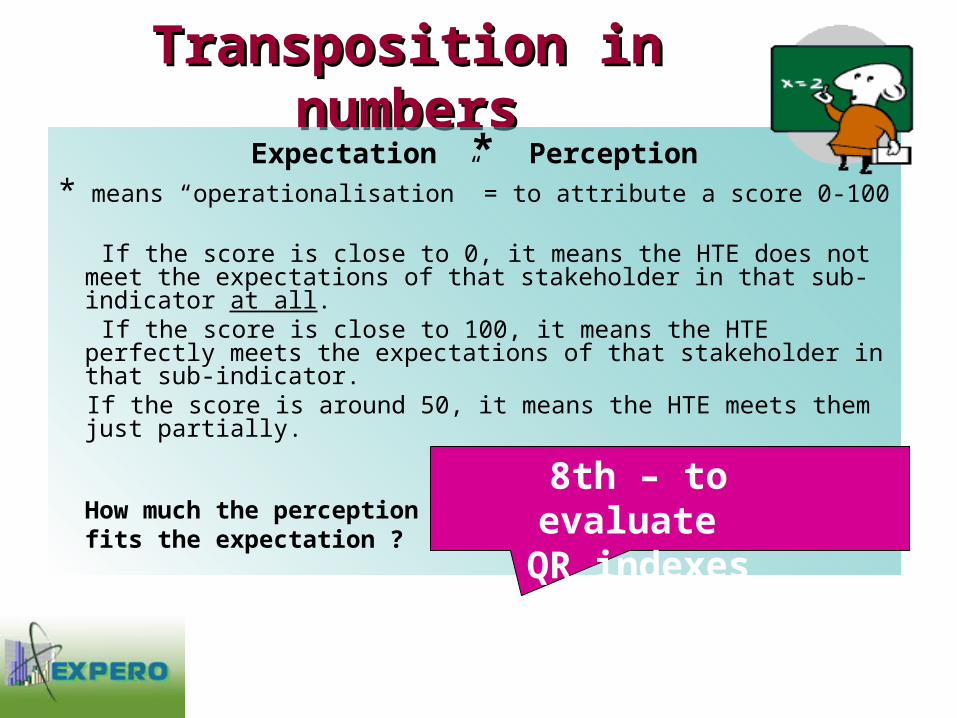
Transposition in numbersTransposition in numbersExpectation * Perception
* means “operationalisation” = to attribute a score 0-100
If the score is close to 0, it means the HTE does not meet the expectations of that stakeholder in that sub-indicator at all.
If the score is close to 100, it means the HTE perfectly meets the expectations of that stakeholder in that sub-indicator.
If the score is around 50, it means the HTE meets them just partially.
How much the perception fits the expectation ?
8th – to evaluate QR indexes

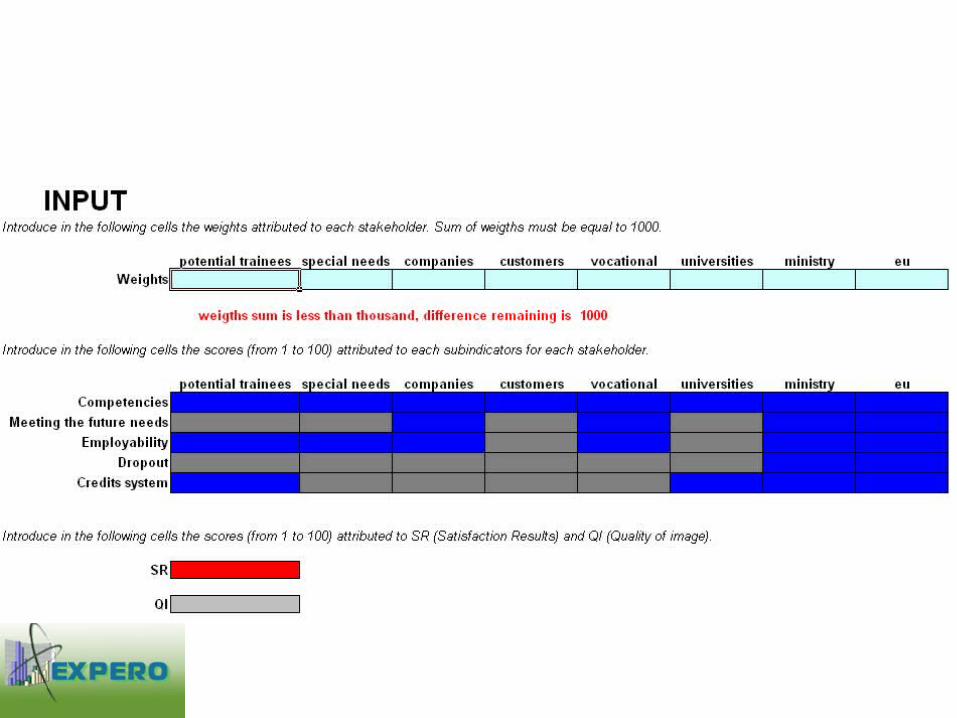
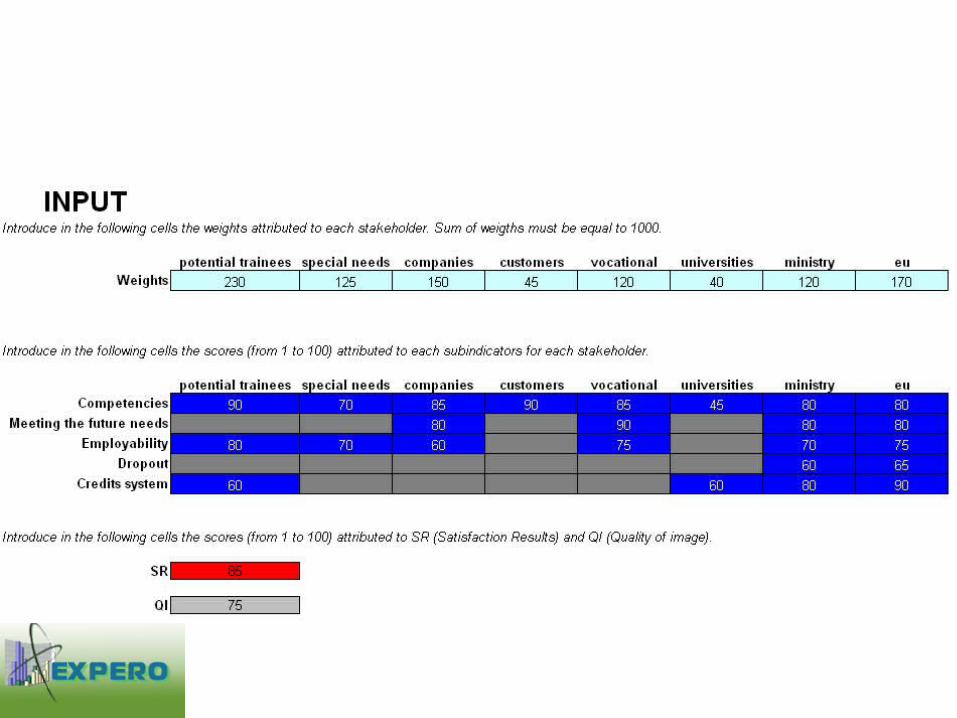
How to use the MSExcel® fileINPUT
Introduce in the following cells the weights attributed to each stakeholder. Sum of weigths must be equal to 1000.
potential trainees special needs companies customers vocational universities ministry eu
Weights 150 0 350 25 125 100 50 200
neglig. level 0,571428571 1 0 0,928571429 0,642857143 0,714285714 0,857142857 0,428571429Introduce in the following cells the scores (from 1 to 100) attributed to each subindicators for each stakeholder.
potential trainees special needs companies customers vocational universities ministry eu
Competencies 25 50 78 99 18 15 4 98
Declining to future needs 90 80 90 88
Employability 70 15 95 95 80 80
Dropout 70 70
Credits system 80 85 80 80
Introduce in the following cells the scores (from 1 to 100) attributed to SR (Satisfaction Results) and QI (Quality of image).
SR 96
QI 88

- SR-- SR-Data elaboration Data elaboration
Sub-indicators of SRSub-indicators of SR
• Competences • Meeting the future needs (emerging
occupation- trade sector)
• Employability
• Credit system

How to evaluate SR?How to evaluate SR?
• The Quality group has to read the answers about SR and to calculate the average of the student scores.
• The Quality group has the freedom to modify this average score (with a maximum range of +/- 15 points), based on the consideration of the qualitative data of SR.
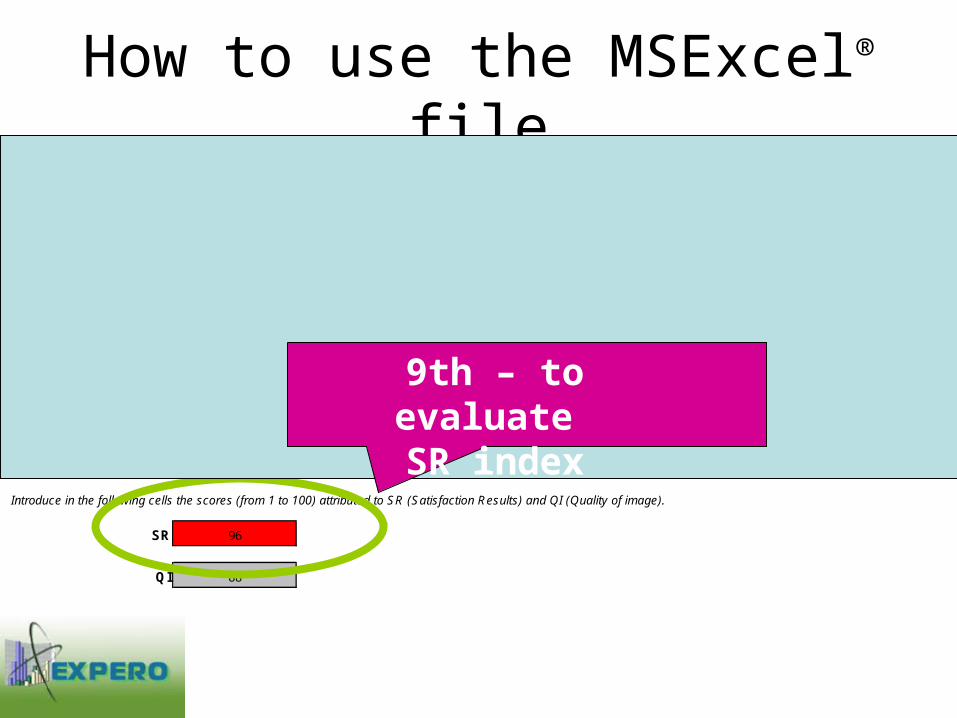
How to use the MSExcel® fileINPUT
Introduce in the following cells the weights attributed to each stakeholder. Sum of weigths must be equal to 1000.
potential trainees special needs companies customers vocational universities ministry eu
Weights 150 0 350 25 125 100 50 200
neglig. level 0,571428571 1 0 0,928571429 0,642857143 0,714285714 0,857142857 0,428571429Introduce in the following cells the scores (from 1 to 100) attributed to each subindicators for each stakeholder.
potential trainees special needs companies customers vocational universities ministry eu
Competencies 25 50 78 99 18 15 4 98
Declining to future needs 90 80 90 88
Employability 70 15 95 95 80 80
Dropout 70 70
Credits system 80 85 80 80
Introduce in the following cells the scores (from 1 to 100) attributed to SR (Satisfaction Results) and QI (Quality of image).
SR 96
QI 88
9th – to evaluate SR index
-QI- -QI- Data elaboration Data elaboration
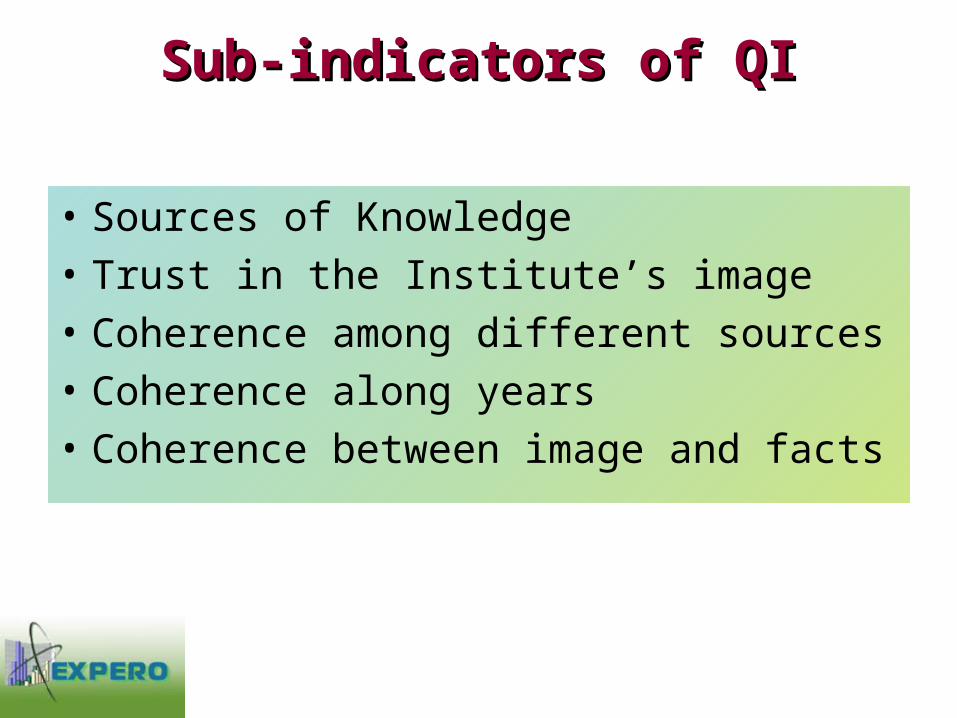
Sub-Sub-indicatorsindicators of QI of QI
• Sources of Knowledge
• Trust in the Institute’s image
• Coherence among different sources
• Coherence along years
• Coherence between image and facts
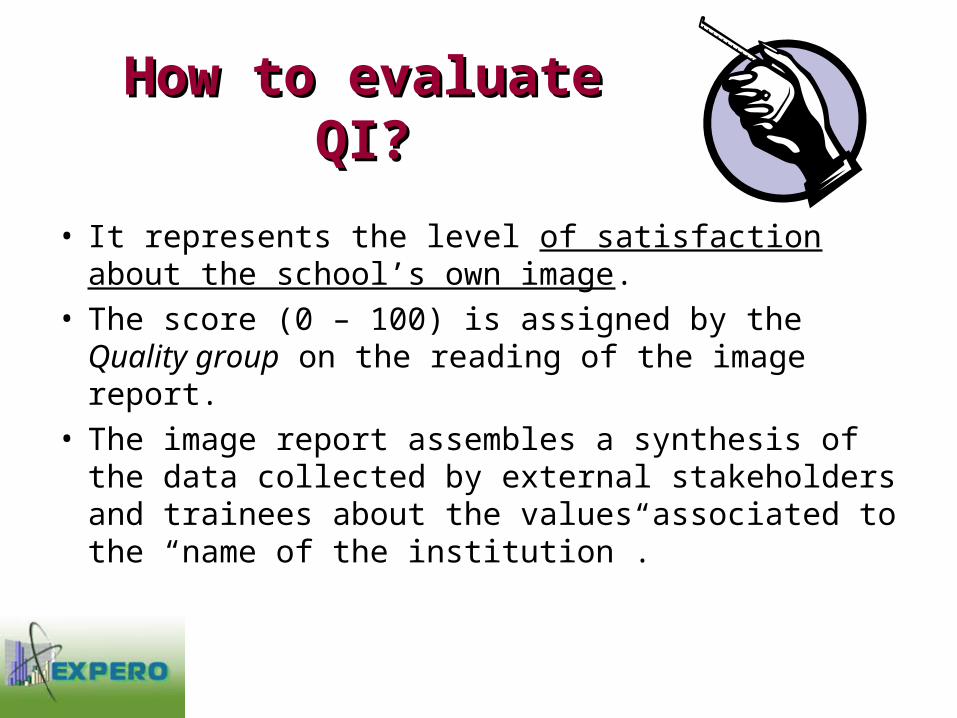
How to evaluate QI?How to evaluate QI?
• It represents the level of satisfaction about the school’s own image.
• The score (0 – 100) is assigned by the Quality group on the reading of the image report.
• The image report assembles a synthesis of the data collected by external stakeholders and trainees about the values associated to the “name of the institution”.
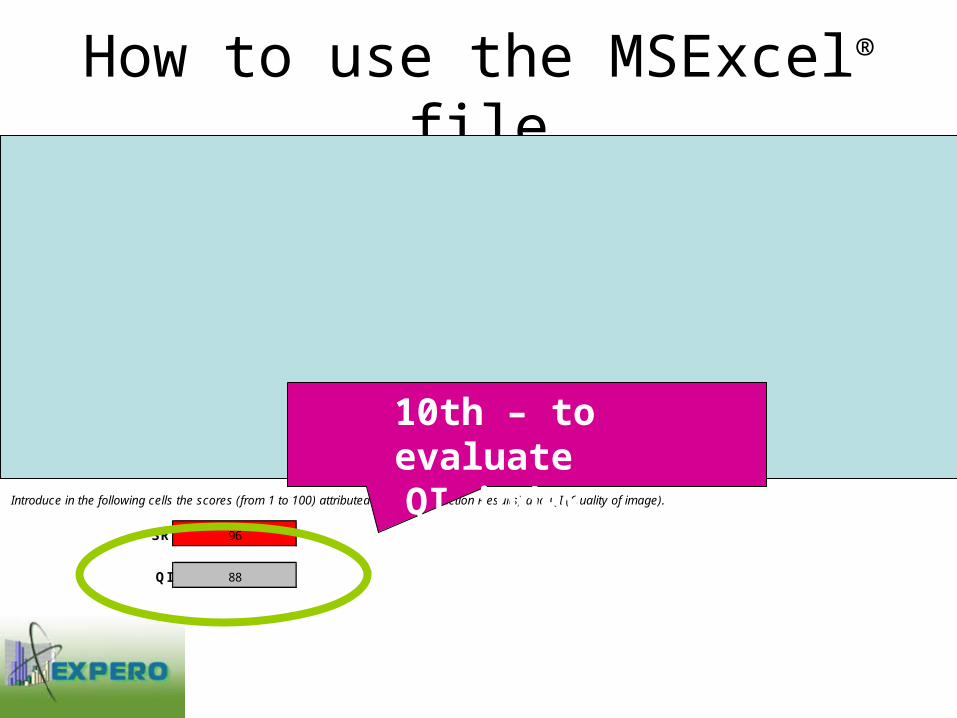
How to use the MSExcel® fileINPUT
Introduce in the following cells the weights attributed to each stakeholder. Sum of weigths must be equal to 1000.
potential trainees special needs companies customers vocational universities ministry eu
Weights 150 0 350 25 125 100 50 200
neglig. level 0,571428571 1 0 0,928571429 0,642857143 0,714285714 0,857142857 0,428571429Introduce in the following cells the scores (from 1 to 100) attributed to each subindicators for each stakeholder.
potential trainees special needs companies customers vocational universities ministry eu
Competencies 25 50 78 99 18 15 4 98
Declining to future needs 90 80 90 88
Employability 70 15 95 95 80 80
Dropout 70 70
Credits system 80 85 80 80
Introduce in the following cells the scores (from 1 to 100) attributed to SR (Satisfaction Results) and QI (Quality of image).
SR 96
QI 88
10th – to evaluate QI index

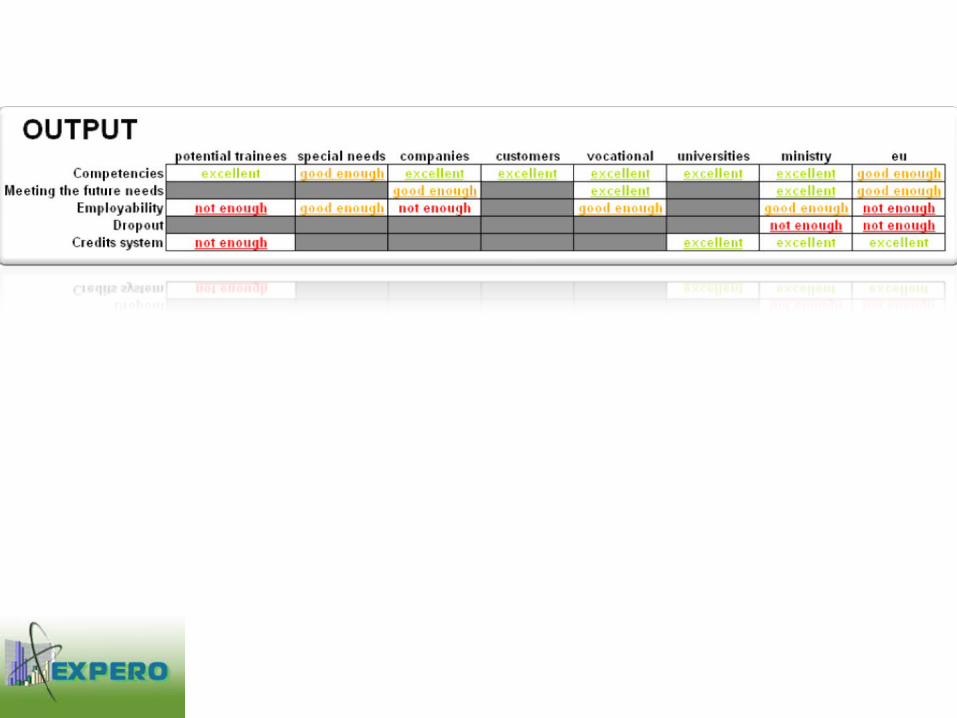
What you can obtain What you can obtain from this diagnosis? from this diagnosis?
The resultsThe resultsInputting the evaluation in a simple Excel sheet (contained
in ExPerO HypertextExPerO Hypertext), you will obtain the following:
• A QR table with the re-elaborated data based on stakeholders’ weight.
• Some graphical representations of the model indicators.
• The final graphical model with the re-elaborated scores.
• A direct link with the database of divergences management.

Graphics of resultsGraphics of results
link
96
88
90

Bar diagram/1
Competencies
0
20
40
60
80
100
potentialtrainees
specialneeds
companies customers vocational universities ministry eu
competences

Bar diagram/2
Employability
0
20
40
60
80
100
potentialtrainees
specialneeds
companies customers vocational universities ministry eu

Database of managing Database of managing divergencesdivergences
What happens in front of a gap (not enough)?During ExPerO Project we collected information
about which strategies a school can deal to reduce the analyzed gaps:
collecting best practices already in useinterviewing the school managers
Now all these precious information are collected inside ExPerO HypertextExPerO Hypertext and available for all the schools as suggestions about how to improve.
In Expero2Eu we are going to
transform it in TKBtroubleshootingknowledgebase

Now we will see how the hypertext works step by step with Prof. Marina Adriano
who created it for Expero.