
to download/view this file
208
NITROGEN MANAGEMENT STRATEGIES ON PERENNIAL RYEGRASS-WHITE CLOVER PASTURES IN THE WESTERN CAPE PROVINCE by JOHAN LABUSCHAGNE DISSERTATION PRESENTED FOR THE DEGREE DOCTOR OF PHYLOSOPHY (AGRICULTURE) UNIVERSITY OF STELLENBOSCH Promotor: Professor A. Agenbag Department of Agronomy University of Stellenbosch April 2005
Transcript of to download/view this file

NITROGEN MANAGEMENT STRATEGIES ON PERENNIAL
RYEGRASS-WHITE CLOVER PASTURES IN THE WESTERN
CAPE PROVINCE
by
JOHAN LABUSCHAGNE
DISSERTATION PRESENTED FOR THE DEGREE
DOCTOR OF PHYLOSOPHY (AGRICULTURE)
UNIVERSITY OF STELLENBOSCH
Promotor: Professor A. Agenbag
Department of Agronomy
University of Stellenbosch
April 2005

ii
DECLARATION
I, the undersigned, hereby declare that the work contained in this dissertation is my own
original work and I have not previously in its entirely or in part submitted it at any university
for a degree.
Signature: …………………………..
Date: …………………….…………..

iii
ABSTRACT
The response of perennial ryegrass and white clover, grown under controlled conditions, to
fertiliser N rates applied under variable soil temperature (6, 12 and 18 °C), soil water potential
(-10, -20, -25 and -35 kPa) and seasonal growing (June/July and October/November)
conditions as well as field conditions, were evaluated. Primary- (PDM), residual- (RDM) and
total dry matter (TDM) production (g pot-1) were recorded over the first- and second regrowth
cycles as well as the accumulative DM production over the two regrowth cycles, respectively.
Leaf N content (%) was recorded at the end of first and second regrowth cycles. Tiller/stolon
numbers and root dry mass (g pot-1) were recorded at the end of the second regrowth cycle.
Soil ammonium-N and nitrate-N (mg kg-1) content was monitored after fertiliser N
application.
Decreasing soil temperatures resulted in decreased TDM production in both crops. Only
perennial ryegrass was influenced by fertiliser N rate, with a general increase in dry matter
production as fertiliser N rate was increased. Ryegrass TDM production did not differ
between the 100 and 150 kg N ha-1 rates but were both higher (P=0.05) if compared to the 0
and 50 kg N ha-1 treatments. Soil nitrate levels 31 days after application of 150 kg N ha–1 were
still sufficient to stimulate ryegrass RDM production. The 173.8% increase in ryegrass TDM
production measured at 6 °C where 150 kg N ha-1 was applied compared to the 0 kg N ha-1
treatment illustrated the ability of ryegrass to respond to fertiliser N at low soil temperatures.
Soil water potential of -20 kPa resulted in higher ryegrass PDM and TDM production
compared to the -25 and -35 kPa levels. White clover PDM and TDM production were
however not influenced by soil water potential or fertiliser N rate. Ryegrass TDM production
increased (P=0.05) as fertiliser N rates were increased. The most favourable soil water level
for both ryegrass and clover root development was found to be -35 kPa.
Perennial ryegrass and white clover PDM, RDM and TDM production were higher during the
October/November season compared to the June/July season. Increased fertiliser N rates
resulted in increased (P=0.05) ryegrass PDM and TDM production. White clover dry matter
production was not influenced by fertiliser N rates.

iv
In the field study the effect of 0, 50, 100 and 150 kg N ha-1 applied as a single application
either in autumn, early winter, late winter, early spring or late spring on pasture dry matter
production, clover content and selected quality parameters of a perennial ryegrass-white
clover pasture were investigated. Soil nitrogen dynamics in the 0-100, 200-300 and 400-500
mm soil layers were studied for 49 days following fertiliser N application.
The effect of 50 kg N ha-1 on soil N dynamics was generally the same as found at the 0 kg N
ha-1 applications and may therefore be regarded as a low risk treatment. The application of
150 kg N ha-1 especially in autumn and early winter showed a tendency to exceed the
absorption capacity of the pasture and thereby expose fertiliser N to possible leaching and
contamination of natural resources.
Increased fertiliser N rate resulted in a general increase in pasture dry matter production with
the highest yields recorded where N was applied in early and late spring and the lowest in
early winter. The application of 150 kg N ha-1 in early and late spring resulted in the highest
TDM production, however, the 50 kg N ha-1 resulted in a more efficient conversion of N
applied to additional DM produced. In contrast to DM production, the clover percentage
generally decreased as fertiliser N rate was increased. The effect of season of application was
inconsistent. Annual trends show that the clover percentage eventually recovered to the same
levels as the 0 kg N ha-1 treatments. Due to the above minimum levels recorded for most
mineral and quality parameters tested it is envisaged that treatment combinations as used in
this study will not be at any disadvantage to pasture and animal productivity.
The study has shown that the use of fertiliser N to boost perennial ryegrass-white clover
productivity and thereby minimising the negative effect of the winter gap on fodder flow
management during the cool season in the Western Cape Province, may be an important
management tool. Except for late spring applications, all seasons of application reduced the
negative impact of the winter gap on fodder availability. It is concluded that regression lines
as summarised in Tables 7.2 and 8.2 show great potential to be instrumental in developing
regression models, accurately predicting the effect of fertiliser N rate on pasture performance.
Other factors to be considered includes the productivity of the pasture, initial clover content,
expected clover content at the end of the first regrowth cycle after fertiliser N application and
the quantity of additional fodder required. Additional requirements will be to maintain a
clover content of between 30 and 50% and to avoid applying high rates of fertiliser N (100

v
and 150 kg N ha-1) in winter, as the N uptake capacity of the pasture could be exceeded and
thereby increasing the risk of N leaching, resulting in environmental pollution. The N
response efficiency of the pasture is also the lowest at the 150 kg N ha-1 rates, thereby
reducing the profitability of these treatments.
vi
UITTREKSEL Die reaksie van meerjarige raaigras en witklawer op stikstofbemestingspeile by verskillende
grondtemperature (6, 12 en 18 °C), grondwaterpotensiale (-10, -20, -25 en -35 kPa) en
groeiperiodes (Junie/Julie en Oktober/November) is onder gekontroleerde toestande ge-
evalueer. Die primêre- (PDM), residuele- (RDM) en totale droëmateriaalproduksie (TDM)
(g pot-1) is oor die eerste- en tweede hergroeisiklusse asook totale droëmateriaalproduksie oor
twee siklusse, onderskeidelik, gemeet. Blaar N-inhoud (%) is aan die einde van die eerste en
tweede hergroeisiklusse bepaal. Die aantal halms/stolons en worteldroëmassa (g pot-1) is aan
die einde van die tweede hergroeisiklus bepaal. Grond ammonium-N en nitraat-N is na
toediening van stikstofbehandelings gemonitor.
Beide meerjarige raaigras en wit klawer TDM produksie het afgeneem namate
grondtemperatuur gedaal het. Slegs meerjarige raaigras DM produksie is deur N bemesting
beïnvloed en het toegeneem namate N peile verhoog is. Raaigras TDM produksie tussen 100
en 150 kg N ha-1 het nie onderling verskil nie maar was beide hoër (P=0.05) as by die 0 en 50
kg N ha-1 peile. Grond nitraatvlakke 31 dae na toediening van 150 kg N ha-1 was steeds
voldoende om raaigras RDM produksie te verhoog. Die verhoging van 173.8% in raaaigras
TDM produksie by 6 °C met die toediening van 150 kg N ha-1 indien vergelyk met die 0 kg N
ha-1 behandeling bevestig die potensiaal van raaigras om by lae temperature op N bemesting
te reageer.
‘n Grondwaterpotensiaal van –20 kPa het hoër raaigras PDM en TDM produksie as by die
–25 en –35 kPa tot gevolg gehad. Witklawer PDM en TDM produksie was nie deur die
behandelings beïnvloed nie. ’n Toename in N peile het raaigras TDM produksie betekenisvol
verhoog. Grondwaterpotensiale van –35 kPa het die hoogste wortel DM in beide raaigras en
klawer tot gevolg gehad.
Beide meerjarige raaigras en witklawer PDM, RDM en TDM produksie was hoër tydens die
Oktober/November seisoen as gedurende Junie/Julie. Verhoogde N peile het hoër raaigras
PDM en TDM produksie tot gevolg gehad terwyl witklawer produksie nie beïnvloed was nie.
In die veldstudie is die effek van 0, 50, 100 en 150 kg N ha-1 as enkeltoediening gedurende
herfs, vroeë winter, laat winter, vroeë lente of laat lente op die DM produksie, klawerinhoud
en sekere kwaliteitsparameters van ‘n meerjarige raaigras-witklawer weiding ondersoek.

vii
Grondstikstofvlakke is oor ‘n tydperk van 49 dae na toediening van stikstof in die 0-100, 200-
300 en 400-500 mm grondlae gemonitor.
Die grondstikstofvlakke gemeet met die toediening van 50 kg N ha-1 was gewoonlik dieselfde
as by die 0 kg N ha-1 behandelings en word dus as ‘n lae risiko N peil beskou. Die toediening
van 150 kg N ha-1 veral gedurende die herfs en vroeë winter mag die N opnamekapasiteit van
die weiding oorskry en daardeur die toegediende N blootstel aan loging en moontlike
besoedeling van natuurlike hulpbronne.
Verhoogde N peile veroorsaak ‘n verhoging in DM produksie met die hoogste DM produksie
waargeneem met N toedienings gedurende die vroeë en laat lente en die laagste gedurende die
vroeë winter. Die toediening van 150 kg N ha-1 gedurende vroeë en laat lente het die hoogste
DM produksie tot gevolg gehad. Die mees effektiewe omskakeling van N toegedien tot
addisionele DM geproduseer is by die 50 kg N ha-1 peile waargeneem. In teenstelling met DM
produksie het ‘n toename in N peile ‘n afname in persentasie klawer tot gevolg gehad. Geen
tendens is ten opsigte van seisoen waargeneem nie. Jaarlikse tendense toon dat die persentasie
klawer gewoonlik herstel tot dieselfde vlakke as die 0 kg N ha-1 behandelings. Die vlakke van
kwaliteits en minerale parameters was meesal hoër as die minimum voorgeskryf en mag die
afleiding gemaak word dat geen nadelige effek as gevolg van die behandelingskombinasies
verwag word nie.
Die studie het aangetoon dat strategiese stikstofbemesting gedurende die koeler maande in die
Westelike Provinsie wel aangewend kan word om droëmateriaalproduksie te verhoog.
Uitsluitend die laat lente toedienings, het alle seisoene waartydens strategiese N bemesting
toegedien is sekere aspekte rakende die wintergaping suksesvol aangespreek. Die
regressievergelykings in Tabelle 7.2 en 8.2 toon potensiaal om modelle te ontwikkel wat
gebruik kan word om die effek van N insette op meerjarige raaigras-witklawer weidings
akkuraat te voorspel. Addisionele faktore wat in ag geneem moet word sluit die produktiwiteit
van die weiding, aanvangsklawer-inhoud, verwagte klawerinhoud na die eerste hergroeisiklus
na toediening van N bemesting en die hoeveelheid addisionele voer benodig, in. Die
verwagte klawerinhoud moet tussen 30 en 50% wees en die toediening van die hoër N peile
gedurende die winter moet vermy word aangesien die N opnamekapasiteit van die weiding
waarskynlik oorskry sal word wat N loging en moontlike kontaminasie van natuurlike
hulpbronne tot gevolg mag hê. Die feit dat die 150 kg N ha-1 behandelings die laagste

viii
stilstofverbruiksdoeltreffendheids-waardes tot gevolg gehad het sal ook die winsgewendheid
van die behandelings verlaag.

ix
ACKNOWLEDGEMENTS
• My Heavenly Father for the privilege and mercy to undertake and complete a study of
this nature.
Also the following persons and institutions:
• My wife Mariëtte and our children, Johandrè and Leandii, for continuous support and
sacrifices, especially during the last few months of completing this thesis.
• My parents, Jan and Monika, thank you for all the support and prayers during my
years of study.
• The Department of Agriculture Western Cape for the use of facilities and funding of
the study.
• University of Stellenbosch for financial assistance.
• Professor Andrè Agenbag, my promotor, for his valuable inputs, discussions and
assistance during the study and finalising this thesis.
• Dr Mark Hardy for valuable inputs during the experimental period and assistance with
reporting on the field study.
• The late Trudi Oberholzer for her inputs when the study was planned.
• Daniël Badenhorst and his team, M. Williams, L. Roberts, J. Abrahams, P. Adonis, J.
Adams J. Casper and D. Jaaps and for excellent technical assistance and accurate data
collection of the field trial.
• Anélia Marais and Leonard Roberts for technical assistance in the glasshouse.
• Anelda van Huyssteen with technical preparation of the dissertation.
• Dr Adri Kotze and Rudie van Zyl and their laboratory staff for soil analysis.
• Janine Joseph and her staff for plant analysis.
• Mardé Booyse for statistical analysis and assistance with interpretation of data.
• Wilna Brink and Elizabeth Valentine for numerous literature queries.

x
ABBREVIATIONS
ACC Absolute clover content
ADM Annual dry matter production
C Carbon
Ca Calcium
CP Crude protein
DM Dry matter
IVOMD In vitro organic matter digestibility
LAN Limestone ammonium nitrate
N Nitrogen
NH4+ -N Ammonium-nitrogen
NO3- -N Nitrate-nitrogen
P Phosphorus
PCP Primary clover percentage (first regrowth cycle)
PDM Primary dry matter production (first regrowth cycle)
RCP Residual clover percentage (second regrowth cycle)
RDM Residual dry matter production (second regrowth cycle)
TDM Total dry matter production (accumulative first + second regrowth cycle)
xi
TABLE OF CONTENTS Page
DECLARATION ii
ABSTRACT iii
UITTREKSEL vi
ACKNOWLEDGEMENTS ix
ABBREVIATIONS x
CHAPTER 1: Introduction 1
SECTION 1: GLASSHOUSE STUDIES 13
CHAPTER 2: The effect of soil temperature and fertiliser N rate on soil N
dynamics and the growth of perennial ryegrass (Lolium perenne)
and white clover (Trifolium repens) under controlled
conditions.
• Abstract 14
• Introduction 15
• Materials and methods 16
• Results and discussion 20
• Conclusion 42
• References 43
CHAPTER 3: The effect of high soil water levels and fertiliser N rate on soil N
dynamics and the growth of perennial ryegrass
(Lolium perenne) and white clover (Trifolium repens)
under controlled conditions.
• Abstract 47
• Introduction 48
• Materials and methods 50
• Results and discussion 54
• Conclusion 74
• References 75

xii
CHAPTER 4: The effect of production season and fertiliser N rate on the growth and
production of perennial ryegrass (Lolium perenne) and white
clover (Trifolium repens) under controlled conditions.
• Abstract 78
• Introduction 79
• Materials and methods 80
• Results and discussion 83
• Conclusion 89
• References 90
SECTION 2: FIELD STUDY 92
CHAPTER 5: MATERIALS AND METHODS 93
CHAPTER 6: The effects of strategic fertiliser N application during the cool
season on perennial ryegrass-white clover pastures in the
Western Cape Province: 1. Soil nitrogen dynamics
• Abstract 102
• Introduction 103
• Materials and methods 105
• Results and discussion 106
• Conclusion 115
• References 115
CHAPTER 7: The effects of strategic fertiliser N application during the cool
season on perennial ryegrass-white clover pastures in the
Western Cape Province: 2. Dry matter production
• Abstract 119
• Introduction 119
• Materials and methods 121
• Results and discussion 122
• Conclusion 134
xiii
• References 135
CHAPTER 8: The effects of strategic fertiliser N application during the cool
season on perennial ryegrass-white clover pastures in the
Western Cape Province: 3. Clover content
• Abstract 138
• Introduction 139
• Materials and methods 140
• Results and discussion 141
• Conclusion 154
• References 154
CHAPTER 9: The effects of strategic fertiliser N application during the cool
season on perennial ryegrass-white clover pastures in the
Western Cape Province: 4. Selected nutritive characteristics
and mineral content
• Abstract 159
• Introduction 160
• Materials and methods 161
• Results and discussion 162
• Conclusion 185
• References 185
CHAPTER 10:Conclusion 189
*Technical layout of this thesis is in accordance with norms prescribed for publication in the South African
Journal of Plant and Soil.

1
Chapter 1
Introduction Background
Cultivated pastures in the Western Cape Province of South Africa occupy about 1.02 million
ha, representing about 8.59% of all areas used for agricultural purposes, including forestry
and natural grazing (Anon, 1996). Both annual and perennial pastures are cultivated as
pastures only systems, or in combination with small grains, canola, lupins or vegetables.
Various combinations of grass only, legume only or grass-legume pastures are grown on 483
984 ha or 48.7 % of the cultivated area in the southern Cape region (Anon, 2003). Grass-
clover pastures (perennial ryegrass, white- and red clover) grown under irrigation form an
integral part of the dairy industry (Botha, 2003). Most of the dairy production units are small
and emphasis is placed on maintaining high DM production throughout the year.
Climatic conditions in the Western Cape Province however do not favour continuous high
fodder productivity throughout the year. Low temperatures causing a steep decline in dry
matter production, especially during the cooler autumn and winter months. Seasonal
production of perennial ryegrass-white clover pastures decreases to ca 500 kg DM month-1 in
June and July followed by an increase to ca 2000 kg DM month-1 in October and November
(Botha, 1994).
Importance of legumes in mixed pastures
The lower productivity of cultivated pastures during the cool season, the so called “winter or
feed gap”, is of major concern and very difficult to address successfully. Grass-clover
pastures are no exception. Growing a legume and grass as companion crops intensifies the
pressure on pasture management to maintain optimum grass:clover ratios especially with
management techniques aiming at bridging the winter gap. Growing grass-clover crops
together is challenging but the advantages outnumber the disadvantages. Firstly, clover in the
pasture improves pasture quality that results in increased milk-, beef or wool production.
Eerens & Ryan (2000) reported that mixed perennial ryegrass-white clover pastures produced
nearly 25% more dry matter, 40% (180 kg) more carcass weight and 25% (17 kg) more wool
2
ha-1 than ryegrass pastures receiving 270 kg N ha-1. Secondly, a legume clover is capable of
fixing large quantities of atmospheric nitrogen and through recycling this N becomes
available for absorption by the ryegrass fraction (Martin, 1960) and thereby reducing fertiliser
N cost. Martin (1960), in a review article, came to the conclusion that nitrogen transfer within
a grass-legume pasture can either be as a result of direct movement of nitrogenous compounds
from the legume root nodules through the soil to the companion crop, decaying nodules and
legume roots, trampling followed by decomposition of aerial and sub-aerial parts of the
legume during grazing or senescence of nodules following changes in the root:shoot ratio of
the legume crop, especially if stress related such as defoliation and covering by excreta of the
grazing animals. Davidson & Robson (1990) reported that ryegrass in a grass-clover pasture
consistently had higher leaf N contents than pure grass grown in monoculture. Thirdly,
legumes improve seasonal distribution of the forage by being more productive later in the
year than the companion grass crop (Sleugh et al., 2000).
Disadvantages of legumes in a pasture are the possibility of bloat in animals and the poor
predictability of legume performance (Miles & Manson, 2000). To ensure that fodder of
optimum quality and quantity is produced a clover content of between 30 and 50 percent must
be maintained (Martin, 1960; Curll, 1982; Harris, 1994).
Factors that may affect the productivity of a perennial ryegrass-white clover pasture
Nitrogen
The availability of nitrogen in the perennial ryegrass-white clover pasture affects the
competition between the ryegrass and the clover components. The competitive ability of white
clover can be reduced as N supply is increased which will favour the grass and suppress
clover productivity (Simpson, 1987). Legume dynamics in a temperate Australian pasture is
summarised by the nitrogen driven regeneration cycle as postulated by Turkington & Harper
(1979). The regeneration cycle starts with Trifolium repens and Lolium perenne grown
together due to the asynchronous growth cycles and the high N requirement of L. perenne.
The second phase sees a decline of T. repens as N levels rise and grass increases dominance
followed by an invasion of Alopecurus pratensis and/or Dactylis glomerata at high N levels
resulting in a decline in Lolium perenne. Phase four results in a decline in N levels followed
by invasion of slower growing, less N demanding species e.g., Anthoxanthum odoratum and

3
Agrostis tenuis. Invasion by Trifolium repens into slow-growing grasses follows and is later
joined by Lolium perenne completing the regeneration cycle. The detrimental effect of high
levels of soil N, direct or indirect, on clover productivity and persistence is eminent from the
regeneration cycle.
Management techniques aiming at bridging the winter gap are well documented (Ball, Molloy
& Ross, 1978; Eckard & Franks, 1998; McKenzie et al., 1999). One technique is the
application of fertiliser N to boost pasture productivity during a predetermined season as most
farmers rely on biologically fixed N as the main source of nitrogen supply to a perennial
ryegrass-white clover pasture. Relying on biologically fixed N as sole N source normally
results in poor pasture growth at low temperatures (Field & Ball, 1978; Frame & Boyd, 1987).
Low soil temperature during winter and early spring limits clover-derived N availability to the
pasture and will also restrict N-mineralisation. These low temperatures result in grass-clover
pastures that rely on biologically fixed N as their main source of N to be often N deficient
(Van Berg et al., 1981; Nannipieri, Ciardi & Palazzi, 1985). Pasture productivity may be
limited by a lack of available soil N from late autumn to late spring due to the reduction in the
rate of N-mineralisation and biological N fixation as temperatures decrease (Frame &
Newbould, 1986). Clover growth and microbiological activity are low and the possibility of
permanent detrimental effects of moderate levels of fertiliser N on the clover fraction very
slim. This leaves the opportunity to stimulate grass growth through the application of strategic
N fertilization without permanently suppressing clover growth (Frame & Newbould 1986;
Stout, Weaver & Elwinger, 2001). Thus, if soil N levels are limiting and optimal N
application rates for different seasons during the cool months can be determined, farmers
could continue grazing later in autumn and begin grazing earlier in spring and still maintain a
desirable clover content to sustain high summer and autumn production. Moller et al., (1996
as cited by McKenzie et al., 1999) reported that the use of fertiliser N could advance the
attainment of a “predetermined” herbage mass by about 2 weeks. However if fertiliser N
application is too high, the clover content of the sward becomes too low to provide sufficient
N to the sward later in the growing season (Thomas, 1992; Caradus et al., 1993).
Application of fertiliser N during the cooler months to boost pasture productivity while still
maximizing the utilisation of clover-derived N in the warmer months might be a viable
management option. This practice can be very useful since Ball & Field (1982) reports that

4
symbiotic N fixation rarely supplies sufficient N to achieve more than 70% of potential
pasture production while Eckard (1994) suggests that more consideration should be given to
the possibility that both N fertiliser and N fixation may contribute to the N nutrition of the
pasture, but during different seasons of the same year. In all scenarios must the increase in
herbage production from fertiliser N be weighed against the possible decline in white clover
performance.
Use of nitrogen fertilisers
The application of fertiliser N usually results in an increase in dry matter production of
perennial ryegrass-white clover pastures. Stout, et al. (2001) found that early season DM
yields from grass-clover pastures could be increased by ca 20% with an application of about
45 kg N ha-1 and by starting to graze at a 15 cm pasture height, the clover fraction in the
sward would be maximized. Eckard & Franks (1998) recorded yield increases of between 582
and 703 kg dry matter ha-1 with fertiliser N application. Nitrogen response efficiency (kg
additional DM produced per kg N applied) however decreases as fertiliser N rate increases
(Eckard & Franks, 1998).
It is generally agreed that white clover is at a competitive disadvantage when grown with
most grass species. The grasses normally grow taller, have a larger root mass and have less
critical climatic and nutritional requirements (Haynes, 1984; Frame & Newbould, 1986). It is
widely accepted that the application of fertiliser N results in a decrease in clover content of
grass-clover swards. The mechanisms involved are not fully understood. Davidson & Robson
(1990) detected evidence that white clover plants respond positively rather than negatively to
mineral N. Recent work showed that clover in mixtures are not at any disadvantage relative to
grass in terms of competition for sunlight because in a well fertilised sward they raise their
leaves high into the canopy and intercept more light per unit leaf area than grass and fix more
carbon as a result (Davidson, Robson & Dennis, 1982; Woledge, 1988). Dennis & Woledge
(1985) ascribed the decreased clover portion to the increased competition for light brought on
by the stimulated growth of the grass. The reduction in clover content could therefore be
ascribed to the inability of the clover plant to grow and compete with the grass fraction
possibly as a result of slow N supply through biological N fixation or the inability of clover
roots to increase N uptake from the soil solution.

5
In the light of environmental concerns regarding N losses from intensively grazed pastures
Olsen & Kurtz (1982) as well as Whitehead (1995), recommended that rates of fertiliser N per
application should aim to remain within the steepest portion of the response curve of the
pasture to ensure efficient N use. High rates of N fertiliser, applied in a single application,
favour losses by volatilization and leaching (Olsen & Kurtz, 1982) and lead to N uptake
surplus to the plant’s requirement for growth (Eckard, 1990). Excess N taken up by the
pasture may also be potentially toxic to ruminants (Eckard, 1990).
Various studies showed that N fertiliser applied to irrigated ryegrass and ryegrass-white
clover pastures during active pasture growth, will have little effect after the first harvest. Stout
et al. (2001) found that the effect of 44.8 kg N ha-1 applied in early spring was short lived and
largely dissipated after the first month of production while Murtagh (1975, cited Whitehead,
1970) reported that most uptake of fertiliser N occured within four weeks after fertiliser N
application. Reid (1984) however, demonstrated that at the harvest immediately after that for
which the N was applied, a residual effect of 30-35% of the size of the direct effect was
measured. Leaving excessive free N in the soil is not advisable since the possibility of
leaching out of the active root zone always exists especially under the high rainfall conditions
as experienced in the Western Cape Province in winter.
The growth rate of perennial ryegrass-white clover pastures are amongst others influenced by
temperature, water supply as well as daylength and will therefore be determinants in the
potential response to fertiliser N application (Whitehead, 1995; Frame, 1994). The application
of fertiliser N as a strategic dressing to increase pasture productivity during the cool season in
the Western Cape Province will mainly be affected by the three factors listed in combination
with the rate of fertiliser applied.
Temperature
Pasture dry matter production (kg DM ha-1), N mineralisation and nitrification are reduced as
temperature decreases in autumn. The temperature requirements of perennial ryegrass and
white clover differ. Perennial ryegrass is still able to grow and therefore respond to N
fertiliser at temperatures below 5 oC (Frame, 1994; Whitehead, 1995). Although it is
commonly believed that white clover shoot growth is possible at 5.8 °C, Martin (1960) found
that active N fixation requires a temperature of 9 °C. Munro (1970) concluded that the

6
optimum temperature requirement for clover is within the 9 to 27 °C range with an optimum
of 25 °C while Brougham, Bull & Williams (1978) found the range to be 18 to 30 °C with an
optimum of 24 °C. Due to higher temperature requirements, white clover will normally start
growth 2 to 3 weeks later and cease growth earlier than most ryegrass species (Williams, 1970
cited by Frame & Newbould, 1986). The fact that clover growth will be restricted at soil
temperatures of approximately 9 oC, while ryegrass will still respond to fertiliser N at soil
temperatures of 5 °C and even lower, opens the opportunity to stimulate ryegrass production
with minimum disturbance of the companion white clover crop.
Determining the effect of temperature on strategic fertilisation over seasons is complicated by
the fact that falling temperatures in autumn might be comparable to rising temperatures in
spring as confirmed by Eckard & Franks (1998) who found no clear relationship between soil
temperature and pasture N response, as some of the responses were measured over a period of
both declining and inclining trends in soil temperatures.
Soil moisture
Continuous rain, as often experienced during winter months in the Western Cape Province,
can leave the soil water at levels near field water capacity and higher for several days during
the cool season. It is anticipated that high soil water levels will influence Rhizobium- and root
activity.
Huang, Boyer & Vanderhoff (1975) suggest that the nitrogen fixing ability of the Rhizobia,
measured by acetylene reduction, is influenced by the rate of photosynthesis and the supply of
assimilates from the host plant. Frederick (1978) in a review article concluded that CO2
enrichment studies clearly showed that the capacity of the N2 fixing system could be
increased when more photosynthate becomes available. It can therefore be assumed that
plants stressed as a result of too high soil water levels will indirectly reduce the Rhizobia’s
ability to effectively fix atmospheric N.
High soil water content will decrease the volume occupied by the soil air and as a result
gaseous exchange between the soil and atmosphere might be slowed down. This restriction in
gaseous exchange can reduce plant root activity as well as absorption of plant nutrients from
7
the soil solution (Russell, 1988). Due to contrasting results the response of perennial ryegrass
and white clover to fertiliser N applied under high soil water potentials must be evaluated.
Season of production
Productivity, as a function of photosynthesis, of pastures grown under high potential
conditions is normally limited by incoming solar energy, while transpiration is controlled by
net radiation (Russell, 1988). Most of the net radiation is dissipated as transpiration under
these conditions. Since net radiation is closely correlated with incoming radiation, Russell
(1988) suggested that rates of photosynthesis and transpiration would be closely related. It
could therefore be assumed that the length of exposure to incoming solar energy would
influence pasture productivity.
Aim The aim of this study was to evaluate the possible use of fertiliser N as a management tool to
reduce the negative impact of low pasture productivity during the cool season on fodder flow
management. This may be achieved either through reducing the duration of the winter gap by
stimulating productivity later in autumn or earlier in spring or through increased dry matter
production in winter. Specific objectives will firstly be to determine the individual response
and production potential of perennial ryegrass and white clover to different fertiliser N levels
in combination with different soil temperatures, soil water levels and different seasons of
production. Secondly, to monitor the concentration of the ammonium-N and nitrate-N
fractions over depth and time and thereby acquiring info that could assist in determining
optimum fertiliser N rates not only to maximise N use efficiency but also minimising leaching
under the set of conditions that prevailed during the years covered by the study. Thirdly, to
determine optimum fertiliser N rate(s) during different seasons that will ensure increased dry
matter production, maintaining acceptable clover levels and producing fodder of acceptable
quality.
References
ANON., 1996. Databank Resource Utilization. Department of Agriculture Western Cape,
Private Bag x1 Elsenburg, 7607.

8
ANON., 2003. Duisendpuntopname Suidkusstreek. Outeniqua Proefplaas, Posbus 249,
George, 6530.
BALL, P.R. & FIELD, T.R.O., 1982. Nitrogen cycling in intensively-managed grasslands: A
New Zealand viewpoint. In P.E. Bacon, J. Evans, P.R. Storrier & A.C. Taylor (eds.).
Nitrogen Cycling in Temperate Agricultural Systems. Australian Society of Soil
Science Inc. Wagga Wagga, NSW.
BALL, P.R., MOLLOY, L.F. & ROSS, D.J., 1978. Influence of fertiliser nitrogen on herbage
dry matter and nitrogen yields, and botanical composition of a grazed grass-clover
pasture. New Zealand Journal of Agricultural Research 21, 47-55.
BOTHA, P.R., 1994. Voervloeibeplanning vir ‘n tipiese suiweleenheid. Weidings Pastures.
Department of Agriculture Western Cape, Private bag x1, Elsenburg, 7607.
BOTHA, P.R., 2003. Die produksiepotensiaal van oorgesaaide kikoejoeweiding in die
gematigde kusgebied van die Suid-Kaap. Ph.D (Agric)- proefskrif, Universiteit van
die Vrystaat, Bloemfontein.
BROUGHAM, R.W., BULL, P.R. & WILLIAMS, W.M., 1978. The ecology and
management of white clover-based pastures. In J.R. Wilson (ed.). Plant Relations in
Pastures. CSIRO, Canberra, Australia.
CARADUS, R.J., PINXTERHUIS, J.B., HAY, R.J.M., LYONS, T. & HOGLUND, J.H.,
1993. Response of white clover cultivars to fertilizer nitrogen. New Zealand Journal
of Agricultural Research 36, 285-295.
CURLL, M.L., 1982. The grass and clover content of pastures grazed by sheep. Herbage
Abstracts 52, 403-411.
DAVIDSON, I.A. & ROBSON, M.J., 1990. Short-term effects of nitrogen on the growth and
nitrogen nutrition of small swards of white clover and perennial ryegrass in spring.
Grass and Forage Science 45, 413-421.

9
DAVIDSON, I.A., ROBSON, M.J. & DENNIS, W.D., 1982. The effect of nitrogenous
fertilizer on the composition, canopy structure and growth of a mixed grass/clover
sward. Grass and Forage Science 37, 178-179.
DENNIS, W.D. & WOLEDGE, J., 1985. The effect of nitrogenous fertilizer on the
photosynthesis and growth of white clover/perennial ryegrass swards. Annals of
Botany 55, 171-178.
ECKARD, R.J., 1990. The relationship between the nitrogen and nitrate content and nitrate
toxicity potential of Lolium multiflorum. Journal of the Grassland Society of Southern
Africa 7, 174-178.
ECKARD, R.J., 1994. The nitrogen economy of three irrigated temperate grass pastures with
and without clover in Natal. Ph.D thesis, University of Natal.
ECKARD, R.J. & FRANKS, D.R., 1998. Strategic nitrogen fertiliser use on perennial
ryegrass and white clover pasture in north-western Tasmania. Australian Journal of
Experimental Agriculture 38, 155-160.
EERENS, J.P.J. & RYAN, D.L., 2000. Managing white clover for productive and profitable
sheep farming in Southland. Proceedings of the New Zealand Grassland Association.
62, 137-140.
FIELD, T.R.O. & BALL, R., 1978. Tactical use of fertilizer nitrogen. Proceedings of the
Agronomy Society of New Zealand 8, 129-133.
FRAME, J., 1994. Soil fertility and grass production; nitrogen. In: J. Frame (ed.). Improved
Grassland Management. Farming Press Books, Redwood Press, Melksham, Wiltshire,
UK.
FRAME, J. & BOYD, A.G., 1987. The effect of strategic use of fertiliser nitrogen in spring
and/or autumn on the productivity of perennial ryegrass/white clover sward. Grass
and Forage Science 42, 429-438.

10
FRAME, J. & NEWBOULD, P., 1986. Agronomy of white clover. Advances in Agronomy
40, 1-88.
FREDERICK, L.R., 1978. Effectiveness of Rhizobia-Legume Associations. In C.S. Andrew
& E.J. Kamprath (eds.). Mineral Nutrition of Legumes in Tropical and Subtropical
Soils. 1978. CSIRO, Melbourne, Australia.
HARRIS, S.L., 1994. Nitrogen and white clover. Dairy Research Corporation, Hamilton. 22-
27.
HAYNES, R. J., 1984. Lime and phosphate in the soil-plant-system. Advances in Agronomy
37, 249-317.
HUANG, C. Y., BOYER, J.S. & VANDERHOFF, L. N., 1975. Limitation of acetylene
reduction (nitrogen fixation) by photosynthesis in soybean having low water
potentials. Plant Physiology 56, 228.
MARTIN, T.W., 1960. The role of white clover in grassland. Herbage Abstracts 30, 159-164.
McKENZIE, F.R., RYAN, M.J., JACOBS, J.L. & KEARNEY, G., 1999. Effect of rate and
time of nitrogen application from autumn to midwinter on perennial ryegrass-white
clover dairy pastures in western Victoria. 1. Growth and composition. Australian
Journal of Agricultural Research 50, 1059-1065.
MILES, N. & MANSON, A.D., 2000. Nutrition of planted pastures. In N. Tainton (ed.).
Pasture Management in South Africa. University of Natal Press, Pietermaritzburg.
MUNRO, J.M.M., 1970. Occasional Symposium of the British Grassland Society.
NANNIPIERI, P., CIARDI, C. & PALAZZI, T., 1985. Plant uptake, microbial
immobilization, and residual soil fertilizer or urea-nitrogen in a grass/legume
association. Soil Science Society of America Journal 49, 452-457.

11
OLSEN, R.A. & KURTZ, L.T., 1982. Crop nitrogen requirements, utilization and
fertilization. In F J Stevenson (ed.). Nitrogen in agricultural soils. Madison,
Wisconsin.
REID, D., 1984. The seasonal distribution of nitrogen fertiliser dressings on pure perennial
ryegrass swards. Journal of Agricultural Science Cambridge 103, 659-669.
RUSSELL, E.W., 1988. Russell’s Soil Conditions and Plant Growth. 11th edition. A. Wild
(ed.). Longman: London, New York.
SIMPSON J.R., 1987. Nitrogen nutrition of pastures. In J. L. Wheeler et al., (ed.). Temperate
pastures their production, use and management. AWC/CSIRO, Australia.
SLEUGH, B., MOORE, K.J., GEORGE, J.R. & BRUMMER EC., 2000. Binary legume-grass
mixtures improve forage yield, quality and seasonal distribution. Agronomy Journal
92, 24-29.
STOUT, W.l., WEAVER, R.S. & ELWINGER, G.F., 2001. Effects of early season nitrogen
on grass-clover swards in the Northern USA. Agronomy Journal 93, 1000-05.
THOMAS, R.J., 1992. The role of legumes in the nitrogen cycle of productive and sustainable
pastures. Grass and Forage Science 47, 133-142.
TURKINGTON, R. & HARPER, J.L., 1979. The growth, distribution and neighbour
relationships of Trifolium repens in a permanent pasture. Journal of Ecology 67, 201-
218.
VAN BERG, P.F.J., PRINS, W.H., DEN BOER, D.J. & SLUIMAN, W.J., 1981. Nitrogen
and intensification of livestock farming in EEC countries. Proceedings of the
Fertiliser Society 199, 1-88.
WHITEHEAD, D.C., 1970. The role of nitrogen in grassland productivity. Bulletin 48,
Commonwealth Agricultural Bureaux.

12
WHITEHEAD, D.C., 1995. Legumes; Biological nitrogen fixation and interaction with
grasses. In‘Grassland Nitrogen’. CAB International: Wallingford, UK.
WOLEDGE, J., 1988. Competition between grass and clover in spring as affected by nitrogen
fertilizer. Annals of Applied Biology 112, 175-186.

13
SECTION 1
Glasshouse study
Growing a legume and grass successfully as a mixed pasture is challenging and needs
specialized knowledge of the reaction of the individual species to external influences.
Due to difficulties in the manipulation and control of environmental influences under field
conditions, a series of glasshouse studies were done to develop a better understanding of how
the different companion crops in a mixed pasture will react to environmental conditions that
might occur occasionally under field conditions. The knowledge obtained might contribute
towards improved management with special reference to strategic fertiliser N programmes
during the cool season when pasture productivity under field conditions decrease
dramatically.
Three trials to evaluate the effect of soil temperature, soil water potential and production
season were done and are discussed in Chapters 2, 3 and 4. The results obtained from these
studies can be very important in explaining certain reactions observed in the field study. Of
special importance is that the growth medium was collected from the experimental site used
for the field study. It could therefore be assumed that soil factors related to the treatments be
representative of what could happen under field conditions if similar conditions tested in the
glasshouse are experienced under field conditions.

14
Chapter 2
The effect of soil temperature and fertiliser N rate on soil N dynamics and
the growth of perennial ryegrass (Lolium perenne) and white clover
(Trifolium repens) grown under controlled conditions.
Abstract
The effects of 0, 50, 100 and 150 kg N ha-1 on N-mineralisation as well as the growth and
development of perennial ryegrass and white clover grown in pots at root temperatures of 6,
12 and 18 °C were investigated. Soil samples for ryegrass were collected at 2, 8, 15, 31 and
60 days and clover 7, 14, 21, 31 and 60 days after fertiliser N application and analyzed for
ammonium- and nitrate-N. Dry matter production and leaf nitrogen content were recorded at
31 (primary dry matter production) and 60 days (residual dry matter production) after
fertiliser N application. Root dry mass was recorded at 60 days.
The highest (P=0.05) primary ryegrass dry matter yields (PDM) were recorded at 100 kg N
ha-1 and the lowest (P=0.05) at 0 kg N ha-1. Mean residual ryegrass dry matter production
(RDM) increased as fertiliser N rate increased to 150 kg N ha-1. The lower soil nitrate levels
from days 31 to 60 restricted residual ryegrass dry matter production at 12 °C to the same
level as 6 °C possibly as a result of the lower soil N content restricting N supply to roots.
Perennial ryegrass PDM and TDM yields were the lowest at 6 °C. White clover PDM, RDM
and TDM were influenced (P=0.05) only by soil temperature resulting in slightly lower yields
at 6 °C. Increasing fertiliser N rates increased (P=0.05) the number of ryegrass tillers per plant
but did not influence clover stolon production. Leaf nitrogen content at 31 days in both
ryegrass and clover were higher than the 2 to 3.2% or 3.2 to 3.6% regarded as adequate for
ryegrass and white clover respectively. N recovery rates of 100% were achieved at most of
the treatment combinations mainly as a result of the impermeable pots. Nitrification of
ammonium increased between days 15 and 31 causing nitrate content to increase, especially at
18 and 12 °C and simultaneously decreasing ammonium-N content. Soil nitrate-N levels at 31
days were still sufficient to stimulate ryegrass RDM yields at the 150 kg N ha-1 rates. The
study showed that perennial ryegrass could respond to fertiliser N at soil temperatures as low
as 6 °C while white clover response will be less affected.

15
Keywords: dry matter production, fertiliser nitrogen rate, leaf nitrogen, NH4+-N, NO3
--N, perennial
ryegrass, root dry mass, temperature, tillers
Introduction
Herbage shortages as a result of low soil temperatures occur between autumn and spring when
temperatures in the Stellenbosch district of the Western Cape Province decrease from an
average monthly minimum (maximum in brackets) of 11.5 °C (23.8 °C) in April to a low of
7.2 °C (16.8 °C) in July (Anon, 2004). The application of fertiliser N to boost dry matter
production of perennial ryegrass-clover pastures during the cool season generally consists of a
single application dictated by herbage supply and demand. Information regarding the response
of perennial ryegrass to fertiliser N applied during the cool season in the Western Cape
Province is required to develop an efficient strategic N fertilisation programme.
Different rates of fertiliser N will influence crop characteristics, including plant cells (Russell,
1988), foliage:root ratios (Hatch & MacDuff, 1991), dry matter production (Eckard, 1994)
and herbage quality (Hegarty, 1981; Hibbet, 1984 cited by Eckard, 1994). The characteristics
of the growth medium or soil will strongly influence root activity (Russell, 1988) as well as
soil N reactions and availability (Clarkson & Warner, 1979; Tinker, 1979; Miles & Manson,
2000).
The fate of the applied fertiliser is influenced by a range of potential reactions related to soil
temperature such as denitrification (Tinker, 1979), immobilisation and mineralisation (Miles
& Manson, 2000). Soil temperature may also indirectly influence N absorption due to changes
in plant growth rate and partitioning of growth between roots and shoots and thus affecting
growth-led demand for soil nitrogen uptake (Kessler, Boller & Nösberger, 1990).
Varying soil temperatures will affect the fertiliser N applied as well as the ability of the
pasture to effectively respond to the applied fertiliser N. Nitrogen absorption is expected to
decrease as temperatures decrease (Hatch & MacDuff, 1991), as will the absorption of nitrate
relative to ammonium in perennial ryegrass (Clarkson & Warner, 1979). Clarkson and Warner
(1979) stated that ammonium is more readily absorbed at lower temperatures if applied in the
same concentration as nitrate but attribute the differences to changes in different parts of the
cell membrane rather than soil temperature suggesting that ammonium inhibits the absorption
16
of nitrate. These arguments lead to the final suggestion that the transition temperature
(difference between soil and plant temperature) seems to account for the increased ammonium
absorption rather than nitrate at low temperatures, a factor not considered in this study. Low
soil temperatures will also result in reduced root activity restricting the response to fertiliser N
as Hatch and MacDuff (1991) reported that mean rates of total N uptake of clover per unit
shoot weight changed little between 9 and 25 °C, but decreased progressively as soil
temperatures drop to below 9 °C due to a decline in uptake rates of ammonium and nitrate.
This reaction will be crop specific and might open the opportunity to stimulate the
productivity of one crop in a mixed pasture with minimum detrimental effects to the
companion crop(s). The reduced permeability of the root membranes under low temperatures
may be a contributing factor (Russell, 1988). Nodulation and symbiotic N fixation will be
negatively affected as soil temperatures decrease (Russell, 1988). Hatch and MacDuff (1991)
however, suggest that N2 fixation by clover under sustained low soil ammonium and nitrate
concentrations will be less sensitive to low root temperatures than are either the ammonium or
nitrate uptake systems. A statement supported by results showing that the contribution of N2
fixation decreased with increased temperature from 51% at 5 °C to 18% at 25 °C. The N2
fixation at 5 °C will possibly not sustain moderate clover productivity as Martin (1960) found
that white clover requires a temperature of 9 °C for active N fixation.
The aim of this study was to evaluate the response of perennial ryegrass and white clover to
fertiliser N at different soil temperatures and to investigate the possibility to increase species
productivity through increased soil-N levels at these lower soil temperatures (as is found
during the cool season in the Western Cape Province). Understanding and quantifying the
response of perennial ryegrass to these variables are necessary to optimise fertiliser N
management under low temperature conditions.
Materials and methods
Locality
Perennial ryegrass (Lolium perenne cv. Ellet) and white clover (Trifolium repens cv. Haifa)
were established separately in pots in a glasshouse under natural photoperiod and light
intensity conditions at the Institute for Plant Production, Elsenburg (altitude 177m, 18o50’E,

17
33o51’S). Day/night temperatures were regulated at 18 and 12 °C for 10 and 14 hours
respectively.
Growth medium preparation
Topsoil (0-150 mm layer) from the orthic A horizon of an Oakleaf soil (Soil Classification
Working Group, 1991) derived mainly from granite (Anon, 1996) was used as growth
medium. To achieve a relative uniform bulk density over all pots the soil was gathered in
heaps, mixed and ran through a 5 mm screen to separate the larger clods (aggregates) and crop
residues from the soil used as growth medium. A composite soil sample was collected and
analysed for both physical- and chemical properties (Table 2.1). Physical soil properties were
determined using the hydrometer method as described by van der Watt (1966). Extractable P,
K, Na, Ca and Mg were determined using the citric acid (1%) method of analysis, extractable
Cu, Mn and Zn by di-ammonium EDTA and extractable B by the hot water technique. The
Walkley-Black method was used to determine the organic carbon content (Non-Affiliated Soil
Analysis Work Committee, 1990).
Table 2.1 Chemical analysis and selected physical properties of the soil used as growth
medium at Elsenburg
pH (KCl) 6.3 Clay % 14Resistance Ohms 830 Silt % 13.1P (citric acid) mg/kg 36 Fine Sand % 49.8K cmol(+)/kg 0.27 Medium Sand % 15.9Ca cmol(+)/kg 2.36 Course Sand % 7.2Mg cmol(+)/kg 1.08Na cmol(+)/kg 0.47 Classification SaLmTotal cations cmol(+)/kg 4.18
Copper mg/kg 0.94Zinc mg/kg 0.81Manganese mg/kg 76.84Boron mg/kg 0.47
Carbon % 0.64
Ammonium-N mg/kg 3.933Nitrate-N mg/kg 7.507
Chemical properties Physical properties

18
The variation in soil properties (organic carbon etc), between the soil used as growth medium
in the different glasshouse studies can be ascribed to the fact that soil for the studies were
collected in different camps adjacent to the camp where the field study (see Chapter 5) was
done. The pastures grown in these camps were not the same therefore resulting in the
differences as observed. Soil fertility levels were corrected through application of single
superphosphate and potassium chloride to levels recommended by Beyers (1983). Copper,
manganese and zinc were sufficient with boron marginally low. Foliar nutrition (N, P, K, Ca,
Mg, S, B, Fe, Zn and Mo) was applied twice during the pre-treatment growth period and five
days after each cut to prevent any nutrient deficiencies. The C content of 0.64 was low. An
equivalent of 40 kg N ha-1 was applied at seeding to maintain plant growth during the pre-
treatment growth period. Ammonium-N (3.93 mg kg-1) and nitrate-N (7.51 mg kg-1) content
were determined before N treatment application. The soil was dried in stainless steel bins at
60 °C. To facilitate non-destructive soil sampling during the growth period, pots were lined
with plastic bags and filled with 6.6 kg of the oven dried soil, occupying a volume of 4324.57
cm3, resulting in a bulk density of 1.53 g cm-3. Pots were watered and left for ten days to
enable weed seed to germinate. After removing the weeds a template with five holes, one in
the centre and one in each quarter of the pot, was used to plant the seed in a predetermined
configuration at 5-10 mm depth. A few seeds were planted per hole followed by water
application to fill the soil to field water capacity (0.253 mm3 mm-3). Seedlings were thinned
after emergence to five plants per pot. Pots were watered daily through weighing and adding
water to the predetermined weight at field water capacity. Changes in plant weight as a result
of growth, on a weekly basis, and soil removal due to soil sampling were considered when pot
weight after watering was calculated. Pots were randomised after watering.
Plants was allowed to grow for an accumulative photoperiod of ca 691 hours from planting
and clipped at 50 mm height. The clippings were dried at 60 °C for ca 18 h upon which pots
showing least variation in DM production were at random allocated to the treatment
combinations. Waterbaths were filled with water and covered with a layer of fermolite that
served as isolation to maintain a constant water temperature. To ensure uniform soil
temperature the water level was kept to the same height as the soil in the pots. Water
temperature was electronically controled at 6, 12 and 18 °C. After treatments were allocated
(not applied), pots were placed in the water baths and left for 72 hours to stabilise at the
temperature of the water followed by application of the N treatments.

19
Experimental design and treatments
The experimental design was a completely randomised design (Snedecor & Cochran, 1967)
with a factorial treatment design. Factors tested were soil temperatures (6, 12 and 18 °C) and
fertiliser N rate (the equivalent of 0, 50, 100 and 150 kg N ha-1 applied as LAN dissolved in
200 ml water). Fertiliser N rate was replicated four times. Water temperatures were recorded
using MCS 486 T temperature dataloggers.
Data collection
DM production was recorded by cutting the ryegrass at 50 mm height 31 and 60 days after
nitrogen treatments had been applied. Fresh weight was recorded, cuttings ovendried at 60 °C
for 72 hours and dry weight noted. Dried cuttings were ground to pass through a 1mm mesh
screen and analyzed for N content using the Dumas-N method (AOAC, 1970). The number of
tillers at 60 days was recorded. After residual dry matter production was recorded, roots were
removed by wet sieving using a 2 and 1 mm combination sieve, dried at 60 °C for 72 h and
dry mass recorded.
Dry matter production was recorded as primary - (PDM) at 31 days, residual – (RDM)
production from 31 to 60 days and total dry matter production (TDM which is the cumulative
DM production over 60 days). Leaf N yield (g N pot-1) was calculated as the product of leaf N
% and dry matter produced.
Soil samples were collected at 2, 8, 15, 31 and 60 days after the N treatments were applied in
ryegrass and 7, 14, 21, 31 and 60 days in clover. Soil samples were collected through pulling
the plastic bag containing the soil and plants from the pot. Four sub samples per pot were
taken, at the soil surface, 3 cm from top, in center (9 cm) and 3 cm from the bottom, through
cutting holes in the bags at the front, back, left and right hand side of the pot and bulked as
one sample. After sealing the sample-holes with 50 mm cello tape the bags were put back into
the pots. To minimise any changes in ammonium and nitrate content samples were
immediately dried using electric fans and stored in a freezer (Westfall, Henson & Evans,
1978) until analyzed for NH4--N and NO3
--N content using the Auto Analyzer method
(Bessinger, 1985). Allthough some nitrate losses could be expected (Wiltshire & Du Preez,
1994a; Wiltshire & Du Preez, 1994b), air drying of soil samples was decided on as the aim of

20
measuring soil N content was to compare soil N levels as a result of the different treatment
combinations.
Statistical procedures
Analysis of variance (ANOVA) was performed using SAS version 8.2 (SAS, 1999). The
Shapiro-Wilk test was used to test for non-normality (Shapiro & Wilk, 1965). Student's t-
Least Significant Difference (LSD) test was calculated at the 5% confidence level to compare
treatment means (Ott, 1998).
Results and discussion
Soil ammonium- and nitrate-N content
Perennial ryegrass
Differences in NH4+-N and NO3
--N content in ryegrass as a result of fertiliser N rate were
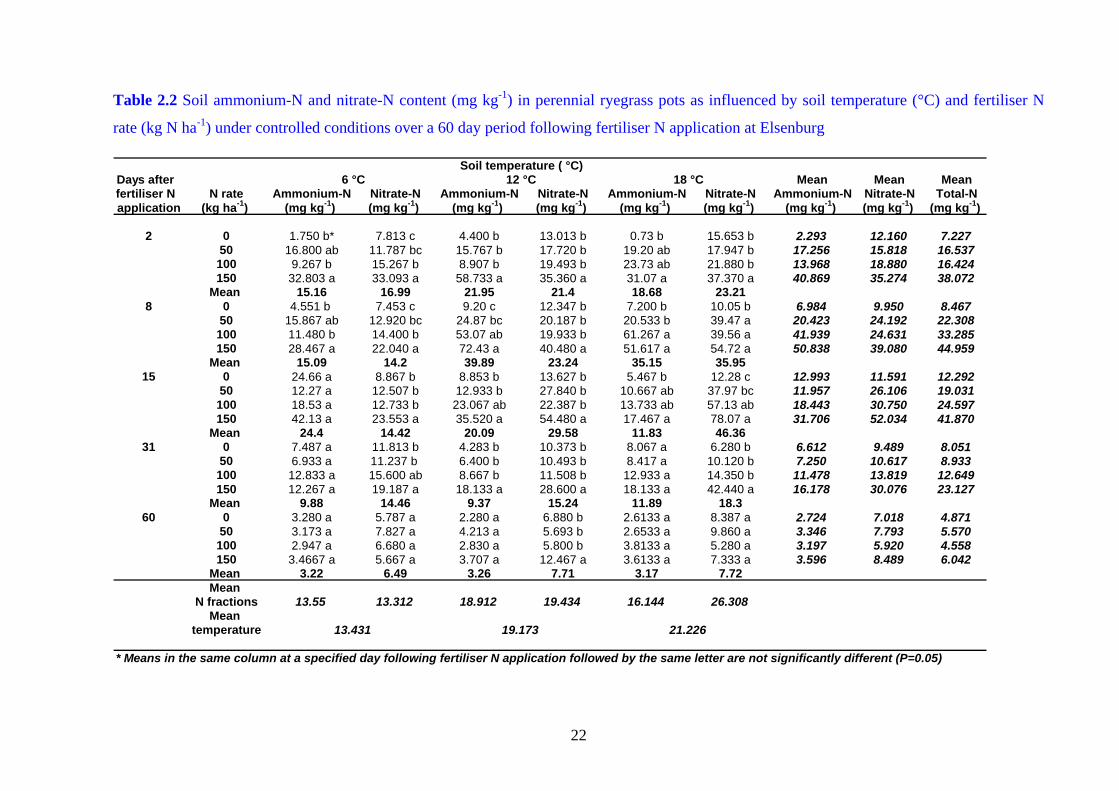
found within two days after fertiliser N application (Table 2.2; Figures 2.1 & 2.2). Mean
NH4+-N content at the 6, 12 and 18 °C treatments, two days after N applications were 15.16,
21.95 and 18.68 mg kg-1, respectively (Table 2.2). A decrease in NH4+-N content at 12 and 18
°C between days 8 and 15 coincide with an increase in NO3--N content at these temperatures
indicating nitrification of ammonium to nitrate (Figure 2.2). NO3--N content increased from
16.99 to 21.4 and 23.21 mg kg-1at 6, 12 and 18 °C two days after fertiliser N application. The
highest mean NO3--N levels at 12 and 18 °C were recorded at day 15 possibly as a result of
nitrification of ammonium between days 8 to 15 (Table 2.2 & Figure 2.1). Data recorded
suggest that, with the exception of NO3--N at 12 °C, the effect of the 150 kg N ha-1 treatments
will last for a maximum of 31 days.
Relative low mean NH4+-N (13.55 mg kg-1) and NO3
--N levels (13.312 mg kg-1) were
recorded at 6 °C (Table 2.2). No differences in NH4+-N content as a result of fertiliser N were
observed from days 15 to 60 after fertiliser N application. Mean NH4+-N content between
days 31 and 60 decreased from 9.88 mg kg-1 to 3.22 mg kg-1. The application of 150 kg N ha-1
resulted in significantly higher NO3--N values compared to 0 and 50 kg N ha-1 for 31 days
following fertiliser N application. Mean NO3--N content between days 31 and 60 decreased

21
from 14.46 mg kg-1 to 6.49 mg kg-1. Clarkson & Warner (1979) reported that the absorption of
ammonium exceeded the absorption of nitrate if perennial ryegrass root systems were exposed
to soil temperatures below 14 °C. The reduction in NH4+-N content between day 17 and 31
without the typical increase in NO3--N content (as observed at 12 and 18 °C), can be ascribed
to the uptake of ammonium and low mineralisation as a result of the low soil temperature.
22
Table 2.2 Soil ammonium-N and nitrate-N content (mg kg-1) in perennial ryegrass pots as influenced by soil temperature (°C) and fertiliser N
rate (kg N ha-1) under controlled conditions over a 60 day period following fertiliser N application at Elsenburg
Days after Mean Mean Meanfertiliser N N rate Ammonium-N Nitrate-N Ammonium-N Nitrate-N Ammonium-N Nitrate-N Ammonium-N Nitrate-N Total-Napplication (kg ha-1) (mg kg-1) (mg kg-1) (mg kg-1) (mg kg-1) (mg kg-1) (mg kg-1) (mg kg-1) (mg kg-1) (mg kg-1)
2 0 1.750 b* 7.813 c 4.400 b 13.013 b 0.73 b 15.653 b 2.293 12.160 7.22750 16.800 ab 11.787 bc 15.767 b 17.720 b 19.20 ab 17.947 b 17.256 15.818 16.537100 9.267 b 15.267 b 8.907 b 19.493 b 23.73 ab 21.880 b 13.968 18.880 16.424150 32.803 a 33.093 a 58.733 a 35.360 a 31.07 a 37.370 a 40.869 35.274 38.072
Mean 15.16 16.99 21.95 21.4 18.68 23.218 0 4.551 b 7.453 c 9.20 c 12.347 b 7.200 b 10.05 b 6.984 9.950 8.467
50 15.867 ab 12.920 bc 24.87 bc 20.187 b 20.533 b 39.47 a 20.423 24.192 22.308100 11.480 b 14.400 b 53.07 ab 19.933 b 61.267 a 39.56 a 41.939 24.631 33.285150 28.467 a 22.040 a 72.43 a 40.480 a 51.617 a 54.72 a 50.838 39.080 44.959
Mean 15.09 14.2 39.89 23.24 35.15 35.9515 0 24.66 a 8.867 b 8.853 b 13.627 b 5.467 b 12.28 c 12.993 11.591 12.292
50 12.27 a 12.507 b 12.933 b 27.840 b 10.667 ab 37.97 bc 11.957 26.106 19.031100 18.53 a 12.733 b 23.067 ab 22.387 b 13.733 ab 57.13 ab 18.443 30.750 24.597150 42.13 a 23.553 a 35.520 a 54.480 a 17.467 a 78.07 a 31.706 52.034 41.870
Mean 24.4 14.42 20.09 29.58 11.83 46.3631 0 7.487 a 11.813 b 4.283 b 10.373 b 8.067 a 6.280 b 6.612 9.489 8.051
50 6.933 a 11.237 b 6.400 b 10.493 b 8.417 a 10.120 b 7.250 10.617 8.933100 12.833 a 15.600 ab 8.667 b 11.508 b 12.933 a 14.350 b 11.478 13.819 12.649150 12.267 a 19.187 a 18.133 a 28.600 a 18.133 a 42.440 a 16.178 30.076 23.127
Mean 9.88 14.46 9.37 15.24 11.89 18.360 0 3.280 a 5.787 a 2.280 a 6.880 b 2.6133 a 8.387 a 2.724 7.018 4.871
50 3.173 a 7.827 a 4.213 a 5.693 b 2.6533 a 9.860 a 3.346 7.793 5.570100 2.947 a 6.680 a 2.830 a 5.800 b 3.8133 a 5.280 a 3.197 5.920 4.558150 3.4667 a 5.667 a 3.707 a 12.467 a 3.6133 a 7.333 a 3.596 8.489 6.042
Mean 3.22 6.49 3.26 7.71 3.17 7.72Mean
N fractions 13.55 13.312 18.912 19.434 16.144 26.308Mean
temperature
* Means in the same column at a specified day following fertiliser N application followed by the same letter are not significantly different (P=0.05)
13.431 19.173 21.226
Soil temperature ( °C)6 °C 12 °C 18 °C

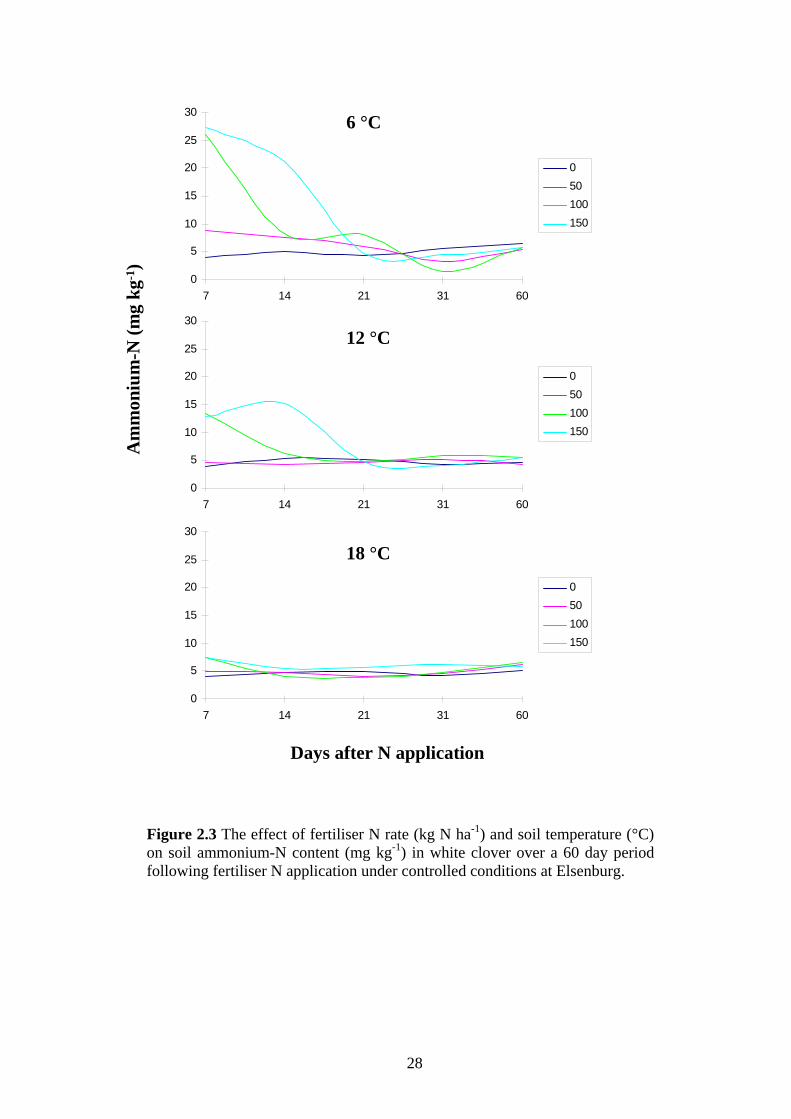
23
Figure 2.1 The effect of fertiliser N rate (kg N ha-1) and soil temperature (°C) on soil ammonium-N content (mg kg-1) in perennial ryegrass over a 60 day period following fertiliser N application under controlled conditions at Elsenburg.
Am
mon
ium
-N (m
g kg
-1)
Days after N application
-102030405060708090
2 8 15 31 60
050100150
0102030405060708090
2 8 15 31 60
050100150
01020
30405060
708090
2 8 15 31 60
050100150
6 °C
12 °C
18 °C

24
Figure 2.2 The effect of fertiliser N rate (kg N ha-1) and soil temperature (°C) on soil nitrate-N content (mg kg-1) in perennial ryegrass over a 60 day period following fertiliser N application under controlled conditions at Elsenburg.
Days after N application
Nitr
ate-
N (m
g kg
-1)
0102030405060708090
2 8 15 31 60
050100150
0102030405060708090
2 8 15 31 60
050100150
010203040
5060708090
2 8 15 31 60
050100150
6 °C
12 °C
18 °C

25
Mean levels of NH4+-N (18.912 mg kg-1) and NO3
--N (19.434 mg kg-1) at 12 °C were higher
than at 6 °C (Table 2.2). The application of 150 kg N ha-1 resulted in significantly higher
NH4+-N and NO3
--N levels compared to 0 and 50 kg N ha-1 for 31 and 61 days following
fertiliser N application respectively. The highest NH4+-N levels were recorded 8 days, and
NO3--N 15 days, after fertiliser N application. The increase in NO3
--N content recorded at 15
days, could possibly be the result of nitrification as NH4+-N content rapidly decreased
between days 8 and 15. Mean NH4+-N content decreased from 9.37 mg kg-1 to 3.26 mg kg-1
and NO3--N from 15.24 mg kg-1 to 7.71 mg kg-1 between days 31 and 60.
The highest mean NH4+-N (16.144 mg kg-1) and NO3
--N (26.308 mg kg-1) levels were
recorded at 18 °C (Table 2.2). The application of 150 kg N ha-1 resulted in the significantly
higher NH4+-N and NO3
--N values compared to 0 and 50 kg N ha-1 for 15 and 31 days
respectively following fertiliser N application. The highest NH4+-N and NO3
--N values were
recorded at the 100 and 150 kg N ha-1 rates 8 and 15 days after fertiliser N application
respectively. The sharp increase in nitrate at 15 days is possibly the result of nitrification as
NH4+-N content of the 100 and 150 kg N ha-1 treatments decreased sharply between days 8
and 15. Mean NH4+-N content decreased from 11.89 mg kg-1 to 3.17 mg kg-1 and NO3
--N from
18.30 mg kg-1 to 7.72 mg kg-1 from days 31 to 60.
Data recorded suggest that the effect of the fertiliser treatments will mainly occur within the
first 31 days after fertiliser N application and will generally not last beyond 60 days.
White clover
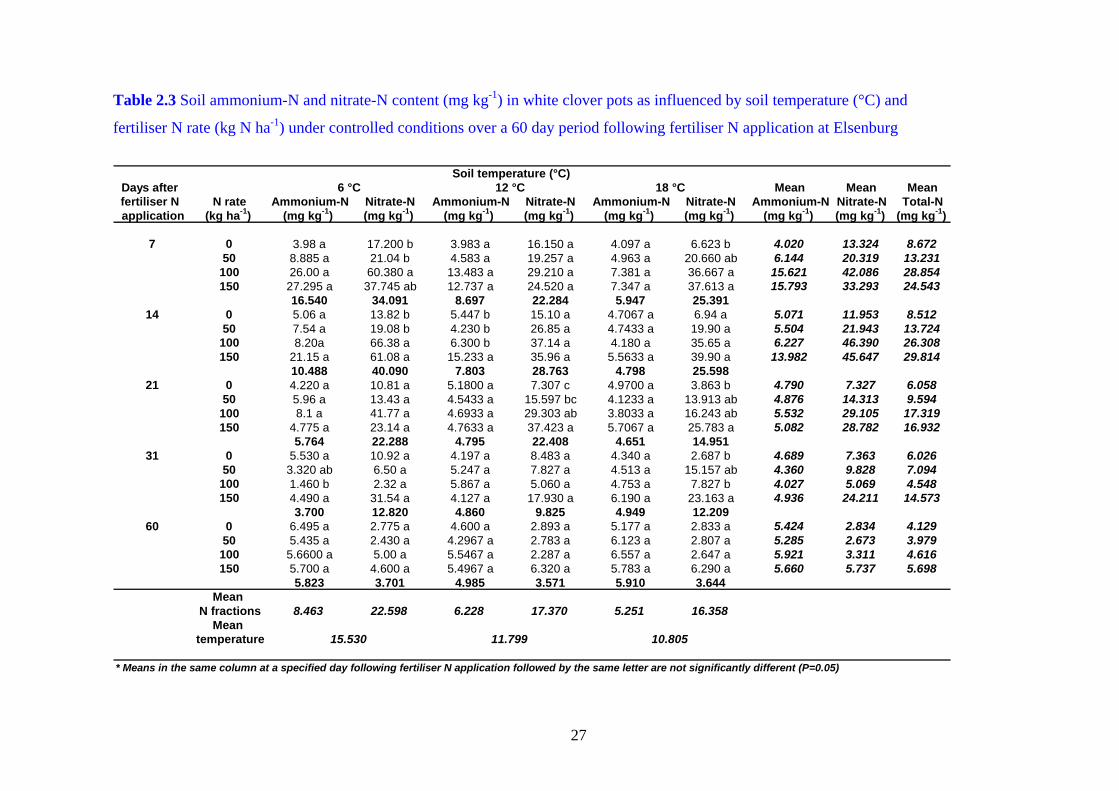
Mean NH4+-N content of soil from clover pots 7 days after N applications were 16.54, 8.697
and 5.947 mg kg-1 at the 6, 12 and 18 °C treatments respectively (Table 2.3 & Figures 2.3 &
2.4). A rapid decline in NH4+-N content at 6 and 12 °C were observed between 7 and 14 days
after 100 kg N ha-1 was applied (Figure 2.3). The same response was observed at the 150 kg N
ha-1 rate, the only difference being a decline in NH4+-N occurring between day 14 and 21.
Results show that treatments will only affect NH4+-N levels at 6 and 12 °C and will last for 14
and 21 days at 100 and 150 kg N ha-1 respectively. In general NO3--N levels were the highest
between 14 and 21 days following 100 and 150 kg N ha-1 applications (Figure 2.4). A gradual
decrease in NO3--N levels over the 60 day monitoring period were measured at the 0 and 50
kg N ha-1 rates.

26
Relative high mean NH4+-N (8.463 mg kg-1) and NO3
--N levels (22.598 mg kg-1) were
recorded at 6 °C (Table 2.3) indicating low fertiliser N uptake under low soil temperature
conditions. In contrast to ryegrass, mean NH4+-N content between days 31 and 60 increased
from 3.7 mg kg-1 to 5.823 mg kg-1. Mean NO3--N content between days 31 and 60 decreased
from 12.820 mg kg-1 to 3.701 mg kg-1, an indication that clover absorbed at least part of the
fertiliser N applied.
Mean levels of NH4+-N (6.228 mg kg-1) and NO3
--N (17.37 mg kg-1) at 12 °C were lower than
at 6 °C, suggesting an increase in N uptake by white clover as temperature increases (Table
2.3). The increase in NO3--N content observed between 14 and 21 days after N application is
possibly the result of nitrification of ammonium as NH4+-N content rapidly decreased
between days 14 and 21. Mean NH4+-N content increased from 4.86 mg kg-1 to 4.985 mg kg-1
and NO3--N decreased from 9.825 mg kg-1 to 3.571 mg kg-1 between days 31 and 60.
The lowest mean NH4+-N (5.251 mg kg-1) and NO3
--N (16.358 mg kg-1) levels were recorded
at 18 °C (Table 2.3) suggesting increased uptake of inorganic nitrogen by clover at higher soil
temperatures. No differences in NH4+-N were measured while the NO3
--N levels remained
relative constant between days 7 and 14 followed by a slight decrease between days 14 and
21. Mean NH4+-N content increased from 4.949 mg kg-1 to 5.910 mg kg-1 and NO3
--N
decreased from 12.209 mg kg-1 to 3.644 mg kg-1 from days 31 to 60.
The reduction of NH4+-N and NO3
--N indicated that white clover does absorb fertiliser N
from the soil solution. The higher N content at 6 °C also suggested that white clover activity
was reduced which restricted the uptake of fertiliser N. Data showed that ryegrass can absorb
more N compared to clover at lower temperatures and might therefore respond to fertiliser N
when clover activity is low.
27
Table 2.3 Soil ammonium-N and nitrate-N content (mg kg-1) in white clover pots as influenced by soil temperature (°C) and
fertiliser N rate (kg N ha-1) under controlled conditions over a 60 day period following fertiliser N application at Elsenburg
Days after Mean Mean Meanfertiliser N N rate Ammonium-N Nitrate-N Ammonium-N Nitrate-N Ammonium-N Nitrate-N Ammonium-N Nitrate-N Total-Napplication (kg ha-1) (mg kg-1) (mg kg-1) (mg kg-1) (mg kg-1) (mg kg-1) (mg kg-1) (mg kg-1) (mg kg-1) (mg kg-1)
7 0 3.98 a 17.200 b 3.983 a 16.150 a 4.097 a 6.623 b 4.020 13.324 8.67250 8.885 a 21.04 b 4.583 a 19.257 a 4.963 a 20.660 ab 6.144 20.319 13.231100 26.00 a 60.380 a 13.483 a 29.210 a 7.381 a 36.667 a 15.621 42.086 28.854150 27.295 a 37.745 ab 12.737 a 24.520 a 7.347 a 37.613 a 15.793 33.293 24.543
16.540 34.091 8.697 22.284 5.947 25.39114 0 5.06 a 13.82 b 5.447 b 15.10 a 4.7067 a 6.94 a 5.071 11.953 8.512
50 7.54 a 19.08 b 4.230 b 26.85 a 4.7433 a 19.90 a 5.504 21.943 13.724100 8.20a 66.38 a 6.300 b 37.14 a 4.180 a 35.65 a 6.227 46.390 26.308150 21.15 a 61.08 a 15.233 a 35.96 a 5.5633 a 39.90 a 13.982 45.647 29.814
10.488 40.090 7.803 28.763 4.798 25.59821 0 4.220 a 10.81 a 5.1800 a 7.307 c 4.9700 a 3.863 b 4.790 7.327 6.058
50 5.96 a 13.43 a 4.5433 a 15.597 bc 4.1233 a 13.913 ab 4.876 14.313 9.594100 8.1 a 41.77 a 4.6933 a 29.303 ab 3.8033 a 16.243 ab 5.532 29.105 17.319150 4.775 a 23.14 a 4.7633 a 37.423 a 5.7067 a 25.783 a 5.082 28.782 16.932
5.764 22.288 4.795 22.408 4.651 14.95131 0 5.530 a 10.92 a 4.197 a 8.483 a 4.340 a 2.687 b 4.689 7.363 6.026
50 3.320 ab 6.50 a 5.247 a 7.827 a 4.513 a 15.157 ab 4.360 9.828 7.094100 1.460 b 2.32 a 5.867 a 5.060 a 4.753 a 7.827 b 4.027 5.069 4.548150 4.490 a 31.54 a 4.127 a 17.930 a 6.190 a 23.163 a 4.936 24.211 14.573
3.700 12.820 4.860 9.825 4.949 12.20960 0 6.495 a 2.775 a 4.600 a 2.893 a 5.177 a 2.833 a 5.424 2.834 4.129
50 5.435 a 2.430 a 4.2967 a 2.783 a 6.123 a 2.807 a 5.285 2.673 3.979100 5.6600 a 5.00 a 5.5467 a 2.287 a 6.557 a 2.647 a 5.921 3.311 4.616150 5.700 a 4.600 a 5.4967 a 6.320 a 5.783 a 6.290 a 5.660 5.737 5.698
5.823 3.701 4.985 3.571 5.910 3.644Mean
N fractions 8.463 22.598 6.228 17.370 5.251 16.358Mean
temperature
* Means in the same column at a specified day following fertiliser N application followed by the same letter are not significantly different (P=0.05)
15.530 11.799 10.805
Soil temperature (°C)6 °C 12 °C 18 °C
28
Figure 2.3 The effect of fertiliser N rate (kg N ha-1) and soil temperature (°C) on soil ammonium-N content (mg kg-1) in white clover over a 60 day period following fertiliser N application under controlled conditions at Elsenburg.
Am
mon
ium
-N (m
g kg
-1)
Days after N application
0
5
10
15
20
25
30
7 14 21 31 60
050100150
0
5
10
15
20
25
30
7 14 21 31 60
050100150
0
5
10
15
20
25
30
7 14 21 31 60
050100150
6 °C
12 °C
18 °C

29
Figure 2.4 The effect of fertiliser N rate (kg N ha-1) and soil temperature (°C) on soil nitrate-N content (mg kg-1) in white clover over a 60 day period following fertiliser N application under controlled conditions at Elsenburg.
Nitr
ate-
N (m
g kg
-1)
Days after N application
0
10
20
30
40
50
60
70
7 14 21 31 60
050100150
0
10
20
30
40
50
60
70
7 14 21 31 60
050100150
0
10
20
30
40
50
60
70
7 14 21 31 60
050100150
6 °C
12 °C
18 °C
30
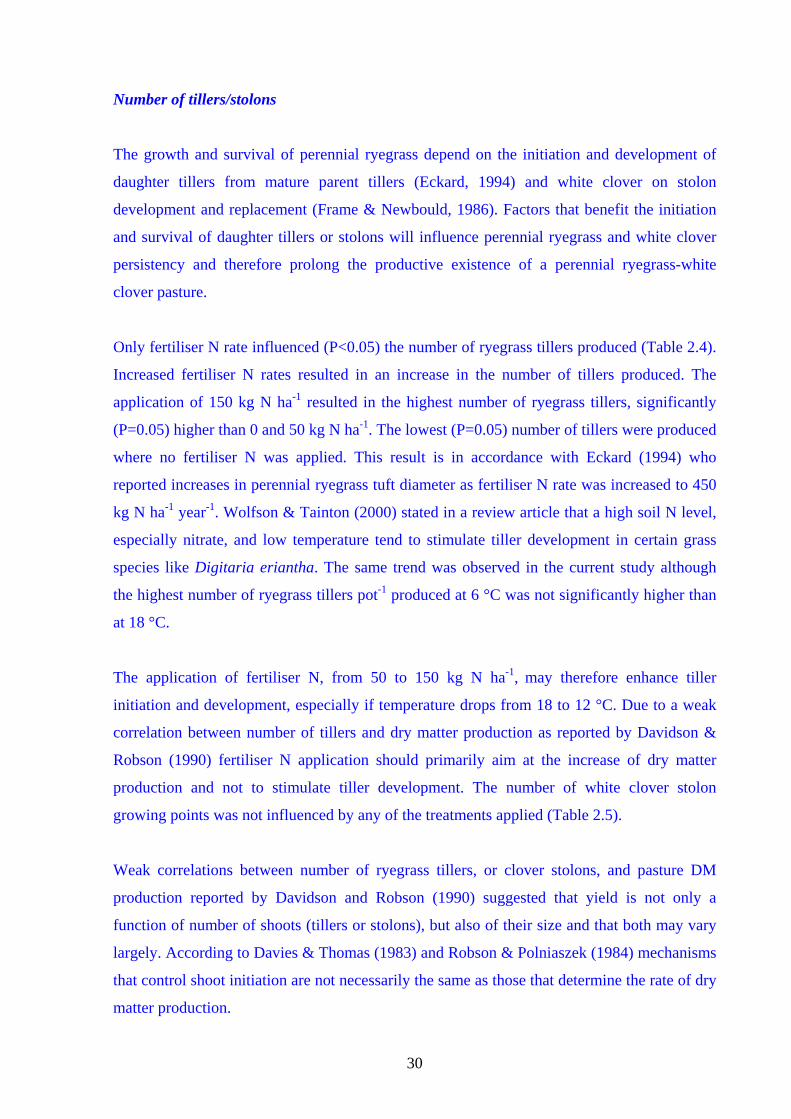
Number of tillers/stolons
The growth and survival of perennial ryegrass depend on the initiation and development of
daughter tillers from mature parent tillers (Eckard, 1994) and white clover on stolon
development and replacement (Frame & Newbould, 1986). Factors that benefit the initiation
and survival of daughter tillers or stolons will influence perennial ryegrass and white clover
persistency and therefore prolong the productive existence of a perennial ryegrass-white
clover pasture.
Only fertiliser N rate influenced (P<0.05) the number of ryegrass tillers produced (Table 2.4).
Increased fertiliser N rates resulted in an increase in the number of tillers produced. The
application of 150 kg N ha-1 resulted in the highest number of ryegrass tillers, significantly
(P=0.05) higher than 0 and 50 kg N ha-1. The lowest (P=0.05) number of tillers were produced
where no fertiliser N was applied. This result is in accordance with Eckard (1994) who
reported increases in perennial ryegrass tuft diameter as fertiliser N rate was increased to 450
kg N ha-1 year-1. Wolfson & Tainton (2000) stated in a review article that a high soil N level,
especially nitrate, and low temperature tend to stimulate tiller development in certain grass
species like Digitaria eriantha. The same trend was observed in the current study although
the highest number of ryegrass tillers pot-1 produced at 6 °C was not significantly higher than
at 18 °C.
The application of fertiliser N, from 50 to 150 kg N ha-1, may therefore enhance tiller
initiation and development, especially if temperature drops from 18 to 12 °C. Due to a weak
correlation between number of tillers and dry matter production as reported by Davidson &
Robson (1990) fertiliser N application should primarily aim at the increase of dry matter
production and not to stimulate tiller development. The number of white clover stolon
growing points was not influenced by any of the treatments applied (Table 2.5).
Weak correlations between number of ryegrass tillers, or clover stolons, and pasture DM
production reported by Davidson and Robson (1990) suggested that yield is not only a
function of number of shoots (tillers or stolons), but also of their size and that both may vary
largely. According to Davies & Thomas (1983) and Robson & Polniaszek (1984) mechanisms
that control shoot initiation are not necessarily the same as those that determine the rate of dry
matter production.

31
Table 2.4 Number of perennial ryegrass tillers per pot 60 days after fertiliser N application as
influenced by soil temperature (°C) and fertiliser N application rate (kg ha-1) under controlled
conditions at Elsenburg
Fertiliser N rate (kg ha-1) Soil temperature 0 50 100 150 Mean (T)
6 °C 101.0 126.3 120.8 130.3 119.5 12 °C 96.3 112.8 131.0 132.0 118.0 18 °C 91.8 107.8 121.8 121.8 110.8
Mean (N) 96.3 c* 115.6 b 124.5 ab 128.0 a
LSD(0.05) NxT=NS LSD(0.05) N mean=11.899 LSD(0.05) T mean=NS CV = 12.38 * Means in the same row followed by the same letter are not significantly different (P=0.05)
Table 2.5 Number of white clover stolon growing points per pot 60 days after fertiliser N
application as influenced by soil temperature (°C) and fertiliser N application rate (kg ha-1)
under controlled conditions at Elsenburg
Fertiliser N rate (kg ha-1) Soil temperature 0 50 100 150 Mean (T)
6 °C 34.3 32.0 41.0 38.8 36.5
12 °C 41.8 39.5 38.8 34.3 38.6 18 °C 38.3 33.5 33.5 33.5 34.7
Mean (N) 38.1 35.0 37.8 35.5
LSD(0.05) NxT=NS LSD(0.05) N mean=NS LSD(0.05) T mean=NS CV = 14.37

32
Dry matter production
No interactions between the treatment combinations for perennial ryegrass or white clover
were noted. Fertiliser N rate and soil temperature influenced (P<0.05) ryegrass primary dry
matter production (PDM), residual dry matter production (RDM) and total dry matter
production (TDM). White clover PDM, RDM and TDM was only influenced (P<0.05) by soil
temperature.
Primary dry matter production (PDM)
Ryegrass PDM production increased as temperature increased from 6 to 18 °C with 18 and
12 °C resulting in significantly (P=0.05) higher PDM yields compared to 6 °C (Table 2.6).
A gradual increase in ryegrass PDM yield was found as fertiliser N rate was increased from 0
to 100 kg N ha -1 with PDM yield measured at 100 kg N ha-1, higher (P=0.05) than at 0 and
150 kg N ha-1. The positive response of the ryegrass plants to 50 (0.722 g or 38%) and 100 kg
N ha-1 (0.695 g or 37%) relative to 0 kg N ha-1 at 6 °C is indicative of the ability of the
perennial ryegrass plants to respond to fertiliser N at low temperatures. Soil N levels at 150
kg N ha-1 possibly exceeded the absorption capacity of the ryegrass roots under the prevailing
environmental conditions. The 0.438 g or 13% reduction in mean PDM production if fertiliser
N rate was increased from 100 to 150 kg N ha-1 suggested that an oversupply of fertiliser N
directly or indirectly could be the reason for the observed reduction. The relative low soil
NH4+-N and NO3
--N content over the two to three weeks following fertiliser N application at
6 °C (Figures 2.1 & 2.2) suggested immobilisation of fertiliser N as a possible reason for the
low ryegrass PDM production recorded.
White clover PDM yield was influenced only by soil temperature with increases (P=0.05) in
PDM production as temperature increased from 6 to 18 °C (Table 2.7).

33
Table 2.6 Primary, residual and total dry matter (DM) production (g pot-1) of perennial
ryegrass as influenced by soil temperature (°C) fertiliser N application and rate (kg ha-1)
under controlled conditions at Elsenburg
Primary DM Production (g pot-1) Fertiliser N rate (kg ha-1)
Soil temperature 0 50 100 150 Mean (T) 6 °C 1.898 2.620 2.593 2.463 2.393 b* 12 °C 2.000 3.405 3.558 2.830 2.948 a 18 °C 2.305 3.015 3.675 3.218 3.053 a
Mean (N) 2.068 c* 3.013 ab 3.275 a 2.837 b LSD(0.05) NxT=NS LSD(0.05) N mean=0.373 LSD(0.05) T mean=0.323 CV = 16.10
Residual DM Production (g pot-1) Fertiliser N rate (kg ha-1)
Soil temperature 0 50 100 150 Mean (T) 6 °C 1.105 2.920 4.793 5.760 3.644 b 12 °C 1.560 2.945 5.065 5.870 3.860 b 18 °C 1.520 3.373 5.563 6.948 4.351 a
Mean (N) 1.395 d 3.079 c 5.140 b 6.193 a LSD(0.05) NxT=NS LSD(0.05) N mean=0.5171 LSD(0.05) T mean=0.4478 CV = 15.80
Total DM Production (g pot-1) Fertiliser N rate (kg ha-1)
Soil temperature 0 50 100 150 Mean (T) 6 °C 3.003 5.540 7.385 8.223 6.038 c 12 °C 3.560 6.350 8.623 8.700 6.808 b 18 °C 3.825 6.388 9.238 10.165 7.404 a
Mean (N) 3.463 c 6.093 b 8.415 a 9.029 a LSD(0.05) NxT= NS LSD(0.05) N mean=0.6284 LSD(0.05) T mean=0.5442 CV = 11.25 * Means in the same column or row at a specified dry matter production followed by the same letter are not significantly different (P=0.05)

34
Table 2.7 Primary, residual and total dry matter (DM) production (g pot-1) of white clover as
influenced by soil temperature (°C) and fertiliser N application rate (kg ha-1) under controlled
conditions at Elsenburg
Primary DM Production (g pot-1) Fertiliser N rate (kg ha-1)
Soil temperature 0 50 100 150 Mean (T)
6 °C 1.678 2.090 1.960 2.325 2.013 c* 12 °C 2.590 2.723 3.418 3.028 2.939 b 18 °C 3.553 3.825 3.750 3.780 3.727 a
Mean (N) 2.607 2.879 3.043 3.044 LSD(0.05) NxT=NS LSD(0.05) N mean=NS LSD(0.05) T mean= 0.3261 CV = 15.72
Residual DM Production (g pot-1) Fertiliser N rate (kg ha-1)
Soil temperature 0 50 100 150 Mean (T)
6 °C 2.388 2.968 2.643 3.923 2.980 b 12 °C 3.450 3.423 4.173 4.045 3.773 a 18 °C 4.050 4.020 4.378 3.988 4.109 a
Mean (N) 3.296 3.470 3.731 3.985 LSD(0.05) NxT=NS LSD(0.05) N mean= NS LSD(0.05) T mean= 0.5655 CV = 21.79
Total DM Production (g pot-1) Fertiliser N rate (kg ha-1)
Soil temperature 0 50 100 150 Mean (T)
6 °C 4.065 5.058 4.603 6.248 4.993 c 12 °C 6.040 6.145 7.590 7.073 6.712 b 18 °C 7.603 8.845 8.128 7.768 7.836 a
Mean (N) 5.903 6.349 6.773 7.029 LSD(0.05) NxT= NS LSD(0.05) N mean= NS LSD(0.05) T mean= 0.7305 CV =15.64 * Means in the same column or row at a specified dry matter production followed by the same letter are not significantly different (P=0.05) The results also suggest that fertiliser application rates of up to 150 kg N ha-1 as tested in the
current study will not cause reductions in clover dry matter production. The decrease of clover
percentage in perennial ryegrass-white clover pastures reported by various scientists (Eckard,

35
1994; McKenzie, Jacobs & Kearney, 2003) could therefore be ascribed to increased
competitiveness by the stimulated ryegrass rather than suppressing of the clover plant as a
result of fertiliser N application.
Residual dry matter production (RDM)
Increasing soil temperatures from 6 to18 °C resulted in increases in ryegrass RDM production
although not significantly between 6 and 12 °C (Table 2.6). The restriction of ryegrass RDM
production at 12 °C to the same level as at 6 °C suggested that higher soil N levels during the
first regrowth cycle ensured sufficient N in the soil solution to boost PDM production despite
the lower soil temperature. Higher soil N levels at lower soil temperatures may therefore
compensate for the lower N absorption capacity of the ryegrass root system, reducing the
negative effect of lower temperatures on dry matter production. Care must however be taken
not to increase soil N levels to values exceeding the absorption capacity of the ryegrass plant
under a specific set of environmental conditions. Exceeding the absorption capacity of the
ryegrass will leave excess N in the soil solution. This may increase the risk of leaching,
reduce N use efficiencies and increase the risk of contamination of natural resources. White
clover RDM production did not differ between 12 and 18 °C, but was significantly lower at 6
°C indicating relative low white clover activity at low temperatures (Table 2.7).
Increasing fertiliser N levels from 0 to 150 kg N ha-1 resulted in increased (P=0.05) mean
ryegrass RDM production over all N rates (Table 2.6). Mean initial soil nitrogen levels
(ammonium + nitrate) of 12.65 and 23.13 mg kg-1 at the 100 and 150 kg N ha-1 treatments
(Tables 2, day 31) were sufficient to increase ryegrass RDM yield by 1.865 (57%) and 3.356
g pot-1 (118.29%) relative to PDM yields at the same treatment combinations. Soil N levels of
8.93 mg kg-1 (50 kg N ha-1) at the start of the second regrowth cycle increased RDM by 0.066
g pot-1 (2.2%) relative to PDM. RDM production of white clover was not influenced by
fertiliser N rate (Table 2.7).
The increased ryegrass RDM production at 18 °C possibly resulted in increased N uptake,
thereby enhancing the depletion of soil NO3--N as no differences in soil NO3
--N content were
recorded 60 days after 150 kg N ha-1 had been applied at 18 °C (Table 2.2). In contrast to this,
significantly higher NO3--N levels were recorded at 60 days where 150 kg N ha-1 had been
applied at 12 °C.

36
Total dry matter production (TDM)
Increasing fertiliser N rate from 0 to 50 and 100 kg N ha-1 resulted in increased (P=0.05)
ryegrass TDM production (Table 2.6). The application of 150 kg N ha-1 resulted in the highest
ryegrass TDM production although not significantly (P>0.05) higher than at 100 kg N ha-1.
Results supported those of Russell (1988) who came to the conclusion that water and nutrient
absorption will increase as soil temperature increases, resulting in higher productivity. White
clover TDM production was not influenced by fertiliser N rate, which confirmed the relative
independence of clover plants to soil N supply (Table 2.7).
The application of 50, 100 and 150 kg N ha-1 at 6 °C resulted in a 2.537 (85%), 4.382 (146%)
and 5.22 g pot-1 (174%) increase in ryegrass TDM production which emphasizes the success
that can be achieved with fertiliser N application to cold soils planted with ryegrass.
Comparative figures for clover were 0.993 (24%), 0.538 (13%) and 2.183 g pot-1 (54%),
showing the reduced activity of white clover under low temperature conditions.
Leaf N content
Only fertilliser N rate influenced (P<0.05) ryegrass leaf N content during both the first
(primary) and second (residual) regrowth cycles (Table 2.8). The application of 100 and 150
kg N ha-1 resulted in higher (P=0.05) ryegrass primary leaf N contents compared to the 0 kg N
ha-1 treatments at the end of the first regrowth cycle. At the end of the second regrowth cycle
(residual) the 150 kg N ha-1 resulted in higher (P=0.05) ryegrass leaf N contents than all other
treatments with 0 kg N ha-1 the lowest. Results in the current study are supported by results
obtained by Ehlig & Hagemann (1982) and Eckard (1994). Fertiliser N rate significantly
influenced white clover leaf N content only during the first regrowth cycle with the highest
(P=0.05) clover leaf N contents recorded at the 100 and 150 kg N ha-1 rates (Table 2.9). No
differences in clover leaf N content were recorded between 0 and 50 kg N ha-1.

37
Table 2.8 Primary and residual leaf nitrogen content (%) of perennial ryegrass as
influenced by soil temperature (°C) and rate of fertiliser N application (kg ha-1) under
controlled conditions at Elsenburg
N in primary DM (%) Fertiliser N rate (kg ha-1)
Soil temperature 0 50 100 150 Mean (T)
6 °C 3.061 4.548 4.917 5.213 4.435 12 °C 3.917 4.479 5.180 5.071 4.662 18 °C 3.600 4.005 5.276 5.304 4.530
Mean (N) 3.525 c* 4.375 b 5.124 a 5.186 a 4.542 LSD(0.05) NxT=NS LSD(0.05) N mean=0.4721 LSD(0.05) T mean=NS CV = 12.25
N in residual DM (%) Fertiliser N rate (kg ha-1)
Soil temperature 0 50 100 150 Mean (T)
6 °C 2.089 2.688 3.567 4.328 3.168 12 °C 2.044 2.265 2.808 4.523 2.910 18 °C 1.984 2.963 2.665 3.746 2.766
Mean (N) 2.038 c 2.609 b 3.013 b 4.240 a 2.948 LSD(0.05) NxT=NS LSD(0.05) N mean=0.483 LSD(0.05) T mean=NS CV = 19.26 * Means in the same row followed by the same letter are not significantly different (P=0.05)
Clover leaf N content was influenced by soil temperature in both regrowth cycles (Table 2.9)
with leaf N content the lowest (P=0.05) at the 6 °C treatment for both cycles. Decreasing soil
temperature from 18 to 12 °C did not affect leaf N content. The significantly lower leaf N
content recorded at 6 °C furthermore emphasizes the clover’s reduced activity at low
temperatures. These results showed that ryegrass production can be stimulated by fertiliser N
application with minimum direct effects on white clover in a perennial ryegrass-white clover
pasture. The stimulation of ryegrass productivity may however induces indirect influences
like competition that might influence clover performance under field conditions.

38
Table 2.9 Primary and residual leaf nitrogen content (%) of white clover as influenced by soil
temperature (°C) and rate of fertiliser N application (kg ha-1) under controlled conditions at
Elsenburg
N in primary DM (%) Fertiliser N rate (kg ha-1)
Soil temperature 0 50 100 150 Mean (T)
6 °C 4.046 4.429 4.427 4.738 4.410 b* 12 °C 4.562 4.406 5.061 5.039 4.767 a 18 °C 4.68 4.316 4.941 4.908 4.711 a
Mean (N) 4.429 b* 4.384 b 4.810 a 4.895 a LSD(0.05) NxT= NS LSD(0.05) N mean= 0.2605 LSD(0.05) T mean= 0.2256 CV = 6.80
N in residual DM (%) Fertiliser N rate (kg ha-1)
Soil temperature 0 50 100 150 Mean (T)
6 °C 4.19 3.981 3.837 4.015 4.005 b 12 °C 4.493 4.198 4.104 4.319 4.279 a 18 °C 4.511 4.297 4.511 4.53 4.462 a
Mean (N) 4.400 4.158 4.151 4.288 LSD(0.05) NxT= NS LSD(0.05) N mean= NS LSD(0.05) T mean= 0.1875 CV = 6.16 * Means in the same row or column at a specified DM followed by the same letter are not significantly different (P=0.05)
All treatment combinations resulted in ryegrass leaf N concentrations of at least 2.0 to 3.2%
(ryegrass) and 3.2 to 3.6% (clover), levels regarded as adequate for perennial ryegrass and
white clover productivity (Reuter & Robinson, 1997). Ryegrass N levels reaching 3.5% and
higher is indicative of wasteful use of fertiliser N (Eckard, 1994).
In contrast to results obtained by Eckard (1986) on Italian ryegrass, DM production in this
study (Table 2.8) was stimulated in spite of ryegrass leaf N levels, during the first regrowth
cycle, that were higher than the 3.5 % set as maximum above which little or no increase in
DM production can be expected (Eckard, 1994).

39
Leaf N yield
Nitrogen removed in the ryegrass and clover cuttings (primary, residual and total) follows the
same trend as measured in mean dry matter production, namely an increase as fertiliser N rate
increased, mainly as a result of increased dry matter production (Tables 2.10 & 2.11).
Table 2.10 Primary, residual and total leaf nitrogen yield (g pot-1)* of perennial ryegrass as
influenced by soil temperature (°C) and rate of fertiliser N application (kg ha-1) under
controlled conditions at Elsenburg
N in primary DM (g pot-1) Fertiliser N rate (kg ha-1)
Soil temperature 0 50 100 150 Mean (T)
6 °C 0.059 0.119 0.127 0.128 0.108 12 °C 0.080 0.150 0.184 0.141 0.139 18 °C 0.084 0.113 0.194 0.138 0.132
Mean (N) 0.074 0.127 0.168 0.136 0.126 N in residual DM (g pot-1)
Fertiliser N rate (kg ha-1) Soil temperature 0 50 100 150 Mean (T)
6 °C 0.062 0.149 0.262 0.354 0.207 12 °C 0.073 0.145 0.244 0.386 0.212 18 °C 0.076 0.147 0.245 0.427 0.224
Mean (N) 0.070 0.147 0.250 0.389 0.214 N in total DM (g pot-1)
Fertiliser N rate (kg ha-1) Soil temperature 0 50 100 150 Mean (T)
6 °C 0.121 0.267 0.388 0.483 0.315 12 °C 0.152 0.295 0.428 0.527 0.351 18 °C 0.160 0.260 0.438 0.565 0.356
Mean (N) 0.145 0.274 0.418 0.525 0.341 *Nitrogen yield was calculated as follows:
Nitrogen yield = DM production (g pot-1) * Percentage N/100
No statistical analysis was done on this parameter as analysis were done on the components DM production
and percentage N in the leaves harvested.

40
Table 2.11 Primary, residual ant total leaf nitrogen yield (g pot-1)* of white clover as
influenced by soil temperature (°C) and rate of fertiliser N application (kg ha-1) under
controlled conditions at Elsenburg
N in primary DM (g pot-1) Fertiliser N (kg ha-1)
Soil temperature 0 50 100 150 Mean (T)
6 °C 0.068 0.093 0.087 0.110 0.089 12 °C 0.118 0.120 0.173 0.153 0.141 18 °C 0.166 0.165 0.185 0.186 0.176
Mean (N) 0.117 0.126 0.148 0.149 0.135 N in residual DM (g pot-1)
Fertiliser N (kg ha-1) Soil temperature 0 50 100 150 Mean (T)
6 °C 0.100 0.118 0.101 0.158 0.119 12 °C 0.155 0.144 0.171 0.175 0.161 18 °C 0.183 0.173 0.197 0.181 0.183
Mean (N) 0.146 0.145 0.157 0.171 0.154 N in total DM (g pot-1)
Fertiliser N (kg ha-1) Soil temperature 0 50 100 150 Mean (T)
6 °C 0.168 0.211 0.188 0.268 0.209 12 °C 0.273 0.264 0.344 0.327 0.302 18 °C 0.349 0.338 0.383 0.366 0.359
Mean (N) 0.263 0.271 0.305 0.320 0.290 *Nitrogen yield was calculated as follows:
Nitrogen yield = DM production (g pot-1) * Percentage N/100
No statistical analysis was done on this parameter as analysis were done on the components DM production
and percentage N in the leaves harvested.
Total leaf N yield (accumulated total over 60 days) at 6 °C with 0 kg N ha-1 applied were
38.8% higher in clover compared to ryegrass. However at 150 kg N ha-1 ryegrass N yields
were 80.22% higher, clearly showing the ability of ryegrass to respond to high N applications
relatively to clover at low temperatures (Tables 2.10 & 2.11).
Absorption of fertiliser N during the first 31 days (primary) was the highest at 12 and 18 °C
for ryegrass and clover respectively, highlighting the ability of ryegrass to absorb N under
relative cool conditions.
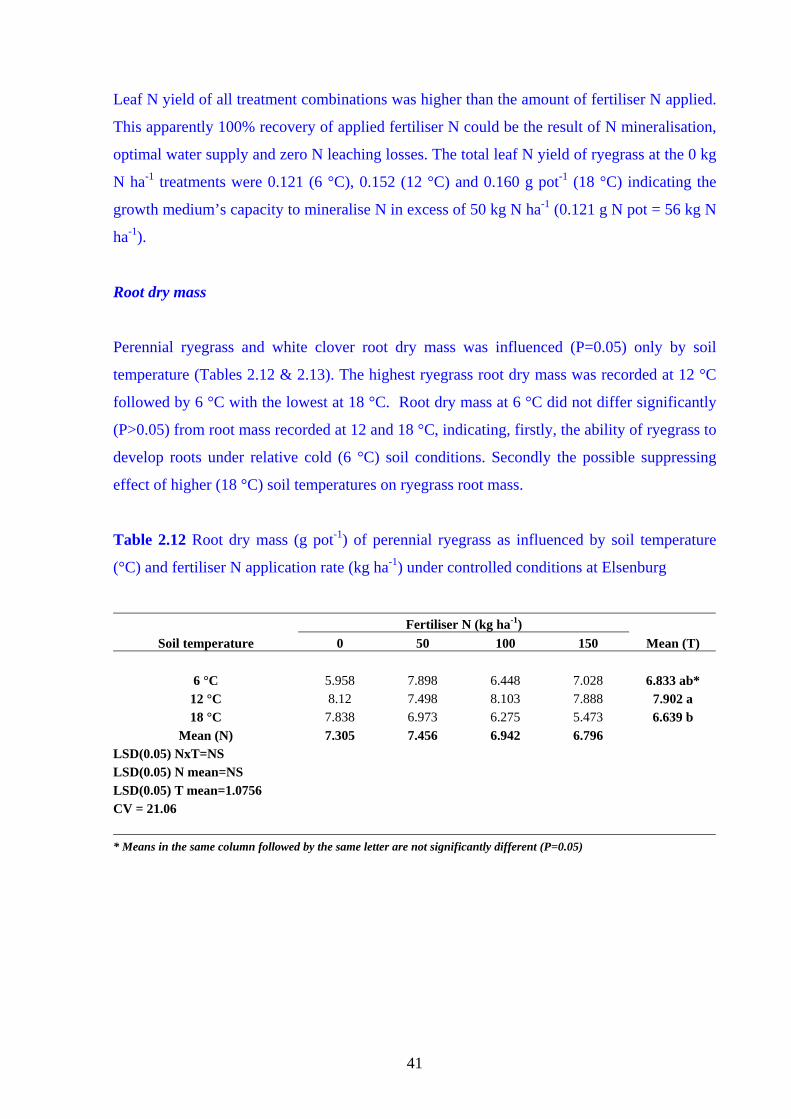
41
Leaf N yield of all treatment combinations was higher than the amount of fertiliser N applied.
This apparently 100% recovery of applied fertiliser N could be the result of N mineralisation,
optimal water supply and zero N leaching losses. The total leaf N yield of ryegrass at the 0 kg
N ha-1 treatments were 0.121 (6 °C), 0.152 (12 °C) and 0.160 g pot-1 (18 °C) indicating the
growth medium’s capacity to mineralise N in excess of 50 kg N ha-1 (0.121 g N pot = 56 kg N
ha-1).
Root dry mass
Perennial ryegrass and white clover root dry mass was influenced (P=0.05) only by soil
temperature (Tables 2.12 & 2.13). The highest ryegrass root dry mass was recorded at 12 °C
followed by 6 °C with the lowest at 18 °C. Root dry mass at 6 °C did not differ significantly
(P>0.05) from root mass recorded at 12 and 18 °C, indicating, firstly, the ability of ryegrass to
develop roots under relative cold (6 °C) soil conditions. Secondly the possible suppressing
effect of higher (18 °C) soil temperatures on ryegrass root mass.
Table 2.12 Root dry mass (g pot-1) of perennial ryegrass as influenced by soil temperature
(°C) and fertiliser N application rate (kg ha-1) under controlled conditions at Elsenburg
Fertiliser N (kg ha-1) Soil temperature 0 50 100 150 Mean (T)
6 °C 5.958 7.898 6.448 7.028 6.833 ab* 12 °C 8.12 7.498 8.103 7.888 7.902 a 18 °C 7.838 6.973 6.275 5.473 6.639 b
Mean (N) 7.305 7.456 6.942 6.796 LSD(0.05) NxT=NS LSD(0.05) N mean=NS LSD(0.05) T mean=1.0756 CV = 21.06 * Means in the same column followed by the same letter are not significantly different (P=0.05)

42
Table 2.13 Root dry mass (g pot-1) of white clover as influenced by soil temperature (°C) and
fertiliser N application rate (kg ha-1) under controlled conditions at Elsenburg
Fertiliser N (kg ha-1) Soil temperature 0 50 100 150 Mean (T)
6 °C 1.548 1.670 1.298 1.803 1.579 a* 12 °C 1.210 1.148 1.280 1.328 1.241 b 18 °C 1.205 0.920 1.073 0.783 0.995 b
Mean (N) 1.321 1.246 1.217 1.304 LSD(0.05) NxT=NS LSD(0.05) N mean=NS LSD(0.05) T mean= 0.3346 CV = 36.69 * Means in the same column followed by the same letter are not significantly different (P=0.05)
The highest (P=0.05) white clover root dry mass was produced at 6 °C. Similar to ryegrass,
the lowest clover root mass was also recorded at 18 °C although not significantly lower than
at 12 °C.
Conclusion
This study showed that the application of fertiliser N resulted in increased ryegrass
productivity at temperatures as low as 6 °C. However a significant reduction in dry matter
production can be expected if soil temperature decreases from 18 to 12 as well as from 12 to 6
°C. The application of fertiliser N at 6 °C may still produce higher ryegrass dry matter yields
(between 30 and 38% in the first regrowth cycle) compared to treatments that did not receive
fertiliser N. This study furthermore showed that white clover could tolerate fertiliser N levels
of 150 kg N ha-1 without reducing dry matter production, leaf N content or root dry mass. The
lack of clover response (dry matter production) to fertiliser N as clearly seen at the 100 and
150 kg N ha-1 rates creates the opportunity to stimulate perennial ryegrass dry matter
production in a ryegrass-white clover pasture without direct negative effects on the clover
component. The reaction of clover in a mixed pasture under field conditions may however be
altered as a result of the competitive effect of ryegrass stimulated by increased inorganic
nitrogen supply.

43
The application of fertiliser N to ryegrass can stimulate ryegrass tiller development. In a
ryegrass-white clover mixture this could however disturb the grass clover balance as the
initiation of stolon growing points were not stimulated by fertiliser N application placing
white clover at a possible competitive disadvantage relative to perennial ryegrass.
References
ANON., 1996. Verslag van die grondkundige opname van die plaas Elsenburg. Resource
Utilization, Department of Agriculture, Western-Cape.
ANON., 2004. Databank Dept of Agrometry. ARC Institute for Soil, Climate and Water.
Stellenbosch.
AOAC., 1970. Official methods of analysis. (11thed.). Association of Official Analytical
Chemists. Washington DC, USA.
BESSINGER, F., 1985. Methods of Plant Analysis by Autoanalyzer Techniques. Information
Bulletin No D-3. Soil and Irrigation Research Institute, Private Bag X79, Pretoria.
0001.
BEYERS, C.P. de L., 1983. Bemesting van aangeplante weidings. Winterreën, Spesiale
uitgawe no. 5, 54-59.
CLARKSON, D.T.A. & WARNER, A., 1979. Relationships between root temperature and
transport of ammonium and nitrate ions by Italian and perennial ryegrass (Lolium
multiflorum and Lolium perenne). Plant Physiology 64, 557-561.
DAVIDSON, I.A. & ROBSON, M.J., 1990. Short-term effects of nitrogen on the growth and
nitrogen nutrition of small swards of white clover and perennial ryegrass in spring.
Grass and Forage Science 45, 413-421.
DAVIES, A. & THOMAS, H., 1983. Rates of leaf and tiller production in spaced perennial
ryegrass plants in relation to soil temperature and solar radiation. Annals of Botany 51,
591-598.

44
ECKARD, R.J., 1986. The nitrogen nutrition of Italian ryegrass (Lolium multiflorum). MSc
thesis, University of Natal.
ECKARD, R.J., 1994. The nitrogen economy of three irrigated temperate grass pastures with
and without clover in Natal. Ph. D thesis, University of Natal.
EHLIG, C.F. & HAGEMANN, R.W., 1982. Nitrogen management for irrigated annual
ryegrass in Southwestern United States. Agronomy Journal 74, 820-823.
FRAME, J. & NEWBOULD, P., 1986. Agronomy of white clover. Advances in Agronomy
40, 1-88.
HATCH, D.J. & MACDUFF, J.H., 1991. Concurrent rates of N2 fixation, nitrate and
ammonium uptake by white clover in response to different root temperatures. Annals
of Botany 67, 265-274.
HEGARTY, M.P., 1981. Deleterious factors in herbages affecting animal production. In J.B.
Hacker (ed.). Nutritional limits to animal production from pastures. Proc. Int. Symp.
St. Lucia, Queensland. CSIRO, Commomwealth Agric. Bureau, Australia. 133-146.
KESSLER, W., BOLLER, B.C. & NöSBERGER, J., 1990. Distinct influence of root and
shoot temperature on nitrogen fixation by white clover. Annals of Botany 65, 341-346.
MARTIN, T.W., 1960. The role of white clover in grassland. Herbage Abstracts 30, 159-164.
MCKENZIE, F.R, JACOBS, J.L. & KEARNEY, G., 2003. Long-term effects of multiple
applications of nitrogen fertiliser on grazed dryland perennial ryegrass/white clover
dairy pastures in south-west Victoria. 3. Botanical composition, nutritive
characteristics, mineral content, and nutrient selection. Australian Journal of
Agricultural Research 54, 477-485.
MILES, N. & MANSON, A.D., 2000. Nutrition of planted pastures. In N. Tainton (ed.).
Pasture Management in South Africa. University of Natal Press, Pietermaritzburg.
45
NON-AFFILIATED SOIL ANALYSIS WORK COMMITTEE., 1990. Handbook of standard
soil testing methods for advisory purposes. Soil Science Society of South Africa,
Sunnyside, 0132.
OTT, R.L., 1998. An introduction to statistical methods and data analysis. Belmont,
California: Duxbury Press.
REUTER D.J. & ROBINSON J.B., 1997. Plant Analysis: An Interpretation Manual. 2nd ed.
CSIRO Publishing, Collingwood, Victoria, Australia.
ROBSON, M.J. & POLNIASZEK, T., 1984. Effect of contrasting light regimes on the growth
and morphology of individual plants of white clover and of different stolons on the
same plant. In D.J. Thomas (ed.) Forage Legumes, Occasional Symposium, 16. British
Grassland Society, 189-190.
RUSSELL, E.W., 1988. Russell’s Soil Conditions and Plant Growth. 11th edition. A. Wild
(ed.). Longman: London, New York.
SAS., 1999. SAS/STAT User's Guide, Version 8, 1st printing, Volume 2. SAS Institute Inc,
SAS Campus Drive, Cary, North Carolina, 27513.
SHAPIRO, S.S. & WILK, M.B., 1965. An Analysis of Variance Test for Normality,
Biometrika 52, 591-611.
SNEDECOR, G.W. & COCHRAN, W.G., 1967. Statistical Methods. 6th ed. The Iowa State
University Press, Ames, Iowa, U.S.A.
SOIL CLASSIFICATION WORKING GROUP., 1991. Soil Classification: A taxonomic
system for South Africa. Memoirs on the Agricultural Natural Resources of South
Africa Nr. 15. Department of Agricultural Development. Pretoria, South Africa.
TINKER, P.B.H., 1979. Uptake and consumption of soil nitrogen in relation to agronomic
practice. In E.J. Hewitt and C.V. Cutting (eds.). Nitrogen Assimilation of Plants.
Academic Press. London, New York, San Francisco.

46
VAN DER WATT, H.V.H., 1966. Improved tables and a simplified procedure for soil particle
size analysis by the hydrometer method. South African Journal of Agricultural Science
9, 911-916.
WESTFALL, D.G., HENSON, M. A. & EVANS, E. P., 1978. The effect of soil sample
handling between collection and drying on nitrate concentration. Soil Science and
Plant Analysis 9 (2), 169-185.
WHILTSHIRE, G.H. & du PREEZ, C.C., 1994a. The effect of oven-drying on residual
inorganic nitrogen. South African Journal of Plant and Soil 11 (2), 107-109.
WHILTSHIRE, G.H. & du PREEZ, C.C., 1994b. Effects of sample drying temperature on
indices of available nitrogen in soils. South African Journal of Plant and Soil 11 (1),
34-40.
WOLFSON, M.M., & TAINTON, N.M., 2000. The morphology and physiology of the major
herbage plants. In N.M. Tainton (ed.). Pasture Management in South Africa.
University of Natal Press, Pietermaritzburg.

47
Chapter 3
The effect of high soil water levels and fertiliser N rate on soil nitrogen
dynamics and growth of perennial ryegrass (Lolium perenne) and white
clover (Trifolium repens) grown under controlled conditions
Abstract
The effects of five fertiliser N rates (0, 30, 60, 120 and 180 kg N ha-1) and four water potential
levels (-10, -20, -25 and -35 kPa) on perennial ryegrass and white clover grown in separate
pots in a glasshouse at 12/18 °C night/day temperatures were investigated. Primary- (PDM)
and residual dry matter production (RDM) were recorded 30 and 60 days after fertiliser N
application. The number of ryegrass tillers/clover stolons, root dry mass and leaf N content
were recorded. Soil ammonium and nitrate content were monitored during a 45 and 31 day
period following fertiliser N application for ryegrass and clover respectively.
The soil ammonium-N and nitrate-N levels with applications of 30 and 60 kg N ha-1 in both
ryegrass and clover decreased within 11 to 14 days after fertiliser N application to levels
slightly higher (P>0.05) than at the 0 kg N ha-1 treatments. Applying 120 kg N ha-1 to ryegrass
however resulted in soil ammonium levels remaining relatively high (P=0.05) for a period of
30 days at water potential levels of -10 and -20 kPa and 14 days at -35 kPa. The same
responses were recorded with soil nitrate-N although the higher (P=0.05) levels at 120 kg N
ha-1 were extended to 37 (-10 and -20 kPa) and 45 (-25 kPa) days after fertiliser N application.
Increasing fertiliser N levels from 0 to 120 kg N ha-1 resulted in increased (P=0.05) perennial
ryegrass primary dry matter production (PDM) at the end of the first regrowth cycle (30 days)
followed by a non-significant increase as N rate was increased to 180 kg N ha-1. Ryegrass
PDM yield was influenced (P=0.05) by soil water potential with higher yields recorded at the
-10 and -20 kPa treatments. White clover PDM production was not influenced by N rate or
soil water potential. Carry-over fertiliser N caused increased (P=0.05) ryegrass RDM at 120
and 180 kg N ha-1 rates. Clover RDM production increased as fertiliser N rate was increased
from 0 to 180 kg N ha-1. Higher (-10 and -20 kPa) soil water levels caused increased ryegrass
RDM production, a response not observed in clover. Total dry matter (TDM) production (the

48
accumulative dry matter production during a 60 day period following fertiliser N application)
of ryegrass was significantly increased as fertiliser N rate was increased from 0 to 180 kg N
ha-1. Higher ryegrass TDM yields at -10 kPa and -20 kPa were recorded at the higher (120 and
180 kg N ha-1) N application rates but water content did not influenced TDM production at
the lower (0, 30 and 60 kg N ha-1) fertiliser N application rates. Clover TDM production was
not influenced by the treatments applied. The number of ryegrass tillers per plant increased
(P=0.05) as fertiliser N rate increased from 0 to 120 kg N ha-1. The number of stolons
produced was not influenced by the treatments. Increased fertiliser N rate resulted in
increased ryegrass and, to a lesser extend, clover leaf N content at the end of the first regrowth
cycle. Only 120 kg N ha-1 resulted in higher ryegrass leaf N content at the end of the second
regrowth cycle. Best conditions for ryegrass (P=0.05) and clover (P>0.05) root development
were found to be at -35 kPa soil water potential.
The study has shown that significant increases in dry matter production of perennial ryegrass
can be achieved with fertiliser N applications under high (-10 kPa) soil water conditions.
Clover dry matter production was not influenced by fertiliser N rate and soil water levels
covered in this study. The highest ryegrass leaf N content after the first regrowth cycle, as
measured at the -10 kPa soil water potential, suggest that the absorption of soil N was not
restricted by the high soil water levels. The study also showed that the application of fertiliser
N to stimulate ryegrass productivity under relative wet conditions without negatively affecting
a companion clover crop in a mixed pasture could be successful.
Keywords: dry matter production, glasshouse, leaf N content, NH4+, NO3
-, perennial ryegrass, root
dry mass, soil water potential, stolons, tillers, white clover
Introduction
The window of opportunity to increase perennial ryegrass-white clover dry matter production
during the cool season in the Western Cape Province is from April to September, seasons
characterized by high rainfall that can result in soil water levels at field water capacity for
several days. Average rainfall measured over a 30 year period for May, June, July and August
were 83.7, 106, 99.7 and 84.7 mm respectively (Anon, 2004). Aggravating factors includes
low evapotranspiration as low temperatures reduce evaporation and transpiration by plants,
leaving the soil water at higher water levels for longer periods. Quantifying the effect of high

49
soil water content on the fertiliser N applied and the resultant response of perennial ryegrass
and white clover are therefore important to develop an efficient strategic fertiliser N
programme for implementation during the cool season.
Apart from moving topdressed fertiliser N into the rooting zone soil water is also required to
move the nitrogen to the root surface from where absorption into the root takes place (Miles
& Manson, 2000). Increased soil water content may therefore increases fertiliser N supply to
the plant root.
High water contents may influence, directly and indirectly, the ability of the plant to respond
to the fertiliser N applied as well as possible N losses as a result of restricted soil aeration.
Denitrification losses [(the biochemical reduction of NO3- to N2 and nitrous oxide under
warm (above 5 °C), anaerobic conditions (poorly drained soils)] can contribute to fertiliser N
losses when grown in soils with a water content between saturation point and field water
capacity (Tinker, 1979; Miles & Manson, 2000). Limiting or excessive soil water may also
seriously impair the N fixing processes in legumes (Ryden, 1984).
The dry matter production of potentially high yielding crops grown under conditions of high
levels of soil available nutrients, including nitrogen, can be reduced by minor fluctuations in
water supply. The N-use efficiency of kikuyu decreased by between 35 and 50% as rainfall
decreased by 34% (Miles, 1997). Plants receiving high levels of fertiliser N on fertile soils
can only produce at maximum levels if the stomata remain open, especially during midday
when the rate of photosynthesis is at a maximum. Plants grown under these high potential
conditions are easily affected by wilting (Russell, 1988). Stomatal resistance of grass-clover
pastures at Rothamsted remained low at transpiration rates of 2 – 3 mm day-1 until soil suction
in the top 250 mm soil had risen to between -300 and - 400 kPa after which resistance
increased linearly with increase of suction up to -1200 kPa when it began to increase more
rapidly causing severe reductions in transpiration rate (Szeicz & Long, 1969 cited by Russell,
1988).
Low levels of fertiliser N will result in plants developing less leaf surface area, thereby
reducing the transpiration area, resulting in a more favorable root:shoot ratio enabling the
plant to maintain optimal production levels. Relative short water stress periods can result in
increases in root mass of certain grasses as well as carbohydrate content of roots and stubble
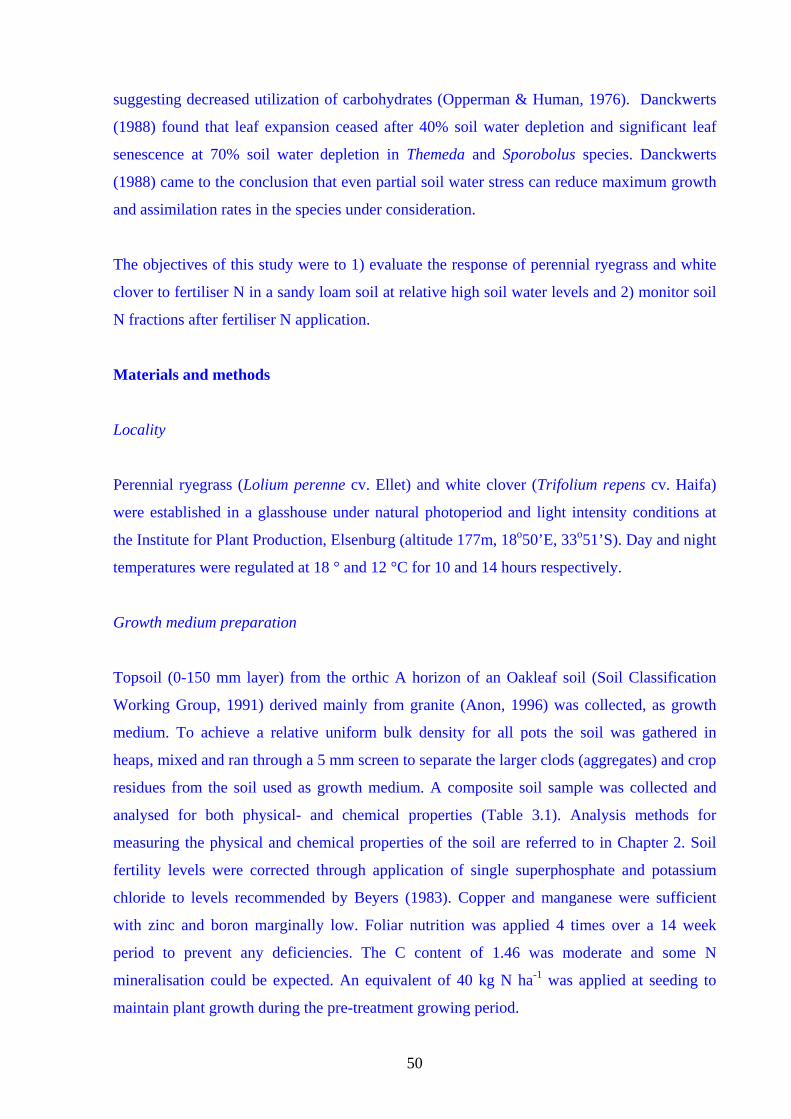
50
suggesting decreased utilization of carbohydrates (Opperman & Human, 1976). Danckwerts
(1988) found that leaf expansion ceased after 40% soil water depletion and significant leaf
senescence at 70% soil water depletion in Themeda and Sporobolus species. Danckwerts
(1988) came to the conclusion that even partial soil water stress can reduce maximum growth
and assimilation rates in the species under consideration.
The objectives of this study were to 1) evaluate the response of perennial ryegrass and white
clover to fertiliser N in a sandy loam soil at relative high soil water levels and 2) monitor soil
N fractions after fertiliser N application.
Materials and methods
Locality
Perennial ryegrass (Lolium perenne cv. Ellet) and white clover (Trifolium repens cv. Haifa)
were established in a glasshouse under natural photoperiod and light intensity conditions at
the Institute for Plant Production, Elsenburg (altitude 177m, 18o50’E, 33o51’S). Day and night
temperatures were regulated at 18 ° and 12 °C for 10 and 14 hours respectively.
Growth medium preparation
Topsoil (0-150 mm layer) from the orthic A horizon of an Oakleaf soil (Soil Classification
Working Group, 1991) derived mainly from granite (Anon, 1996) was collected, as growth
medium. To achieve a relative uniform bulk density for all pots the soil was gathered in
heaps, mixed and ran through a 5 mm screen to separate the larger clods (aggregates) and crop
residues from the soil used as growth medium. A composite soil sample was collected and
analysed for both physical- and chemical properties (Table 3.1). Analysis methods for
measuring the physical and chemical properties of the soil are referred to in Chapter 2. Soil
fertility levels were corrected through application of single superphosphate and potassium
chloride to levels recommended by Beyers (1983). Copper and manganese were sufficient
with zinc and boron marginally low. Foliar nutrition was applied 4 times over a 14 week
period to prevent any deficiencies. The C content of 1.46 was moderate and some N
mineralisation could be expected. An equivalent of 40 kg N ha-1 was applied at seeding to
maintain plant growth during the pre-treatment growing period.

51
Table 3.1 Chemical analysis and selected physical properties of the soil used as growth
medium
Ammonium-N and nitrate-N contents of 2.73 and 12.34 mg kg-1 were measured before the N
treatments were done. The soil was dried in stainless steel bins at 60 °C. To facilitate non-
destructive soil sampling during the growth period, pots were lined with plastic bags and
filled with 6.6 kg of the oven dried soil occupying a volume of 4324.57 cm3 resulting in a
bulk density of 1.53 g cm-3. Pots were watered and left for ten days to enable weed seed to
germinate. After removing the weeds a template with five holes, one in the centre and one in
each quarter of the pot, was used to plant the seed in a predetermined configuration at 5-10
mm depth. A few seeds were planted per hole followed by water application to fill the soil to
field water capacity (0.253 mm3 mm-3). Seedlings were thinned after emergence to five plants
per pot. Pots were watered daily through weighing pots and adding water to the predetermined
weight. Changes in plant weight as a result of growth, on a weekly basis, and soil removal due
to soil sampling were considered when pot weight after watering was calculated. Pots were
randomised after watering.
Plants were allowed to grow for an accumulative photoperiod of ca 691 hours from planting
and clipped at 50 mm height. The clippings were dried at 60 °C for ca18 h upon which pots
pH (KCl) 6.1Resistance Ohms 810 Clay % 14Phosphorus mg/kg 45 Silt % 13.1Potassium cmol(+)/kg 0.27 Fine Sand % 49.8Calcium cmol(+)/kg 2.42 Medium Sand % 15.9Magnesium cmol(+)/kg 1.09 Course Sand % 7.2Sodium cmol(+)/kg 0.45Total cations cmol(+)/kg 4.23 Classification SaLmCopper mg/kg 1.15Zinc mg/kg 0.79Manganese mg/kg 54Boron mg/kg 0.47
Carbon % 1.46
Ammonium-N mg/kg 2.729Nitrate-N mg/kg 12.341
Chemical properties Physical properties

52
showing least variation in DM production were at random allocated to the treatment
combinations.
Experimental design and treatments
The experiment was laid out as a completely randomised design with four replicates
(Snedecor & Cochran, 1967). The treatment design was a factorial with four soil water levels
namely 0.24, 0.19, 0.18 and 0.14 mm3 water mm-3 soil, representing soil water potentials of
-10, -20, -25 and -35 kPa, and five N levels equivalent to 0, 30, 60, 120 and 180 kg N ha-1
used as treatments. To simplify watering, the pots were grouped together according to water
treatments with pots rotating within water treatments when watered. The groups of pots that
remained together according to water treatments were rotated within the glasshouse after
watering.
To determine soil water content, soil suction or water potential (Russell, 1988) was measured
by placing three tensiometers in pots with perennial ryegrass at saturation point and
tensiometer water potential recorded as pot mass decrease as a result of evapotranspiration.
Pot mass (kg) versus tensiometer water potential (kPa) was plotted and described by the
logarithmic function (P<0.0001):
Pot mass (kg) = 8.6417114 + (- 0.32044674 *ln Tensiometer water potential)
Soil water contents in mm3 water mm-3 soil at predetermined soil water potentials (kPa) were
calculated. These values were used to calculate the total weight of the watered pot at
predetermined soil water potentials. The amount of water needed to reach a predetermined
water potential was calculated using the formula: water needed (g) = volumetric water content
* soil volume. The values derived from above mentioned equation were tested using a soil
water-characteristic curve representing a soil with a clay + silt content of 26% (Bennie et al.,
1988). Pots were allowed to dry to the pre-determined pot weights representing the different
water levels before fertiliser N treatments (as LAN dissolved in 200ml water) were applied.
Watering took place at 24 hour cycles through weighing pots and maintaining a pot weights
as close as possible to the predetermined weight.
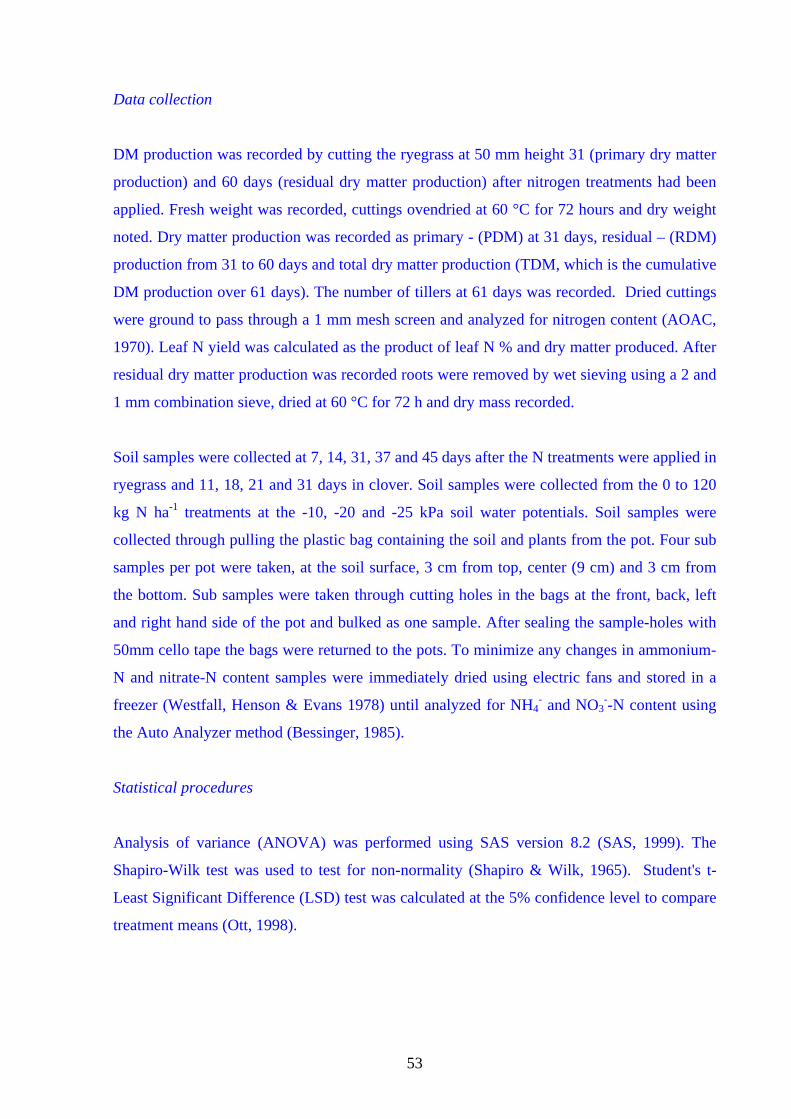
53
Data collection
DM production was recorded by cutting the ryegrass at 50 mm height 31 (primary dry matter
production) and 60 days (residual dry matter production) after nitrogen treatments had been
applied. Fresh weight was recorded, cuttings ovendried at 60 °C for 72 hours and dry weight
noted. Dry matter production was recorded as primary - (PDM) at 31 days, residual – (RDM)
production from 31 to 60 days and total dry matter production (TDM, which is the cumulative
DM production over 61 days). The number of tillers at 61 days was recorded. Dried cuttings
were ground to pass through a 1 mm mesh screen and analyzed for nitrogen content (AOAC,
1970). Leaf N yield was calculated as the product of leaf N % and dry matter produced. After
residual dry matter production was recorded roots were removed by wet sieving using a 2 and
1 mm combination sieve, dried at 60 °C for 72 h and dry mass recorded.
Soil samples were collected at 7, 14, 31, 37 and 45 days after the N treatments were applied in
ryegrass and 11, 18, 21 and 31 days in clover. Soil samples were collected from the 0 to 120
kg N ha-1 treatments at the -10, -20 and -25 kPa soil water potentials. Soil samples were
collected through pulling the plastic bag containing the soil and plants from the pot. Four sub
samples per pot were taken, at the soil surface, 3 cm from top, center (9 cm) and 3 cm from
the bottom. Sub samples were taken through cutting holes in the bags at the front, back, left
and right hand side of the pot and bulked as one sample. After sealing the sample-holes with
50mm cello tape the bags were returned to the pots. To minimize any changes in ammonium-
N and nitrate-N content samples were immediately dried using electric fans and stored in a
freezer (Westfall, Henson & Evans 1978) until analyzed for NH4- and NO3
--N content using
the Auto Analyzer method (Bessinger, 1985).
Statistical procedures
Analysis of variance (ANOVA) was performed using SAS version 8.2 (SAS, 1999). The
Shapiro-Wilk test was used to test for non-normality (Shapiro & Wilk, 1965). Student's t-
Least Significant Difference (LSD) test was calculated at the 5% confidence level to compare
treatment means (Ott, 1998).

54
Results and discussion
Soil ammonium-N and nitrate-N content
The influence of fertiliser N rate and soil water level on soil ammoniun-N and nitrate-N in
ryegrass and clover are summarised in Tables 3.2 & 3.3; Figures 3.1 to 3.4. The highest soil
ammonium-N and nitrate-N content for both perennial ryegrass and white clover were
recorded at the 120 kg N ha-1 rates (Tables 3.2 and 3.3). To compare mean soil N levels at the
end of the first regrowth cycle mean ammonium-N and nitrate-N were calculated over the first
31 days. In ryegrass the mean soil ammonium-N contents (over the first 31 days) were 8.13,
16.02 and 9.14 mg kg-1 and nitrate-N were 31.04, 41.10 and 25.21 mg kg –1 at -10, -20 and -25
kPa water potentials respectively. However for clover the means recorded were 10.16, 9.98
and 10.55 mg kg –1 (ammonium-N) and 27.70, 43.24 and 47.84 mg kg –1 (nitrate-N) at the
respective soil water potentials. The slightly higher mean N levels normally recorded in
clover is possibly the result of lower uptake of nitrate as symbiotic N fixation enable clover to
be less dependent on soil-N.
Ammonium-N levels of ryegrass were relatively high at 7 days after fertiliser N application
but dropped to levels generally lower than 10 mg kg-1 at the 30 and 60 kg N ha-1 rates at 14
days and thereafter (Table 3.2, Figure 3.1). Ammonium-N levels in clover at the 30 and 60 kg
N ha-1 remained relative constant at levels between 2.75 and 9.15 mg kg-1 (except one
treatment at 15.67 mg kg-1) over the sampling period (Figure 3.2, Table 3.3). Application of
120 kg N ha-1 resulted in significantly higher (P=0.05) soil ammonium-N contents for a
period of 30 (-10 and -20 kPa) and 14 days (-25 kPa) following fertiliser N application in
ryegrass. Application of 120 kg N ha-1 resulted in significantly higher (P=0.05) soil
ammonium-N contents for a period of 21 days (-10 and -20 kPa) and 31 days (-25 kPa)
following fertiliser N application in clover.
Nitrate-N levels in ryegrass showed similar responses as observed for ammonium-N with
nitrate-N levels decreasing between 7 and 14 days followed by relative constant levels from
14 to 45 days after fertiliser N application (Figure 3.3, Table 3.2). Nitrate-N contents in clover
show a general decrease over the sampling period with 120 kg N ha-1 resulting in higher
nitrate-N levels at all samplings (Figure 3.4, Table 3.3). The application of 120 kg N ha-1

55
resulted in significantly higher (P=0.05) soil ammonium-N contents (compared to the 0 kg N
ha-1) during the first regrowth cycle (31 days) at all soil water levels tested.
The soil N content monitoring has shown that the application of 120 kg N ha-1 to ryegrass
could result in significantly higher soil ammonium-N levels 7 days after N application. These
higher levels can be maintained for up to 37 days at -10 and -20 kPa but only for 14 days at -
25 kPa possibly due to increased nitrification in the better aerated soil at lower water levels
(Foth, 1978). The application of 120 kg N ha-1 to ryegrass can result in significantly higher
soil nitrate-N levels over a 37 day period following N application at -10 and -20 kPa and 45
days at -25 kPa. The application of 120 kg N ha-1 to clover resulted in higher (P=0.05) soil
ammonium-N levels compared to the 0 kg N ha-1 rates for a period of 21 days at -10 and -20
kPa and 31 days at -25 kPa following fertiliser N application. Soil nitrate-N levels at 120 kg N
ha-1 at all water levels covered by the study were higher (P=0.05) than the 0 kg N ha-1 rate
over the 31 day sampling period.
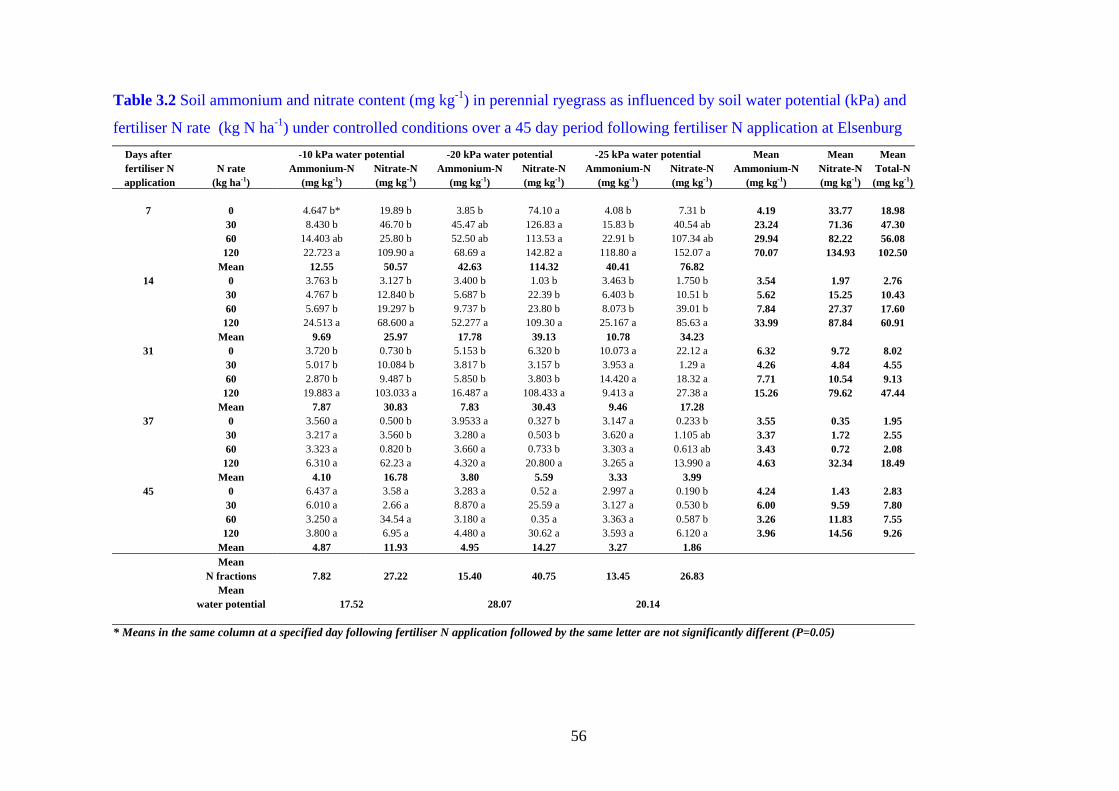
56
Table 3.2 Soil ammonium and nitrate content (mg kg-1) in perennial ryegrass as influenced by soil water potential (kPa) and
fertiliser N rate (kg N ha-1) under controlled conditions over a 45 day period following fertiliser N application at Elsenburg Days after -10 kPa water potential -20 kPa water potential -25 kPa water potential Mean Mean Mean fertiliser N N rate Ammonium-N Nitrate-N Ammonium-N Nitrate-N Ammonium-N Nitrate-N Ammonium-N Nitrate-N Total-N application (kg ha-1) (mg kg-1) (mg kg-1) (mg kg-1) (mg kg-1) (mg kg-1) (mg kg-1) (mg kg-1) (mg kg-1) (mg kg-1)
7 0 4.647 b* 19.89 b 3.85 b 74.10 a 4.08 b 7.31 b 4.19 33.77 18.98 30 8.430 b 46.70 b 45.47 ab 126.83 a 15.83 b 40.54 ab 23.24 71.36 47.30 60 14.403 ab 25.80 b 52.50 ab 113.53 a 22.91 b 107.34 ab 29.94 82.22 56.08 120 22.723 a 109.90 a 68.69 a 142.82 a 118.80 a 152.07 a 70.07 134.93 102.50 Mean 12.55 50.57 42.63 114.32 40.41 76.82
14 0 3.763 b 3.127 b 3.400 b 1.03 b 3.463 b 1.750 b 3.54 1.97 2.76 30 4.767 b 12.840 b 5.687 b 22.39 b 6.403 b 10.51 b 5.62 15.25 10.43 60 5.697 b 19.297 b 9.737 b 23.80 b 8.073 b 39.01 b 7.84 27.37 17.60 120 24.513 a 68.600 a 52.277 a 109.30 a 25.167 a 85.63 a 33.99 87.84 60.91 Mean 9.69 25.97 17.78 39.13 10.78 34.23
31 0 3.720 b 0.730 b 5.153 b 6.320 b 10.073 a 22.12 a 6.32 9.72 8.02 30 5.017 b 10.084 b 3.817 b 3.157 b 3.953 a 1.29 a 4.26 4.84 4.55 60 2.870 b 9.487 b 5.850 b 3.803 b 14.420 a 18.32 a 7.71 10.54 9.13 120 19.883 a 103.033 a 16.487 a 108.433 a 9.413 a 27.38 a 15.26 79.62 47.44 Mean 7.87 30.83 7.83 30.43 9.46 17.28
37 0 3.560 a 0.500 b 3.9533 a 0.327 b 3.147 a 0.233 b 3.55 0.35 1.95 30 3.217 a 3.560 b 3.280 a 0.503 b 3.620 a 1.105 ab 3.37 1.72 2.55 60 3.323 a 0.820 b 3.660 a 0.733 b 3.303 a 0.613 ab 3.43 0.72 2.08 120 6.310 a 62.23 a 4.320 a 20.800 a 3.265 a 13.990 a 4.63 32.34 18.49 Mean 4.10 16.78 3.80 5.59 3.33 3.99
45 0 6.437 a 3.58 a 3.283 a 0.52 a 2.997 a 0.190 b 4.24 1.43 2.83 30 6.010 a 2.66 a 8.870 a 25.59 a 3.127 a 0.530 b 6.00 9.59 7.80 60 3.250 a 34.54 a 3.180 a 0.35 a 3.363 a 0.587 b 3.26 11.83 7.55 120 3.800 a 6.95 a 4.480 a 30.62 a 3.593 a 6.120 a 3.96 14.56 9.26
Mean 4.87 11.93 4.95 14.27 3.27 1.86 Mean N fractions 7.82 27.22 15.40 40.75 13.45 26.83 Mean water potential 17.52 28.07 20.14 * Means in the same column at a specified day following fertiliser N application followed by the same letter are not significantly different (P=0.05)

57
Table 3.3 Soil ammonium and nitrate content (mg kg-1) in white clover pots as influenced by soil water potential (kPa) and
fertiliser N rate (kg N ha-1) a under controlled conditions over a 31 day period following fertiliser N application at Elsenburg
Days after -10 kPa water potential -20 kPa water potential -25 kPa water potential Mean Mean Mean fertiliser N N rate Ammonium-N Nitrate-N Ammonium-N Nitrate-N Ammonium-N Nitrate-N Ammonium-N Nitrate-N Total-N application (kg ha-1) (mg kg-1) (mg kg-1) (mg kg-1) (mg kg-1) (mg kg-1) (mg kg-1) (mg kg-1) (mg kg-1) (mg kg-1)
11 0 3.447 b* 21.280 b 2.750 c 30.83 b 2.807 b 29.150 a 3.00 27.09 15.04
30 5.967 b 47.880 ab 5.763 c 34.24 b 7.477 b 43.720 a 6.40 41.95 24.17 60 8.800 b 21.15 b 15.670 b 70.900 ab 8.617 b 34.760 a 11.03 42.27 26.65 120 47.783 a 65.100 a 37.480 a 92.930 a 31.240 a 86.22 a 38.83 81.42 60.13 Mean 16.50 38.85 15.42 57.23 12.54 48.46
18 0 7.790 b 14.640 b 7.357 b 28.550 b 6.210 b 15.890 b 7.12 19.69 13.41 30 5.687 b 31.250 b 6.073 b 46.390 b 5.680 b 52.580 b 5.81 43.41 24.61 60 5.273 b 20.910 b 9.040 b 69.600 ab 9.150 b 69.410 ab 7.82 53.31 30.56 120 26.827 a 90.030 a 30.327 a 99.270 a 35.640 a 143.500 a 30.93 110.93 70.93 Mean 11.39 39.21 13.20 60.95 14.17 70.35
21 0 3.467 b 9.080 b 3.153 b 23.300 b 3.000 b 14.200 b 3.21 15.53 9.37 30 3.803 b 28.470 ab 3.333 b 20.790 b 3.520 b 39.250 ab 3.55 29.50 16.53 60 3.343 b 15.200 b 4.647 b 33.17 b 8.350 b 49.070 ab 5.45 32.48 18.96 120 12.777 a 45.230 a 14.573 a 79.030 a 25.790 a 119.430 a 17.71 81.23 49.47 Mean 5.85 24.50 6.43 39.07 10.17 55.49
31 0 5.500 ab 1.613 b 4.057 a 5.070 b 4.807 b 3.000 b 4.79 3.23 4.01 30 6.937 ab 5.467 b 4.8700 a 5.173 b 4.687b 7.810 b 5.50 6.15 5.82 60 4.590 b 4.497 b 4.6967 a 17.837 b 4.770 b 5.910 b 4.69 9.41 7.05
120 10.563 a 21.327 a 5.8367 a 34.770 a 7.003 a 51.560 a 7.80 35.89 21.84 Mean 6.90 8.23 4.87 15.71 5.32 17.07 Mean N fractions 10.16 27.70 9.98 43.24 10.55 47.84 Mean Moisture 18.93 26.61 29.19 * Means in the same column at a specified day following fertiliser N application followed by the same letter are not significantly different (P=0.05)

58
Figure 3.1 The effect of fertiliser N rate (kg N ha-1) and soil water potential (kPa) on soil ammonium-N content (mg kg-1) in perennial ryegrass over a 45 day period following fertiliser N application under controlled conditions at Elsenburg.
Days after fertiliser N application
Am
mon
ium
-N (m
g kg
-1)
0
10
20
30
40
50
60
7 14 31 37 45
03060120
0
10
20
30
40
50
60
7 14 31 37 45
03060120
0
10
20
30
40
50
60
7 14 31 37 45
03060120
-10 kPa
-20 kPa
-25 kPa

59
Figure 3.2 The effect of fertiliser N rate (kg N ha-1) and soil water potential (kPa) on soil ammonium-N content (mg kg-1) in white clover over a 31 day period following fertiliser N application under controlled conditions at Elsenburg.
Days after N application
-10 kPaA
mm
oniu
mA
mm
oniu
m-- N
(mg
kgN
(mg
kg-- 11
))
0102030405060
11 18 21 31
03060120
0102030405060
11 18 21 31
03060120
0102030405060
11 18 21 31
03060120
--20 20 kPakPa
--25 25 kPakPa

60
Figure 3.3 The effect of fertiliser N rate (kg N ha-1) and soil water potential (kPa) on soil nitrate-N content (mg kg-1) in perennial ryegrass over a 45 day period following fertiliser N application under controlled conditions at Elsenburg.
Days after fertiliser N application
Nitr
ate-
N (m
g kg
-1)
020406080
100120140160
7 14 31 37 45
03060120
020406080
100120140160
7 14 31 37 45
03060120
020406080
100120140160
7 14 31 37 45
03060120
-10 kPa
-20 kPa
-25 kPa
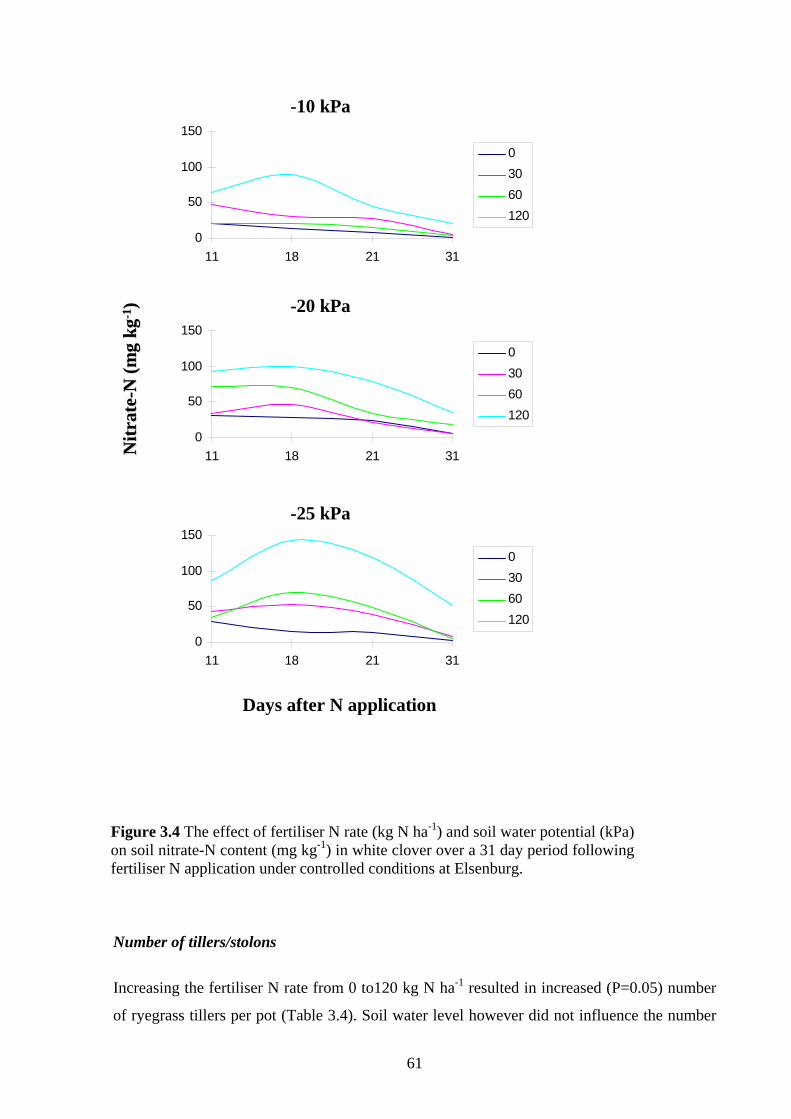
61
Number of tillers/stolons
Increasing the fertiliser N rate from 0 to120 kg N ha-1 resulted in increased (P=0.05) number
of ryegrass tillers per pot (Table 3.4). Soil water level however did not influence the number
Figure 3.4 The effect of fertiliser N rate (kg N ha-1) and soil water potential (kPa) on soil nitrate-N content (mg kg-1) in white clover over a 31 day period following fertiliser N application under controlled conditions at Elsenburg.
Days after N application
Nitr
ate
Nitr
ate --
N (m
g kg
N (m
g kg
-- 11))
0
50
100
150
11 18 21 31
03060120
0
50
100
150
11 18 21 31
03060120
0
50
100
150
11 18 21 31
03060120
-10 kPa
-20 kPa
-25 kPa
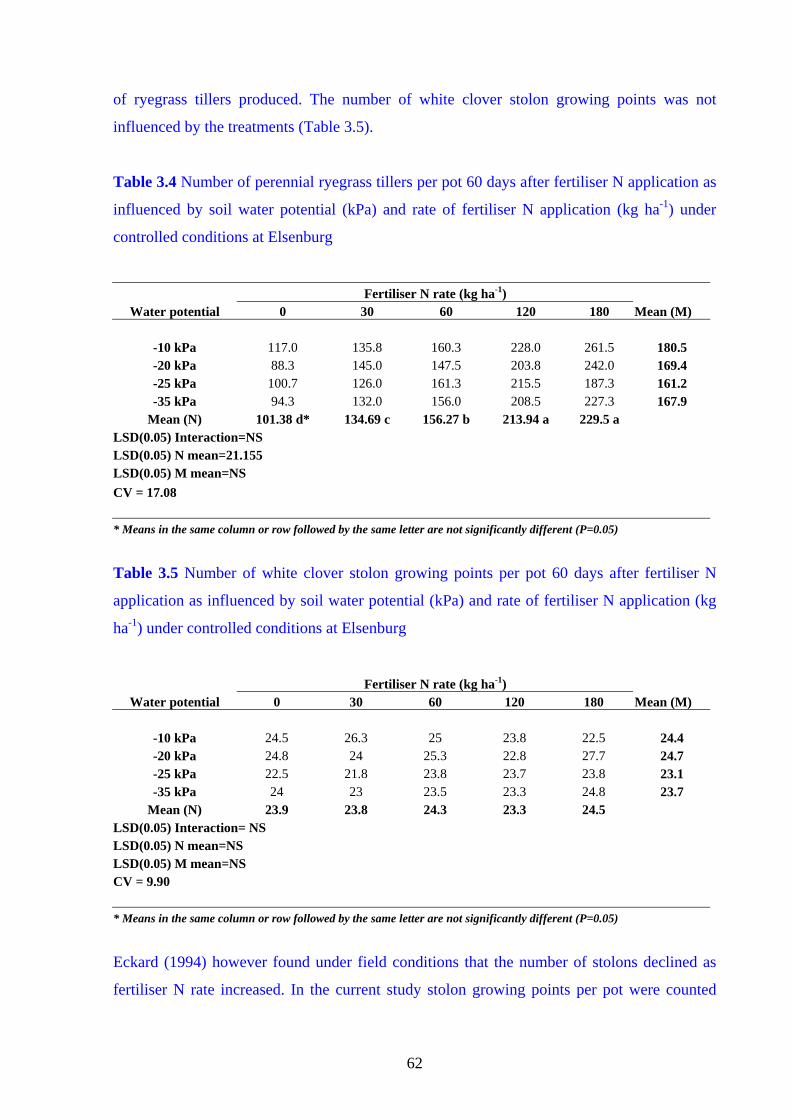
62
of ryegrass tillers produced. The number of white clover stolon growing points was not
influenced by the treatments (Table 3.5).
Table 3.4 Number of perennial ryegrass tillers per pot 60 days after fertiliser N application as
influenced by soil water potential (kPa) and rate of fertiliser N application (kg ha-1) under
controlled conditions at Elsenburg
Fertiliser N rate (kg ha-1) Water potential 0 30 60 120 180 Mean (M)
-10 kPa 117.0 135.8 160.3 228.0 261.5 180.5 -20 kPa 88.3 145.0 147.5 203.8 242.0 169.4 -25 kPa 100.7 126.0 161.3 215.5 187.3 161.2 -35 kPa 94.3 132.0 156.0 208.5 227.3 167.9
Mean (N) 101.38 d* 134.69 c 156.27 b 213.94 a 229.5 a LSD(0.05) Interaction=NS LSD(0.05) N mean=21.155 LSD(0.05) M mean=NS CV = 17.08 * Means in the same column or row followed by the same letter are not significantly different (P=0.05)
Table 3.5 Number of white clover stolon growing points per pot 60 days after fertiliser N
application as influenced by soil water potential (kPa) and rate of fertiliser N application (kg
ha-1) under controlled conditions at Elsenburg
Fertiliser N rate (kg ha-1) Water potential 0 30 60 120 180 Mean (M)
-10 kPa 24.5 26.3 25 23.8 22.5 24.4 -20 kPa 24.8 24 25.3 22.8 27.7 24.7 -25 kPa 22.5 21.8 23.8 23.7 23.8 23.1 -35 kPa 24 23 23.5 23.3 24.8 23.7
Mean (N) 23.9 23.8 24.3 23.3 24.5 LSD(0.05) Interaction= NS LSD(0.05) N mean=NS LSD(0.05) M mean=NS CV = 9.90 * Means in the same column or row followed by the same letter are not significantly different (P=0.05)
Eckard (1994) however found under field conditions that the number of stolons declined as
fertiliser N rate increased. In the current study stolon growing points per pot were counted

63
while Eckard (1994) counted the number of stolons crossing the sides of squares placed in the
pasture.
Dry matter production
Primary-, residual- and total dry matter production of perennial ryegrass were significantly
influenced by rate of fertiliser N application and soil water level. Total dry matter production
was also significantly influenced by the interaction between fertiliser N rate and soil water
level. White clover, however, was only influenced by fertiliser N rate and soil water level
during the second regrowth cycle (RDM yield) following fertiliser N application.
Primary dry matter production (PDM)
Increasing fertiliser N application rate from 0 to 120 kg N ha-1 resulted in increased (P=0.05)
ryegrass PDM production (Table 3.6) followed by a non-significant increase as N rate was
increased to 180 kg N ha-1. The non significant increases in ryegrass PDM yields as fertiliser
N rates were increased from 120 kg N ha-1 to 180 kg N ha-1, suggest that perennial ryegrass
reached maximum productivity under the conditions that prevailed during the first regrowth
cycle. In contrast to ryegrass, clover PDM production was not influenced by any of the
treatments suggesting that fertiliser N rates of up to 180 kg N ha-1 may not influence clover
productivity under similar conditions that prevailed during the first regrowth cycle (Table
3.7). This result shows that the nitrogen applied to a perennial ryegrass-white clover pasture
will mainly be absorbed by the ryegrass fraction during the first regrowth cycle. The reduction
of either clover % or clover DM production as reported by Stout, Weaver & Elwinger (2001)
as well as van Heerden & Durand (1994) can therefore be ascribed to the stimulation of
ryegrass by fertiliser N rather than suppressing clover growth directly. The mean clover PDM
yield of 2.221 g pot-1 at 180 kg N ha-1 compared to 2.064 g pot-1 at 0 kg N ha-1 shows that the
clover plants were not negatively influenced by the high levels of soil-N during the first
regrowth cycle.
The highest ryegrass PDM production, although not significantly higher than at -10 kPa, was
recorded at the -20 kPa soil water potential.

64
Table 3.6 Primary, residual and total dry matter production (g pot-1) of perennial ryegrass as
influenced by soil water potential (kPa) and fertiliser N application rate (kg ha-1) under
controlled conditions at Elsenburg
Primary DM Production (g pot-1) Fertiliser N rate (kg ha-1)
Water potential 0 30 60 120 180 Mean (M)
-10 kPa 2.383 2.930 3.240 4.848 5.145 3.709 ab* -20 kPa 1.993 3.398 3.725 4.713 5.343 3.931 a -25 kPa 1.915 2.495 3.460 4.233 4.673 3.355 c -35 kPa 1.970 2.980 3.733 4.578 3.993 3.528 bc
Mean (N) 2.077 d 2.951 c 3.539 b 4.593 a 4.788 a LSD(0.05) Interaction=NS LSD(0.05) N mean=0.3601 LSD(0.05) M mean=0.3217 CV = 13.83
Residual DM Production (g pot-1) Fertiliser N rate (kg ha-1)
Water potential 0 30 60 120 180 Mean (M)
-10 kPa 0.790 1.130 1.100 4.550 6.495 2.813 a -20 kPa 0.537 1.190 1.360 3.770 6.073 2.694 a -25 kPa 0.483 0.743 1.165 2.918 5.470 2.157 b -35 kPa 0.453 0.770 0.933 3.043 3.860 1.883 b
Mean (N) 0.576 d 0.958 cd 1.139 c 3.570 b 5.474 a LSD(0.05) Interaction=NS LSD(0.05) N mean=0.5381 LSD(0.05) M mean=0.4807 CV = 31.38
Total DM Production (g pot-1) Fertiliser N rate (kg ha-1)
Water potential 0 30 60 120 180 Mean (M)
-10 kPa 3.173 hi 4.060 fgh 4.340 fgh 9.398 cd 11.640 a 6.522 a -20 kPa 2.530 i 4.588 fgh 5.085 f 8.483 de 11.415 ab 6.625 a -25 kPa 2.398 i 3.238 ghi 4.625 fgh 7.150 e 10.143 bc 5.511 b -35 kPa 2.423 i 3.750 fghi 4.665 fg 7.620 e 7.853 e 5.412 b
Mean (N) 2.653 e 3.909 d 4.679 c 8.163 b 10.263 a LSD(0.05) Interaction=1.49 LSD(0.05) N mean=0.7433 LSD(0.05) M mean=0.6641 CV = 17.21 * Means in the same column or row at a specified dry matter production followed by the same letter are not significantly different (P=0.05)

65
Table 3.7 Primary, residual and total dry matter production (g pot-1) of white clover as
influenced by soil water potential (kPa) and fertiliser N application rate (kg ha-1) under
controlled conditions at Elsenburg
Primary DM Production (g pot-1) Fertiliser N (kg ha-1)
Water potential 0 30 60 120 180 Mean (M)
-10 kPa 2.145 2.700 2.868 2.648 1.950 2.462 -20 kPa 2.055 2.255 2.153 2.148 2.750 2.252 -25 kPa 2.108 2.238 2.130 2.110 2.110 2.139 -35 kPa 1.948 2.218 2.170 2.065 2.208 2.122
Mean (N) 2.064 2.353 2.342 2.243 2.221 LSD(0.05) Interaction=NS LSD(0.05) N mean=NS LSD(0.05) M mean=NS CV = 28.07
Residual DM Production (g pot-1) Fertiliser N rate (kg ha-1)
Water potential 0 30 60 120 180 Mean (M)
-10 kPa 4.383 5.078 4.583 5.338 5.653 5.007 b -20 kPa 4.735 4.465 5.273 5.165 6.163 5.098 b -25 kPa 5.478 5.408 5.205 6.088 5.805 5.571 a -35 kPa 4.145 4.640 4.780 5.188 5.030 4.757 b
Mean (N) 4.685 c 4.898 c 4.939 bc 5.401 ab 5.629 a LSD(0.05) Interaction=NS LSD(0.05) N mean=0.5003 LSD(0.05) M mean=0.4477 CV = 13.58
Total DM Production (g pot-1) Fertiliser N rate (kg ha-1)
Water potential 0 30 60 120 180 Mean (M)
-10 kPa 6.528 7.778 7.450 7.985 7.603 7.469 -20 kPa 6.790 6.720 7.427 7.313 8.913 7.351 -25 kPa 7.585 7.645 7.335 8.667 7.915 7.785 -35 kPa 6.093 6.858 6.950 7.253 7.238 6.878
Mean (N) 6.749 7.250 7.281 7.747 7.851 LSD(0.05) Interaction=NS LSD(0.05) N mean=NS LSD(0.05) M mean=NS CV = 16.63 * Means in the same column or row at a specified dry matter production followed by the same letter are not significantly different (P=0.05)
66
Residual dry matter production (RDM)
Carry-over N to the second regrowth cycle (30 to 60 days) caused increased (P=0.05) ryegrass
RDM production as N rate progressively increased from 60 to 120 and 180 kg N ha-1 (Table
3.6). No differences (P>0.05) in ryegrass RDM production between 0 kg N ha-1 and 30 kg N
ha-1 were recorded suggesting no carry over of N fertiliser N to the second regrowth cycle at
the 30 kg N ha-1 rate. Application of an equivalent of 120 and 180 kg N ha-1 resulted in higher
(P=0.05) ryegrass RDM yields than achieved at the 0, 30 and 60 kg N ha-1 rates. These
increases can largely be attributed to the higher (P=0.05) soil N levels measured at the 120
(and assumably the 180) kg N ha-1 rates. White clover showed similar reaction to fertiliser N
rate with no difference in clover RDM production as N rate increased from 0 to 30 and 60 kg
N ha-1 (Table 3.7). The application of 180 kg N ha-1 however resulted in significantly higher
clover RDM yields compared to N rates of 0, 30 and 60 kg N ha-1. The reaction of white
clover to fertiliser N could be the result of increased productivity as mean dry matter
production increased by 2.621 g pot-1 at the 0 kg N ha-1 rate between PDM and RDM
production. The positive reaction to increased levels of fertiliser N confirmed that nitrogen
levels of as high as 180 kg N ha-1 can be applied without reducing white clover productivity.
Increasing the soil water level to -10 kPa and -20 kPa, resulted in higher (P=0.05) ryegrass
RDM yields than at -25 and -35 kPa. This reaction could be the result of increased mass flow
of N to the root surface at the higher soil water contents as well as growth induced N demand
as plant growth rate increased at the higher soil water levels.
Total dry matter production (TDM)
Increased fertiliser N application rate resulted in increased (P=0.05) ryegrass TDM yield over
all N rates covered by the study (Table 3.6).
Higher (P=0.05) mean ryegrass TDM yields were recorded at the -10 kPa and -20 kPa soil
water potentials, indicating that water potentials of -10 kPa will not reduce ryegrass TDM
production. White clover TDM production was not influenced by the treatments used (Table
3.7).

67
Soil water levels did not influenced ryegrass TDM production at a specific N rate between 0
and 60 kg N ha-1. However, the application of 120 kg N ha-1 and especially 180 kg N ha-1
resulted in higher (P>0.05) ryegrass PDM yields in the wetter soils (-10 and -20 kPa). The
progressive reduction in ryegrass TDM yield at 180 kg N ha-1 as soil water level decreases
from -10 to -35 kPa suggest that soil water potential as low as -25 kPa can significantly
(P=0.05) reduces ryegrass productivity when plant production potential is high due to high
soil N supply. A reduction of 3.787g (32.5%) in ryegrass TDM production was recorded
when the soil water level was reduced from -10 to -35 kPa at the 180 kg N ha-1 application
rate (Table 3.6). Reduced mass flow of water towards the ryegrass root surface as soil water
tension increases could result in reduced contact between roots and N, restricting N
absorption although high enough N concentrations to maintain maximum yields possibly
occurred in the soil. The fact that no differences occurred between water levels at the 0 to 60
kg N ha-1 application rates confirms that high applications of N result in high productivity and
therefore need high water availability, but as soon as N supply decreases, decreases in water
supply will be less restricted. Penman (1962) reported that ryegrass on high nitrogen plots
tolerated higher water deficits than low nitrogen plots but did not investigate the possible
reason for this response.
Legumes like white clover is mostly self sufficient with regard to N nutrition due to symbiotic
nitrogen fixation. It is therefore not dependent on the absorption of water to meet its N
requirements as were proved by the absence of responses to the different N rates tested. Soil
water level will however influence the supply of oxygen to nitrogen fixing bacteria and might
influence clover production at higher soil water levels. The highest (-10 kPa) water level
tested in the study however did not influence clover PDM and TDM production, which
indicates that N-fixation was probably not affected.
Leaf N content (%)
Increased fertiliser N rate resulted in increased perennial ryegrass as well as white clover leaf
N content at the end of the first regrowth cycle (Tables 3.8 & 3.9). The application of 120 kg
N ha-1 resulted in the highest (P=0.05) ryegrass leaf N contents while the lowest (P=0.05) was
recorded at 0 kg N ha-1 with no difference between 30 and 60 kg N ha-1. Similar results were
recorded in clover where the application of 60 and 120 kg N ha-1 resulted in higher (P=0.05)
leaf N contents compared to 0 and 30 kg N ha-1.

68
Table 3.8 Primary and residual leaf nitrogen content (%) of perennial ryegrass as influenced
by soil water potential and rate of fertiliser N application (kg ha-1) under controlled conditions
at Elsenburg
N in primary DM (%) Water potential Fertiliser N rate (kg ha-1)
0 30 60 120 Mean (M)
-10 kPa 3.394 3.673 3.916 5.416 4.100 a* -20 kPa 2.907 3.490 3.730 5.261 3.847 ab -25 kPa 2.450 3.189 3.519 5.340 3.625 b
Mean (N) 2.917 c 3.451 b 3.722 b 5.339 a LSD(0.05) interaction = NS LSD(0.05) N mean = 0.3584 LSD(0.05) M mean = 0.3104 CV = 9.55
N in residual DM (%) Water potential Fertiliser N rate (kg ha-1)
0 30 60 120 Mean (M)
-10 kPa 2.956 2.763 2.772 3.133 2.906 -20 kPa 2.573 2.677 3.845 3.032 -25 kPa 2.522 2.336 2.270 3.697 2.723
Mean (N) 2.783 b 2.557 b 2.573 b 3.558 a LSD(0.05) interaction = NS LSD(0.05) N mean = 0.3778 LSD(0.05) M mean = NS CV = 12.22 * Means in the same column or row at a specified N % followed by the same letter are not significantly different (P=0.05)
Perennial ryegrass leaf N content at the end of the first regrowth cycle decreased as soil water
level decreased with leaf N content at -10 kPa significantly higher than at -25 kPa. Ryegrass
leaf N content measured at -20 kPa did not differ from values recorded at -10 and -25 kPa.
Clover leaf N content was not influenced by soil water level for the same reasons as discussed
under RDM production.
The only treatments resulted in ryegrass leaf N contents lower than the 2.0-3.2% suggested by
Reuter & Robinson (1997) as the zone of marginal deficiency were 30 kg N ha-1 at -25 kPa

69
and 0 kg N ha-1 at -20 and -25 kPa. Clover leaf N content was without exception higher than
the 3.2 to 3.6 % regarded as marginal deficient (Reuter & Robinson, 1997).
Table 3.9 Primary and residual leaf nitrogen content (%) of white clover as influenced by soil
water potential (kPa) and rate of fertiliser N application (kg ha-1) under controlled conditions
at Elsenburg
N in primary DM (%) Water potential Fertiliser N rate (kg ha-1)
0 30 60 120 Mean (M)
-10 kPa 4.604 4.669 4.988 5.035 4.824 -20 kPa 4.926 4.627 5.106 5.256 4.979 -25 kPa 4.535 4.905 5.203 5.223 4.967
Mean (N) 4.688 b 4.734 b 5.099 a 5.171 a LSD(0.05) Interaction = NS LSD(0.05) N mean = 0.266 LSD(0.05) M mean = NS CV = 5.55
N in residual DM (%) Water potential Fertiliser N rate (kg ha-1)
0 30 60 120 Mean (M)
-10 kPa 4.481 4.287 4.376 4.102 4.312 a -20 kPa 4.143 4.098 4.012 4.207 4.005 b -25 kPa 3.956 4.128 4.078 3.872 4.009 b
Mean (N) 4.193 4.171 4.155 4.060 LSD(0.05) interaction = NS LSD(0.05) N mean = NS LSD(0.05) M mean = 0.1613 CV = 4.62 * Means in the same column or row at a specified N % followed by the same letter are not significantly different (P=0.05)
The only difference (P=0.05) recorded at the end of the second regrowth cycle were higher
ryegrass leaf N contents at the 120 kg N ha-1 rate compared to the 0, 30 and 60 kg N ha-1 rates.
Results confirmed by Ball (1979, cited by Eckard, 1994) reporting that white clover N content
showed little response to fertiliser N. Eckard (1994) however reported that the average N
content of both annual ryegrass and white clover increased linearly as fertiliser N increased.

70
Soil water level influenced (P=0.05) clover leaf N content only in the second regrowth cycle,
resulting in a higher leaf N content at the -10 kPa level.
Leaf N yield
Perennial ryegrass leaf N yield (g pot-1) at the end of the first regrowth cycle, increased as
fertiliser N rates increased (Table 3.10).
Table 3.10 Primary, residual and total leaf nitrogen yield (g pot-1) of perennial ryegrass as
influenced by soil moisture potential (kPa) and rate of fertiliser N application (kg ha-1) under
controlled conditions at Elsenburg
N in primary DM (g pot-1)* Water potential Fertiliser N rate (kg ha-1)
0 30 60 120 Mean (M)
-10 kPa 0.081 0.108 0.127 0.263 0.144 -20 kPa 0.058 0.119 0.139 0.248 0.141 -25 kPa 0.047 0.080 0.122 0.226 0.119
Mean (N) 0.062 0.102 0.129 0.246
N in residual DM (g pot-1) Water potential Fertiliser N rate (kg ha-1)
0 30 60 120 Mean (M)
-10 kPa 0.023 0.031 0.030 0.143 0.057 -20 kPa **NA 0.031 0.036 0.145 0.071 -25 kPa 0.012 0.017 0.026 0.108 0.041
Mean (N) 0.018 0.026 0.031 0.132
N in total DM (g pot-1) Water potential Fertiliser N rate (kg ha-1)
0 30 60 120 Mean (M)
-10 kPa 0.104 0.139 0.157 0.405 0.201 -20 kPa NA 0.149 0.175 0.393 0.239 -25 kPa 0.059 0.097 0.148 0.334 0.160
Mean (N) 0.082 0.128 0.160 0.377 ** No data available *Nitrogen yield was calculated as follows:
Nitrogen yield = DM production (g pot-1) * Percentage N/100
No statistical analysis was done on this parameter as analysis were done on the components DM production
and percentage N in the leaves harvested.

71
The increased ryegrass PDM production and higher plant N content are the reasons for the
increased N removal at higher N rates. Clover showed a slight increase as fertiliser N was
increased from 0 to 60 kg N ha-1 followed by a slight reduction at the 120 kg N ha-1 rate
(Table 3.11). The lowest ryegrass primary leaf N yields were obtained at the -25 kPa water
potential, possibly due to slower uptake of soil N as already discussed. The highest clover
primary leaf N yield was measured at the -10 kPa water level, slightly higher than at -20 and
-25 kPa.
Table 3.11 Primary, residual and total leaf nitrogen yield (g pot-1) of white clover as
influenced by soil moisture potential (kPa) and rate of fertiliser N application (kg ha-1) under
controlled conditions at Elsenburg
N in primary DM (g pot-1)
Water potential Fertiliser N rate (kg ha-1) 0 30 60 120 Mean (M)
-10 kPa 0.099 0.126 0.143 0.133 0.125 -20 kPa 0.101 0.104 0.110 0.113 0.107 -25 kPa 0.096 0.110 0.111 0.110 0.107
Mean (N) 0.099 0.113 0.121 0.119 0.113
N in residual DM (g pot-1) Water potential Fertiliser N rate (kg ha-1)
0 30 60 120 Mean (M)
-10 kPa 0.196 0.218 0.201 0.219 0.208 -20 kPa 0.196 0.183 0.212 0.217 0.202 -25 kPa 0.217 0.223 0.212 0.236 0.222
Mean (N) 0.203 0.208 0.208 0.224 0.211
N in total DM (g pot-1) Water potential Fertiliser N rate (kg ha-1)
0 30 60 120 Mean (M)
-10 kPa 0.295 0.344 0.344 0.352 0.334 -20 kPa 0.297 0.287 0.322 0.330 0.309 -25 kPa 0.312 0.333 0.323 0.346 0.329
Mean (N) 0.302 0.321 0.329 0.343 0.324 *Nitrogen yield was calculated as follows:
Nitrogen yield = DM production (g pot-1) * Percentage N/100
No statistical analysis was done on this parameter as analysis were done on the components DM production
and percentage N in the leaves harvested.

72
Ryegrass leaf N yields at the end of the second regrowth cycle followed the same trend as in
the first although at much lower levels. In contrast to this, clover leaf N yields at the end of
the second regrowth cycle were much higher than after the first regrowth cycle emphasising
the ability of clover to fix N symbiotically and thereby restricting the negative effects of low
soil-N content on clover productivity.
Increased fertiliser N rates resulted in increased ryegrass total N yields. Differences between
total N yields of clover were negligible. Total leaf nitrogen yields of ryegrass after 60 days,
with 0 kg N ha-1 at -10 and -25 kPa were 0.104 and 0.059 g pot-1 respectively (Table 3.10).
These values represented N removal of 43.23 and 24.52 kg N ha-1 illustrating the negative
effect of lower water levels on soil N availability and/or the capacity of ryegrass roots to
absorb soil N at lower soil water contents. The same tendency was observed (total leaf N after
a 60 day period) at the 120 Kg N ha-1 application rate where 168.33, 163.34 and 138.82 kg N
ha-1 were removed at -10, -20 and -25 kPa respectively. A contributing factor to the
differences measured, could be increased plant N uptake as dry matter production increase
under more favourable environmental conditions.
Root dry mass (Root DM)
Both fertiliser N rate and soil water level influenced (P=0.05) the dry mass of ryegrass and
clover roots (Tables 3.12 & 3.13). With the exception of 0 kg N ha-1, the application of 180 kg
N ha-1 resulted in lower (P=0.05) mean ryegrass root dry matter production compared to all
other treatments. The increase in ryegrass root dry mass in treatments that received between
30 and 120 kg N ha-1 illustrated the importance of sufficient, but not an oversupply of N to the
perennial ryegrass plant. In contrast to ryegrass, the highest clover root dry mass was recorded
at the 180 kg N ha-1 rate, significantly higher than at 0, 30 and 60 kg N ha-1. No differences in
clover root dry mass were recorded between the 0, 30, 60 and 120 kg N ha-1 rates.

73
Table 3.12 Root dry mass (g pot-1) of perennial ryegrass as influenced by soil water potential
(kPa) and rate of fertiliser N application (kg ha-1) under controlled conditions at Elsenburg
Fertiliser N rate (kg ha-1) Water potential 0 30 60 120 180 Mean (M)
-10 kPa 3.3125 3.465 3.7925 3.8325 3.2875 3.538 b* -20 kPa 3.8033 4.6625 4.0725 3.6975 2.94 3.8368 b -25 kPa 4.23 3.8825 4.395 3.6275 3.5425 3.92 b -35 kPa 4.2133 5.4275 5.0433 5.17 3.675 4.7144 a
Mean (N) 3.8454 ab 4.3594 a 4.278 a 4.0819 a 3.3613 b LSD(0.05) Interaction=NS LSD(0.05) N mean=0.6121 LSD(0.05) M mean=0.546 CV = 21.06 * Means in the same column or row followed by the same letter are not significantly different (P=0.05)
Table 3.13 Root dry mass (g pot-1) of white clover as influenced by soil water potential (kPa)
and rate of fertiliser N application (kg ha-1) under controlled conditions at Elsenburg
Fertiliser N rate (kg ha-1) Water potential 0 30 60 120 180 Mean (M)
-10 kPa 0.725 0.893 0.833 0.985 1.175 0.922 c* -20 kPa 1.023 1.313 1.000 1.108 1.820 1.235 ab -25 kPa 0.838 1.030 0.923 1.300 1.488 1.106 bc -35 kPa 1.443 1.313 1.550 1.520 1.565 1.478 a
Mean (N) 1.007 b 1.137 b 1.081 b 1.223 ab 1.491 a LSD(0.05) Interaction= NS LSD(0.05) N mean=0.2964 LSD(0.05) M mean=0.2652 CV = 24.64 * Means in the same column or row followed by the same letter are not significantly different (P=0.05)
The highest (P=0.05) ryegrass root mass was found at the -35 kPa water potential. Although
not significant lower than at -20 and -25 kPa, the lowest ryegrass root dry mass was recorded
at the -10 kPa water potential indicating a possible reduction in root activity as a result of the

74
high soil water content. However the higher ryegrass root mass could not increase dry matter
production as TDM production at -35 kPa was significantly lower than at -10 and -20 kPa
(Table 3.6). The relative low soil water level at -35 kPa resulted in significantly (P=0.05)
higher ryegrass root dry mass compared to -10 kPa. In both perennial ryegrass and white
clover pastures a soil water potential of -35 kPa will therefore result in the highest root dry
mass production. Dry matter production (Tables 3.6 & 3.7) however showed that this benefit
may not necessarily be reflected in higher foliage DM production. The benefit of increased
root dry mass may however be of great benefit under less favourable soil conditions.
Conclusions
The study has shown that significant increases in PDM production of perennial ryegrass can
be achieved with fertiliser N applications of up to 120 kg N ha-1 under high (-10 and -20 kPa)
soil water levels. Perennial ryegrass could not maintain the significantly higher dry matter
production at the 180 kg N ha-1 rates causing carry over N resulting in increased RDM yields.
This carry-over N may be exposed to leaching under field conditions causing a possible
reduction of N recovery rate and increasing the risk of contamination of natural resources.
The N-uptake at the -25 and -35 kPa water levels were probably restricted by N supply as
RDM yields were significantly reduced at these soil water levels. Lower mean ryegrass leaf N
contents measured at 60 days support this conclusion. Clover PDM and TDM production
were not influenced by fertiliser N rate and soil water levels covered in this study.
Although the highest root dry mass for both ryegrass and clover were recorded at soil water
potentials of -35 kPa, it did not result in increased dry matter production. The application of
180 kg N ha-1 reduced, although not significant, ryegrass root dry mass illustrating the
disadvantage of too high fertiliser N rates. The highest clover root dry mass was however
recorded at the 180 kg N ha-1 application rate.
The highest ryegrass leaf N contents after the first regrowth cycle measured at the -10 kPa soil
water potential suggested that the absorption of soil N were not restricted by the high soil
water levels. However lower ryegrass leaf N content recorded with decreasing soil water
levels furthermore illustrated the negative effect of reduced soil water content on N uptake.
75
The study has shown firstly, that the application of fertiliser N to stimulate ryegrass
productivity under relative wet conditions without negatively affecting a companion clover
crop in a mixed pasture could be successful. Secondly, that the positive effect of the high
fertiliser N rate on ryegrass TDM was improved as soil water level increased, however TDM
yields at low fertiliser N rates were not increased with increased soil water levels.
References
ANON., 1996. Verslag van die grondkundige opname van die plaas Elsenburg. Resource
Utilization, Department of Agriculture, Western-Cape.
ANON., 2004. Databank, Dept of Agrometry, ARC Institute for Soil, Climate and Water. Stellenbosch.
AOAC., 1970. Official methods of analysis. (11th ed.). Association of Official Analytical
Chemists. Washington DC, USA.
BENNIE, A.T.P., COETZEE, M.J., VAN ANTWERPEN, R., VAN RENSBURG, L.D. &
BURGER R du T., 1988. ‘n Waterbalansmodel vir besproeiing gebaseer op
profielwatervoorsieningstempo- en gewaswaterbehoeftes. WNK verslag nr 144/1/88.
Pretoria.
BESSINGER, F., 1985. Methods of Plant Analysis by Autoanalyzer Techniques. Information
Bulletin No D-3. Soil and Irrigation Research Institute, Private Bag X79, Pretoria.
0001.
BEYERS, C.P. de L., 1983. Bemesting van aangeplante weidings. Winterreën, Spesiale
uitgawe no. 5, 54-59.
DANCKWERTS, J.E., 1988. Growth and desiccation of Themeda triandra and Sporobolus
fimbriatus in relation to diminishing moisture availability. Journal of the Grassland
Society of Southern Africa 5, 96-101.
ECKARD, R.J., 1994. The nitrogen economy of three irrigated temperate grass pastures with
and without clover in Natal. Ph.D thesis, University of Natal.

76
FOTH, H.D., 1978. Fundamentals of Soil Science. 6th ed. John Wiley & Sons. New York.
MILES, N., 1997. Responses of productive and unproductive kikuyu pastures to top-dressed
nitrogen and phosphorus fertiliser. African Journal of Range and Forage Science 14
(1), 1-6.
MILES, N. & MANSON, A.D., 2000. Nutrition of planted pastures. In N. Tainton (ed.).
Pasture Management in South Africa. University of Natal Press, Pietermaritzburg.
OPPERMAN, D.P.J. & HUMAN J.J., 1976. Die invloed van ontblaring en vogstremming op
die groeikragtigheid van Themeda triandra Forsk. onder gekontroleerde toestande.
Proceedings of the Grassland Society of South Africa 12. 65-71.
OTT, R.L., 1998. An Introduction to statistical methods and data analysis. Belmont,
California: Duxbury Press.
PENMAN, H.L., 1962. Woburn irrigation, 1951-59. Results for grass. Journal of
Agricultural Science 58, 349.
REUTER, D.J. & ROBINSON, J.B., 1997. Plant Analysis an Interpretation Manual. 2nd ed.
CSIRO Publishing Australia.
RUSSELL, E.W., 1988. Russell’s Soil Conditions and Plant Growth. 11th edition. A. Wild
(ed.). Longman: London, New York.
RYDEN, J.C., 1984. The flow of nitrogen in grassland. Proceedings of the Fertiliser Society
No. 229, 1-44.
SAS., 1999. SAS/STAT User's Guide, Version 8, 1st printing, Volume 2. SAS Institute Inc,
SAS Campus Drive, Cary, North Carolina 27513.
SHAPIRO, S.S. & WILK, M.B., 1965. An Analysis of Variance Test for Normality,
Biometrika 52, 591-611.
77
SNEDECOR, G.W. & COCHRAN, W.G., 1967. Statistical Methods. 6th ed. The Iowa State
University Press, Ames, Iowa, U.S.A.
SOIL CLASSIFICATION WORKING GROUP., 1991. Soil Classification: A taxonomic
system for South Africa. Memoirs on the Agricultural Natural Resources of South
Africa Nr. 15. Department of Agricultural Development. Pretoria, South Africa.
STOUT, W.l., WEAVER, R.S. & ELWINGER, G.F., 2001. Effects of Early Season Nitrogen
on Grass-Clover Swards in the Northern USA. Agronomy Journal 93, 1000-05.
TINKER, P.B.H., 1979. Uptake and consumption of soil nitrogen in relation to agronomic
practice. In E.J. Hewitt and C.V. Cutting (eds.). Nitrogen assimilation of plants.
Academic Press. London, New York, San Francisco.
VAN HEERDEN, J.M. & DURAND, W., 1994. Influence of nitrogen fertilisation on forage
and animal production of a continuously grazed irrigated grass/clover pasture in the
Rûens area of the southern Cape. African Journal of Range and Forage Science 11
(3), 69-75.
WESTFALL, D.G., HENSON, M. A. & EVANS, E. P., (1978). The effect of soil sample
handling between collection and drying on nitrate concentration. Soil Science and
plant analysis 9 (2), 169-185.

78
Chapter 4
The influence of production season and fertiliser N rate on the growth and
production of perennial ryegrass (Lolium perenne) and white clover
(Trifolium repens) grown under controlled conditions
Abstract
The responses of perennial ryegrass and white clover grown in separate pots in a glasshouse at
12/18 °C night/day temperatures during production seasons in June/July (304.4 h
photoperiod) and October/November (384.8 h photoperiod) to five fertiliser N rates (0, 30, 60,
120 and 180 kg N ha-1) were investigated. Primary- (PDM) and residual dry matter production
(RDM) were recorded 31 and 60 days after fertiliser N application. The number of ryegrass
tillers or clover stolons and root dry mass were recorded 60 days after fertiliser N application.
Perennial ryegrass PDM, RDM and TDM yields were influenced by fertiliser N rate,
production season as well as the fertiliser N rate and production season interaction. Increased
fertiliser N rate resulted in increased (P=0.05) ryegrass dry matter production, the only
exception a non-significant RDM production increase between 30 and 60 kg N ha-1. PDM,
RDM and TDM production of perennial ryegrass were higher (P=0.05) in October/November
compared to June/July. White clover was influenced by production season only, resulting in
increased (P=0.05) dry matter yields during October/November for PDM, RDM and TDM
production compared to June/July. The number of ryegrass tillers increased (P=0.05) as
fertiliser N rate was increased, with a non-significant increase measured between 30 and 60
kg N ha-1. The October/November production season resulted in significantly more clover
stolons than during June/July. Mean perennial ryegrass root dry mass at 180 kg N ha-1 was
higher (P=0.05) than at 0 kg N ha-1, the same reaction was observed during
October/November. No differences in root dry mass as a result of fertiliser N rate were
recorded during June/July. Both ryegrass and clover produced higher (P=0.05) root dry
masses during October/November.
The study has shown that significant increases in dry matter production of perennial ryegrass
and white clover can be expected if a 31 day regrowth period in June/July is compared to a 31

79
day regrowth period in October/November. The study also showed that the lack of sufficient
accumulation of “sunlight hours” in June/July resulted in no differences in ryegrass dry matter
production as fertiliser N was increased from 30 to 60 kg N ha-1 a response not observed
during October/November.
Keywords: dry matter production, fertiliser N rate, perennial ryegrass, production season, root dry
mass, stolons, tillers, white clover
Introduction
The opportunity to boost perennial ryegrass-white clover productivity in addressing the winter
gap is restricted to autumn, winter and spring occurring between April and September. Daily
photoperiod (daylength) during these seasons varies from 11.6 (April 1st) to a minimum of 9.8
(June 7th – July 4th) and 12.3 hours day-1 on September 30th (Anon, 2004).
Productivity, as a function of photosynthesis, of pastures grown under high potential
conditions is normally limited by incoming solar energy, while transpiration is controlled by
nett radiation (Russell, 1988). Most of the nett radiation is dissipated as transpiration under
these conditions. Since netto radiation is closely correlated with incoming radiation, Russell
(1988) suggested that rates of photosynthesis and transpiration would be closely related. It
could therefore be assumed that the length of exposure to incoming solar energy would
influence pasture productivity.
It can be expected that cloud cover during the rainy season will have similar effects on clover
and ryegrass, because both are C3 plants where photosynthesis reaches saturation point at
about 66% of full sunlight (Ludlow, 1978). The frequency and duration of cloud cover will
therefore be less critical to clover and ryegrass productivity.
In a review article Ludlow (1978) stated that short days stimulate tiller development and
increase root:shoot ratio in some grasses while long days may increase leaf length and area in
some temperate grasses effectively increasing the height and competitiveness of the grass.
Short days may also promote a more prostrate and long days more erect growth pattern in
some legumes. Nodulation and nitrogen fixation are also usually better under short than
longer days. The advantage of N fixation under short day conditions can however not be taken

80
advantage of as conditions in the Western Cape Province during the cool season (short days)
normally coincides with low temperatures restricting Rhizobia activity.
The aim of this study was to evaluate the influence of production season on perennial ryegrass
and white clover grown under controlled conditions. The information gathered will give us a
better understanding of the response of ryegrass and clover to fertiliser N application during
different seasons in the absence of temperature differences between seasons.
Materials and methods
Locality
Perennial ryegrass (Lolium perenne cv. Ellet) and white clover (Trifolium repens cv. Haifa)
were established separately in pots in a glasshouse under natural photoperiod and light
intensity conditions at the Institute for Plant Production, Elsenburg (altitude 177m, 18o50’E,
33o51’S). Day/night temperatures were regulated at 18° and 12 °C for 10 and 14 hours
respectively. It was however difficult to maintain temperatures of 18 °C during November
with day temperatures reaching 24 °C on numerous occasions.
Growth medium preparation
Topsoil (0-150 mm layer) from the orthic A horizon of an Oakleaf soil (Soil Classification
Working Group, 1991) derived mainly from granite (Anon, 1996) was used as growth
medium. To achieve a relative uniform bulk density over all pots the soil was gathered in
heaps, mixed and ran through a 5 mm screen to separate the larger clods (aggregates) and crop
residues from the soil used as growth medium. The soil was dried in stainless steel bins at 60
°C. Soil used in the October/November study was placed in bags and stored. A composite soil
sample was collected and analysed for both physical- and chemical properties (Table 4.1).
Analysis methods for measuring the physical and chemical properties of the soil are referred
to in Chapter 2.

81
Table 4.1 Chemical analysis and selected physical properties of the soil used as growth
medium at Elsenburg
Chemical properties Physical properties
pH (KCl) 6.4 Resistance Ohms 1360 Clay % 14 P (citric acid) mg/kg 34 Silt % 13.1 K cmol(+)/kg 0.37 Fine Sand % 49.8 Ca cmol(+)/kg 2.61 Medium Sand % 15.9 Mg cmol(+)/kg 1.16 Course Sand % 7.2 Na cmol(+)/kg 0.15 Total cations cmol(+)/kg 4.29 Classification SaLm Copper mg/kg 0.77 Zinc mg/kg 0.79 Manganese mg/kg 107 Boron mg/kg 0.55 Carbon % 0.58
Soil fertility levels were corrected through the application of single superphosphate to levels
recommended by Beyers (1983). Copper, manganese and zinc were sufficient with boron
marginally low. Foliar nutrition (N, P, K, Ca, Mg, S, B, Fe, Zn and Mo) were applied twice
during the pre-treatment growth period and five days after each cut, a total of four times, to
prevent any deficiencies. The organic C content of 0.58 % was low. An equivalent of 40 kg N
ha-1 was applied at seeding to maintain plant growth during the pre-treatment growth period.
To prevent N leaching, pots were lined with plastic bags and filled with 6.6 kg of the oven
dried soil occupying a volume of 4324.57 cm3 resulting in a bulk density of 1.53 g cm-3. Pots
were watered and left for ten days to enable weed seed to germinate. After removing the
weeds a template with five holes, one in the centre and one in each quarter of the pot, was
used to plant the seed in a predetermined configuration 5-10 mm deep. A few seeds were
planted per hole followed by water application to fill the soil to field water capacity (0.253
mm3 mm-3). Seedlings were thinned after emergence to five plants per pot. Pots were watered
daily through weighing and adding water to the predetermined weight at field water capacity.
Changes in plant weight as a result of growth were considered on a weekly basis when pot
weight after watering was calculated. Pots were randomised after watering.

82
Plants were allowed to grow for an accumulative photoperiod of ca 691 hours from planting
and clipped at 50 mm height. The clippings were dried at 60 °C for ca 18 h upon which pots
showing least variation in DM production were at random allocated to the treatment
combinations.
Experimental design and treatments
A completely randomised experimental design was used. A factorial design was used to
determine the effect of photoperiod (June/July and October/November) and fertiliser N rate
(0, 30, 60,120 and 180 kg N ha-1 applied as LAN dissolved in 200 ml water) on ryegras and
clover performance (Snedecor & Cochran, 1967). Fertiliser N rate was replicated four times.
Data collection
DM production was recorded by cutting the perennial ryegrass and white clover at 50 mm
height 31 and 60 days after nitrogen treatments had been applied. Fresh weight was recorded,
cuttings ovendried at 60 °C for 72 hours and dry weight noted. Dry matter production was
recorded as primary - (PDM) at 31 days, residual – (RDM) production from 31 to 60 days and
total dry matter production (TDM, which is the cumulative DM production over 60 days).
The number of tillers and stolon growing points were recorded at 60 days after fertiliser N
application. After residual dry matter production was recorded, roots were removed by wet
sieving using a 2 and 1 mm combination sieve, dried at 60 °C for 72 h and dry mass recorded.
Statistical procedures
Analysis of variance (ANOVA) was performed using SAS version 8.2 (SAS, 1999). The
Shapiro-Wilk test was used to test for non-normality (Shapiro & Wilk, 1965). Student's t-
Least Significant Difference (LSD) test was calculated at the 5% confidence level to compare
treatment means (Ott, 1998).

83
Results and discussion
Number of ryegrass tillers/clover stolons
The number of ryegrass tillers pot-1 was significantly influenced by fertiliser N rate and
production season. Tiller numbers in June/July were 12.7 % (21.0 tillers pot-1) higher than in
October/November (Table 4.2).
Table 4.2 The influence of fertiliser N rate (kg ha-1) and production season on the number of
perennial ryegrass tillers 60 days after fertiliser N application grown under controlled
conditions at Elsenburg
Fertiliser N rate (kg N ha-1) Production season 0 30 60 120 180 Mean (P) June/July 134.3 173.8 174.3 199.5 249.8 186.3 a* October/November 88.3 145.0 147.50 203.8 242.0 165.3 b Mean (N) 111.3 d* 159.4 c 160.9 c 201.6 b 245.9 a LSD (0.05) NxP = NS LSD (0.05) N = 22.665 LSD (0.05) P = 14.319 CV = 12.27 * Means in the same column or row followed by the same letter are not significantly different (P=0.05)
Tiller number per plant increased with an increase in fertiliser N application rate between 0
and 180 kg N ha-1, but no significant differences were found between 30 and 60 kg N ha-1.
Only production season influenced clover stolon growing points with October/November
resulting in the highest (P=0.05) number of stolons pot-1 (Table 4.3).
The assumption can be made that perennial ryegrass tiller development was stimulated by
reduced exposure to photoperiod in winter whilest white clover stolon growingpoint initiation
increases as photoperiod increased in summer.

84
Table 4.3 The influence of fertiliser N rate (kg ha-1) and production season on the number of
white clover stolon growing points 60 days after fertiliser N application grown under
controlled conditions at Elsenburg
Fertiliser N rate (kg N ha-1) Production season 0 30 60 120 180 Mean (P) June/July 24.8 24.0 25.3 22.8 27.7 24.7 b* October/November 76.5 77.3 80.0 76.0 76.8 77.3 a Mean (N) 50.6 50.6 56.6 49.4 55.7 LSD (0.05) NxP = NS LSD (0.05) N = NS LSD (0.05) P = 5.6936 CV = 16.33 * Means in the same column followed by the same letter are not significantly different (P=0.05)
Dry matter production
Perennial ryegrass primary-, residual- and total dry matter production were significantly
influenced by fertiliser N rate, production season as well as a fertiliser N rate x production
season interaction (Table 4.4). White clover dry matter production was only influenced by
production season (Table 4.5).
Primary Dry Matter Production
Mean ryegrass PDM production in October/November was 4.566 g pot-1 (116.15 %) higher
than in June/July (Table 4.4). The longer exposure to sunlight within the 31 day regrowth
cycle in October/November (384.8 hours versus 304.4 h in June/July), the possible reason for
this higher mean PDM yields. Increased fertiliser N rate resulted in significant increases in
mean ryegrass PDM production. Significant (P=0.05) increases in ryegrass PDM production
as fertiliser N rate increased from 0 to 180 kg N ha-1 were measured in October/November.
However no differences in ryegrass PDM production between 30 and 60 kg N ha-1 as well as
120 and 180 kg N ha-1 in June/July were noted. The significantly higher PDM production in
October/November showed that increased exposure to light (photoperiod) could increase
ryegrass productivity by a factor as high as 2.6 times of that achieved in June/July with the
application of 180 kg N ha-1. Even at the 0 kg N ha-1 rates the October/November treatments
resulted in an increase of 1.966 g pot-1 (98.65%) in PDM yields compared to June/July.
Increases of this magnitudes in ryegrass production under field conditions are unlikely as

85
temperatures in the glasshouse were within the range of 12 to 18 °C (occasionally 24 °C)
while temperatures under field conditions might be too high for perennial ryegrass to maintain
this high productivity.
Table 4.4 The influence of fertiliser N rate (kg ha-1) and production season on primary,
residual and total dry matter production (g pot-1) of perennial ryegrass grown under controlled
conditions at Elsenburg
Primary dry matter production (g pot-1)
Fertiliser N rate (kg N ha-1) Production season 0 30 60 120 180 Mean (P) June/July 1.993 h** 3.399 g 3.725 g 4.713 ef 5.343 de 3.931 b* October/November 3.959 fg 6.150 d 7.425 c 11.090 b 13.860 a 8.497 a Mean (N) 3.116 e* 4.774 d 5.575 c 7.901 b 9.601 a LSD (0.05) NxP = 0.8776 LSD (0.05) N = 0.6191 LSD (0.05) P = 0.3911 CV = 9.52
Residual dry matter production (g pot-1) Fertiliser N rate (kg N ha-1) Production season 0 30 60 120 180 June/July 0.537 f 1.190 ef 1.360 e 3.770 bc 6.073 a 2.694 b October/November 1.798 e 2.865 d 3.210 cd 4.390 b 5.855 a 3.624 a Mean (N) 1.257 d 2.028 c 2.285 c 4.080 b 5.964 a LSD (0.05) NxP = 0.7984 LSD (0.05) N = 0.5632 LSD (0.05) P = 0.3558 CV = 17.13
Total dry matter production (g pot-1) Fertiliser N rate (kg N ha-1) Production season 0 30 60 120 180 June/July 2.530 g 4.588 f 5.085 ef 8.483 d 11.415 c 6.625 b October/November 5.755 e 9.015 d 10.635 c 15.480 b 19.715 a 12.120 a Mean (N) 4.373 e 6.801 d 7.860 c 11.981 b 15.565 a LSD (0.05) NxP = 1.024 LSD (0.05) N = 0.7224 LSD (0.05) P = 0.4564 CV = 7.38 * Means in the same column or row at a specified mean dry matter production followed by the same letter are not significantly different (P=0.05) ** Interaction means followed by the same letter at a specified DM production are not significantly different (P=0.05)

86
White clover PDM production (Table 4.5) was only influenced by production season,
resulting in significant higher (377.35%) PDM yields in October/November for the same
reason as given for ryegrass namely increased exposure to sunlight.
Table 4.5 The influence of fertiliser N rate (kg ha-1) and production season on primary, residual and total dry matter production (g pot-1) of white clover grown under controlled conditions at Elsenburg
Primary dry matter production (g pot-1) Fertiliser N rate (kg N ha-1) Production season 0 30 60 120 180 Mean (P) June/July 2.055 2.255 2.153 2.148 2.750 2.252 b* October/November 9.833 10.273 10.788 11.453 11.403 10.750 a Mean N 5.944 6.264 7.087 6.800 7.694 LSD (0.05) NxP = NS LSD (0.05) N = NS LSD (0.05) P = 0.5003 CV = 11.17
Residual dry matter production (g pot-1) Fertiliser N rate (kg N ha-1) Production season 0 30 60 120 180 June/July 4.735 4.465 5.273 5.165 6.163 5.098 b October/November 10.455 9.993 10.605 10.655 10.038 10.349 a Mean N 7.595 7.229 8.320 7.910 8.377 LSD (0.05) NxP = NS LSD (0.05) N = NS LSD (0.05) P = 0.7764 CV = 14.84
Total dry matter production (g pot-1) Fertiliser N rate (kg N ha-1) Production season 0 30 60 120 180 June/July 6.790 6.720 7.427 7.313 8.913 7.351 b October/November 20.288 20.265 21.393 22.108 21.440 21.099 a Mean N 13.539 13.493 15.407 14.710 16.071 LSD (0.05) NxP = NS LSD (0.05) N = NS LSD (0.05) P = 1.1152 CV = 11.49 * Means in the same column or row at a specified mean dry matter production followed by the same letter are not significantly different (P=0.05)

87
Residual Dry Matter Production
Mean ryegrass RDM production increased by 0.93 g pot-1 (34.52%) in October/November
compared to June/July, a difference much less than measured during the PDM production
cycle (Table 4.4). Increased fertiliser N rates resulted in significant (except between 30 and 60
kg N ha-1) increases in ryegrass RDM production. Applications of 120 and 180 kg N ha-1 did
not result in differences in RDM production if applied either in June/July or
October/November however at the 0, 30 and 60 kg N ha-1 rates ryegrass RDM production
during October/November were higher (P=0.05) than in June/July. The higher PDM
production at the 120 (+6.377g) and 180 kg N ha-1 (+8.517 g) rates in October/November
compared to June/July could result in more N absorbed from the soil, resulting in less N
carried over to the second regrowth cycle. RDM yields at the 120 and 180 kg N ha-1 rates
were therefore probably restricted by a shortage of soil N supply before the end of the second
regrowth cycle. The advantage of the longer photoperiod in October/November during the
second regrowth cycle could therefore probably not be utilized at the 120 and 180 kg N ha-1
rates possibly as a result of a N deficiency towards the end of the RDM production cycle.
White clover RDM production increased by 5.251 g pot-1 (102.99%) in October/November
significantly higher than in June/July (Table 4.5). White clover RDM yield was not influence
by fertiliser N rate.
Total Dry Matter Production
Ryegrass TDM production in June/July were on average 5.495 g pot-1 (82.95%) lower than in
October/November (Table 4.4). Increased fertiliser N rates from 0 – 180 kg N ha-1 resulted in
increased (P=0.05) TDM production in October/November. No differences in TDM
production were recorded between 30 and 60 kg N ha-1 in June/July, however increasing
fertiliser N rate to 120 and 180 kg N ha-1 resulted in significant TDM yield increases.
White clover TDM production in October/November was 187.0 % higher than in June/July.
Fertiliser N rate did not influence white clover TDM production.
The increase in dry matter production as a result of spring applications of fertiliser N
compared to winter applications should take total exposure (hours) to sunlight into
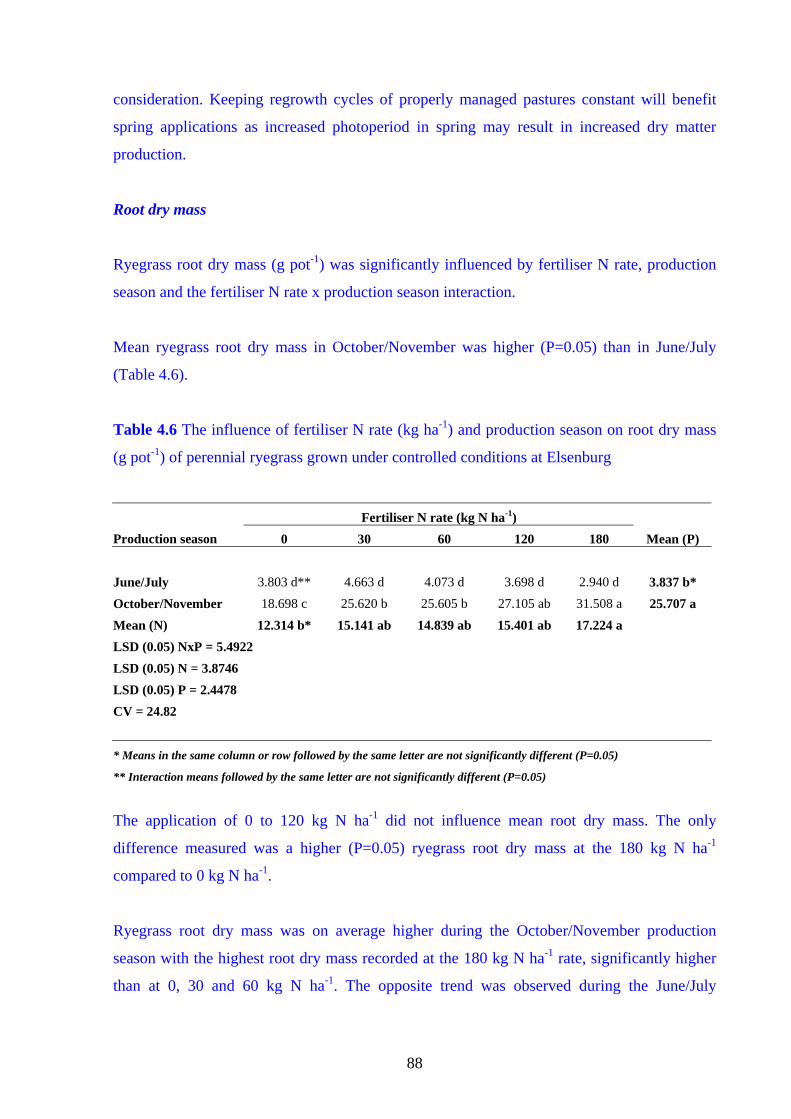
88
consideration. Keeping regrowth cycles of properly managed pastures constant will benefit
spring applications as increased photoperiod in spring may result in increased dry matter
production.
Root dry mass
Ryegrass root dry mass (g pot-1) was significantly influenced by fertiliser N rate, production
season and the fertiliser N rate x production season interaction.
Mean ryegrass root dry mass in October/November was higher (P=0.05) than in June/July
(Table 4.6).
Table 4.6 The influence of fertiliser N rate (kg ha-1) and production season on root dry mass
(g pot-1) of perennial ryegrass grown under controlled conditions at Elsenburg
Fertiliser N rate (kg N ha-1) Production season 0 30 60 120 180 Mean (P) June/July 3.803 d** 4.663 d 4.073 d 3.698 d 2.940 d 3.837 b* October/November 18.698 c 25.620 b 25.605 b 27.105 ab 31.508 a 25.707 a Mean (N) 12.314 b* 15.141 ab 14.839 ab 15.401 ab 17.224 a LSD (0.05) NxP = 5.4922 LSD (0.05) N = 3.8746 LSD (0.05) P = 2.4478 CV = 24.82
* Means in the same column or row followed by the same letter are not significantly different (P=0.05)
** Interaction means followed by the same letter are not significantly different (P=0.05)
The application of 0 to 120 kg N ha-1 did not influence mean root dry mass. The only
difference measured was a higher (P=0.05) ryegrass root dry mass at the 180 kg N ha-1
compared to 0 kg N ha-1.
Ryegrass root dry mass was on average higher during the October/November production
season with the highest root dry mass recorded at the 180 kg N ha-1 rate, significantly higher
than at 0, 30 and 60 kg N ha-1. The opposite trend was observed during the June/July

89
production season with 180 kg N ha-1 resulting in the lowest (P>0.05) root dry mass although
no significant differences between treatments were recorded in June/July.
Only production season significantly (P=0.05) influenced white clover root dry mass (Table
4.7).
Table 4.7 The influence of fertiliser N rate (kg ha-1) and production season (hours) on root
dry mass (g pot-1) of white clover grown under controlled conditions at Elsenburg
Fertiliser N rate (kg N ha-1) Production season 0 30 60 120 180 Mean (P) June/July 1.023 1.313 1.000 1.108 1.820 1.235 b* October/November 7.130 6.350 7.747 8.025 6.275 7.101 a Mean (N) 4.076 3.471 4.373 3.413 3.602 LSD (0.05) NxP = NS LSD (0.05) N = NS LSD (0.05) P = 0.7597 CV = 27.04 * Means in the same column followed by the same letter are not significantly different (P=0.05)
Mean clover root dry mass was 5.866 g pot-1 lower during June/July compared to
October/November. Nitrogen fertiliser application rate did not influenced clover root dry
mass.
Conclusion
This study has shown that increased fertiliser N application rates increase perennial ryegrass
dry matter production and tiller production. Increased photoperiod as the season progresses
from autumn to spring will contribute to increased dry matter production of both ryegrass and
clover especially if fixed cutting or grazing cycles are practised.
As soon as soil N content drops to levels where the nitrogen absorption rate is slowed down
as a result of low nitrogen concentration in the soil solution, production season becomes more
crucial. Reduced photoperiod (June/July production season) and low soil N content will
90
therefore result in less time for N uptake to maintain a high growth rate and thereby reduce
dry matter production.
The significant lower RDM yields in June/July at the lower N application rates clearly
showed that, at low soil N levels, the effect of production season dominates. Production
seasons during short photoperiods in combination with low soil N would therefore accelerate
the reduction in RDM yields.
References
ANON., 1996. Verslag van die grondkundige opname van die plaas Elsenburg. Resource
Utilization, Department of Agriculture: Western-Cape.
ANON., 2004. Databank, Dept of Agrometry, ARC Institute for Soil, Climate and Water.
Stellenbosch.
BEYERS, C.P. de L., 1983. Bemesting van aangeplante weidings. Winterreën, Spesiale
uitgawe no. 5, 54-59.
LUDLOW, M.M., 1978. Light relations of pastures plants. In J.R. Wilson (ed.) Plant relations
in pastures. CSIRO, Melbourne.
OTT, R.L., 1998. An Introduction to statistical methods and data analysis. Belmont,
California: Duxbury Press.
RUSSELL, E.W., 1988. Russell’s Soil Conditions and Plant Growth. 11th edition. A. Wild
(ed.). Longman: London, New York.
SAS., 1999. SAS/STAT User's Guide, Version 8, 1st printing, Volume 2. SAS Institute Inc,
SAS Campus Drive, Cary, North Carolina 27513.
SHAPIRO, S.S. & WILK, M.B., 1965. An Analysis of Variance Test for Normality,
Biometrika. 52, 591-611.

91
SNEDECOR, G.W. & COCHRAN, W.G., 1967. Statistical Methods. Sixth Ed. The Iowa
State University Press, Ames, Iowa, U.S.A.
SOIL CLASSIFICATION WORKING GROUP., 1991. Soil Classification: A taxonomic
system for South Africa. Memoirs on the Agricultural Natural Resources of South
Africa Nr. 15. Department of Agricultural Development. Pretoria. South Africa.

92
SECTION 2
Field study
A field study was started with the establishment of a perennial ryegrass (Lolium perenne cv.
Ellet)-white clover (Trifolium repens cv. Haifa) pasture during autumn 1999 at Elsenburg near
Stellenbosch, South Africa. The study was designed to investigate the response of a perennial
ryegrass-white clover pasture to a single strategic application of fertiliser N during the cool
season. The aim was to develop an understanding of the response of a perennial ryegrass-
white clover pasture to different fertiliser N rates during the cool season from autumn to late
spring. Information gathered from such a study will enable scientists to develop an efficient
strategic fertiliser N programme and thereby successfully reduce the impact of the feed gap
(winter gap) on fodder flow management and thereby minimising potential N losses and
contamination of natural resources.
The pasture was allowed to establish and grazing with sheep started in late spring 1999. The
first fertiliser N treatments were applied during autumn 2000 and data recording commenced
simultaneously.
The general materials and methods used are described in chapter 5 while detailed methods
related to specific data sets as well as results obtained from the field study will be presented in
chapters 6 to 9.

93
Chapter 5
Materials and methods Location and site preparation
A perennial ryegrass (Lolium perenne cv. Ellet)-white clover (Trifolium repens cv. Haifa)
pasture was established in May 1999 at the Institute for Plant Production (altitude 177m,
18o50’E, 33o51’S). The soil at the experimental site derived mainly from granite (Anon, 1996)
and can be described as a sandy loam Oakleaf consisting of an Ortic A over a Neocutanic B
horizon (Soil Classification Working Group, 1991). Selected chemical (0-200 mm) and
physical (0-500 mm) properties of the soil are presented in Table 5.1. Analysis methods for
measuring the physical and chemical properties of the soil are referred to in Chapter 2.
Table 5.1 Chemical and physical characterstics of the soil at the experimental site at
Elsenburg
Chemical properties Property Unit Start Feb-00 Jan-01 Jan-02 Jan-03
pH (KCl) 6.1 6.2 6.3 6 6.4 Resistance Ohms 853 850 2340 1250 630 Phosphorus mg/kg 60 50 63 46 65 Potassium cmol(+)/kg 0.23 0.30 0.21 0.17 0.36 Calcium cmol(+)/kg 3.16 2.77 2.24 2.55 3.99 Magnesium cmol(+)/kg 1.14 1.16 0.96 1 1.44 Sodium cmol(+)/kg 0.24 0.42 0.21 0.28 0.41 Total cations cmol(+)/kg 4.77 4.65 3.62 4.00 6.20 Copper mg/kg 0.68 0.87 0.84 1.24 0.94 Zinc mg/kg 0.74 1.3 0.83 1.6 2.14 Manganese mg/kg 68.87 67.12 96.7 189.2 117.4 Sulphur mg/kg 10.39 9.92 Not available 14.02 11.23 Boron mg/kg 0.53 0.49 Not available 0.62 0.69 Carbon % 0.86 0.81 Not available Not available 1.07
Soil particle size distribution 0-100 mm 100-200 mm 200-300 mm 300-400 mm 400-500 mm Sand (%) Course 10.3 12.0 10.2 8.2 8.0 Medium 19.8 20.2 18.4 15.7 15.5 Fine 45.1 39.4 35.8 39.4 45.1 Silt (%) 14.8 11.2 13.0 13.6 13.2 Clay (%) 10.0 17.2 22.8 31.2 30.8
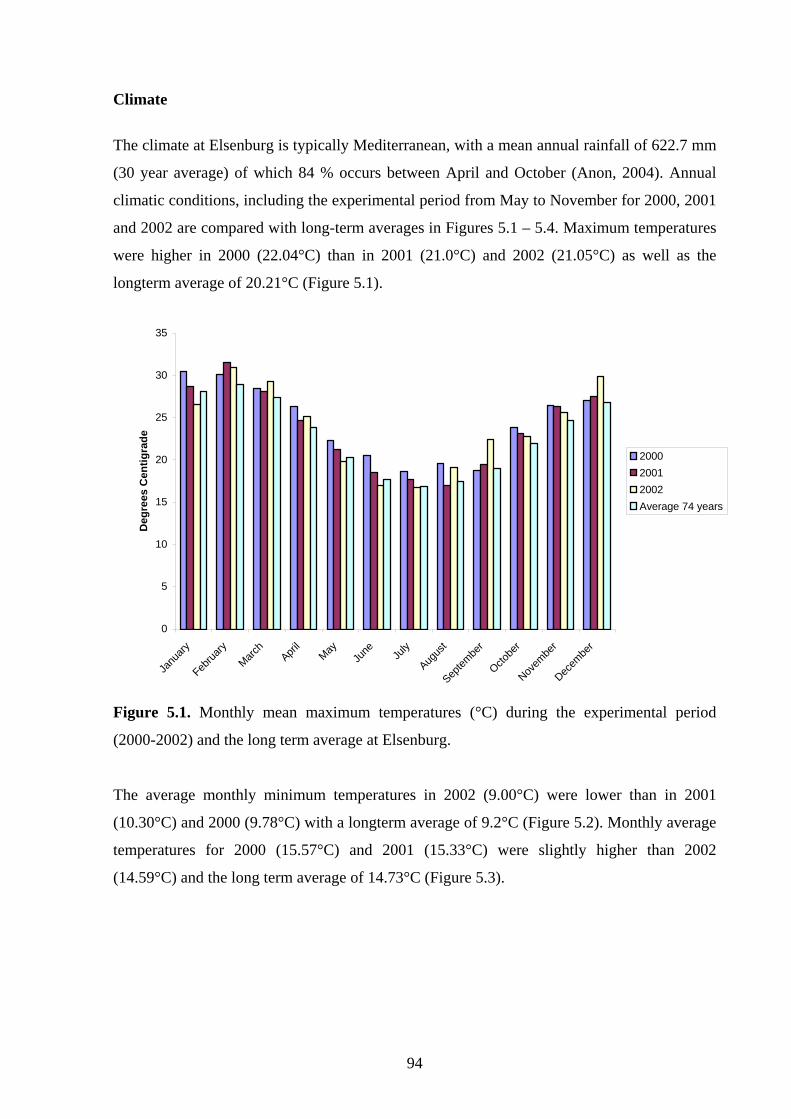
94
Climate
The climate at Elsenburg is typically Mediterranean, with a mean annual rainfall of 622.7 mm
(30 year average) of which 84 % occurs between April and October (Anon, 2004). Annual
climatic conditions, including the experimental period from May to November for 2000, 2001
and 2002 are compared with long-term averages in Figures 5.1 – 5.4. Maximum temperatures
were higher in 2000 (22.04°C) than in 2001 (21.0°C) and 2002 (21.05°C) as well as the
longterm average of 20.21°C (Figure 5.1).
Figure 5.1. Monthly mean maximum temperatures (°C) during the experimental period
(2000-2002) and the long term average at Elsenburg.
The average monthly minimum temperatures in 2002 (9.00°C) were lower than in 2001
(10.30°C) and 2000 (9.78°C) with a longterm average of 9.2°C (Figure 5.2). Monthly average
temperatures for 2000 (15.57°C) and 2001 (15.33°C) were slightly higher than 2002
(14.59°C) and the long term average of 14.73°C (Figure 5.3).
0
5
10
15
20
25
30
35
Janu
ary
Februa
ryMarc
hApri
lMay
June Ju
ly
Augus
t
Septem
ber
Octobe
r
Novem
ber
Decem
ber
Deg
rees
Cen
tigra
de
200020012002Average 74 years

95
Figure 5.2. Monthly mean minimum temperatures (°C) during the experimental period (2000-
2002) and the long term average at Elsenburg.
Figure 5.3. Average mean daily temperatures (°C) during the experimental period (2000-
2002) and the long term average at Elsenburg.
0
2
4
6
8
10
12
14
16
18
Janu
ary
Februa
ryMarc
hApri
lMay
June Ju
ly
Augus
t
Septem
ber
Octobe
r
Novem
ber
Decem
ber
Deg
rees
Cen
tigra
de
2000
2001
2002
Average 74 years
0
5
10
15
20
25
Janu
ary
Februa
ryMarc
hApri
lMay
June Ju
ly
Augus
t
Septem
ber
Octobe
r
Novem
ber
Decem
ber
Deg
rees
Cen
tigra
de
200020012002Average 74 years

96
Total rainfall of 933.8 mm in 2001 was extremely high if compared to 2000 (515.4 mm),
2002 (659.2 mm) and the long term average of 544.4 mm (Figure 5.4).
Figure 5.4. Monthly rainfall (mm) during the experimental period (2000-2002) and the long
term average at Elsenburg.
The highest monthly rainfall recorded was 260.4 (July 2001), 175 (May 2001), 141.8 (July
2002) and 139.2 mm (August 2001). Supplementary irrigation was available to irrigate when
necessary. Weekly water gains (rainfall and irrigation) are summarized in Table 5.2. The
effect of the high rainfall in 2001 was not as prominent as expected (Fig 5.4). The exceptional
high rainfall in May 2001 was evenly spread over a three week period between week 2 and 4
after fertilizer N application reducing the possible impact on N leaching. Furthermore the 176
mm received in week 4 early winter 2001 was also too late to cause extensive N leaching
although some leaching losses could be expected. Data recorded in the glasshouse study
(Chapters 2 and 3) also showed that soil N levels rapidly decreases within the first three
weeks after feriliser N application, possibly as a result of plant uptake, and thereby reducing
the risk of N leaching. The rapidly increasing clay content (10 to 30.8%) within the top 500
mm of the soil at the experimental site (Table 5.1) could also resulted in restricted N
movement to the deeper layers of the soil.
0
50
100
150
200
250
300
Janu
ary
Februa
ryMarc
hApri
lMay
June Ju
ly
Augus
t
Septem
ber
Octobe
r
Novem
ber
Decem
ber
Rai
nfal
l (m
m)
200020012002Average 30 years

97
Table 5.2. Weekly water gains (rainfall + irrigation in mm) to the pasture following fertiliser
N applications during the seasons and years (2000-2002) covered by the study at Elsenburg
Year 2000 Autumn Early winter Late winter Early spring Late spring Week 1 NA 74 66 18 71 Week 2 NA 8 42 64 22 Week 3 19 30 0 27 37 Week 4 22 20 20 20 36 Week 5 20 32 49 51 24 Week 6 74 66 18 71 43 Week 7 8 42 64 22 50 Total 143 272 259 273 283
Year 2001
Week 1 8 33 87 70 38 Week 2 54 9 10 32 42 Week 3 50 25 51 20 32 Week 4 46 176 60 40 36 Week 5 8 18 53 28 38 Week 6 33 87 70 38 44 Week 7 9 10 32 42 15 Total 208 358 363 270 245
Year 2002
Week 1 36 33 38 28 10 Week 2 0 20 13 13 36 Week 3 0 8 72 6 32 Week 4 44 44 28 50 28 Week 5 54 11 18 35 40 Week 6 33 38 28 10 36 Week 7 20 13 13 36 40 Total 187 167 210 178 222

98
Evaporation in 2002 (690.7 mm) was lower than in 2001 (774.78 mm), 2000 (919.62 mm) as
well as the long term average (918.9 mm) (Figure 5.5).
Figure 5.5. Monthly evaporation (mm) during the experimental period (2000-2002) and the
long term average at Elsenburg.
Pasture Management
Soil fertility status was corrected to levels required by ryegrass-clover pastures as prescribed
by Beyers (1983) before planting in 1999, while P, K and gypsum were added annually
according to the soil analyses. Prior to seeding the clover seed was treated with an insecticide
followed by inoculation with Rhizobium bacteria. A Brillion seeder was used to establish the
pasture as a mixed sward at 12 kg (perennial ryegrass) and 6 kg (white clover) seed per
hectare.
0
50
100
150
200
250
300
350
Janu
ary
Februa
ryMarc
hApri
lMay
June Ju
ly
Augus
t
Septem
ber
Octobe
r
Novem
ber
Decem
ber
Evap
orat
ion
(mm
)
200020012002Average 20 years

99
Irrigation was based on soil water potential as reflected by tensiometers (irrometers) with
irrigation started as soon as tensiometer readings reached –25 kPa.
Each year was divided into a grazing cycle (pasture grazed by sheep – December to March)
and a cutting cycle (April to November when the pastures were mowed to a 50 mm residue
height and all cut material was removed from the pasture). Fertiliser N treatments were
applied during the cutting cycle only. A fixed five week cutting interval was used during the
cutting period and a four-weekly grazing interval during the summer cycle. To stimulate even
regrowth after grazing the whole area was mowed to a height of 50 mm.
Experimental layout and treatments
The trial was laid out as a randomised complete block with a 4 x 5 factorial arranged in a
split-plot design (four N levels 0, 50, 100, and 150 kg N ha-1 applied as LAN [28% N] and
five seasons in which N was applied (late-April/early-May [autumn], early June [early
winter], mid-July [late winter], late-August [early spring] and late-September/early October
[late spring]) with four replicates (Snedecor & Cochran, 1967). Each plot received a single
application of fertiliser nitrogen (as N treatment after cutting) per annum. The LAN was
surface-applied followed by a light irrigation if necessary.
Subplot (N levels) dimensions were 3.6 x 7 m (25.2 m2) of which a net area of 1.27 x 5.73m
(7.28 m2) was harvested during the cutting cycle using a sickle-bar mower. Soil sampling was
restricted to the net plot area.
Data collection
Both plant and soil data were collected for the period 2000 – 2002. Soil samples taken in the
0-100, 200-300 and 400-500 mm soil layers at 7, 21 and 49 days after fertiliser N treatments
were applied, were used to measure nitrate- and ammonium-N content of the soil. Plant
samples were collected from each treatment combination during both the grazing and cutting
cycles to determine dry matter production and pasture composition (clover content). Pasture
quality was determined during the cutting cycle only. Two sub-samples (approximately 300
grams wet material) were collected from each treatment combination at harvesting. One was
used to determine dry matter production and the second sub-sample was divided into clover

100
and grass and dried for 72 h at 60 °C. The dried samples were used to determine the pasture
composition on a dry matter basis. During the grazing cycle three 0.25 m2 quadrants per
treatment combination were cut and the same procedure as described for mowing was
followed to determine pasture dry matter production and pasture composition. Root
distribution was studied 18 months after pasture establishment.
Statistical procedures
Analysis of variance was performed using the SAS (Statistical Analysis System) version 8.2
(SAS, 1999) to analyse each year separately. The Shapiro-Wilk test was performed to test for
non-normality of data analysed (Shapiro & Wilk, 1965). Least significant difference (LSD)
was calculated at the 5% confidence level to compare treatment means using Student's t-test
(Ott, 1998).
References
ANON., 1996. Verslag van die grondkundige opname van die plaas Elsenburg. Resource
Utilization, Department of Agriculture: Western-Cape.
ANON., 2004. Databank, Dept of Agrometry, ARC Institute for Soil, Climate and Water. Stellenbosch.
BEYERS, C.P. de L., 1983. Bemesting van aangeplante weidings. Winterreën, Spesiale
uitgawe no. 5, 54-59.
OTT, R.L., 1998. An Introduction to statistical methods and data analysis. Belmont,
California: Duxbury Press.
SAS., 1999. SAS/STAT User's Guide, Version 8, 1st printing, Volume 2. SAS Institute Inc,
SAS Campus Drive, Cary, North Carolina 27513.
SHAPIRO, S.S. & WILK, M.B., 1965. An Analysis of Variance Test for Normality,
Biometrika 52, 591-611.

101
SNEDECOR, G.W. & COCHRAN, W.G., 1967. Statistical Methods. Sixth Ed. The Iowa
State University Press, Ames, Iowa, U.S.A.
SOIL CLASSIFICATION WORKING GROUP., 1991. Soil Classification: A taxonomic
system for South Africa. Memoirs on the Agricultural Natural Resources of South
Africa Nr. 15. Department of Agricultural Development. Pretoria, South Africa.

102
Chapter 6
The effects of strategic fertiliser nitrogen application during the cool season
on perennial ryegrass-white clover pastures in the Western Cape Province
1. Soil nitrogen dynamics
Abstract
The dynamics of soil inorganic nitrogen in an Oakleaf soil (clay content increasing from 10 to
30.8 % with depth in the profile) in reaction to a single, strategic application of fertiliser N
was studied. Leaching of nitrogen after application to a perennial ryegrass-white clover
pasture was monitored to a soil depth of 500 mm over a seven week period following fertiliser
N application. Three levels of nitrogen (0, 50 and 150 kg N ha-1) in the form of LAN (28)
applied as a once off application during five different seasons (autumn, early winter, late
winter, early spring or late spring) were used as treatments. Soil samples, using a 75 mm open
sided Johnson bucket auger, were collected at 7, 21 and 49 days after fertiliser N application.
Soil samples were collected at 0-100, 200-300 and 400-500 mm depths, placed in shallow
trays and air- dried using electric fans. Both ammonium-N (NO3--N) and nitrate-N (NH4
+-N)
fractions were determined for all soil samples collected. It was however decided to present the
data as soil inorganic nitrogen (ammonium-N + nitrate-N).
Mean inorganic nitrogen content increased from 2000 to 2002 possibly as a result of
biological N fixation by the white clover in the pasture. The application of 50 kg N ha-1 did
not result in significant differences in soil N content compared to the 0 kg N ha-1 treatments
during almost the entire study and would therefore be regarded as a low risk treatment with
regard to environmental pollution.
The effect of 150 kg N ha-1 lasted for minimum of 3 weeks in the 0-100 mm layer with the
highest inorganic nitrogen levels normally measured in autumn and early winter. The effect of
150 kg N ha-1 lasted for 7 weeks in the 200-300 mm layers in years regarded as normal for the
Stellenbosch area. Leaching of fertiliser N within one week after application to the 400-500
mm soil layers emphasised the possible negative effect of application rates exceeding the

103
absorption capacity of the pasture. This might result in reduced nitrogen response efficiencies
(kg additional DM per kg N) and contamination of natural resources especially in winter
when the uptake capacity of the pasture is low as a result of low pasture productivity.
Keywords: NH4+-N, NO3
--N, perennial ryegrass, strategic nitrogen, white clover
Introduction
Applications of fertiliser N to boost grass production when the activity of the clover
component in a perennial grass-clover pasture is restricted by low temperatures, is confined to
applications in autumn, winter and spring (Laidlaw, 1984; Frame & Boyd, 1987; McKenzie,
Ryan, Jacobs & Kearney, 1999; Stout, Weaver & Elwinger, 2001). Excessive rainfall at the
time of N application may result in N losses due to runoff and leaching with a potential for N
pollution to occur in the soil. Of major environmental concern is the flow of N from the
pasture into water reserves and the atmosphere. The majority of ryegrass-clover pastures in
the Western Cape Province are grown under irrigation near rivers increasing the risk of water
pollution due to residual N following fertiliser N application. Excessive soil N levels will
exacerbate the problem. The strategic application of fertiliser nitrogen, if managed wrongly,
can therefore be regarded as an important environmental pollution hazard.
The recovery of fertiliser N by plants is generally low and rarely more than 50-75% (Allison,
1966; Ball & Ryden, 1984). This low recovery is mainly caused by the mineral N in the soil
being exposed to potential leaching to depths below the active root zone, denitrification and
volatilisation or rendered unavailable through immobilization (Olsen & Kurtz, 1982; Dinnes
et al., 2002). Leaching losses are high in well-drained, temporary wet soils (Havlin et al.,
1999). Denitrification losses, the biochemical reduction of NO3- to N2 and nitrous oxide under
warm (above 5 °C), anaerobic conditions (poorly drained soils) in the presence of
decomposing organic matter (Tinker, 1979; Miles & Manson, 2000), may result in N losses
during early autumn, late spring and summer. Volatilisation due to the loss of gaseous
ammonia (NH3) from calcerious or alkaline moist soils (Havlin et al., 1999; Miles & Manson,
2000), may result in great losses especially when N is applied as urea or ammonium forms.
Volatilisation losses increase as soil pH and fertiliser N application rate increases especially
when applied to a wet soil which undergoes drying (Miles & Manson, 2000).
104
In order to reduce N losses from pastures the application of fertiliser N should aim to remain
within the steepest portion of the response curve to ensure rapid absorption and efficient N
use by plants. The rate at which applied N fertiliser is taken up by the plant is dependant on
local environmental conditions, mainly temperature. Pasture productivity will increase as
temperature and photoperiod increase with the onset of spring resulting in the ability of the
pasture to respond and absorb more fertiliser N in a shorter period of time compared to winter
applications. The implication of this is that the optimum amount of fertiliser N might differ
when applied in different seasons. Under ideal conditions most uptake of fertiliser N occurs
within four weeks of application (Whitehead, 1970). To achieve optimum efficiency the N
fertiliser rate and season of application must be adapted to the pasture’s N uptake capacity
during selected time zones. Olsen & Kurtz (1982) state that N fertiliser applied to irrigated
ryegrass during active pasture growth, will have little effect after the first harvest, with
excessive free N in the soil possibly being leached out of the active root zone. In contrast Reid
(1984) reported a positive residual effect of the applied N in the second regrowth cycle,
resulting in production that was approximately 30-35% of the yield during the first regrowth
cycle.
The use of LAN (as opposed to urea) as nitrogen source in this study reduced the potential of
volatilisation losses to negligible levels (Whitehead, Pain & Ryden, 1986; Du Preez &
Burger, 1987a & b). Some denitrification losses could however be expected. Ryden (1985)
found that when ammonium nitrate was used as nitrogen source, denitrification losses seldom
exceeded 8% even at soil nitrate contents in excess of 5 mg N kg-1 in combination with soil
water contents of >20% and soil temperatures higher than 8 °C. Similar conditions occurred
regularly during the duration of the study.
Hutchings & Kristensen (1995) reported nitrogen leaching losses of approximately 15 kg N
ha-1 under unfertilised, grazed grass-clover pastures and predict losses of 90 kg N ha-1 on a
well fertilized grass-clover pasture with a production potential of 11.5 t ha-1. Ridley, Simpson
& White (1999) recorded leaching losses of 6-16 kg N ha-1 for grass pastures receiving no N
and 77-119 kg N ha-1 for grasses receiving 500 kg N ha-1. Ryden, Ball & Garwood (1984)
reported average leaching losses of 29 and 162 kg N ha-1 from cut and grazed pastures both
receiving 420 kg N ha-1 in the form of ammonium nitrate. Leaching losses from grass swards
is lower due to the high root density and high N uptake capacity during the growing season
(Whitehead et al., 1986).
105
Developing a strategic N fertilisation programme that will enhance nitrogen use efficiency
requires a knowledge of the movement of nitrogen through a specific soil as well as the
capacity of the pasture to absorb the applied fertiliser within the first regrowth cycle. Nitrogen
supply in the soil can then be synchronized with pasture N requirements or the ability of the
pasture to make maximum use of the additional N to enhance DM yield.
The objectives of this study were to monitor the mineral N content of the soil after fertiliser N
application to develop strategic N fertilisation norms that will ensure 1) maximum N response
efficiencies and 2) ensure minimum contamination of natural resources as a result of leaching.
Materials and methods
Experimental layout and treatments
The trial was laid out as a randomised complete block with a 4 x 5 factorial arranged in a
split-plot design (four N levels 0, 50, 100, and 150 kg N ha-1 applied as LAN [28] and five
seasons in which N was applied (late-April/early-May [autumn], early June [early winter],
mid-July [late winter], late-August [early spring] or late-September/early October [late
spring]) with four replicates (Snedecor & Cochran, 1967). Each plot received a single annual
application of fertiliser nitrogen after cutting, the timing of application depending on season.
The LAN was surface-applied followed by a light irrigation if necessary. Soil samples were
only collected at the 0, 50, and 150 kg N ha-1 plots. Subplot dimensions were 3.6 x 7 m (25.2
m2) of which a net area of 1.27 x 5.73m (7.28 m2) was harvested using a sickle-bar mower.
Soil sampling was restricted to the net plot area. Details on the experimental site and
treatments applied are shown in Chapter 5.
Data collection
Soil data were collected over a three year period. Samples were taken in the 0-100, 200-300
and 400-500 mm layers 7, 21 and 49 days after fertiliser N application. Soil samples were
taken only during the cutting cycle on plots where 0, 50 and 150 kg N ha-1 were applied.
Three sample cores (45mm diameter) per plot were bulked, placed in shallow trays and air
dried for 48 hours at room temperature using electric fans. The depth of soil sampling was
chosen to cover the upper (0-100 mm) and lower (200-300 mm) part of the active root zone as

106
well as a layer beneath (400-500 mm) to monitor leaching beyond the root zone. The first
sampling was aimed at determining the soil N content before the onset of accelerated pasture
growth in the first regrowth cycle after fertiliser N application (7 days). The second sampling
was done at near the expected peak pasture productivity in the first regrowth cycle (21 days).
The third sampling was done in the second regrowth cycle at the expected onset of increased
N uptake at 49 days after N application, but 14 days into the second regrowth cycle. An
autoanalyzer was used to determine the soil NH4+- and NO3
--N content (Bessinger, 1985).
Root distribution was studied 18 months after pasture establishment. Three 0.0067 m3
undisturbed soil cores were removed and sectioned into 0-100, 100-200 and 200-300 mm
layers. The roots were separated from the soil by thoroughly washing the individual soil
layers over a 2 and 1 mm combination sieve. Roots were dried at 60°C for 72 hours and dry
mass recorded. Average daily soil temperatures were calculated from data recorded at 80 mm
soil depth using a MCS 120-02EX datalogger.
Statistical procedures
Analysis of variance was performed using the SAS (Statistical Analysis System) version 8.2
(SAS, 1999). The Shapiro-Wilk test was performed to test for non-normality of data analysed
(Shapiro & Wilk, 1965). Least significant difference (LSD) was calculated at the 5%
confidence level to compare treatment means using Student's t-test (Ott, 1998).
Results and discussion
Soil temperatures
Average soil temperatures over the first seven weeks after fertiliser N application are shown
in Table 6.1. Soil temperatures decreased from 15.0 °C in autumn to 11.9 °C in early winter
followed by a gradual increase to 12.4, 14.1 and 16.4 °C in late winter, early spring and late
spring respectively. The decreasing soil temperatures between autumn and early winter
followed by the gradual increase could possibly play a major role in plant response to
fertiliser N application and the total N content of the soil.
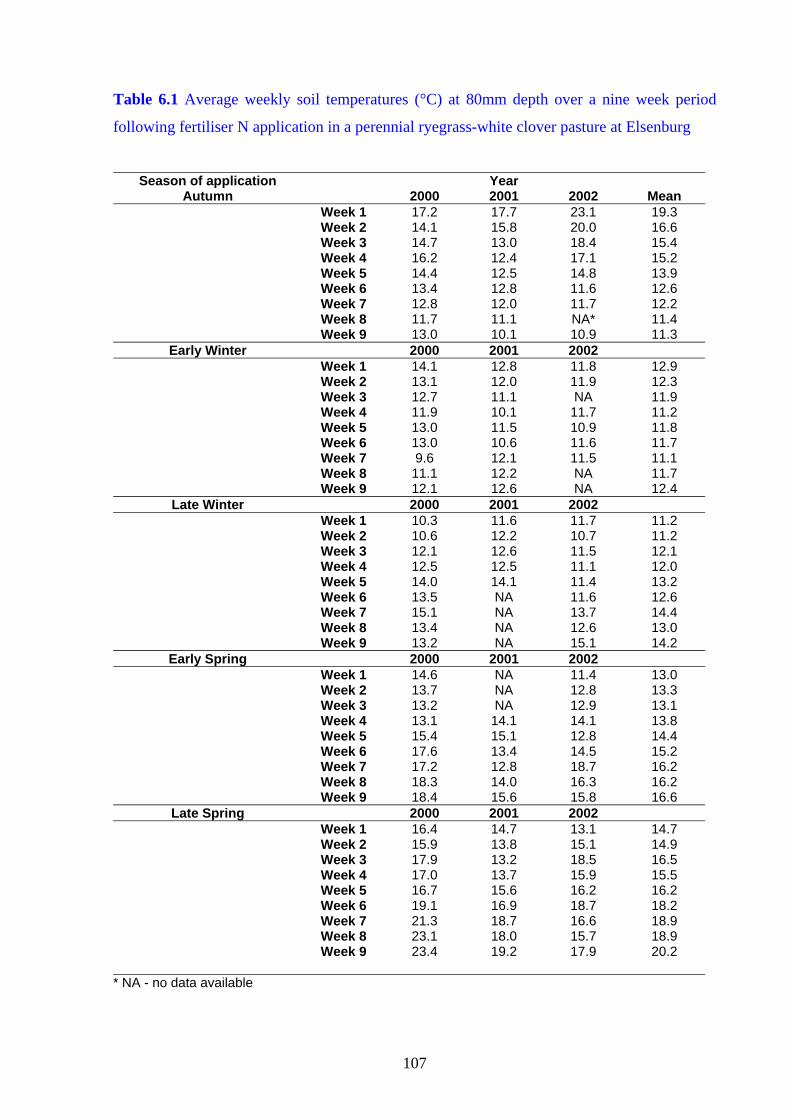
107
Table 6.1 Average weekly soil temperatures (°C) at 80mm depth over a nine week period
following fertiliser N application in a perennial ryegrass-white clover pasture at Elsenburg
Season of application Year
Autumn 2000 2001 2002 Mean Week 1 17.2 17.7 23.1 19.3
Week 2 14.1 15.8 20.0 16.6 Week 3 14.7 13.0 18.4 15.4 Week 4 16.2 12.4 17.1 15.2 Week 5 14.4 12.5 14.8 13.9 Week 6 13.4 12.8 11.6 12.6 Week 7 12.8 12.0 11.7 12.2 Week 8 11.7 11.1 NA* 11.4 Week 9 13.0 10.1 10.9 11.3
Early Winter 2000 2001 2002 Week 1 14.1 12.8 11.8 12.9
Week 2 13.1 12.0 11.9 12.3 Week 3 12.7 11.1 NA 11.9 Week 4 11.9 10.1 11.7 11.2 Week 5 13.0 11.5 10.9 11.8 Week 6 13.0 10.6 11.6 11.7 Week 7 9.6 12.1 11.5 11.1 Week 8 11.1 12.2 NA 11.7 Week 9 12.1 12.6 NA 12.4
Late Winter 2000 2001 2002 Week 1 10.3 11.6 11.7 11.2
Week 2 10.6 12.2 10.7 11.2 Week 3 12.1 12.6 11.5 12.1 Week 4 12.5 12.5 11.1 12.0 Week 5 14.0 14.1 11.4 13.2 Week 6 13.5 NA 11.6 12.6 Week 7 15.1 NA 13.7 14.4 Week 8 13.4 NA 12.6 13.0 Week 9 13.2 NA 15.1 14.2
Early Spring 2000 2001 2002 Week 1 14.6 NA 11.4 13.0 Week 2 13.7 NA 12.8 13.3 Week 3 13.2 NA 12.9 13.1 Week 4 13.1 14.1 14.1 13.8 Week 5 15.4 15.1 12.8 14.4 Week 6 17.6 13.4 14.5 15.2 Week 7 17.2 12.8 18.7 16.2 Week 8 18.3 14.0 16.3 16.2 Week 9 18.4 15.6 15.8 16.6
Late Spring 2000 2001 2002 Week 1 16.4 14.7 13.1 14.7 Week 2 15.9 13.8 15.1 14.9 Week 3 17.9 13.2 18.5 16.5 Week 4 17.0 13.7 15.9 15.5 Week 5 16.7 15.6 16.2 16.2 Week 6 19.1 16.9 18.7 18.2 Week 7 21.3 18.7 16.6 18.9 Week 8 23.1 18.0 15.7 18.9 Week 9 23.4 19.2 17.9 20.2
* NA - no data available
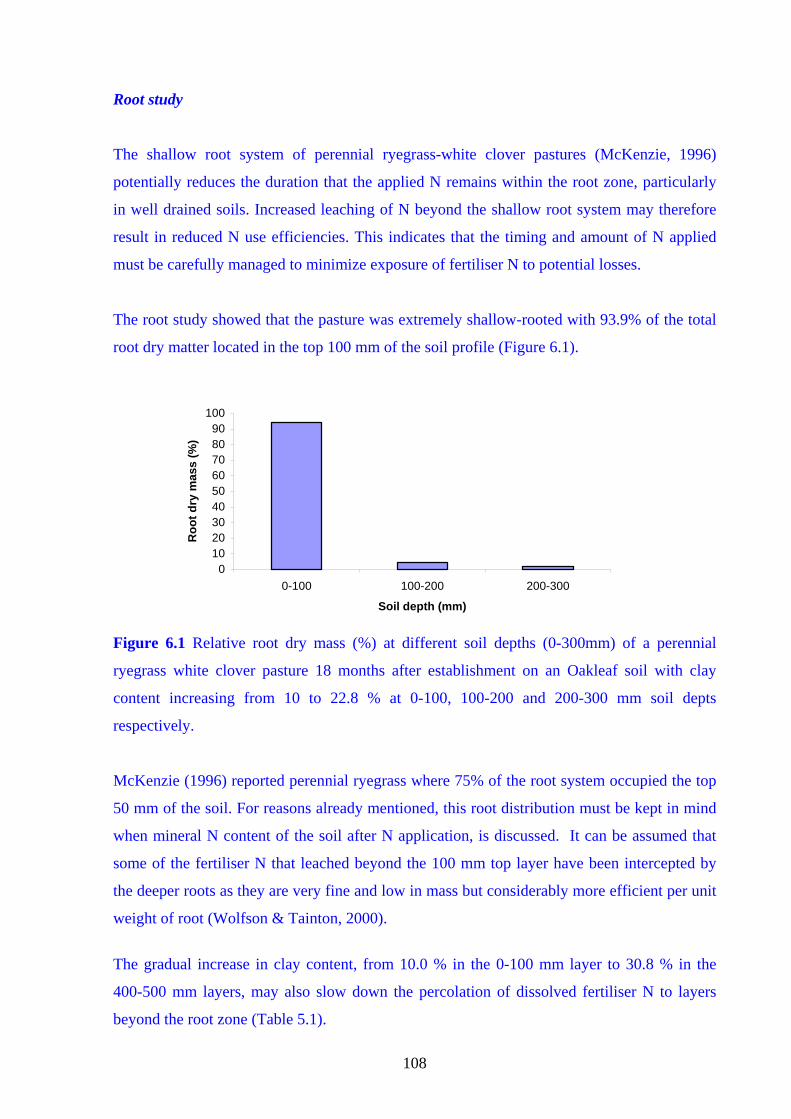
108
Root study
The shallow root system of perennial ryegrass-white clover pastures (McKenzie, 1996)
potentially reduces the duration that the applied N remains within the root zone, particularly
in well drained soils. Increased leaching of N beyond the shallow root system may therefore
result in reduced N use efficiencies. This indicates that the timing and amount of N applied
must be carefully managed to minimize exposure of fertiliser N to potential losses.
The root study showed that the pasture was extremely shallow-rooted with 93.9% of the total
root dry matter located in the top 100 mm of the soil profile (Figure 6.1).
Figure 6.1 Relative root dry mass (%) at different soil depths (0-300mm) of a perennial
ryegrass white clover pasture 18 months after establishment on an Oakleaf soil with clay
content increasing from 10 to 22.8 % at 0-100, 100-200 and 200-300 mm soil depts
respectively.
McKenzie (1996) reported perennial ryegrass where 75% of the root system occupied the top
50 mm of the soil. For reasons already mentioned, this root distribution must be kept in mind
when mineral N content of the soil after N application, is discussed. It can be assumed that
some of the fertiliser N that leached beyond the 100 mm top layer have been intercepted by
the deeper roots as they are very fine and low in mass but considerably more efficient per unit
weight of root (Wolfson & Tainton, 2000).
The gradual increase in clay content, from 10.0 % in the 0-100 mm layer to 30.8 % in the
400-500 mm layers, may also slow down the percolation of dissolved fertiliser N to layers
beyond the root zone (Table 5.1).
0102030405060708090
100
0-100 100-200 200-300
Soil depth (mm)
Roo
t dry
mas
s (%
)

109
Soil nitrogen content
General discussion
Levels of significance between treatments are summarised in Table 6.2.
Table 6.2 Partial ANOVA on concentration of soil nitrogen fractions in selected soil layers
over time as influenced by season and rate of fertiliser N application at Elsenburg Year 2000 Year 2001 Year 2002 Season x N Season N Season x N Season N Season x N Season N
Sampling Depth 0-100mm-7 Days After N Application NH4
+-N * *** *** * NS *** * *** ***NO3
--N * *** *** *** *** *** * *** ***TOTAL N * *** *** * *** *** * *** ***
Sampling Depth 0-100mm-21 Days After N Application NH4
+-N NS NS NS NS * NS * *** * NO3
--N *** *** *** * * NS NS * ***TOTAL N * *** *** NS * NS NS * ***
Sampling Depth 0-100mm-49 Days After N Application NH4
+-N NS *** * NS *** NS NS *** NSNO3
--N * * NS * *** * NS NS NSTOTAL N NS NS *** NS *** * NS * NS
Sampling Depth 200-300mm-7 Days After N Application NH4
+-N * *** *** NS *** NS NS *** NSNO3
--N *** *** *** NS * * NS * ***TOTAL N *** *** *** NS NS * NS *** ***
Sampling Depth 200-300mm-21 Days After N Application NH4
+-N NS * NS NS *** * * *** ***NO3
--N * *** *** * *** NS * * ***TOTAL N * *** *** * *** NS * *** ***
Sampling Depth 200-300mm-49 Days After N Application NH4
+-N NS * * * *** NS * *** NSNO3
--N NS NS NS * *** * *** * * TOTAL N NS * * * *** NS * *** *
Sampling Depth 400-500mm-7 Days After N Application NH4
+-N NS * NS NS *** NS * *** NSNO3
--N * * * NS NS * NS NS NSTOTAL N NS * * NS *** * NS *** NS
Sampling Depth 400-500mm-21 Days After N Application NH4
+-N NS * NS NS * NS NS *** NSNO3
--N * *** *** NS * NS NS * ***TOTAL N * * *** NS * NS NS *** ***
Sampling Depth 400-500mm-49 Days After N Application NH4
+-N * * NS * *** * NS *** NSNO3
--N * * NS * *** *** * * * TOTAL N NS * NS *** *** *** * *** NS NS, not significant; *P< 0.05; **P<0.01;***P<0.0001
From Table 6.2 it becomes clear that although both NH4+-N and NO3
--N content were affected
by both the fertiliser N application rate and season of application, the differences were

110
inconsistent between years. Although both NH4+-N and NO3
--N content were measured it was
decided to present and discuss only inorganic nitrogen (NH4+-N + NO3
--N) as indicator of
inorganic-N content as NH4+-N may very rapidly be mineralised to NO3
- -N (Wienhold &
Halvorson, 1999). As measurements were done at quite long intervals (7, 21 and 49 days after
N application) significant changes in NH4+-N and NO3
--N ratios may for this reason occurred
between samplings. The term inorganic nitrogen content in this discussion will thus refer to
the inorganic-N content as explained.
Except for the 0-100 mm layer one week after fertiliser N application in year 2000 (18.37 mg
kg-1), mean soil inorganic-N content gradually increased with time with the highest means
recorded in 2002 (Tables 6.4, 6.5 & 6.6). This trend supported results obtained by Eckard
(1994) who showed that clover has potential in building soil N.
Soil inorganic nitrogen content
To simplify the discussion soil inorganic nitrogen content will be discussed as measured at the
different sampling depths. Due to only two observations where 0 kg N ha-1 resulted in
significantly lower soil inorganic nitrogen content than at 50 kg N ha-1 will the 0 and 50 kg N
ha-1 treatment means not be discussed in the section that follows.
Layer 1: 0-100 mm
Increased fertiliser N rate caused increased mean soil inorganic nitrogen levels in the first
week after N application in all three years covered by the study (Table 6.3). The application
of 150 kg N ha-1 resulted in the highest (P=0.05) soil inorganic nitrogen levels one week after
fertiliser N application. The same results were obtained in 2000 and 2002 three weeks after
fertiliser N application indicating that, in the 0-100 mm soil layer, the effect of 150 kg N ha-1
will last for at least three weeks in normal seasons. No differences in total soil inorganic
nitrogen levels were recorded seven weeks after fertiliser N applications in 2000 and 2002.
Soil inorganic nitrogen contents during the first week after fertiliser N application were the
highest in autumn and early winter in all years covered by the study, possibly as a result of
high residual N as measured at the 0 kg N ha-1 treatments in autumn and slow uptake in early
winter due to low pasture N demand as a result of low pasture productivity. The lower soil

111
inorganic nitrogen in late winter to late spring possibly the result of increased N uptake as
pasture productivity increases as temperature and photoperiod increase. The increases in soil
inorganic nitrogen content during late spring (week seven) could be the result of N
mineralisation as soil temperatures increased. Except for year 2001, the same trend was
observed three weeks after fertiliser N application.
Layer 2: 200-300 mm
An increase in soil inorganic nitrogen levels were recorded one week after fertiliser N
application, in all years covered by the study, as fertiliser N rate was increased (Table 6.4).
The application of 150 kg N ha-1 resulted in significantly higher soil inorganic nitrogen levels
compared to the 0 kg N ha-1 rate during the first week in the 200-300 mm layers for all years
covered by the study. This suggested that leaching of fertiliser N occured within one week
after application. Except for 2001, the same reactions in terms of 150 kg N ha-1 were
measured at three and seven weeks after fertiliser N application. The assumption can be made
that fertiliser N leaching in 2000 and 2002 could be representative, because rainfall was on
average, and resulted in significantly higher inorganic nitrogen levels at the 150 kg N ha-1
rates. The non-significant higher inorganic nitrogen levels in 2001 can be seen as a situation
where fertiliser N had possibly been leached beyond the 200-300 mm layer because of the
very high rainfall.
The effect of season of application was inconsistent although a weak tendency of higher soil
N levels in autumn was observed especially one week after fertiliser N application.
Layer 3: 400-500 mm
Leaching of fertiliser N to the 400-500 mm layers was measured as the 150 kg N ha-1 rates
resulted in significantly higher soil inorganic nitrogen levels one week after fertiliser N
application in 2000 and 2001, three weeks in 2000 and 2002 as well as at seven weeks in
2000 and 2001 (Table 6.5). The high risk of applying 150 kg N ha-1 is emphasised by this
rapid leaching (within one week) of fertiliser N to layers beyond the root zone of the shallow
rooted pasture. The reaction to season of application was inconsistent.

112
Table 6.3 Inorganic-N (mg kg-1) in the 0-100 mm soil layer at one, three and seven weeks in response to fertiliser N application (0, 50 and 150 kg
N ha-1) during different seasons (autumn to late spring) to a perennial ryegrass-white clover pasture at Elsenburg for the period 2000 to 2002
Season 0 50 150 M ean (S) Season 0 50 150 M ean (S) Season 0 50 150 M ean (S)Autum n 9.89 27.04 49.39 28.77 a* Autumn 8.91 10.31 45.06 21.42 a Autum n 16.60 24.53 85.95 42.36 aEarly w inter 7.11 15.71 62.81 28.54 a Early w inter 7.52 14.03 55.91 25.82 a Early w inter 8.69 34.90 51.68 31.76 abLate w inter 3.68 9.29 22.44 11.80 bc Late w inter 8.40 8.96 22.09 13.15 b Late w inter 8.65 11.11 32.05 17.27 bcEarly spring 1.34 7.40 48.13 18.95 ab Early spring 4.83 6.45 16.46 9.25 b Early spring 5.75 10.22 30.22 15.39 cLate spring 1.40 2.55 7.45 3.80 c Late spring 6.78 7.62 19.40 11.27 b Late spring 12.02 20.19 39.90 24.04 abc
M ean (N) 4.68 b 12.40 b 38.04 a 18.37 M ean (N) 7.29 b 9.47 b 31.78 a 16.18 M ean (N) 10.34 c 20.19 b 47.96 a 26.16LSD interaction = 18.146 LSD interaction= 11.207 LSD interaction = 12.243LSD N = 8.1153 LSD N = 5.012 LSD N = 5.3301LSD Season= 12.475 LSD Season= 7.3707 LSD Season= 15.479
0 50 150 M ean (S) 0 50 150 M ean (S) 0 50 150 M ean (S)Autum n 9.66 4.65 19.12 11.14 a Autumn 4.51 5.39 13.80 7.90 b Autum n 7.36 10.38 26.06 14.60 aEarly w inter 4.67 6.71 21.64 11.01 a Early w inter 4.92 6.79 10.46 7.39 b Early w inter 8.29 12.95 21.90 14.38 aLate w inter 2.18 3.15 4.94 3.42 b Late w inter 8.02 8.07 11.22 9.10 b Late w inter 2.86 3.92 12.22 6.33 cEarly spring 3.52 4.67 7.32 5.17 b Early spring 16.41 18.44 9.74 14.86 a Early spring 8.39 9.05 14.33 10.59 bLate spring 1.88 2.15 2.17 2.07 b Late spring 6.27 6.81 8.78 7.29 b Late spring 9.82 9.76 18.32 12.63 ab
M ean (N) 4.38 b 4.27 b 11.04 a 6.56 M ean (N) 8.03 9.10 10.80 9.31 M ean (N) 7.34 b 9.21 b 18.57 a 11.71LSD interaction = 5.2299 LSD interaction= NS LSD interaction = NSLSD N = 2.3389 LSD N = NS LSD N = 3.0323LSD Season= 3.4897 LSD Season= 1.9215 LSD Season= 3.4774
0 50 150 M ean (S) 0 50 150 M ean (S) 0 50 150 M ean (S)Autum n 7.11 5.06 6.31 6.16 b Autumn 5.91 5.26 6.32 5.83 b Autum n 6.88 5.69 6.65 6.40 bEarly w inter 3.68 3.24 3.29 3.40 c Early w inter 4.29 5.73 6.35 5.46 bc Early w interLate w inter 5.10 15.95 8.03 9.70 a Late w inter 4.83 4.47 4.99 4.76 c Late w inter 5.94 6.96 5.97 6.29 bEarly spring 1.64 1.78 1.80 1.74 c Early spring 5.43 5.45 5.76 5.55 bc Early spring 5.99 6.41 6.44 6.28 bLate spring 2.86 3.19 2.80 2.95 c Late spring 10.52 12.36 12.63 11.84 a Late spring 23.21 12.06 10.80 15.36 a
M ean (N) 4.076 5.845 4.445 4.79 M ean (N) 6.20 b 6.65 ab 7.21 a 6.69 M ean (N) 8.40 6.22 5.97 8.58LSD interaction = NS LSD interaction= NS LSD interaction = NSLSD N = NS LSD N = 0.6851 LSD N = NSLSD Season= 2.6552 LSD Season= 1.051 LSD Season= 4.3666
* Means in the sam e year at a specific depth and tim e of sampling in the sam e colum n or row followed by the sam e letter are not significantly different (P=0.05)
YEAR 2000 YEAR 2001Sampling depth 1: 0-100mm
One week after fertiliser N application One week after fertiliser N application One week after fertiliser N application
YEAR 2002
Three weeks after fertiliser N application Three weeks after fertiliser N application
Sampling depth 1: 0-100mm
Fertiliser N rate (kg ha-1) Fertiliser N rate (kg ha-1) Fertiliser N rate (kg ha-1)
Sampling depth 1: 0-100mm
Seven weeks after fertiliser N application Seven weeks after fertiliser N application Seven weeks after fertiliser N application
Three weeks after fertiliser N application
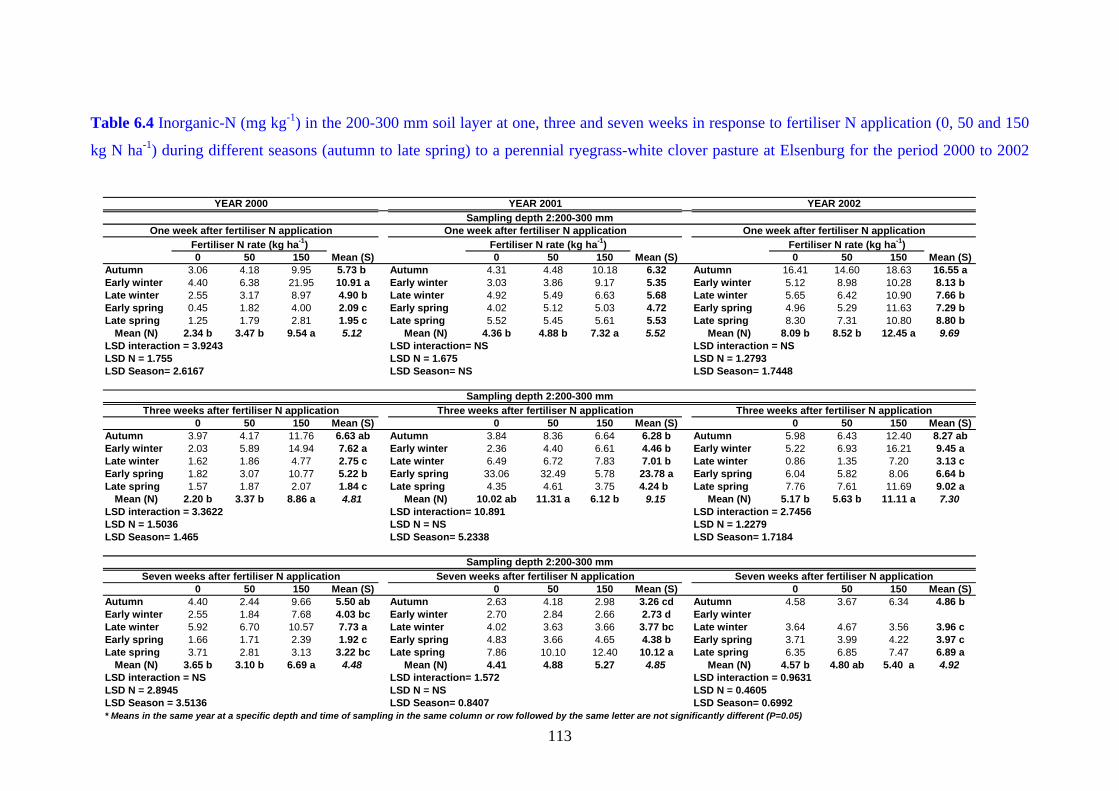
113
Table 6.4 Inorganic-N (mg kg-1) in the 200-300 mm soil layer at one, three and seven weeks in response to fertiliser N application (0, 50 and 150
kg N ha-1) during different seasons (autumn to late spring) to a perennial ryegrass-white clover pasture at Elsenburg for the period 2000 to 2002
0 50 150 Mean (S) 0 50 150 Mean (S) 0 50 150 Mean (S)Autumn 3.06 4.18 9.95 5.73 b Autumn 4.31 4.48 10.18 6.32 Autumn 16.41 14.60 18.63 16.55 aEarly winter 4.40 6.38 21.95 10.91 a Early winter 3.03 3.86 9.17 5.35 Early winter 5.12 8.98 10.28 8.13 bLate winter 2.55 3.17 8.97 4.90 b Late winter 4.92 5.49 6.63 5.68 Late winter 5.65 6.42 10.90 7.66 bEarly spring 0.45 1.82 4.00 2.09 c Early spring 4.02 5.12 5.03 4.72 Early spring 4.96 5.29 11.63 7.29 bLate spring 1.25 1.79 2.81 1.95 c Late spring 5.52 5.45 5.61 5.53 Late spring 8.30 7.31 10.80 8.80 b
Mean (N) 2.34 b 3.47 b 9.54 a 5.12 Mean (N) 4.36 b 4.88 b 7.32 a 5.52 Mean (N) 8.09 b 8.52 b 12.45 a 9.69LSD interaction = 3.9243 LSD interaction= NS LSD interaction = NSLSD N = 1.755 LSD N = 1.675 LSD N = 1.2793LSD Season= 2.6167 LSD Season= NS LSD Season= 1.7448
0 50 150 Mean (S) 0 50 150 Mean (S) 0 50 150 Mean (S)Autumn 3.97 4.17 11.76 6.63 ab Autumn 3.84 8.36 6.64 6.28 b Autumn 5.98 6.43 12.40 8.27 abEarly winter 2.03 5.89 14.94 7.62 a Early winter 2.36 4.40 6.61 4.46 b Early winter 5.22 6.93 16.21 9.45 aLate winter 1.62 1.86 4.77 2.75 c Late winter 6.49 6.72 7.83 7.01 b Late winter 0.86 1.35 7.20 3.13 cEarly spring 1.82 3.07 10.77 5.22 b Early spring 33.06 32.49 5.78 23.78 a Early spring 6.04 5.82 8.06 6.64 bLate spring 1.57 1.87 2.07 1.84 c Late spring 4.35 4.61 3.75 4.24 b Late spring 7.76 7.61 11.69 9.02 a
Mean (N) 2.20 b 3.37 b 8.86 a 4.81 Mean (N) 10.02 ab 11.31 a 6.12 b 9.15 Mean (N) 5.17 b 5.63 b 11.11 a 7.30LSD interaction = 3.3622 LSD interaction= 10.891 LSD interaction = 2.7456LSD N = 1.5036 LSD N = NS LSD N = 1.2279LSD Season= 1.465 LSD Season= 5.2338 LSD Season= 1.7184
0 50 150 Mean (S) 0 50 150 Mean (S) 0 50 150 Mean (S)Autumn 4.40 2.44 9.66 5.50 ab Autumn 2.63 4.18 2.98 3.26 cd Autumn 4.58 3.67 6.34 4.86 bEarly winter 2.55 1.84 7.68 4.03 bc Early winter 2.70 2.84 2.66 2.73 d Early winterLate winter 5.92 6.70 10.57 7.73 a Late winter 4.02 3.63 3.66 3.77 bc Late winter 3.64 4.67 3.56 3.96 cEarly spring 1.66 1.71 2.39 1.92 c Early spring 4.83 3.66 4.65 4.38 b Early spring 3.71 3.99 4.22 3.97 cLate spring 3.71 2.81 3.13 3.22 bc Late spring 7.86 10.10 12.40 10.12 a Late spring 6.35 6.85 7.47 6.89 a
Mean (N) 3.65 b 3.10 b 6.69 a 4.48 Mean (N) 4.41 4.88 5.27 4.85 Mean (N) 4.57 b 4.80 ab 5.40 a 4.92LSD interaction = NS LSD interaction= 1.572 LSD interaction = 0.9631LSD N = 2.8945 LSD N = NS LSD N = 0.4605LSD Season = 3.5136 LSD Season= 0.8407 LSD Season= 0.6992* Means in the same year at a specific depth and time of sampling in the same column or row followed by the same letter are not significantly different (P=0.05)
Sampling depth 2:200-300 mmThree weeks after fertiliser N application Three weeks after fertiliser N application Three weeks after fertiliser N application
Sampling depth 2:200-300 mmSeven weeks after fertiliser N application Seven weeks after fertiliser N application Seven weeks after fertiliser N application
Fertiliser N rate (kg ha-1) Fertiliser N rate (kg ha-1) Fertiliser N rate (kg ha-1)
YEAR 2000 YEAR 2001 YEAR 2002Sampling depth 2:200-300 mm
One week after fertiliser N application One week after fertiliser N application One week after fertiliser N application

114
Table 6.5 Inorganic-N (mg kg-1) in the 400-500 mm soil layer at one, three and seven weeks in response to fertiliser N application (0, 50 and 150
kg N ha-1) during different seasons (autumn to late spring) to a perennial ryegrass-white clover pasture at Elsenburg for the period 2000 to 2002
0 50 150 Mean (S) 0 50 150 Mean (S) 0 50 150 Mean (S)Autumn 1.94 3.60 5.30 3.61 b Autumn 5.51 4.46 6.53 5.50 b Autumn 18.10 14.65 16.98 16.58 aEarly winter 6.19 6.38 9.32 7.30 a Early winter 2.82 2.50 3.79 3.04 c Early winter 5.54 7.42 8.51 7.15 cLate winter 2.37 3.44 7.95 4.58 b Late winter 5.35 7.50 9.51 7.45 a Late winter 8.58 7.04 5.92 7.18 cEarly spring 0.50 1.15 2.74 1.46 c Early spring 4.02 5.60 6.20 5.27 b Early spring 6.83 6.29 7.37 6.83 cLate spring 1.27 1.90 3.33 2.17 c Late spring 5.61 6.54 6.17 6.11 ab Late spring 8.99 9.50 9.41 9.30 b
Mean (N) 2.45 b 3.29 b 5.73 a 3.82 Mean (N) 4.66 b 5.32 ab 6.44 a 5.47 Mean (N) 9.61 8.98 9.64 9.41LSD interaction = 2.04227 LSD interaction= NS LSD interaction = NSLSD N = 0.8435 LSD N = 1.2053 LSD N = NSLSD Season= 1.4326 LSD Season= 1.362 LSD Season= 1.901
0 50 150 Mean (S) 0 50 150 Mean (S) 0 50 150 Mean (S)Autumn 2.73 3.34 5.57 3.88 ab Autumn 5.52 5.92 13.71 8.38 b Autumn 5.25 5.80 9.17 6.74 bEarly winter 1.88 4.21 8.75 4.94 a Early winter 3.69 4.40 6.09 4.72 b Early winter 6.28 6.00 7.50 6.59 bLate winter 1.50 2.46 4.33 2.76 bc Late winter 6.16 8.26 8.61 7.68 b Late winter 0.66 2.90 5.57 3.04 cEarly spring 1.53 3.28 9.67 4.83 a Early spring 20.82 18.16 14.24 17.74 a Early spring 4.92 5.97 7.25 6.05 bLate spring 1.54 1.99 2.27 1.93 c Late spring 4.29 5.07 9.59 6.32 b Late spring 8.59 7.76 9.86 8.73 a
Mean (N) 1.84 c 3.06 b 6.12 a 3.67 Mean (N) 8.09 8.36 10.44 8.97 Mean (N) 5.14 b 5.68 b 7.87 a 6.23LSD interaction = 2.292 LSD interaction=NS LSD interaction = NSLSD N = 1.025 LSD N = NS LSD N = 0.7982LSD Season= 1.1708 LSD Season= 5.0998 LSD Season= 1.0063
0 50 150 Mean (S) 0 50 150 Mean (S) 0 50 150 Mean (S)Autumn 6.19 2.62 8.45 5.76 a Autumn 1.90 3.08 3.53 2.84 c Autumn 5.17 2.96 11.28 6.47 abEarly winter 2.37 2.60 6.65 3.87 ab Early winter 2.10 3.03 4.07 3.07 c Early winterLate winter 3.61 6.80 4.47 4.96 ab Late winter 4.02 3.92 3.77 3.90 c Late winter 4.70 5.47 5.59 5.25 bEarly spring 1.41 1.80 2.08 1.76 c Early spring 5.94 4.65 5.64 5.41 b Early spring 4.64 4.19 4.17 4.33 bLate spring 2.64 3.02 3.28 2.98 bc Late spring 6.70 9.13 14.21 10.01 a Late spring 7.83 8.54 7.38 7.92 a
Mean (N) 3.24 b 3.37 b 4.99 a 3.87 Mean (N) 4.13 b 4.76 b 6.24 a 5.04 Mean (N) 5.58 5.29 7.10 5.99LSD interaction = 3.7726 LSD interaction= 1.5413 LSD interaction = 2.2889LSD N = 1.6833 LSD N = 0.6893 LSD N = NSLSD Season= 2.086 LSD Season= 1.0901 LSD Season= 2.2315* Means in the same year at a specific depth and time of sampling in the same column or row followed by the same letter are not significantly different (P=0.05)
Sampling depth 3:400-500 mmThree weeks after fertiliser N application Three weeks after fertiliser N application Three weeks after fertiliser N application
Sampling depth 3:400-500 mmSeven weeks after fertiliser N application Seven weeks after fertiliser N application Seven weeks after fertiliser N application
Fertiliser N rate (kg ha-1) Fertiliser N rate (kg ha-1) Fertiliser N rate (kg ha-1)
YEAR 2002YEAR 2001YEAR 2000Sampling depth 3:400-500 mm
One week after fertiliser N application One week after fertiliser N application One week after fertiliser N application

115
Conclusions
In this study the application of 50 kg N ha-1 did not increase inorganic-N to levels where
leaching beyond the root zone could cause significant contamination of the water resources
since the majority of the fertiliser N was absorbed within three weeks after application. This
statement is supported by the fact that no differences in mean soil inorganic nitrogen levels
between 0 and 50 kg ha-1 were reported for almost all data recorded. The application of 150
kg N ha-1 applied in autumn and early winter on the other hand may result in soil N levels
exceeding the pasture’s uptake capacity causing an accumulation of soil inorganic nitrogen
and increasing the risk of contamination of soil water resources. Leaching of fertiliser N
beyond the root zone, as possibly the case with applying 150 kg N ha-1 (especially in autumn
and early winter), may result in lower N response efficiencies questioning the economic
feasibility of these practices.
Leaching of fertiliser N to the 400 - 500 mm levels within one week after N application, as
found in this study, clearly emphasise the risk of applying 150 kg N ha-1 as a single strategic
application. These high levels were detected even seven weeks after fertiliser N application.
The optimal N rate would clearly be the rate that results in sufficient N to last for only one
regrowth cycle. This will require relative low rates of fertiliser N when pasture productivity is
low and/or under high rainfall conditions and may be increased as pasture productivity
increases in spring and water supply is managed by thorough irrigation scheduling as rainfall
decreases with the onset of spring.
References
ALLISON, F.E., 1966. The fate of nitrogen applied in soils. Advances in Agronomy 18, 219-
258.
BALL, P.R. & RAYDEN 1984. Nitrogen relationships in intensively managed temperate
grasslands. Plant and Soil 76, 23-33.
BESSINGER, F., 1985. Methods of Plant Analysis by Autoanalyzer Techniques. Information
Bulletin No D-3. Soil and Irrigation Research Institute, Private Bag X79, Pretoria.
0001.
116
DINNES, D.L., KARLEN, D.L., JANES, D.B., KASPAR, T.C., HATFIELD, J.L., COLVIN,
T.S. & CAMBARDELLA, C.A., 2002. Nitrogen Management Strategies to Reduce
Nitrate Leaching in Tile-Drained Midwestern Soils. Agrononomy Journal 94, 153-
171.
DU PREEZ, C.C. & BURGER, R.du.T., 1987a. Laboratory measurements of ammonia
volatilization from five nitrogen-containing fertilisers after surface application at
different rates on a neutral to alkaline soil. South African Journal of Plant and Soil
4 (1), 17-20.
DU PREEZ, C.C. & BURGER, R.du.T., 1987b. Effect of application methods on ammonia
volatilization from soils in a controlled environment. South African Journal of Plant
and Soil 4 (2), 57-60.
ECKARD, R. J., 1994. The nitrogen economy of three irrigated temperate grass pastures with
and without clover in Natal. Ph.D Thesis. The University of Natal, Pietermaritzburg.
South Africa.
FRAME, J. & BOYD, A.G., 1987. The effect of strategic use of fertiliser nitrogen in spring
and/or autumn on the productivity of perennial ryegrass/white clover sward. Grass
and Forage Science 42, 429-438.
HAVLIN, J.L., BEATON, J.D., TISDALE, S.L. & NELSON W.L., 1999. Soil Fertility and
Fertilizers. 6th edition. Prentice-Hall inc. New Jersey.
HUTCHINGS, N. J. & KRISTENSEN, I. S., 1995. Modelling mineral nitrogen accumulation
in grazed pasture: Will more nitrogen leach from fertilized grass than unfertilized
grass/clover? Grass and Forage Science 50, 300-313.
LAIDLAW, A.S., 1984. Quantifying the effect of nitrogen fertiliser applications in spring on
white clover content in perennial ryegrass-white clover swards. Grass and Forage
Science 39, 317-321.

117
McKENZIE, F.R., 1996. The effect of grazing frequency and intensity on root development
of Lolium perenne L. under subtropical conditions. South African Journal of Plant and
Soil 13 (1), 22-26.
MCKENZIE, F.R., RYAN, M.J., JACOBS, J.L. & KEARNEY, G., 1999. Effect of rate and
time of nitrogen application from autumn to midwinter on perennial ryegrass-white
clover dairy pastures in western Victoria. 1. Growth and composition. Australian
Journal of Agricultural Research 50, 1059-1065.
MILES, N & MANSON A.D. 2000. Nutrition of planted pastures. In N.M. Tainton.(ed.)
Pasture Management in South Africa. University of Natal Press, Pietermaritzburg.
OLSEN, R.A. & KURTZ, L.T., 1982. Crop nitrogen requirements, utilization and
fertilization. In F J Stevenson (ed.). Nitrogen in agricultural soils. Agron. No 22,
Madison, Wisconsin. 567.
OTT, R.L., 1998. An Introduction to statistical methods and data analysis. Belmont,
California: Duxbury Press.
REID, D., 1984. The seasonal distribution of nitrogen fertiliser dressings on pure perennial
ryegrass swards. Journal of Agricultural Science Cambridge 103, 659-669.
RIDLEY, A.M., SIMPSON, R.J. & WHITE, R.E., 1999. Nitrate leaching under phalaris,
cocksfoot and annual ryegrass pastures and implications for soil acidification.
Australian Journal of Agricultural Research 50, 55-63.
RYDEN, J.C., 1985. Denitrification loss from managed grassland. In H. L. Goltersman (ed.).
Denitrification in the Nitrogen Cycle. Plenum Publishing Corporation.
RYDEN, J.C., BALL, P.R. & GARWOOD, E.A., 1984. Nitrate leaching from grassland.
Nature 311, 50-53.
SAS., 1999. SAS/STAT User's Guide, Version 8, 1st printing, Volume 2. SAS Institute Inc,
SAS Campus Drive, Cary, North Carolina 27513.

118
SHAPIRO, S.S. & WILK, M.B., 1965. An analysis of variance test for normality, Biometrika
52, 591-611.
SNEDECOR, G.W. & COCHRAN, W.G., 1967. Statistical Methods. Sixth Ed. The Iowa
State University Press, Ames, Iowa, U.S.A.
STOUT, W.l., WEAVER, R.S. & ELWINGER, G.F., 2001. Effects of early season nitrogen
on grass-clover swards in the northern USA. Agronomy Journal 93, 1000-05.
TINKER, P.B.H., 1979. Uptake and consumption of soil nitrogen in relation to agronomic
practice. In E.J.Hewitt and C.V. Cutting (eds.). Nitrogen assimilation of plants.
Academic Press. London, New York, San Francisco.
WHITEHEAD, D.C., 1970. The role of nitrogen in grassland procductivity. Bulletin,
Commonwealth Burreau of Pastures and Field Crops. No 48 Farnhum Royal;
Commonwealth Agricultural Burreau.
WHITEHEAD, D.C., PAIN, B.F. & RYDEN, J.C., 1986. Nitrogen in UK Grassland
Agriculture. Journal of the Royal Agricultural Society of England 147, 190-201.
WIENHOLD, B.J. & HALVORSON, A.D., 1999. N-mineralization responses to cropping,
tillage and N rate in the Northern Great Planes. Soil Science Society of America
Journal 63, 192-196.
WOLFSON, M.M., & TAINTON, N.M., 2000. The morphology and physiology of the major
forage plants. In N.M. Tainton (ed.). Pasture management in South Africa. University
of Natal Press, Pietermaritzburg.

119
Chapter 7
The effects of strategic nitrogen fertiliser application during the cool season
on perennial ryegrass-white clover pastures in the Western Cape Province
2. Dry matter production
Abstract
The effect of four fertiliser nitrogen levels, (0, 50, 100 and 150 kg N ha-1) applied in autumn
(April/May), early winter (June), late winter (July), early spring (August) or late spring
(September/October), on dry matter production of a perennial ryegrass-white clover pasture
was investigated over a three year period. Primary dry matter (PDM) and residual dry matter
production (RDM) were recorded five and ten weeks after fertiliser N application. Although
reponses were affected by the age of the pasture, PDM production was dominated by fertiliser
N application rate. On average the highest yields were obtained with spring applications and
lowest when N was applied in early winter. Although RDM production generally also
increased with increasing fertiliser N rates, responses were much smaller and were affected by
the season of fertiliser N application. Best results were obtained when N was applied in
autumn and winter while application in spring had no or even a negative affect. Due to this
contrasting effect both total (PDM + RDM) and annual dry matter production were not much
affected. Nitrogen application can therefore be used to improve dry matter production during
a short predetermined period. Although the 150 kg N ha-1 applied in late spring generally gave
the best results in terms of PDM produced the 50 kg N ha-1 treatments resulted in a more
efficient conversion of N applied to additional DM produced.
Keywords: dry matter production, perennial ryegrass/white clover, strategic nitrogen
Introduction
Dry matter production of perennial ryegrass-white clover pastures grown in the Western Cape
Province are characterized by low levels from April to September (Botha, 2002). Poor pasture
performance and possible measures to minimize this negative effect on fodder flow
120
management have been extensively investigated (Ball, Molloy & Ross, 1978; Laidlaw, 1984;
Frame & Boyd, 1987; Eckard & Franks, 1998; McKenzie, Ryan, Jacobs & Kearney, 1999;
Stout, Weaver & Elwinger, 2001). These authors concluded that the strategic use of fertiliser
nitrogen, to boost grass productivity during this period of low dry matter production, could be
an important management tool to manipulate pasture productivity.
In perennial ryegrass-white clover pastures soil temperatures below about 9°C will restrict
soil N mineralisation and nitrification, as well as the growth of clover (MacDuff & Dhanoa,
1990; Hatch & MacDuff, 1991). Ryegrass is reported to grow and respond to fertiliser N
application at soil temperatures as low as 5°C (Frame, 1994; Whitehead, 1995). This tendency
creates an opportunity to increase pasture production by stimulating ryegrass growth when
clover activity is restricted due to low soil temperatures. The negative effect of fertiliser N on
clover activity may thus be minimal due to the inactivity of clover at relatively low
temperatures.
Increasing soil nitrogen through the application of fertiliser N often results in a decrease in the
clover content of grass-clover pastures (Frame & Boyd, 1987; van Heerden & Durand, 1994;
Stout, et al., 2001). High levels of soil nitrogen may restrict clover productivity to such low
levels that the sward becomes N deficient later in the growing season (Thomas, 1992; Caradus
et al., 1993). High rates of fertiliser N applications may also result in an oversupply of soil N,
leaving large amounts of residual N exposed to leaching and possible pollution of natural
resources. High herbage N levels are also potentially toxic to ruminants (Eckard, 1990). The
optimum fertiliser N application rate (kg N ha-1) for each area representing a set of edaphic,
environmental and management conditions can only be determined if a range of N application
rates are evaluated.
The window of opportunity in which pasture, especially the grass component, productivity
can be increased, includes autumn, winter and spring, complicating the decision of when to
apply fertiliser N. The positive effect of fertiliser N applied, only lasts for about 4 weeks
(Eckard, Bartholomew & Tainton, 1995), necessitating the testing of fertiliser N application
over different seasons in order to identify the optimum combination(s) of fertiliser N rate and
season of application.
121
The aim of this study was to determine the optimum response of the pasture in terms of dry
matter production to fertiliser N rates and season of application treatment combination(s) as a
possible management tool to increase pasture productivity when dry matter productivity is
restricted by sub optimal environmental conditions.
Materials and methods
A field experiment was conducted at the Institute for Plant Production, Elsenburg during the
period 2000 – 2002 to determine the effect of four nitrogen application rates (0, 50, 100 and
150 kg ha-1), applied during autumn (April/May), early winter (early June), late winter (mid
July), early spring (late August) or late spring (September/October) on the inorganic nitrogen
content of the soil and subsequent dry mass (DM) production, pasture composition as well as
the quality of a ryegrass-clover pasture. Details on the experimental site, climate,
experimental design, lay-out, treatments applied and data analyses are discussed in Chapter 5.
Data collection
To determine dry matter (DM) production, each year was divided into a grazing cycle (pasture
grazed by sheep – December to March) and a cutting cycle (April to November) when the
pasture was mowed to a 50 mm residue height and all plant material removed from the
pasture. A fixed five week cutting interval was used during the cutting cycle and a four-
weekly grazing interval during the grazing cycle. Subplot dimensions were 3.6 x 7 m (25.2
m2) of which a net area of 1.27 x 5.73 m (7.28 m2) was harvested using a sickle-bar mower. N
treatments were applied after cutting, the timing of application depending on season as a
treatment. Two sub-samples (approximately 300 grams wet material) were collected from
each treatment combination at harvesting. One sample used to determine dry matter
production was dried for 72 h at 60 °C. During the grazing cycle three 0.25 m2 quadrants per
treatment combination were cut, bulked and the same procedure as described for mowing was
followed to determine pasture dry matter production.
Dry matter production was divided into: Primary dry matter production (PDM) which refers
to the dry matter produced during the first regrowth cycle (5 weeks) after fertiliser N
treatments were applied; Residual dry matter production (RDM) which refers to the dry
matter produced in the second regrowth cycle (5-10 weeks) after application of fertiliser N;
122
Total dry matter production (TDM) which refers to the cumulative dry matter produced
during the first 10 weeks after fertiliser N application and annual dry matter production
(ADM) which refers to all dry matter produced during the cutting and grazing cycle of a year
and which were recorded during 2001 and 2002 only.
Results and discussions
Primary dry matter production (PDM)
The highest PDM yields were recorded during 2000 (1948.06 kg ha-1), followed by 2001
(1879.85 kg ha-1) and 1791.74 kg ha-1 in 2002 (Table 7.1). High rainfall could reduced N
availability during 2001 (Chapter 6), but did not as expected, reduced PDM production,
because PDM production decreased with season of production irrespective of rainfall.
A significant interaction between season of application and fertiliser nitrogen rate was
observed in 2000 only, indicating that nitrogen application rate has a dominating effect on
PDM production. Increased levels of fertiliser N therefore resulted in increased PDM
production irrespective of season of application (Table 7.1), but the smallest response was
generally obtained when N was applied in early winter. The mean PDM production for the
autumn, late winter, early - and late spring treatments were respectively 792.5, 334.1, 1287.2
and 1513.7 kg ha-1 higher compared to early winter applications of fertiliser N. Highest yields
of 3065.8 (2000), 3296.3 (2001) and 3144.7 kg DM ha-1 (2002) were obtained where 150 kg
N ha-1 was applied during late spring, while the lowest yields of 945.4 (2000), 456.0 (2001)
and 526.9 kg DM ha-1 (2002), were recorded in early winter where no nitrogen (0 kg N ha-1)
was applied. In general PDM production for the 0 kg N ha-1 treatments showed similar
responses to season as fertilised plots, illustrating the normal seasonal effect on growth of a
ryegrass-clover pasture.
The lack of response during autumn and early winter of 2000 and 2002 might have been the
result of soil nitrate levels exceeding the pasture’s (slow) nitrate absorption capacity at low
temperatures (Chapter 2). Concentrations of plant available N above 28 mg kg –1 (2.0 mM)
generally decrease N2 fixation and high levels of soil N cause senescence of root nodules
restricting N2 fixation (Phillips & DeJong, 1984). The total soil-N levels of between 45 and
86 mg kg–1, one week after 150 kg N ha-1 fertiliser N application in autumn and early winter

123
(Chapter 6), may therefore have resulted in a restriction of symbiotic N2 fixation (Phillips &
DeJong, 1984) in addition to the already low fixation rate as a result of low soil temperatures.
This might attribute to poor responses in winter, even at high N application rates.
Table 7.1 Primary dry matter yield response (kg DM ha-1) of perennial ryegrass-white clover
to fertiliser N rates (kg N ha-1) and time or season of application at Elsenburg
Year 2000 Nitrogen (kg ha-1) Season of application 0 50 100 150 Mean (S) Autumn 2014.6 fgh* 2266.7 e 2450.5 de 2658.7 cd 2347.6 a** Early winter 945.4 m 985.4 lm 1215.9 jkl 1313.8 ijk 1115.1 c Late winter 1126.0 klm 1501.5 i 1836.4 h 1998.7 gh 1615.7 b Early spring 1425.0 ij 2254.7 ef 2686.9 bcd 2817.8 bc 2296.1 a Late spring 1500.0 i 2230.8 efg 2906.5 ab 3065.8 a 2425.8 a Mean (N) 1402.2 d 1847.82 c 2219.24 b 2370.96 a 1960.1 LSD (0.05) Year = 75.34 LSD (0.05) NxS = 242.99 LSD (0.05) S means = 168.73 LSD (0.05) N means = 108.48 CV = 8.68
Year 2001 Autumn 590.6 h 1537.6 ef 1886.4 d 2229.5 c 1561.0 b Early winter 456.0 h 1259.3 g 1704.8 de 1748.5 de 1292.1 c Late winter 586.5 h 1357.0 fg 1848.4 d 2228.2 c 1505.0 bc Early spring 1427.8 fg 2291.6 c 2915.8 b 3068.6 ab 2426.0 a Late spring 1749.9 de 2374.2 c 3039.9 b 3296.3 a 2615.1 a Mean (N) 962.2 d 1763.9 c 2279.1 b 2514.2 a 1879.8 LSD (0.05) NxS = 232.3 LSD (0.05) S means = 267.62 LSD (0.05) N means = 103.89 CV = 8.68
Year 2002 Autumn 1416.5 i 1676.8 gh 1847.9 fg 2035.1 ef 1744.1 c Early winter 526.9 m 823.5 kl 982.0 jk 1138.7 j 867.8 e Late winter 656.5 lm 1058.2 j 1390.2 i 1522.3 hi 1156.8 d Early spring 1807.1 fg 2330.8 d 2687.8 c 2833.1bc 2414.7 b Late spring 2197.8 de 2744.2 c 3014.7 ab 3144.7 a 2775.4 a Mean (N) 1321.0 d 1726.7 c 1984.5 b 2134.8 a 1791.7 LSD (0.05) NxS = 232.22 LSD (0.05) S means = 190.54 LSD (0.05) N means = 103.85 CV = 9.10 * Means in the same year followed by the same letter are not significantly different (P=0.05) **Means (in bold) in the same year followed by the same letter in bold are not significantly different (P=0.05)

124
PDM production data were subjected to multiple regression analysis (Draper & Smith, 1981).
The linear function (y = a + b1x1 + b2x2) fitted the data best (Table 7.2). The data recorded
shows great potential to develop regression models (Table 7.2) that can be instrumental in
calculating the N rate required by a specific pasture (with a known initial clover content1) to
produce at a predetermined level at the end of the first regrowth cycle. Due to variation in
clover response at the 0 kg N ha-1 treatments it was decided to keep years separate with 2000
and 2002 representing pastures with decreasing and increasing clover contents, respectively.
The N rate decided on will however also be dictated by predicted clover percentage, season of
application and N response efficiencies.
Table 7.2. Relationship between predicted PDM production (Y), initial clover percentage (%)
(X1) and fertiliser N rate (kg N ha-1) (X2) in a perennial ryegrass-white clover pasture grown
under irrigation in the Western Cape Province
Year* Season Predicted primary dry matter production (kg ha-1) r 2
2000 Autumn Y = 3426.189 - 20.297(X1) - 1.274(X2) + 0.087(X1*X2) 0.72
Early winter Y = 1188.642 - 4.127(X1) + 1.031(X2) + 0.024(X1*X2) 0.72 Late winter Y = 1409.093 - 4.335(X1) + 4.059(X2) + 0.034(X1*X2) 0.77 Early spring Y = 2602.931 - 19.320(X1) + 8.396(X2) + 0.014(X1*X2) 0.90 Late spring Y = 993.753 + 11.684(X1) - 3.184(X2) + 0.260(X1*X2) 0.55
2001 Autumn Y = 456.762 + 16.099(X1) + 11.559(X2) - 0.068(X1*X2) 0.89 Early winter Y = 588.606 + 2.055(X1) + 9.782(X2) - 0.0424(X1*X2) 0.83 Late winter Y = 196.918 + 12.241(X1) + 18.404(X2) - 0.189(X1*X2) 0.93 Early spring Y = 2778.724 - 23.505(X1) + 2.401(X2) + 0.170(X1*X2) 0.85 Late spring Y = 2953.065 - 22.250(X1) + 18.036(X2) - 0.118(X1*X2) 0.76
2002 Autumn Y = 1537.777 - 1.431(X1) + 15.621(X2) - 0.156(X1*X2) 0.75 Early winter Y = 421.955 + 2.635(X1) + 7.202(X2) - 0.060(X1*X2) 0.82 Late winter Y = 199.444 + 10.889(X1) + 12.302(X2) - 0.140(X1*X2) 0.87 Early spring Y = 2301.929 - 6.294(X1) + 0.258(X2) + 0.104(X1*X2) 0.80 Late spring Y = 1924.388 + 5.369(X1) + 37.295(X2) - 0.465(X1*X2) 0.84 * Parameter values were not averaged over years as years 2000 and 2002 were characterised by a general
decrease and increase in clover content between autumn and spring, respectively. 1 Refer to the clover content of the pasture when the fertiliser N treatments are applied
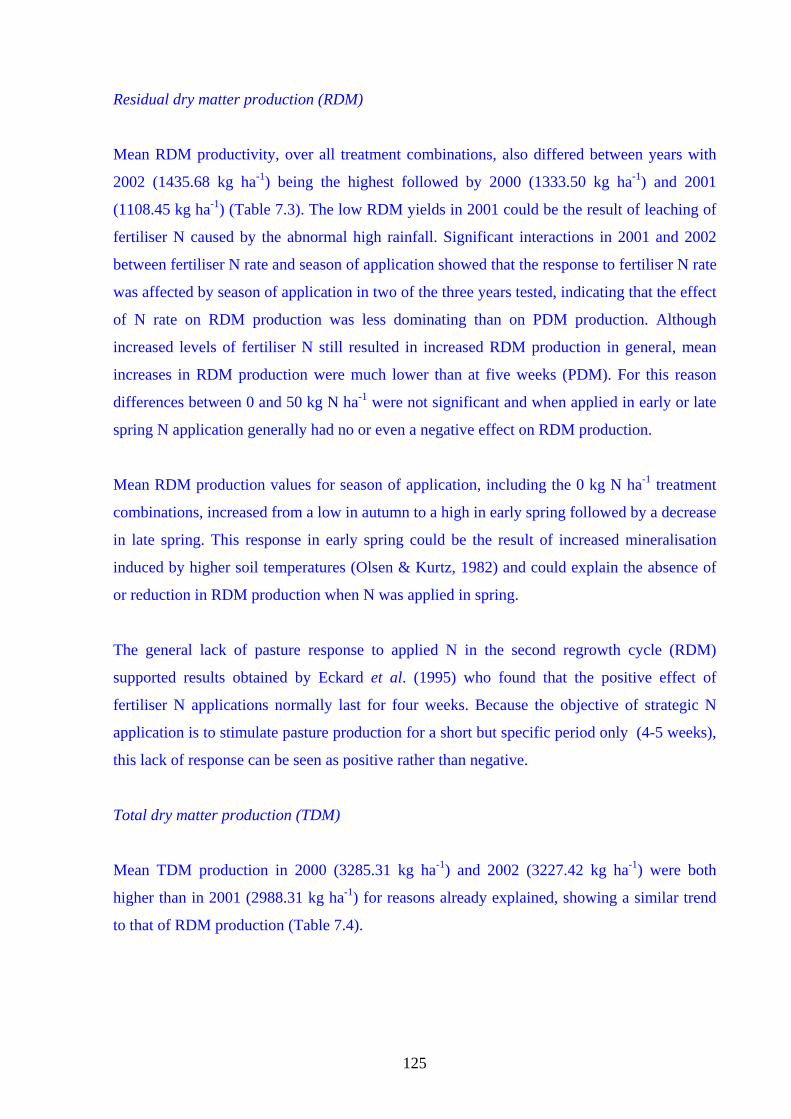
125
Residual dry matter production (RDM)
Mean RDM productivity, over all treatment combinations, also differed between years with
2002 (1435.68 kg ha-1) being the highest followed by 2000 (1333.50 kg ha-1) and 2001
(1108.45 kg ha-1) (Table 7.3). The low RDM yields in 2001 could be the result of leaching of
fertiliser N caused by the abnormal high rainfall. Significant interactions in 2001 and 2002
between fertiliser N rate and season of application showed that the response to fertiliser N rate
was affected by season of application in two of the three years tested, indicating that the effect
of N rate on RDM production was less dominating than on PDM production. Although
increased levels of fertiliser N still resulted in increased RDM production in general, mean
increases in RDM production were much lower than at five weeks (PDM). For this reason
differences between 0 and 50 kg N ha-1 were not significant and when applied in early or late
spring N application generally had no or even a negative effect on RDM production.
Mean RDM production values for season of application, including the 0 kg N ha-1 treatment
combinations, increased from a low in autumn to a high in early spring followed by a decrease
in late spring. This response in early spring could be the result of increased mineralisation
induced by higher soil temperatures (Olsen & Kurtz, 1982) and could explain the absence of
or reduction in RDM production when N was applied in spring.
The general lack of pasture response to applied N in the second regrowth cycle (RDM)
supported results obtained by Eckard et al. (1995) who found that the positive effect of
fertiliser N applications normally last for four weeks. Because the objective of strategic N
application is to stimulate pasture production for a short but specific period only (4-5 weeks),
this lack of response can be seen as positive rather than negative.
Total dry matter production (TDM)
Mean TDM production in 2000 (3285.31 kg ha-1) and 2002 (3227.42 kg ha-1) were both
higher than in 2001 (2988.31 kg ha-1) for reasons already explained, showing a similar trend
to that of RDM production (Table 7.4).

126
Table 7.3 Residual dry matter yield response (kg DM ha-1) of perennial ryegrass-white clover
to fertiliser N rates (kg N ha-1) and time or season of application at Elsenburg
Year 2000 Nitrogen (kg ha-1) Season of application 0 50 100 150 Mean (S) Autumn 945.4 j* 1041.7 ij 1072.1 hij 1167.0 ghi 1056.57 c** Early winter 1126.0 ghi 1163.1 ghi 1218.6 fgh 1431.9 cde 1234.90 b Late winter 1425.0 de 1487.3 cde 1530.9 bcd 1727.9 a 1542.79 a Early spring 1500.0 bcde 1477.0 cde 1578.9 abc 1645.0 ab 1550.22 a Late spring 1368.9 ef 1139.9 ghi 1229.0 fg 1394.3 de 1283.04 b Mean (N) 1273.05 b 1261.81 b 1325.90 b 1473.25 a 1333.50 LSD (0.05) Year = 41.63 LSD (0.05) NxS= 151.17 LSD (0.05) S means = 110.02 LSD (0.05) N means = 67.603 CV = 7.96
Year 2001 Autumn 456.0 j 524.6 j 723.5 hi 946.8 fg 662.7 c Early winter 586.51 ij 779.8 gh 1043.7 f 1235.5 cde 911.4 b Late winter 1427.9 b 1405.4 bc 1455.6 b 1682.6 a 1492.9 a Early spring 1749.9 a 1456.4 b 1373.7 bc 1270.1 bcd 1462.5 a Late spring 1081.6def 982.4 f 1079.5 ef 908.0 fgh 1012.8 b Mean (N) 1060.4 bc 1029.7 c 1135.2 ab 1208.6 a 1108.5 LSD (0.05) NxS = 188.85 LSD (0.05) S means = 154.52 LSD (0.05) N means = 84.458 CV = 11.96
Year 2002 Autumn 526.9 gh 506.1 h 549.3 fgh 745.7 f 582.0 e Early winter 656.5 fgh 727.9 fg 995.4 e 1135.7 e 878.9 d Late winter 1807.1 c 1821.4 c 1923.1 bc 2119.2 ab 1917.7 b Early spring 2197.8 a 2199.3 a 2123.2 ab 2190.3 a 2177.7 a Late spring 1819.4 c 1510.3 d 1403.6 d 1755.4 c 1622.2 c Mean (N) 1401.5 b 1353.0 b 1398.9 b 1589.3 a 1435.7 LSD (0.05) NxS = 211.15 LSD (0.05) S means = 137.5 LSD (0.05) N means = 94.43 CV = 10.33 * Means in the same year followed by the same letter are not significantly different (P=0.05) **Means (in bold) in the same year followed by the same letter in bold are not significantly different (P=0.05)

127
Table 7.4 Total dry matter yield (10 weeks) response (kg DM ha-1) of perennial ryegrass-
white clover to fertiliser N rates (kg N ha-1) and time or season of application at Elsenburg
Year 2000 Nitrogen (kg/ha) Season of application 0 50 100 150 Mean (S) Autumn 2960.0 e* 3308.3 d 3522.6 cd 3825.7 b 3404.2 b Early winter 2071.4 i 2148.5 hi 2434.5 gh 2745.7 ef 2350.0 d Late winter 2551.0 fg 2988.8 e 3367.2 d 3726.6 bc 3158.4 c Early spring 2925.0 e 3731.6 bc 4265.7 a 4462.8 a 3846.3 a Late spring 2868.8 e 3370.7 d 4199.5 a 4460.1 a 3724.8 a Mean (N) 2675.2 d 3109.6 c 3557.9 b 3844.2 a 3296.7 LSD (0.05) Year = 96.94 LSD (0.05) NxS = 299.54 LSD (0.05) S means = 238.78 LSD (0.05) N means = 133.73 CV = 6.35
Year 2001 Autumn 1046.5 i 2062.2 h 2610.0 g 3176.3 de 2223.8 c Early winter 1042.5 i 2039.0 h 2748.5 fg 2984.0 ef 2203.5 c Late winter 2014.4 h 2762.4 fg 3303.9 d 3910.8 bc 2997.9 b Early spring 3177.7 de 3748.0 c 4289.5 a 4338.7 a 3888.5 a Late spring 2831.4 fg 3356.6 d 4119.4 ab 4204.3 ab 3627.9 a Mean (N) 2022.5 d 2793.6 c 3414.2 b 3722.8 a 2988.3 LSD (0.05) NxS = 309.98 LSD (0.05) S means = 305.74 LSD (0.05) N means = 138.63 CV = 7.28
Year 2002 Autumn 1943.3 j 2183.0 ij 2397.2 i 2780.8 gh 2326.1 c Early winter 1183.4 l 1551.4 k 1977.4 j 2274.4 ij 1746.7 d Late winter 2463.6 hi 2879.6 g 3313.2 f 3641.6 ef 3074.5 b Early spring 4005.0 de 4530.0 bc 4811.0 ab 5023.4 a 4592.3 a Late spring 4017.2 d 4254.6 cd 4418.3 c 4900.1 a 4397.5 a Mean (N) 2722.5 d 3079.7 c 3383.5 b 3724.0 a 3227.4 LSD (0.05) NxS = 363.54 LSD (0.05) S means = 241.42 LSD (0.05) N means = 162.58 CV = 7.91 * Means in the same year followed by the same letter are not significantly different (P=0.05) **Means (in bold) in the same year followed by the same letter in bold are not significantly different (P=0.05)
On average TDM production increased with increasing N application rates, but significant
interactions between fertiliser N rate and season of application were recorded in 2000 and
2001. The highest TDM productions were recorded where 150 kg N ha-1 was applied in early
spring (4462.8, 4338.7 and 5023.3 kg ha-1 for 2000, 2001 and 2002 respectively) and the

128
lowest at the 0 kg N ha-1 treatment level in early winter (2071.4, 1042.5 and 1183.4 kg ha-1).
The application of 100 and 150 kg N ha-1 resulted in higher (P=0.05) TDM production
compared to the 0 kg N ha-1 treatments during all seasons covered by the study, while
applications of 50 kg N ha-1 resulted in higher (P=0.05) TDM production compared to 0 kg N
ha-1, with the exception of early winter in 2000 as well as autumn and late spring in 2002. As
also found for the first five weeks after application (PDM), early spring and early winter
proved to be most and least responsive seasons respectively.
The higher TDM production where N was applied in early- and late spring could be ascribed
to increased soil N mineralisation and biological N2 fixation, as average daily temperature of
12.5 °C during late winter increased to 16.5 °C in late spring (Table 5.3) and daylength
(photoperiod) increased from 9.8 hours in early winter to 12.3 hours in late spring. This
reaction in pasture productivity was also reflected in similar, but lower increases in PDM
production on the zero N treatments. The lower PDM production during June/July suggest an
ineffective uptake of applied N, leaving fertiliser N in the root-zone and are consistent with
results obtained during the monitoring of soil nitrogen in this study (Chapter 6), confirming
the need to monitor soil N distribution and pasture N recovery.
The increase in TDM production as a result of fertiliser N application indicates that a shortage
of plant available N existed during the seasons covered by the study and therefore opens the
opportunity to boost pasture productivity through applications of fertiliser N.
Stepwise regression analysis revealed that fertiliser N rate (kg N ha-1) caused most of the
variation in dry matter production (PDM and TDM) during a specified season with the
contribution of initial clover percentage generally neglible (Table 7.5).
Annual dry matter production (ADM)
Although mean ADM production in 2002 (14 500.6 kg ha-1) was higher than in 2001 (12
075.1 kg ha-1), nitrogen applications did not influence ADM production in 2001, but in 2002
the 0 kg N ha-1 treatments produced significant (P=0.05) lower yields than the treatments that
received fertiliser nitrogen (Table 7.6). The increase of 831.6 kg in ADM production when the
150 kg N ha-1 treatments were compared to 0 kg N ha-1 in 2002, supported earlier results by
Ball et al. (1978), who showed annual yield increases of 1.1 and 3.5 t ha-1 where 112 and 448

129
kg N ha-1 were applied to grazed grass-clover pastures. The lower ADM production in 2001
most probably was, as already explained, the result of the high rainfall resulting in N leaching
and low initial clover content restricting N fixation and recycling in the pasture.
Table 7.5 Contribution (%) of fertiliser N rate (kg ha-1), applied in a specified season, and
initial clover content (%), to variation measured in PDM and TDM production on perennial
ryegrass-white clover pastures in the Western Cape Province
PDM production TDM production
Year Season N rate Initial clover % Interaction N rate Initial clover % Interaction
2000 Autumn 52.4 17.52 NS 53.12 19.99 NS Early winter 68.1 NS NS 64.14 NS NS
Late winter 76.54 NS NS 82.67 NS NS
Early spring 82.79 6.96 NS 83.39 4.79 NS Late spring NS NS 54.71 NS NS 49.21
2001 Autumn 86.64 NS NS 92.32 NS NS
Early winter 83.08 NS NS 88.14 NS NS
Late winter 92.35 NS NS 87.19 NS NS Early spring 83.74 NS NS 67.11 NS NS
Late spring 70.88 NS NS 61.92 NS NS
2002 Autumn 60.23 NS 14.65 55.62 NS 23.63
Early winter 79.36 NS NS 83.95 NS NS Late winter 84.53 NS NS 79.94 NS NS
Early spring 79.61 NS NS NS NS 71.04
Late spring 69.02 NS 15.03 53.48 NS NS
Season of application also influenced ADM production in 2001, but not in 2002. The lowest
ADM production in 2001 was recorded when fertiliser N was applied in early winter.
Although differences (P=0.05) in ADM production were found due to different N-rates in
combination with the season of application, no definite trend was observed. Frame & Boyd

130
(1987) also reported inconsistent results, while Schils, Vellinga & Kraak (1999) reported no
difference in annual DM yields where 0 and 50 kg N ha-1 were applied in spring.
The fact that ADM production did not show any definite response to treatment combinations
indicates that perennial ryegrass-white clover pastures can be manipulated to increased dry
matter production during predetermined seasons without major negative effects on pasture
annual dry matter production potential.
Table 7.6 Annual dry matter production of the pasture for 2001 and 2002 in response to
strategic N fertilisation at at Elsenburg
Year 2001 Nitrogen (kg ha-1)
Season of application 0 50 100 150 Mean (S) Autumn 12251.0 abcd * 13506.2 a 12509.5abcd 12350.2 abcd 12654.2 ab** Early winter 12251.0 abcd 11243.1 de 11290.3 de 10163.9 e 11284.2 c Late winter 12251.0 abcd 12512.8 abcd 11641.2 bcd 12211.3 abcd 12058.6 abc Early spring 12251.0 abcd 11398.8 cde 11420.4 cde 11319.1 de 11597.3 bc Late spring 12251.0 abcd 12833.9 abc 12896.0 ab 12950.3 ab 12732.8 a Mean (N) 12251.0 12298.9 11951.5 11798.9 12075.1 LSD (0.05) Year = 301.47 LSD (0.05) NxS = 1461.8 LSD (0.05) S means = 1111.9 LSD (0.05) N means = NS CV = 8.65
Year 2002 Autumn 13870.8 e 14978.1 abc 14737.8 abcd 14461.4 abcde 14512.0 Early winter 13870.8 e 14226.9 cde 14840.3 abcd 13673.9 e 14153.0 Late winter 13870.8 e 15024.7 abc 15286 a 15035.1 abc 14804.1 Early spring 13870.8 e 14719.7 abcd 14959.9 abc 15109.9 ab 14665.1 Late spring 13870.8 e 14321.1 bcde 14051.2 de 15231.5 a 14368.7 Mean (N) 13870.8 b 14654.1 a 14775.0 a 14702.4 a 14500.6 LSD (0.05) NxS = 847.1 LSD (0.05) S means = NS LSD (0.05) N means = 378.83 CV = 4.10 * Means in the same year followed by the same letter are not significantly different (P=0.05) **Means (in bold) in the same year followed by the same letter in bold are not significantly different (P=0.05)

131
The annual dry matter yield responses of the pasture are summarised in Figure 7.1. Results
show that the positive effect of the applied fertiliser N on dry matter production lasted for a
maximum of two regrowth cycles (10 weeks) mainly with application rates of 150 kg N ha-1
applied in early and late winter. This increase of dry matter production relative to the 0 kg N
ha-1 treatments are generally followed by dry matter production levels slightly lower than the
0 kg N ha-1 levels generally over an extended period following fertiliser N application. The
effect of season of application on addressing the winter gap is clearly shown in the results.
Year 2002 showed that application of fertiliser N in autumn delayed the onset of the negative
effect of the winter gap as pasture production was stimulated, especially at the 100 and 150 kg
N ha-1 rates. The duration of the winter gap, period between sufficient forage availability in
early autumn and sufficient forage availability in early summer, was therefore effectively
reduced. The same effect was observed with late winter and early spring applications.
Fertiliser N application in early winter increased dry matter production when shortages in
available forage become crucial as pasture dry matter production reached a low resulting in
severe forage shortages. Late spring applications were however too late to be of any
significance in managing the winter gap as pasture productivity (without N application) was at
the same – or higher – levels compared to dry matter production at the onset of the winter gap.
Nitrogen Response Efficiency (NRE)
The nitrogen response efficiency (kg additional DM produced per kg N applied) is the
difference between DM produced at 0 kg N ha-1 and 50, 100 as well as 150 kg N ha-1
respectively divided by N application rate.
As also found by Eckard & Franks (1998), increasing fertiliser N rates resulted in
progressively lower NRE values (Table 7.7). NRE values increased as the season progressed
towards spring, reaching a maximum during early spring with trends obtained in this study
similar to those reported in earlier studies (Frame & Boyd, 1987; McKenzie, Jacobs & Ryan,
1998; McKenzie et al., 1999).
Although no significant fertiliser N x season of application interaction was found, the
application of 50 kg N ha-1 in early spring resulted in the highest NRE of 14.782 kg DM kg-1
N during the first regrowth cycle, while the lowest return (5.05 kg DM kg-1 N) was recorded
where 150 kg N ha-1 was applied in early winter. These results supported the idea that

132
nitrogen responses of grass-clover pastures are lower and less reliable compare to pure grasses
(Whitehead, 1970 cited by Ball et al., 1978).
Autumn
0500
100015002000250030003500
09-M
ar
25-Apr
05-Ju
n12
-Jul
22-Aug
27-Sep
25 Okt
21-Nov
19-Dec
17-Ja
n
05-M
ar
03-Apr
DM
pro
duct
ion
(kg
ha-1
)
N0N50N100N150
Early winter
0500
100015002000250030003500
09-M
ar
25-Apr
05-Ju
n12
-Jul
22-Aug
27-Sep
25 Okt
21-Nov
19-Dec
17-Ja
n05
-Mar
03-Apr
DM
pro
duct
ion
(kg
ha-1
)
N0N50N100N150
Late winter
0500
100015002000250030003500
09-M
ar
25-Apr
05-Ju
n12
-Jul
22-Aug
27-Sep
25 Okt
21-Nov
19-Dec
17-Ja
n
05-M
ar
03-Apr
DM
pro
duct
ion
(kg
ha-1
)
N0N50N100N150
Early spring
0500
100015002000250030003500
09-M
ar
25-Apr
05-Ju
n12
-Jul
22-Aug
27-Sep
25 Okt
21-Nov
19-Dec
17-Ja
n
05-M
ar
03-Apr
DM
pro
duct
ion
(kg
ha-1
)
N0N50N100N150
Late spring
0500
100015002000250030003500
09-M
ar
25-Apr
05-Ju
n12
-Jul
22-Aug
27-Sep
25 Okt
21-Nov
19-Dec
17-Ja
n05
-Mar
03-Apr
DM
pro
duct
ion
(kg
ha-1
)
N0N50N100N150
Autumn
0500
100015002000250030003500
03-Apr
08-M
ay12
-Jun24
-Jul
28-Aug
02-O
ct
05-Nov
10-Dec
14-Ja
n26
-Feb24
-Apr
DM p
rodu
ctio
n (k
g ha
-1)
N0N50N100N150
Early winter
0500
100015002000250030003500
03-Apr
08-M
ay12
-Jun24
-Jul
28-Aug
02-O
ct
05-Nov
10-Dec
14-Ja
n
26-Fe
b24
-Apr
DM
pro
duct
ion
(kg
ha-1
)
N0N50N100N150
Late winter
0500
100015002000250030003500
03-Apr
08-M
ay12
-Jun24
-Jul
28-Aug
02-O
ct
05-Nov
10-Dec
14-Ja
n26
-Feb24
-Apr
DM p
rodu
ctio
n (k
g ha
-1)
N0N50N100N150
Early spring
0
500
1000
1500
2000
2500
3000
3500
03-A
pr
08-M
ay
12-Ju
n24
-Jul
28-A
ug
02-O
ct
05-N
ov
10-D
ec
14-Ja
n
26-F
eb
24-A
pr
DM p
rodu
ctio
n (k
g ha
-1)
N0N50N100N150
Late spring
0500
100015002000250030003500
03-Apr
08-M
ay12
-Jun24
-Jul
28-Aug
02-O
ct
05-Nov
10-Dec
14-Ja
n
26-Fe
b24
-Apr
DM
pro
duct
ion
(kg
ha-1
)
N0N50N100N150
Autumn
0500
100015002000250030003500
24-Apr
03-Ju
n04
-Jul
07-Aug
12-Sep
16-O
ct
21-Nov
17-Dec
28-Ja
n04
-Mar
24-Apr
DM p
rodu
ctio
n (k
g ha
-1)
N0N50N100N150
E a r ly w in te r
0
5 0 0
1 0 0 0
1 5 0 0
2 0 0 0
2 5 0 0
3 0 0 0
3 5 0 0
24-A
pr
03 -Jun
04 -Jul
07 -Aug
12 -Sep
16 -Oct
21 -Nov
17 -Dec
28 -Jan
04 -Mar
24 -Apr
DM p
rodu
ctio
n (k
g ha
-1)
N 0N 5 0N 1 0 0N 1 5 0
Late winter
0500
100015002000250030003500
24-Apr
03-Ju
n04
-Jul
07-Aug
12-Sep
16-O
ct
21-Nov
17-Dec
28-Ja
n04
-Mar
24-Apr
DM
pro
duct
ion
(kg
ha-1
)
N0N50N100N150
Early spring
0500
100015002000250030003500
24-A
pr03
-Jun
04-Ju
l07
-Aug
12-S
ep16
-Oct
21-N
ov17
-Dec
28-Ja
n04
-Mar
24-A
pr
DM
pro
duct
ion
(kg
ha-1
)
N0N50N100N150
Late spring
01000200030004000
24-Ap
r03-
Jun04-Jul
07-Au
g12-
Sep16-
Oct21-
Nov17-
Dec28-
Jan04-
Mar24-
AprD
M p
rodu
ctio
n (k
g ha
-1 )
N0N50N100N150
Year 2000 Year 2001 Year 2002
Fertiliser N applied in autumn
Fertiliser N applied in early winter
Fertiliser N applied in late winter
Fertiliser N applied in early spring
Fertiliser N applied in late spring
Figure 7.1 Long term effect of fertiliser N application rate (0, 50, 100 and 150 kg N ha-1) and season of application on dry matter production (kg ha-1) of a perennial ryegrass-white clover pasture from year 2000 to 2002 in the Western Cape Province (N application ).
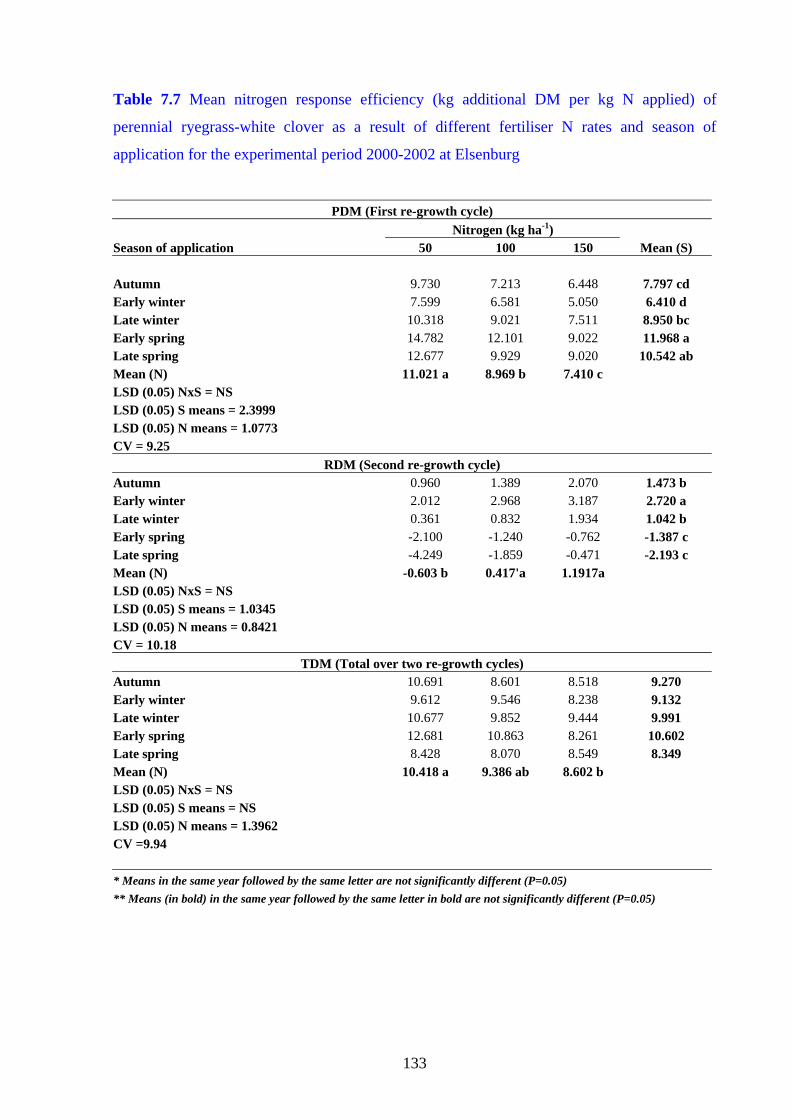
133
Table 7.7 Mean nitrogen response efficiency (kg additional DM per kg N applied) of
perennial ryegrass-white clover as a result of different fertiliser N rates and season of
application for the experimental period 2000-2002 at Elsenburg
PDM (First re-growth cycle) Nitrogen (kg ha-1) Season of application 50 100 150 Mean (S) Autumn 9.730 7.213 6.448 7.797 cd Early winter 7.599 6.581 5.050 6.410 d Late winter 10.318 9.021 7.511 8.950 bc Early spring 14.782 12.101 9.022 11.968 a Late spring 12.677 9.929 9.020 10.542 ab Mean (N) 11.021 a 8.969 b 7.410 c LSD (0.05) NxS = NS LSD (0.05) S means = 2.3999 LSD (0.05) N means = 1.0773 CV = 9.25
RDM (Second re-growth cycle) Autumn 0.960 1.389 2.070 1.473 b Early winter 2.012 2.968 3.187 2.720 a Late winter 0.361 0.832 1.934 1.042 b Early spring -2.100 -1.240 -0.762 -1.387 c Late spring -4.249 -1.859 -0.471 -2.193 c Mean (N) -0.603 b 0.417'a 1.1917a LSD (0.05) NxS = NS LSD (0.05) S means = 1.0345 LSD (0.05) N means = 0.8421 CV = 10.18
TDM (Total over two re-growth cycles) Autumn 10.691 8.601 8.518 9.270 Early winter 9.612 9.546 8.238 9.132 Late winter 10.677 9.852 9.444 9.991 Early spring 12.681 10.863 8.261 10.602 Late spring 8.428 8.070 8.549 8.349 Mean (N) 10.418 a 9.386 ab 8.602 b LSD (0.05) NxS = NS LSD (0.05) S means = NS LSD (0.05) N means = 1.3962 CV =9.94 * Means in the same year followed by the same letter are not significantly different (P=0.05) ** Means (in bold) in the same year followed by the same letter in bold are not significantly different (P=0.05)

134
Carry over of fertiliser N to the second regrowth cycle where 150 kg N ha-1 was applied in
autumn and winter caused, in contrast to the first re-growth cycle, an increase in the NRE
resulting in less significant differences in NRE values between treatment combinations.
Conclusion
Results from this study show that dry matter production in a predetermined season can be
increased through the application of fertiliser nitrogen without reducing annual dry matter
production.
The application of 150 kg N ha-1 during early and late spring resulted in maximum pasture
DM yield responses, but lower nitrogen response efficiencies and the possibility of a
reduction in clover content and thus pasture quality may limit the economic feasibility of such
treatments. According to this study, applications of 50 kg N ha-1 during any season will
result in the most efficient conversion of applied fertiliser into additional fodder during the
first regrowth cycle.
The overriding influence of climatic conditions and the resultant effect on the response
capacity of a perennial ryegrass-white clover pasture impede the creation of a fixed strategic
fertilisation programme. It is envisaged that clover content, quantity additional fodder
required and season of application to be the major factors that will dictate the rate of fertiliser
N recommended. Regression lines obtained shows great potential to develop regression
models instrumental in predicting the resultant pasture dry matter production as influenced by
selected environmental conditions and are presented in Table 7.2.
A clear limitation of this study is the absence of grazing animals for a period of eight months,
due to the continuous sampling of soil to monitor soil-N as an accidental sampling of urine
patches would render soil-N data not suitable for interpretation and N losses on grazed
pastures due to volatilization and denitrification may be much higher in grazed pastures
compared to cut swards (Whitehead, Pain & Ryden, 1986). Ball et al. (1978) however
reported that mean daily yields of a ryegrass-clover pasture grazed by sheep were strikingly
similar to results obtained from a mowed experiment in the same environment. In addition it
can be said that the fixed five week cutting cycle might have benefited the August and

135
September applications mainly because of increased pasture growth due to higher average
temperatures and increased day-length.
References
BALL, P.R., MOLLOY, L.F. & ROSS, D.J., 1978. Influence of fertiliser nitrogen on herbage
dry matter and nitrogen yields, and botanical composition of a grazed grass-clover
pasture. New Zealand Journal of Agricultural Research 21, 47-55.
BOTHA, P.R., 2002. Voervloeibeplanning vir ‘n tipiese suiweleenheid.
Weidingskursus:Inligttingsbundel. Suid-Kaap Landbou-ontwikkelingsentrum,
Departement Landbou Wes-Kaap. 118-125.
CARADUS, R.J., PINXTERHUIS, J.B., HAY, R.J.M., LYONS, T. & HOGLUND, J.H.,
1993. Response of white clover cultivars to fertilizer nitrogen. New Zealand Journal
of Agricultural Research 36, 285-295.
DRAPER, N.R. & SMITH, H., 1981. Applied Regression Analysis. 2nd ed. John Wiley &
Sons, New York, Chichester, Brisbane, Toronto, Singapore.
ECKARD, R.J., 1990. The relationship between the nitrogen and nitrate content and nitrate
toxicity potential of Lolium multiflorum. Journal of the Grassland Society of Southern
Africa 7, 174-178.
ECKARD, R.J., BARTHOLOMEW, P.E. & TAINTON, N.M., 1995. The yield response of
annual ryegrass (Lolium multiflorum) to varying nitrogen fertilizer application
strategies. South African Journal of Plant and Soil 12 (3), 112-116.
ECKARD, R.J. & FRANKS, D.R., 1998. Strategic nitrogen fertiliser use on perennial
ryegrass and white clover pasture in north-western Tasmania. Australian Journal of
Experimental Agriculture 38, 155-160.

136
FRAME, J., 1994. Soil fertility and grass production; nitrogen. In: J. Frame (ed.). Improved
Grassland Management. Farming Press Books, Redwood Press, Melksham, Wiltshire,
UK.
FRAME, J. & BOYD, A.G., 1987. The effect of strategic use of fertilizer nitrogen in spring
and/or autumn on the productivity of perennial ryegrass/white clover sward. Grass
and Forage Science 42, 429-438.
HATCH, D.J. & MACDUFF, J.H., 1991. Concurrent rates of N2 fixation, nitrate and
ammonium uptake by white clover in response to different root temperatures. Annals
of Botany 67, 265-274.
LAIDLAW, A.S., 1984. Quantifying the effect of nitrogen fertilizer applications in spring on
white clover content in perennial ryegrass-white clover swards. Grass and Forage
Science 39, 317-321.
MACDUFF, J.H. & DHANOA, M.S., 1990. N2 fixation and nitrate uptake by white clover
swards in response to root temperature in flowing solution culture. Annals of Botany
65, 325-335.
McKENZIE, F.R., JACOBS, J.L. & RYAN, M., 1998. Spring and autumn nitrogen fertiliser
effects, with and without phosphorus, potassium and sulphur, on dairy pastures: yield
and botanical composition. African Journal for Range and Forage Science 15, 102-
108.
McKENZIE, F.R., RYAN, M.J., JACOBS, J.L. & KEARNEY, G., 1999. Effect of rate and
time of nitrogen application from autumn to midwinter on perennial ryegrass-white
clover dairy pastures in western Victoria. 1. Growth and composition. Australian
Journal of Agricultural Research 50, 1059-1065.
OLSEN, R.A. & KURTZ, L.T., 1982. Crop nitrogen requirements, utilization and
fertilization. In F J Stevenson (ed.). Nitrogen in agricultural soils. Madison,
Wisconsin.

137
PHILLIPS, D.A. & DeJONG, T. M., 1984. Dinitrogen fixation in leguminous crop plants. In:
R D Hauck (ed.). Nitrogen in Crop Production. American Society of Agronomy, Crop
Science Society of America, Soil Science Society of America. Madison, Wisconsin
USA.
SCHILS, R.L.M., VELLINGA, Th.V. & KRAAK, T., 1999. Dry-matter yield and herbage
quality of perennial ryegrass/white clover sward in a rotational grazing and cutting
system. Grass and Forage Science 54, 19-29.
STOUT, W.l., WEAVER, R.S. & ELWINGER, G.F., 2001. Effects of early season nitrogen
on grass-clover swards in the Northern USA. Agronomy Journal 93, 1000-05.
THOMAS, R.J., 1992. The role of legumes in the nitrogen cycle of productive and sustainable
pastures. Grass and Forage Science 47, 133-142.
VAN HEERDEN, J.M. & DURAND, W., 1994. Influence of nitrogen fertilisation on forage
and animal production of a continuously grazed irrigated grass/clover pasture in the
Rûens area of the southern Cape. African Journal of Range and Forage Science 11
(3), 69-75.
WHITEHEAD, D.C., 1995. Legumes; Biological nitrogen fixation and interaction with
grasses. In‘Grassland Nitrogen’. P 48-51. CAB International: Wallingford, UK.
WHITEHEAD, D.C., PAIN, B.F. & RYDEN, J.C., 1986. Nitrogen in UK grassland
agriculture. Journal of the Royal Agricultural Society of England 147, 190-201.

138
Chapter 8
The effects of strategic nitrogen fertiliser application during the cool season
on perennial ryegrass-white clover pastures in the Western Cape Province
3. Clover content
Abstract
The influence of a single application of fertiliser N (0, 50, 100 and 150 kg N ha-1) applied in
either autumn, early winter, late winter, early spring or late spring on the grass-clover balance
in a perennial ryegrass-white clover pasture was studied over a three year period. Responses
were measured over two regrowth cycles five and ten weeks after the application of N
treatments.
Increased fertiliser N rates of up to 100 kg N ha-1 resulted in increasingly lower clover
percentages. No differences in clover content were recorded between the 100 and 150 kg N
ha-1 application rates five weeks after fertiliser N application. The effect of season of
application was inconsistent due mainly to different initial clover contents and differences in
environmental conditions amongst years. Partial recovery of clover content was noted at the
second re-growth cycle but not to the same levels as at the 0 kg ha-1 treatment combinations.
Fertiliser N did not reduce (P>0.05) total clover DM production (kg clover ha-1) over 10
weeks when applied in autumn and early winter. Clover DM yields were however reduced
(P=0.05) when fertiliser N was applied during early and late spring, excluding 50 kg N ha-1
applied during early spring 2000.
The application of 50 kg N ha-1 during the relatively normal rainfall years in 2000 and 2002
did not cause the clover content to drop below 30%. The application of 150 kg N ha-1 resulted
in numerous treatment combinations where the clover percentage were less than 30 %, the
recommended minimum for the pasture to benefit from the clover. Data obtained shows great
potential to develop regression models instrumental in predicting the resultant clover content
139
after application of selected fertiliser N rates to a perennial ryegrass-white clover pasture in
the Western Cape Province.
Keywords: clover percentage, perennial ryegrass/white clover, strategic nitrogen
Introduction
Clovers are included in ryegrass-clover pastures for various reasons. Firstly, a high proportion
of clover in the pasture improves pasture quality that results in increased milk, beef or wool
production. Eerens & Ryan (2000) reported that mixed ryegrass-white clover pastures
produced nearly 25% more dry matter, 40% (180 kg) more carcass weight and 25% (17kg)
more wool than ryegrass pastures receiving 270 kg N ha-1. Secondly, as a legume it is capable
of fixing large quantities of atmospheric nitrogen and through recycling nitrogen becomes
available for uptake by the ryegrass fraction (Martin 1960). Davidson & Robson (1990)
reported that ryegrass in a grass/clover mixture consistently had higher N contents than pure
grass grown in monoculture. Thirdly legumes improve seasonal distribution of the forage by
being more productive later in the year than the companion grass crop (Sleugh et al., 2000).
The only disadvantages of legumes in a pasture are the possibility of bloat in animals and the
poor predictability of legume performance (Miles & Manson, 2000).
To ensure ryegrass-clover pastures of acceptable quality and quantity the percentage clover
must remain between 30 and 50 percent on a dry matter basis (Martin, 1960). Pflimlin (1993,
cited by Schils, Vellinga & Kraak, 1999) suggest an optimal clover content of between 25 and
50% for rotational grazing. Curll (1982) recommend an average clover content of at least 30%
to have an impact on animal nutrition due to the superior feeding value of the clover plant.
Harris (1994) recommended a clover content of 45% during optimum growth conditions
(spring) to ensure optimum milk production per unit area and to ensure a 30% clover content
in winter. McKenzie & Jacobs (1997, cited by McKenzie et al. 1999) and McKenzie, Jacobs
& Ryan (1998) recommend a perennial ryegrass content of >50% when applying fertiliser N
to stimulate pasture productivity.
Boosting the soil N pool through the application of fertiliser N often results in a decrease in
the clover content of grass-clover pastures (Frame & Boyd, 1987; van Heerden & Durand,
1994; Stout, Weaver & Elwinger, 2001). Applying too high levels of nitrogen may reduce the
140
clover fraction to such low levels that the sward becomes N deficient later in the growing
season (Thomas, 1992; Caradus et al., 1993). Dennis & Woledge (1985) ascribed the
decreased clover portion to the increased competition for light brought on by the stimulated
growth of the grass, while Eckard (1994) cites the negative effect of fertiliser N on N2 fixation
as an additional cause of reduced clover content. Stout et al., (2001) found that the clover
content decreased by 17 percent if the target sward harvest height was increased from 150 to
300 mm in a study where between 22.4 and 89.6 kg N ha-1 were applied in spring.
Applying moderate levels of fertiliser N during the cool season, when white clover activity is
low, can increase DM production of grass-clover pastures without permanently suppressing
clover growth (Laidlaw, 1980; Stout, et al., 2001). Laissus (1983, cited by Frame, 1987),
agreed that fertiliser N use in spring can be profitable on swards with a reasonably high
proportion of white clover but stressed the depressive effect of N late in spring as well as the
intensified depressive effect on soils with high water-holding capacities and compact ‘cold’
soils. The value of the increased herbage production from fertiliser N must be weighed against
the decline in white clover performance during the season and possibly thereafter.
The aims of the study were to develop a better understanding of the effect of a strategic N
fertiliser application during the cool season on the grass-clover balance and to identify
possible management guidelines (scenarios) that would maximise dry matter production
without suppressing clover content to values lower than required to maintain the benefit of
clover in the pasture.
Materials and methods
General procedures.
A field experiment was conducted during the period 2000-2002 at Elsenburg to determine the
effect of a single application of four fertiliser N rates (0, 50, 100 and 150 kg N ha-1) applied
annually in either autumn, early winter, late winter, early spring or late spring on soil
inorganic nitrogen content, pasture composition and quality as well as dry matter production
of a perennial rye grass-white clover pasture. Details on the experimental site, experimental
design, lay-out, treatments and data analyses are presented in Chapter 5.

141
Clover content
Fresh herbage samples of approximately 300 g wet material were collected from each
treatment combination at harvesting following each of two consecutive re-growth cycles at
five and ten weeks after the application of N treatments. Clover content was determined
through dividing the sample into clover and grass fractions that were then dried for 72 h at 60
°C and dry weight recorded.
Primary- and Residual Clover Percentage were determined five and ten weeks after fertiliser
N application respectively using the formula:
Clover % = (Clover dry mass / (Clover dry mass + Ryegrass dry mass))*100
The absolute clover content was calculated using the formula:
Absolute clover content (kg ha-1) = DM production (kg ha-1) * clover %
Results and Discussion
Primary Clover Percentage (PCP)
Highest mean PCP was recorded in 2002 (42.24%) followed by 2000 (38.75%) and 23.52% in
2001 (Table 8.1). The low clover content in 2001 could be due to a combination of two
factors. Firstly, moisture stress during late summer 2001 (pastures were not irrigated due to
pump failure) might reduced the clover content at the start of the cool season, because root
nodules have been shown to senescence under dry soil conditions reducing clover growth
potential (Chu & Robertson, 1974). Evans (1978) and Thomas (1984, cited by Frame & Boyd,
1987) also found that white clover production fell by a mean of 78%, while ryegrass
production increased by 25%, under dry conditions suggesting the smaller root mass of clover
in comparison to perennial ryegrass as the possible cause. Secondly, the above average
rainfall during the cool season most probably, could have resulted in prolonged water logging
of soils in the trial area. These conditions could also reduced clover growth due to the possible
adverse effects on the N fixing bacteria.

142
Table 8.1 Primary clover percentage (PCP) (percentage clover on a DM basis) of a perennial
ryegrass-white clover pasture after the first regrowth cycle (5 weeks) at Elsenburg
Year 2000 Fertiliser N rate (kg ha-1) Season of application 0 50 100 150 Mean (S) Autumn 66.47 49.79 47.06 39.65 50.75 a Early winter 55.48 46.89 41.07 39.12 45.64 ab Late winter 52.91 36.24 32.66 26.31 37.03 bc Early spring 47.4 29.06 21.18 19.04 29.17 c Late spring 50.42 32.24 22.02 20.00 31.17 c Mean (N) 54.53 a** 38.84 b 32.80 c 28.82 c 38.75 LSD (0.05) NxS = NS LSD (0.05) S = 10.457 LSD (0.05) N = 5.3505 CV = 21.68
Year 2001 Autumn 26.79 cd* 7.89 hij 4.69 ij 3.46 j 10.71 d Early winter 40.79 b 21.61 def 15.25 fg 14.90 fgh 23.14 c Late winter 52.73 a 28.13 cd 17.38 efg 11.26 ghi 27.38 ab Early spring 51.17 a 22.84 cde 18.24 efg 13.43 gh 26.42 bc Late spring 47.24 ab 28.83 c 21.21 def 22.48 cde 29.94 a Mean (N) 43.75 a 21.86 b 15.35 c 13.11 c 23.52 LSD (0.05) NxS = 7.1768 LSD (0.05) S = 3.4255 LSD (0.05) N = 3.2096 CV = 21.43
Year 2002 Autumn 56.62 49.86 37.11 36.7 45.07 a Early winter 47.99 34.41 25.11 19.54 31.76 b Late winter 64.26 48.37 42.17 34.82 47.40 a Early spring 65.76 43.43 36.43 33.87 44.87 a Late spring 62.81 36.45 33.64 35.54 42.11 a Mean (N) 59.49 a 42.50 b 34.89 c 32.09 c 42.24 LSD (0.05) NxS = NS LSD (0.05) S = 5.8449 LSD (0.05) N = 4.7928 CV = 17.81 *Means in the same year followed by the same letter are not signifficantly different (P=0.05) **Means(bold) in the same year, column or row, followed by the same letter are not significantly different (P=0.05)
Increased fertiliser N rates resulted in increasingly lower clover percentages irrespective of
season of application (Table 8.1) during all years covered by the study. Mean PCP of

143
treatments at the 0 kg N ha-1 rates were significantly higher than treatments receiving fertiliser
N while the lowest (P=0.05) PCP values were found where 100 and 150 kg N ha-1 were
applied.
PCP tends to decrease from late autumn to early spring in 2000 and late winter to late spring
in 2002. In contrast, mean PCP tended to increase as season progressed in 2001 possibly as a
result of clover recovering from the adverse conditions that prevailed during late summer. The
decrease in PCP in 2000 and 2002 may be the result of overshadowing of clover by grass
stimulated by fertiliser N, high soil-N levels (Chapter 6), as well as low N fixing rates of
Rhizobia during the cooler months (Dennis & Wolledge, 1985; Wolledge, 1988).
Although a significant interaction (P<0.05) between season of application and fertiliser N rate
was recorded in 2001, Table 8.1 clearly shows that increased fertiliser N rates resulted in a
reduction in clover content over all seasons of N application. No differences (P>0.05) in
clover content between 100 and 150 kg N ha-1 applied during the same season in 2001 were
recorded, however the application of 50 kg N ha-1 resulted in a lower (P=0.05) clover content
compared to the treatments that received no nitrogen during the same season.
During years 2000 and 2002 when the initial clover percentage (in autumn) was high (66.47
and 56.62% respectively) the clover percentage at the 0 kg N ha-1 treatments over season of
application remained high with only early spring in 2000 and early winter in 2002 having
clover percentages of less than 50 percent. This resulted in the majority of treatment
combinations maintaining a clover content of 30% and more. The treatment combinations
resulting in less than 30% clover were those where 50 kg N ha-1 was applied in early spring
2000; where 100 kg N ha-1 was applied in early and late spring 2000 or early winter 2002; and
where 150 kg N ha-1 was applied in late winter, early and late spring 2000 as well as early
winter 2002.
The initial clover percentage in autumn 2001 was low (26.79 %) at the 0 kg N ha-1 treatments
due to water stress as already mentioned, but increased to levels comparable to those achieved
in 2000 as season progressed to late spring. The suppressive effect of N, whether direct or
indirect, on clover percentage was however much more pronounced causing clover
percentages of less than 30 % in all treatments that received fertiliser N.

144
In an attempt to predict the possible effect of fertiliser N rate on the resultant clover
percentage at the end of the first regrowth cycle regression functions were fitted to establish
the best option (Draper & Smith, 1981). The linear function (y = a + b1x1 + b2x2) was decided
on (Table 8.2). The funtion shows great potential to be instrumental in predicting the clover
content at the end of the first regrowth cycle as a result of the N rate applied. The predicted
clover content should be within the prescribed 30 – 50% range as suggested by Martin (1960).
This method will exclude certain N rates, however final N rate will also be a function of the
season of application, N response efficiencies and quantity additional fodder required.
Table 8.2. Relationship between predicted RCP (%) (Y), initial clover percentage (%) (X1)
and fertiliser N rate (kg N ha-1) (X2) in a perennial ryegrass-white clover pasture grown under
irrigation in the Western Cape Province
Year* Season Predicted primary clover percentage (%) r2
2000 Autumn Y = -33.828 + 1.410(X1) + 0.257 (X2) - 0.007(X1*X2) 0.56 Early winter Y = 18.626 + 0.523(X1) - 0.066(X2) - 0.0003(X1*X2) 0.65 Late winter Y = 25.230 + 0.448(X1) - 0.296(X2) + 0.003(X1*X2) 0.74 Early spring Y = - 5.478 + 0.939(X1) - 0.045(X2) - 0.003(X1*X2) 0.86 Late spring Y = 57.057 - 0.224(X1) - 0.387(X2) + 0.004(X1*X2) 0.80
2001 Autumn Y = 25.286 - 0.181(X1) - 0.214(X2) + 0.003(X1*X2) 0.65 Early winter Y = 22.238 + 0.504(X1) + 0.003(X2) - 0.006(X1*X2) 0.68 Late winter Y = 24.310 + 0.582(X1) - 0.255(X2) - 0.0003(X1*X2) 0.90 Early spring Y = - 15.216 + 1.180(X1) + 0.085(X2) - 0.006(X1*X2) 0.84 Late spring Y = 97.089 - 1.034(X1) - 0.995(X2) + 0.015(X1*X2) 0.79
2002 Autumn Y = - 26.920 + 1.220(X1) + 0.190(X2) - 0.005(X1*X2) 0.75 Early winter Y = 44.991 + 0.020(X1) - 0.340(X2) + 0.003(X1*X2) 0.72
Late winter Y = 51.351 + 0.185(X1) - 0.337(X2) + 0.004 (X1*X2) 0.66 Early spring Y = 39.974 + 0.350(X1) - 0.721(X2) +0.008(X1*X2) 0.81 Late spring Y = -28.109 + 1.270(X1) - 0.064(X2) - 0.002(X1*X2) 0.62 * Parameter values were not averaged over years as years 2000 and 2002 were characterised by a general
decrease and increase in clover content between autumn and spring, respectively.
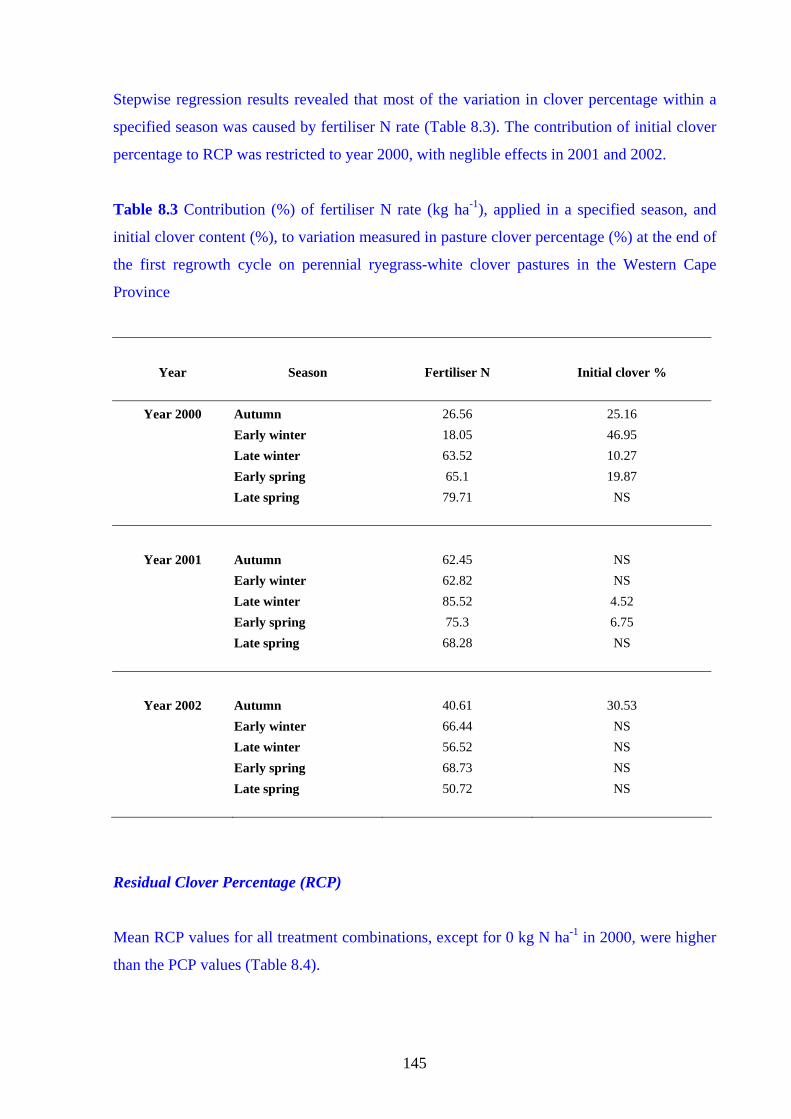
145
Stepwise regression results revealed that most of the variation in clover percentage within a
specified season was caused by fertiliser N rate (Table 8.3). The contribution of initial clover
percentage to RCP was restricted to year 2000, with neglible effects in 2001 and 2002.
Table 8.3 Contribution (%) of fertiliser N rate (kg ha-1), applied in a specified season, and
initial clover content (%), to variation measured in pasture clover percentage (%) at the end of
the first regrowth cycle on perennial ryegrass-white clover pastures in the Western Cape
Province
Year Season Fertiliser N Initial clover %
Year 2000 Autumn 26.56 25.16
Early winter 18.05 46.95 Late winter 63.52 10.27 Early spring 65.1 19.87 Late spring 79.71 NS
Year 2001 Autumn 62.45 NS Early winter 62.82 NS Late winter 85.52 4.52 Early spring 75.3 6.75 Late spring 68.28 NS
Year 2002 Autumn 40.61 30.53 Early winter 66.44 NS Late winter 56.52 NS Early spring 68.73 NS Late spring 50.72 NS
Residual Clover Percentage (RCP)
Mean RCP values for all treatment combinations, except for 0 kg N ha-1 in 2000, were higher
than the PCP values (Table 8.4).

146
Table 8.4 Residual clover percentage (RCP) (percentage clover on a DM basis) of a perennial
ryegrass-white clover pasture after the second re-growth cycle (10 weeks) at Elsenburg
Year 2000 Fertiliser N rate (kg ha-1) Season of application 0 50 100 150 Mean (S) Autumn 55.48 47.21 46.95 43.82 48.37 a** Early winter 52.91 49.06 43.39 36.11 45.37 ab Late winter 47.4 38.93 35.58 22.41 36.08 bc Early spring 50.42 35.79 23.44 19.99 32.41 c Late spring 57.42 41.44 30.11 27.05 39.00 abc Mean (N) 52.73 a 42.48 b 35.89 c 29.88 d 40.25 LSD (0.05) NxS = NS LSD (0.05) S = 9.6844 LSD (0.05) N = 4.2662 CV = 16.64
Year 2001 Autumn 40.79 cd* 19.57 hij 10.19 kl 8.71 l 19.81 c Early winter 52.73 ab 30.92 efg 15.12 jkl 11.75 jkl 27.69 b Late winter 51.17 ab 41.17 cd 25.37 ghi 13.96 jkl 32.92 b Early spring 47.24 bc 27.22 fgh 20.31 hij 17.50 ijk 28.07 b Late spring 58.36 a 46.33 bc 35.79 def 39.30 cde 44.94 a Mean (N) 50.06 a 33.04 b 21.35 c 18.24 c 30.67 LSD (0.05) NxS = 8.6535 LSD (0.05) S = 7.5803 LSD (0.05) N = 3.8699 CV = 19.81
Year 2002 Autumn 47.99 efgh 47.11 efghi 36.69 ijkl 30.96 klm 40.69 b Early winter 64.26 ab 45.65 fghi 30.76 klm 25.59 m 41.57 b Late winter 65.76 ab 53.02 cdefg 44.18 ghij 27.02 lm 47.49 b Early spring 62.81 abc 55.60 bcdef 39.92 hijk 34.48 jklm 48.20 b Late spring 71.05 a 58.90 bcd 50.53 defg 57.06 bcde 59.39 a Mean (N) 62.37 a 52.06 b 40.41 c 35.02 d 47.47 LSD (0.05) NxS = 10.432 LSD (0.05) S = 7.8005 LSD (0.05) N = 4.6652 CV = 15.43 *Means in the same year followed by the same letter are not signifficantly different (P=0.05) **Means(bold) in the same year, column or row, followed by the same letter are not significantly different (P=0.05)
147
These results confirmed earlier findings (Frame, 1987) showing that decreases in clover
content due to fertiliser N applications were followed by a partial recovery of clover content
later in the season.
RCP values showed the same trend as PCP namely the highest mean clover percentage in
2002 (47.47%) and the lowest (30.67%) in 2001 (Table 8.4).
The highest mean RCP values were recorded where no fertiliser N was applied. Residual
clover percentage tends to decrease as fertiliser N rate increases. The magnitude of this
decrease however differed between years and seasons of application.
The highest RCP was recorded during late spring in 2001 and 2002, a reaction anticipated
because clover requires higher temperatures than ryegrass to reach maximum growth rates
(Williams, 1970 cited by Frame & Newbould, 1986). RCP measured in the late spring of 2000
did not differ (P>0.05) from RCP in other seasons of the same year. Due to inconsistent
results, the seasons of application that resulted in the lowest clover content could not be
established. Differences in initial clover content, climatic conditions (high rainfall in 2001)
and carryover fertiliser N might have attributed to this inconsistency.
Although a significant interaction between fertiliser N rate and season of application was
recorded in 2001 and 2002, an increase in fertiliser N rate resulted in decreases in clover
content in all seasons. The only exception was a non-significant increase in clover content
between 100 and 150 kg N ha-1 applied in late spring in both years. The application of 50 kg
N ha-1 in 2001 resulted in a decrease (P=0.05) in clover content relative to treatments
receiving no fertiliser N. Similar results were obtained in winter (early and late) and late
spring in 2002. The only significant (P=0.05) difference in clover content found between the
100 and 150 kg N ha-1 application rates were during late winter in both years. The highest
clover contents in 2001 and 2002 tend to be where 0 or 50 kg N ha-1 were applied in late
winter or spring.
The percentage clover of treatments that received fertiliser N was always less than that of the
0 kg N ha-1 treatments emphasising the suppressive effect of fertiliser N on clover relative to
grass production. Whether this suppressive effect is direct, by causing a reduction in clover
growth or indirect, through increased competitiveness of the ryegrass fraction is still to be

148
determined. Results from the glasshouse studies however revealed that fertiliser N
applications of up to 180 kg N ha-1 did not suppress clover production (Chapter 3). The
measured reduction in clover percentage (percentage points) after fertiliser N application
during the different seasons at the Institute for Plant Production Elsenburg is summarised in
Table 8.5. The application of fertiliser N will result in the least reduction of clover percentage
if applied in autumn and early winter. The highest reductions in clover content were observed
with fertiliser N applications in spring (2000 and 2002) and late winter, early spring 2001.
Increased fertiliser N rate resulted in increased suppression of the clover content. This clearly
shows the negative effects of injudicious application of fertiliser N on the clover content of
pastures.
The recovery of white clover following fertiliser N application depends both on the fertiliser
N rate and season of application (Figure 8.1).
Increasing the fertiliser N rate to 150 kg N ha-1 resulted in increasingly lower clover contents
however in the study even the 150 kg N ha-1 recovered to levels comparable to the 0 kg N ha-1
levels although recovery time between fertiliser rates differed. After recovery the clover
percentage of the treatments that received fertiliser N tend to be higher than the 0 kg N ha-1
treatments.
The recovery period for the 50 and 100 kg N ha-1 treatments to the same clover percentages as
at the 0 kg N ha-1 treatments, especially in autumn, early and late winter tend to be shorter
than at the 150 kg N ha-1 treatments. It is however important to realise that the recovery of
clover to the same levels as at the 0 kg N ha-1 treatments may extent over months after N
application. The consequences of injudicious application of fertiliser N can be eminent over
several months after fertiliser N application.
Decreases, relative to 0 kg N ha-1, in PCP as a result of fertiliser N application in the current
study tends to be highest in spring and lowest in autumn and early winter (Table 8.5).

149
Autumn
01020304050607080
25-Apr
05-Jun
12-Jul
22-Aug
27-Sep
25-Oct
21-Nov
19-Dec
05-Mar
03-Apr
Clov
er %
N0N50N100N150
Early winter
01020304050607080
25-Apr
05-Jun
12-Jul
22-Aug
27-Sep
25-Oct
21-Nov
19-Dec
05-Mar
03-Apr
Clov
er %
N0N50N100N150
Late winter
01020304050607080
25-Apr
05-Jun
12-Jul
22-Aug
27-Sep
25-Oct
21-Nov
19-Dec
05-Mar
03-Apr
Clo
ver
%
N0N50N100N150
Early spring
01020304050607080
25-Apr
05-Jun
12-Jul
22-Aug
27-Sep
25-Oct
21-Nov
19-Dec
05-Mar
03-Apr
Clo
ver %
N0N50N100N150
Late spring
01020304050607080
25-Apr
05-Jun
12-Jul
22-Aug
27-Sep
25-Oct
21-Nov
19-Dec
05-Mar
03-Apr
Clo
ver
%
N0N50N100N150
Autumn
01020304050607080
03-Apr
08-May
12-Jun
24-Jul
28-Aug
02-Oct
05-Nov
10-Dec
14-Jan
26-Feb
30-Apr
Clo
ver
%
N0N50N100N150
Early winter
01020304050607080
03-Apr
08-May
12-Jun
24-Jul
28-Aug
02-Oct
05-Nov
10-Dec
14-Jan
26-Feb
30-Apr
Clov
er %
N0N50N100N150
Late winter
01020304050607080
03-Apr
08-May
12-Jun
24-Jul
28-Aug
02-Oct
05-Nov
10-Dec
14-Jan
26-Feb
30-Apr
Clo
ver
%
N0N50N100N150
Early spring
01020304050607080
03-Apr
08-May
12-Jun
24-Jul
28-Aug
02-Oct
05-Nov
10-Dec
14-Jan
26-Feb
30-Apr
Clo
ver
%
N0N50N100N150
Late spring
01020304050607080
03-Apr
08-May
12-Jun
24-Jul
28-Aug
02-Oct
05-Nov
10-Dec
14-Jan
26-Feb
30-Apr
Clo
ver
%
N0N50N100N150
Autumn
01020304050607080
30-Apr
03-Jun
04-Jul
07-Aug
12-Sep
16-Oct
21-Nov
17-Dec
28-Jan
04-Mar
Clov
er %
N0N50N100N150
Early winter
01020304050607080
30-Apr
03-Jun
04-Jul
07-Aug
12-Sep
16-Oct
21-Nov
17-Dec
28-Jan
04-Mar
Clov
er %
N0N50N100N150
Late winter
01020304050607080
30-Apr
03-Jun
04-Jul
07-Aug
12-Sep
16-Oct
21-Nov
17-Dec
28-Jan
04-Mar
Clo
ver
%
N0N50N100N150
Early spring
01020304050607080
30-Apr
03-Jun
04-Jul
07-Aug
12-Sep
16-Oct
21-Nov
17-Dec
28-Jan
04-Mar
Clo
ver
%
N0N50N100N150
Late spring
01020304050607080
30-Apr
03-Jun
04-Jul
07-Aug
12-Sep
16-Oct
21-Nov
17-Dec
28-Jan
04-Mar
Clo
ver
%
N0N50N100N150
Year 2000 Year 2001 Year 2002
Figure 8.1 Long term effect of fertiliser N application rate (0, 50, 100 and 150 kg N ha-1) and season of application on the percentage clover in a perennial ryegrass-white clover pasture at Elsenburg (Fertiliser N application : )
Fertiliser N (kg ha-1) applied in autumn
Fertiliser N (kg ha-1) applied in early winter
Fertiliser N (kg ha-1) applied in late winter
Fertiliser N (kg ha-1) applied in early spring
Fertiliser N (kg ha-1) applied in late spring

150
Table 8.5 Decrease in clover content (percentage points) in a perennial ryegrass-white clover
pasture as a result of fertiliser N application during different seasons at Elsenburg during
the period 2000 – 2002
Year 2000
Fertiliser N rate (kg N ha-1) Season of application 50 100 150 Mean (S) Autumn 16.68 19.39 26.81 20.96 Early winter 8.60 14.41 16.37 13.13 Late winter 16.67 20.25 26.60 21.17 Early spring 18.34 26.22 28.36 24.31 Late spring 18.18 28.39 30.43 25.67 Mean (N) 15.69 21.73 25.71 21.05
Year 2001 Autumn 18.91 22.10 23.33 21.45 Early winter 19.18 25.54 25.88 23.53 Late winter 24.60 35.35 41.47 33.81 Early spring 28.34 32.93 37.74 33.00 Late spring 18.41 26.03 24.76 23.07 Mean (N) 21.89 28.39 30.63 26.97
Year 2002 Autumn 6.77 19.51 19.92 15.40 Early winter 13.57 22.87 28.44 21.63 Late winter 15.89 22.10 29.44 22.48 Early spring 22.33 29.33 31.90 27.85 Late spring 26.35 29.17 27.27 27.60 Mean (N) 16.98 24.60 27.39 22.99 No statistical analysis was done on this data as analysis was done on clover percentage.
Absolute clover content (ACC)
Many studies compared annual or seasonal yields of clover in a mixed sward given fertiliser
N with those given none to demonstrate the adverse effects of N on the legume (Chestnutt &
Lowe, 1970; Frame & Newbould, 1986). Not much attention was given to the absolute clover
content (ACC) and whether it was increasing, decreasing or remaining unchanged. ACC
therefore relates to the ability of the clover component to maintain productivity levels,
irrespective of the influence of the companion ryegrass component, under the conditions that

151
prevailed during the years covered by the study. The highest mean ACC of 1432.57 kg ha-1
was recorded in 2002, followed by 1210.3 kg ha-1 in 2000 and the lowest of 728.08 kg ha-1 in
2001 (Table 8.6).
Table 8.6 Accumulative (absolute) white clover DM production (kg DM ha-1) over a ten week
period following fertiliser N application in a perennial ryegrass-white clover pasture at
Elsenburg
Year 2000 Fertiliser N rate (kg N ha-1)
Time of application 0 50 100 150 Mean (S) Autumn 1837.0 1604.3 1622.8 1557.8 1655.5 a Early winter 1108.9 1018.6 1015.1 1027.2 1042.4 b Late winter 1264.6 1122.7 1129.1 905.1 1105.4 b Early spring 1430.1 1176.1 939.0 843.6 1097.2 b Late spring 1548.1 1191.3 885.5 979.0 1151.0 b Mean (N) 1437.73 a 1222.60 b 1118.31 bc 1062.52 c 1210.3 LSD (0.05) NxS = NS LSD (0.05) S = 250.32 LSD (0.05) N = 136.65 CV = 17.73
Year 2001 Autumn 358.3 ghi* 224.3 hi 163.0 i 160.4 i 226.49 e Early winter 505.1 efg 517.7 efg 422.7 fgh 405.4 fgh 462.73 d Late winter 1039.3 bc 960.6 bc 680.2 de 480.3 efg 790.07 c Early spring 1555.8 a 921.6 bc 809.9 cd 625.9 def 978.28 b Late spring 1464.0 a 1135.3 b 1024.8 bc 1107.1 b 1182.82 a Mean (N) 984.51 a 751.89 b 620.12 c 555.81 c 728.08 LSD (0.05) NxS = 238.98 LSD (0.05) S = 147.56 LSD (0.05) N = 106.87 CV = 23.05
Year 2002 Autumn 1064.9 f 1057.5 f 886.1 fgh 949.5 fg 989.49 c Early winter 676.9 ghi 615.6 hi 529.7 i 522.2 i 586.09 d Late winter 1609.6 de 1491.0 e 1429.1 e 1092.4 f 1405.53 b Early spring 2566.0 a 2231.7 b 1822.0 cd - 2085.55 a Late spring 2675.9 a 1886.7 cd 1715.4 de 2106.7 bc 2096.18 a Mean (N) 1718.66 a 1456.48 b 1276.46 c 1278.67 c 1432.57 LSD (0.05) NxS = 297.52 LSD (0.05) S = 156.35 LSD (0.05) N = 133.05 CV = 14.58 *Means in the same year followed by the same letter are not signifficantly different (P=0.05) **Means(bold) in the same year, column or row, followed by the same letter are not significantly different (P=0.05)

152
The extremely low ACC values in 2001 may be the result of the adverse environmental
conditions as discussed earlier. The relative low soil K content (Table 5.1) could also
contributed to the lower clover productivity as clover roots have lower cation exchange
capacities than grasses resulting in clover experiencing K deficiencies at levels still sufficient
to maintain high grass production (Havlin et al., 1999).
Increased fertiliser N rates resulted in increasingly lower mean ACC values during all three
years covered by the study. Mean ACC values decreased as fertiliser N rate increased with no
differences (P>0.05) in mean ACC values recorded between the 100 and 150 kg N ha-1
application rates. Treatments that did not receive fertiliser N resulted in the highest (P=0.05)
ACC values.
The ACC values in 2001 and 2002 showed a slight increase from late autumn to spring with
no trend visible in 2000.
A significant interaction between fertiliser N application and season of application was noted
in 2001 and 2002. Application of fertiliser N in autumn and early winter in 2001 and 2002 did
not significantly reduced clover DM content (Table 8.6). Soil temperatures during the cooler
months remained between 9 and 13 °C for a considerable time (Table 6.1). These low
temperatures could result in a reduction in clover activity (MacDuff & Dhanoa, 1990; Hatch
& MacDuff, 1991) and therefore reduce the magnitude of the negative effect of fertiliser N, if
any, on clover productivity. The reversed situation occurred during early and late spring
where all fertiliser N rates tend to cause significant reductions in ACC, confirming that clover
DM production was negatively affected as a result of the stimulation of ryegrass productivity
following fertiliser N application in spring. These results suggest that the application of
increased fertiliser rates applied in autumn and early winter will probably not reduce clover
DM content, but rather stimulate grass productivity (higher N resulted in lower clover
percentage) and therefore resulted in less pronounced changes to absolute clover content.
Early and late spring fertiliser N applications may however tend to reduce ACC. These results
are similar to those reported by Ball, Molloy & Ross (1978). Late winter applications of 150
kg N ha-1 reduced (P=0.05) ACC relative to treatments receiving no fertiliser N in both 2001
and 2002.
153
In general, clover content increased as temperatures increased (Tables 8.1 & 8.2) during late
winter and early spring in treatments that received no fertiliser N. The increased clover
fraction might be either the result of higher temperatures that stimulate clover growth
(Davidson & Robson, 1990) and symbiotic N fixation (Russell, 1988) and/or a reduction in
ryegrass production because of low nitrogen availability to the ryegrass fraction, due to a lack
in return of excreta by grazing animals. Increased N mineralisation with rising temperatures
will increase supply of N to ryegrass but it may be too low to maximise ryegrass growth.
Mean decreases over seasons of application, in ACC relative to 0 kg N ha-1 were 4.73, 3.75
and 2.39 kg DM kg-1 N applied for 50, 100 and 150 kg N ha-1 respectively. Mean decreases in
clover content over all fertiliser N rates were 1.92, 0.92, 2.57, 6.83 and 6.68 kg DM kg-1 N
applied in autumn, early-, late winter, early- and late spring. These results supported those of
Frame & Boyd (1987) who reported decreases in absolute white clover content of 16.0, 7.6
and 6.3 kg DM if 25, 50 and 75 kg N were applied per hectare compared to 0 kg N ha-1. In the
same study the white clover production declined by 0.6 and 9.1 kg DM for every kg N ha-1
applied in autumn and in spring respectively.
The increase in mean clover content in 2002 as compared to 2001 in this study is in
accordance with results reported by several authors. Davidson & Robson (1990) reported a
5% increase in clover content where the equivalent of 80 kg N ha-1 was applied and 29%
where no N was applied to ryegrass-clover mixtures grown under controlled conditions.
Frame & Boyd (1987) however stress the point that white clover under grazing is more
subjected to competition from grasses and grazed pastures are likely to have lower clover
content compared to mowed pastures. In addition, under permanent grazing conditions clover
content tends to decrease (Schils, Vellinga & Kraak, 1999) due to the increased supply of N
through decomposition of trampled forage and recycling of N by the grazing animal. Frame &
Peterson (1987) stated that if the soil N becomes depleted due to continuous crop removal
(silage) the clover performance would be sustained or even improved. The N made available
through recycling seems to benefit the ryegrass to the disadvantage of the clover component.
In this study the lack of re-circulation could cause sub optimum ryegrass leaf N contents,
especially during spring. This might give ryegrass a competitive disadvantage to clover.
Schils, Vellinga & Kraak (1999) reported a 12% higher mean clover percentage when the
pasture was mowed and forage removed compared to rotational grazing plus mowing. The

154
same study showed a 6% reduction in clover percentage where 50 kg N ha-1 was applied as
compared to no fertiliser N application.
Conclusion
Increasing fertiliser N application rate resulted in decreases in pasture clover percentage. The
effect of season of application was inconsistent and was influenced by climatic and
environmental conditions such as rainfall and pasture productivity.
This study showed that in years when moisture stress due to drought or waterlogging do not
occur, 50 kg N ha–1 did not reduce the clover content to less than 30% during any season if an
initial clover content of at least 47% was present before fertiliser N application. The
application of 100 and 150 kg N ha–1 resulted in lower clover contents than the 50 kg N ha–1
treatments, but at various treatment combinations remained well above the minimum of 30%
clover. The application of 150 kg N ha-1 in the current study resulted in numerous treatment
combinations to have clover percentages of less than 30%, the minimum required to maintain
the benefit of the clover in the pasture. Winter applications of 150 kg N ha-1 resulted in clover
percentages to decrease to less than 30 percent possibly as clover percentages were naturally
low in winter. Initial clover content of the pasture, the season when N application is planned
and pasture productivity will dictate the fertiliser N rate to be applied.
The application of fertiliser N to a pasture exposed to adverse environmental conditions that
resulted in tiller and stolon deaths is not recommended because studies done under controlled
conditions (Chapters 2 & 3) showed that only ryegrass will benefit through the production of
daughter tillers.
References
BALL, P.R., MOLLOY, L.F. & ROSS, D.J., 1978. Influence of fertiliser nitrogen on herbage
dry matter and nitrogen yields, and botanical composition of a grazed grass-clover
pasture. New Zealand Journal of Agricultural Research 21, 47-55.

155
CARADUS, R.J., PINXTERHUIS, J.B., HAY, R.J.M., LYONS, T. & HOGLUND, J.H.,
1993. Response of white clover cultivars to fertilizer nitrogen. New Zealand Journal
of Agricultural Research 36, 285-295.
CHESTNUTT, D.M. & LOWE, J., 1970. Review of the agronomy of white clover-grass
swards. In: J. Lowe (ed.). White clover Research, Occasional Symposium, No 6,
Brittish Grassland Society 191-213.
CHU, A.C.P & ROBERTSON, A.G., 1974. The effects of shading and defoliation on
nodulation and nitrogen fixation by white clover. Plant and Soil 41, 509-519.
CURLL, M.L., 1982. The grass and clover content of pastures grazed by sheep. Herbage
Abstracts 52, 403-411.
DAVIDSON, I.A. & ROBSON, M.J., 1990. Short-term effects of nitrogen on the growth and
nitrogen nutrition of small swards of white clover and perennial ryegrass in spring.
Grass and Forage Science 45, 413-421.
DENNIS, W.D. & WOLEDGE, J., 1985. The effect of nitrogenous fertilizer on the
photosynthesis and growth of white clover/perennial ryegrass swards. Annals of
Botany 55, 171-178.
DRAPER, N.R. & SMITH, H., 1981. Applied Regression Analysis. 2nd ed. John Wiley &
Sons, New York, Chichester, Brisbane, Toronto, Singapore.
ECKARD, R. J., 1994. The nitrogen economy of three irrigated temperate grass pastures with
and without clover in Natal. Ph.D Thesis. The University of Natal, Pietermaritzburg.
South Africa.
EERENS, J.P.J & RYAN, D.L., 2000. Managing white clover for productive and profitable
sheep farming in Southland. Proceedings of the New Zealand Grassland Association
62, 137-140.

156
EVANS, P.S., 1978. Plant root distribution and water use patterns of some pasture and crop
species. New Zealand Journal of Agricultural Research 21, 261-265.
FRAME, J. 1987. The effect of strategic fertilizer nitrogen and date of primary harvest on the
productivity of perennial ryegrass/white clover sward. Grass and Forage Science 42,
33-42.
FRAME, J. & BOYD, A.G., 1987. The effect of strategic use of fertilizer nitrogen in spring
and/or autumn on the productivity of perennial ryegrass/white clover sward. Grass
and Forage Science 42, 429-438.
FRAME, J. & NEWBOULD, P., 1986. Agronomy of white clover. Advances in Agronomy
40, 1-88.
FRAME, J. & PETERSON, D.J., 1987. The effect of strategic nitrogen application and
defoliation systems on the productivity of a perennial ryegrass/white clover sward.
Grass and Forage Science 42, 271-280.
HARRIS, S.L., 1994. Nitrogen and white clover. Dairy Research Corporation, Hamilton. Pp
22-27.
HATCH, D.J. & MACDUFF, J.H., 1991. Concurrent rates of N2 fixation, nitrate and
ammonium uptake by white clover in response to different root temperatures. Annals
of Botany. 67, 265-274.
HAVLIN, J.L., BEATON, J.D., TISDALE, S.L. & NELSON W.L., 1999. Soil Fertility and
Fertilizers. 6th edition. Prentice-Hall inc. New Jersey.
LAIDLAW, A.S., 1980. The effects of nitrogen fertilizer applied in spring on swards of
ryegrass sown with four cultivars of white clover. Grass and Forage Science 35, 295-
299.
MARTIN, T.W., 1960. The role of white clover in grassland. Herbage Abstracts 30. 159-164.

157
MACDUFF, J.H. & DHANOA, M.S., 1990. N2 fixation and nitrate uptake by white clover
swards in response to root temperature in flowing solution culture. Annals of Botany
65, 325-335.
McKENZIE, F.R., JACOBS, J.L. & RYAN, M., 1998. Spring and autumn nitrogen fertiliser
effects, with and without phosphorus, potassium and sulphur, on dairy pastures: yield
and botanical composition. African Journal of Range and Forage Science 15, 102-
108.
McKENZIE, F.R., RYAN, M.J., JACOBS, J.L. & KEARNEY, G., 1999. Effect of rate and
time of nitrogen application from autumn to midwinter on perennial ryegrass-white
clover dairy pastures in western Victoria. 1. Growth and composition. Australian
Journal of Agricultural Research 50, 1059-1065.
MILES, N. & MANSON, A.D., 2000. Nutrition of planted pastures. In: N. Tainton (ed.).
Pasture Management in South Africa. University of Natal Press, Pietermaritzburg.
RUSSELL, E.W., 1988. Russell’s Soil Conditions and Plant Growth. 11th edition. A. Wild
(ed.). Longman: London, New York.
SCHILS, R.L.M., VELLINGA, Th.V. & KRAAK T., 1999. Dry-matter yield and herbage
quality of perennial ryegrass/white clover sward in a rotational grazing and cutting
system. Grass and Forage Science 54, 19-29.
SLEUGH, B., MOORE, K.J., GEORGE, J.R. & BRUMMER EC., 2000. Binary legume-grass
mixtures improve forage yield, quality and seasonal distribution. Agronomy Journal
92, 24-29.
STOUT, W.L., WEAVER, R.S. & ELWINGER, G.F., 2001. Effects of early season nitrogen
on grass-clover swards in the northern USA. Agronomy Journal 93, 1000-05.
THOMAS, H., 1984. Effects of drought on growth and competitive ability of perennial
ryegrass and white clover. Journal of Applied Ecology 21, 591-602.

158
THOMAS, R.J., 1992. The role of legumes in the nitrogen cycle of productive and sustainable
pastures. Grass Forage Science 47, 133-142.
VAN HEERDEN, J.M. & DURAND, W., 1994. Influence of nitrogen fertilisation on forage
and animal production of a continuously grazed irrigated grass/clover pasture in the
Rûens area of the southern Cape. African Journal of Range and Forage Science 11
(3), 69-75.
WOLEDGE, J., 1988. Competition between grass and clover in spring as affected by nitrogen
fertilizer. Annals of Applied Biology 112, 175-186.

159
Chapter 9
The effects of strategic fertiliser nitrogen application during the cool season
on perennial ryegrass-white clover pastures in the Western Cape Province
4. Selected nutritive characteristics and mineral content
Abstract
The influence of a single application of fertiliser N (0, 50, 100 and 150 kg N ha-1) applied in
either autumn, early winter, late winter, early spring or late spring on selected nutritive and
mineral parameters of a perennial ryegrass-white clover pasture was investigated over a three
year period. Responses were measured over one regrowth cycle five weeks after the
application of N treatments. A sample of the plant material harvested was separated into grass
and clover fractions. Dry matter (DM), crude protein (CP), in vitro organic matter digestibility
(IVOMD), phosphorus- (P) and calcium (Ca) content were determined for each sample.
Winter applications of fertiliser N, in combination with the higher N rates, resulted in higher
ryegrass CP contents. Clover CP content was decreased (P=0.05) with spring (early and late)
applications, but fertiliser N rate did not appear to affect clover CP content. The highest
IVOMD values for both ryegrass and clover were recorded in winter. Increased fertiliser N
rate resulted in lower DM conents with the lowest DM produced during winter, while the
highest DM contents were produced where no fertiliser N was applied in spring.
P content was significantly influenced by season of application and fertiliser N rate in
ryegrass and only by season of application in clover. The highest mineral concentrations were
found in winter. N recovery (kg N ha-1 in forage) was the lowest during early winter and the
highest during autumn, late winter and early spring.
The rate and season of fertiliser N application as used in this study did not negatively affect
pasture mineral content and quality, but care must be taken to protect the grazing animal from
the potential negative effects of high N on animal health.

160
Keywords: calcium, crude protein, dry matter content, in vitro organic matter digestibility, nitrogen,
phosphorus,
Introduction
The use of fertiliser N to increase pasture productivity when environmental conditions restrict
nitrogen absorption and availability to perennial ryegrass-white clover pastures has been
widely studied in Australia and New Zealand. This research showed that fertiliser N
applications not only resulted in increased dry matter production (Ball, Molloy & Ross, 1978;
McKenzie, Ryan, Jacobs & Kearney, 1999; Stout, Weaver & Elwinger, 2001), but also
influenced the sensitive grass-clover balance (Ball et al., 1978; Laidlaw, 1984) and fodder
quality as well as mineral content (Frame, 1987; McKenzie, Jacobs & Kearney, 2003).
The nutritive characteristics of a pasture are influenced by environmental conditions including
soil N supply and the season of pasture utilization. McKenzie et al. (1999) reported an
improvement in the nutritive value of a perennial ryegrass-white clover pasture, receiving
fertiliser N in autumn to mid winter by increasing metabolisable energy (ME) and crude
protein (CP) and decreasing neutral detergent fiber (NDF).
Increasing rates of fertiliser N normally result in increased herbage crude protein content (Ball
et al., 1978; McKenzie et al., 2003). High rates of fertiliser N application can also lead to high
levels of soil N resulting in luxury uptake of N by plants. These high herbage N levels are
potentially toxic to ruminants (Eckard, 1990). Nitrogen levels higher than 4% of total dry
matter produced, exceed plant as well as animal nutrition requirements, can cause ammonia-
induced bloat as well as ammonia- and nitrate toxicity especially where hungry or unadapted
ruminants are allowed to graze on moisture stressed pastures (Eckard & Dugmore, 1993).
Delaying grazing to a minimum of 21 days after fertiliser N application will reduce the
possibility of nitrate toxicity as most nitrate would have been incorporated as part of the
protein component of the plant cell (Meissner, Zacharias & O’Reagain, 2000).
The in vitro organic matter digestibility (IVOMD) of clover is generally higher than that of
grasses (Botha, 2003) suggesting that increased clover content will result in higher IVOMD
values. The expected decrease in cell wall thickness as fertiliser N rate increases can also

161
result in increased IVOMD (Wilman & Martins, 1977; Frame & Boyd 1987). In vitro organic
matter digestibility decreases as harvesting date is postponed and the pasture left to mature
(Frame, 1987).
The application of fertiliser N can decrease dry matter content and as a result dry matter
intake by the grazing animal (Meissner et al., 2000), causing a restriction in the intake of plant
nutrients that eventually results in lower animal production potential per unit area.
Data supplied by the NRC (1989) recommend a pasture with a Ca and P content of 5.4 and
3.4 g kg–1 DM respectively, to satisfy the needs of a 600 kg diary cow producing 23 kg milk
day–1. Prevention of Ca:P disorders can be achieved by keeping the Ca:P ratio larger than 1:1
(Miles, De Villiers & Dugmore, 1995) and as close as possible to 1.59:1 as recommended by
the NRC (1989).
The objective of this study was to determine the influence of different rates of fertiliser N,
applied as a single strategic application during the cool season from autumn to late spring, on
selected herbage quality and mineral parameters after 5 weeks of regrowth following fertiliser
N application.
Materials and methods
General procedures.
A field experiment was conducted during the period 2000-2002 at the Institute for Plant
Production, Elsenburg to determine the effect of a single application of four fertiliser N rates
(0, 50, 100 and 150 kg N ha-1) applied annually in either autumn, early winter, late winter,
early spring or late spring on soil inorganic nitrogen content, pasture composition and quality
as well as dry matter production of a perennial rye grass-white clover pasture. Details on the
experimental site, experimental design, lay-out, treatments and data analyses are presented in
Chapter 5.

162
Quality and mineral content
Fresh herbage samples of approximately 300 g wet material were collected from each
treatment combination at harvesting five weeks after the application of N treatments. The
samples were separated into clover and grass fractions, dried for 72 h at 60°C and dry weight
recorded. Dry matter production (DMP) (kg ha-1) was calculated for each treatment plot
harvested. Dried clover and grass were ground to pass through a 1 mm mesh screen and
analysed according to AOAC (1970) standards as described by Anon (1998) for crude protein
(CP), in vitro organic matter digestibility (IVOMD), phosphorus (P) and calcium (Ca)
content. Crude protein was calculated as Dumas-N x 6.25. Dry matter content (DM) of the
herbage on offer was calculated as the difference between the fresh and dry weight of the
sample and expressed as a percentage.
Herbage CP content was calculated using the following method:
Herbage CP (%) = ((DMPryegrass * CP% ryegrass) + (DMPclover *CP% clover)) /
(DMP pasture)*100
Herbage N yields were calculated as:
Herbage N yield (kg N ha-1) = (Herbage CP% / 6.25) * DMP
Results and Discussion
Partial ANOVA indicating levels of significance between treatment combinations are
summarised in Table 9.1.

163
Table 9.1 Partial ANOVA illustrating the levels of significance between treatment combinations, rate and season of fertiliser N applications, on
selected quality and mineral parameters of a perennial ryegrass-white clover pasture at the Institute for Plant Production, Elsenburg
ApparentN yield C P OMD P Ca N yield C P OMD P N Yield Ca DM N recovery
Year 2000
Season of application * *** ** *** *** * *** *** *** * *** *** *N * *** NS *** NS * * NS NS * NS *** *Season x N NS ** NS NS NS NS NS NS NS NS NS ** *
Year 2001
Season of application * *** *** ** NS * *** *** ** * NS *** *N * *** NS *** ** NS ** NS NS * NS *** *Season x N * *** NS NS NS NS NS NS NS * NS ** NS
Year 2002
Season of application * *** ** ** *** * *** *** *** * ** *** *N * *** NS *** * * ** NS NS * NS *** *Season x N NS ** NS *** NS * NS NS NS NS NS ** *
NS. Not significant; *P<0.05; **P<0.01; ***P<0.0001
Perennial Ryegrass White clover Pasture
164
Pasture Dry Matter Content (DM)
Mean DM contents of the pasture were similar among years with the highest DM
content recorded in 2001 (14.455%) followed by 13.214% in 2002 and 13.176% in
2000 (Table 9.2). The slightly higher DM content in 2001 may be the result of a
reduction in clover productivity during wet conditions as abnormal high rainfall was
experienced during 2001 (Figure 5.4). Increased fertiliser N rates tend to result in
decreased pasture DM content. Spring applications of fertiliser N tend to increase DM
content in 2000 and 2001 however 2002 was characterised by the highest (P=0.05)
DM content occurring during late winter.
A significant interaction between fertiliser N rate and season of application on DM
content was noted for all years covered by the study due to differences in response to
nitrogen when applied in autumn, winter or spring (Table 9.2). The highest DM
contents tend to occur in late spring where no fertiliser N was applied and the lowest
in autumn and winter where 100 or 150 kg N ha-1 were applied. The higher DM in
spring is possibly the result of faster growth rates where plants reached maturity
sooner than under conditions characterised by slow growth rates. The low (11 to 12%)
DM content may reduce animal productivity as a result of low DM intake.
Crude protein (CP)
Pasture
Crude protein content of the pasture exceeded 15% in all treatment combinations
except for late spring applications of 0 and 50 kg N ha-1 in 2001 (Table 9.3). General
recommendations are that forage with a CP content of >15% will maintain high
livestock production on grazed pastures (NRC, 2001). Animals may however, still
respond to additional protein if a large percentage of the crude protein is in the form
of non-protein constituents, a fraction not determined in this study (Meissner et al.,
2000).

165
Table 9.2 Dry matter (DM) content (%) of a perennial ryegrass-white clover pasture
as influenced by fertiliser N rate (kg N ha-1) and fertiliser N application at Elsenburg
Year 2000 Fertiliser N rate (kg ha-1) Season of application 0 50 100 150 Mean (S) Autumn 13.248 cde* 11.788 h 11.883 h 11.868 h 11.9888 b** Early winter 12.968 def 12.663 efg 12.005 gh 12.310 fgh 12.4863 b Late winter 13.153 cde 12.390 fgh 12.273 fgh 12.053 gh 12.4669 b Early spring 14.988 b 14.553 b 13.533 cd 13.735 c 14.2019 a Late spring 15.730 a 15.158 ab 14.518 b 13.328 cde 14.7356 a Mean (N) 13.893 a 13.31 b 12.842 c 12.6585 c 13.176 LSD (0.05) NxS = 0.7354 LSD (0.05) S means = 0.6796 LSD (0.05) N means = 0.3278 CV =3.90
Year 2001 Autumn 17.202 a 15.200 cd 12.933 hij 12.858 ijk 14.5138 b Early winter 15.938 bc 13.935 fgh 12.520 jk 11.843 k 13.5588 c Late winter 15.313 cd 13.795 fghi 12.860 ijk 12.548 jk 13.6288 c Early spring 14.993 cde 15.000 cde 14.153 efg 13.608 ghi 14.4381 b Late spring 17.640 a 16.755 ab 15.378 cd 14.743 def 16.1356 a Mean (N) 16.195 a 14.937 b 13.5685 c 13.1195 c 14.455 LSD (0.05) NxS = 1.0361 LSD (0.05) S means = 0.7556 LSD (0.05) N means = 0.4618 CV = 5.01
Year 2002 Autumn 13.060 efg 11.650 j 11.533 j 12.155 ij 12.025 c Early winter 14.620 bc 13.535 def 12.848 fghi 12.923 fgh 13.4813 b Late winter 16.288 a 15.098 b 14.695 bc 14.023 cd 15.0256 a Early spring 12.688 ghi 12.840 fghi 12.208 hij 11.840 j 12.3938 c Late spring 13.527 def 13.783 de 12.815 fghi 12.275 hij 13.145 b Mean (N) 14.013 a 13.381 b 12.8195 c 12.643 c 13.214 LSD (0.05) NxS = 0.7634 LSD (0.05) S means = 0.6239 LSD (0.05) N means = 0.3403 CV = 4.04 *Means in the same year followed by the same letter are not signifficantly different (P=0.05) **Means(bold) in the same year, column or row, followed by the same letter are not significantly different (P=0.05)
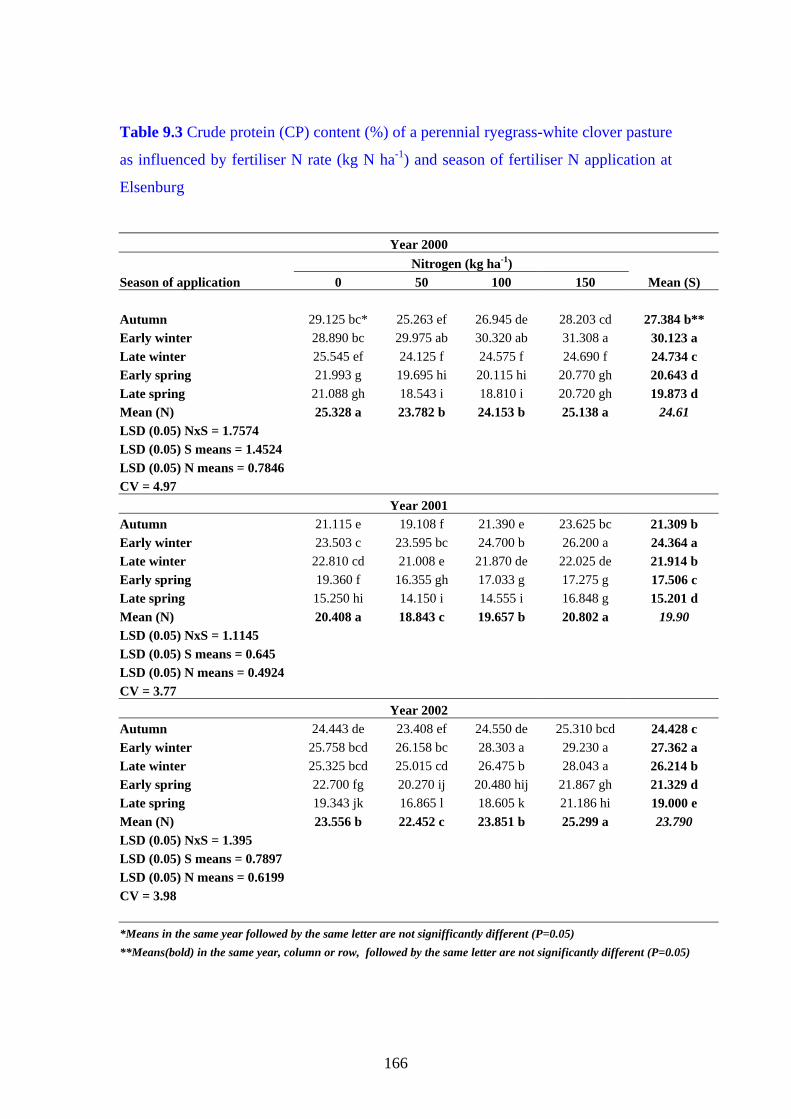
166
Table 9.3 Crude protein (CP) content (%) of a perennial ryegrass-white clover pasture
as influenced by fertiliser N rate (kg N ha-1) and season of fertiliser N application at
Elsenburg
Year 2000 Nitrogen (kg ha-1) Season of application 0 50 100 150 Mean (S) Autumn 29.125 bc* 25.263 ef 26.945 de 28.203 cd 27.384 b** Early winter 28.890 bc 29.975 ab 30.320 ab 31.308 a 30.123 a Late winter 25.545 ef 24.125 f 24.575 f 24.690 f 24.734 c Early spring 21.993 g 19.695 hi 20.115 hi 20.770 gh 20.643 d Late spring 21.088 gh 18.543 i 18.810 i 20.720 gh 19.873 d Mean (N) 25.328 a 23.782 b 24.153 b 25.138 a 24.61 LSD (0.05) NxS = 1.7574 LSD (0.05) S means = 1.4524 LSD (0.05) N means = 0.7846 CV = 4.97
Year 2001 Autumn 21.115 e 19.108 f 21.390 e 23.625 bc 21.309 b Early winter 23.503 c 23.595 bc 24.700 b 26.200 a 24.364 a Late winter 22.810 cd 21.008 e 21.870 de 22.025 de 21.914 b Early spring 19.360 f 16.355 gh 17.033 g 17.275 g 17.506 c Late spring 15.250 hi 14.150 i 14.555 i 16.848 g 15.201 d Mean (N) 20.408 a 18.843 c 19.657 b 20.802 a 19.90 LSD (0.05) NxS = 1.1145 LSD (0.05) S means = 0.645 LSD (0.05) N means = 0.4924 CV = 3.77
Year 2002 Autumn 24.443 de 23.408 ef 24.550 de 25.310 bcd 24.428 c Early winter 25.758 bcd 26.158 bc 28.303 a 29.230 a 27.362 a Late winter 25.325 bcd 25.015 cd 26.475 b 28.043 a 26.214 b Early spring 22.700 fg 20.270 ij 20.480 hij 21.867 gh 21.329 d Late spring 19.343 jk 16.865 l 18.605 k 21.186 hi 19.000 e Mean (N) 23.556 b 22.452 c 23.851 b 25.299 a 23.790 LSD (0.05) NxS = 1.395 LSD (0.05) S means = 0.7897 LSD (0.05) N means = 0.6199 CV = 3.98 *Means in the same year followed by the same letter are not signifficantly different (P=0.05) **Means(bold) in the same year, column or row, followed by the same letter are not significantly different (P=0.05)
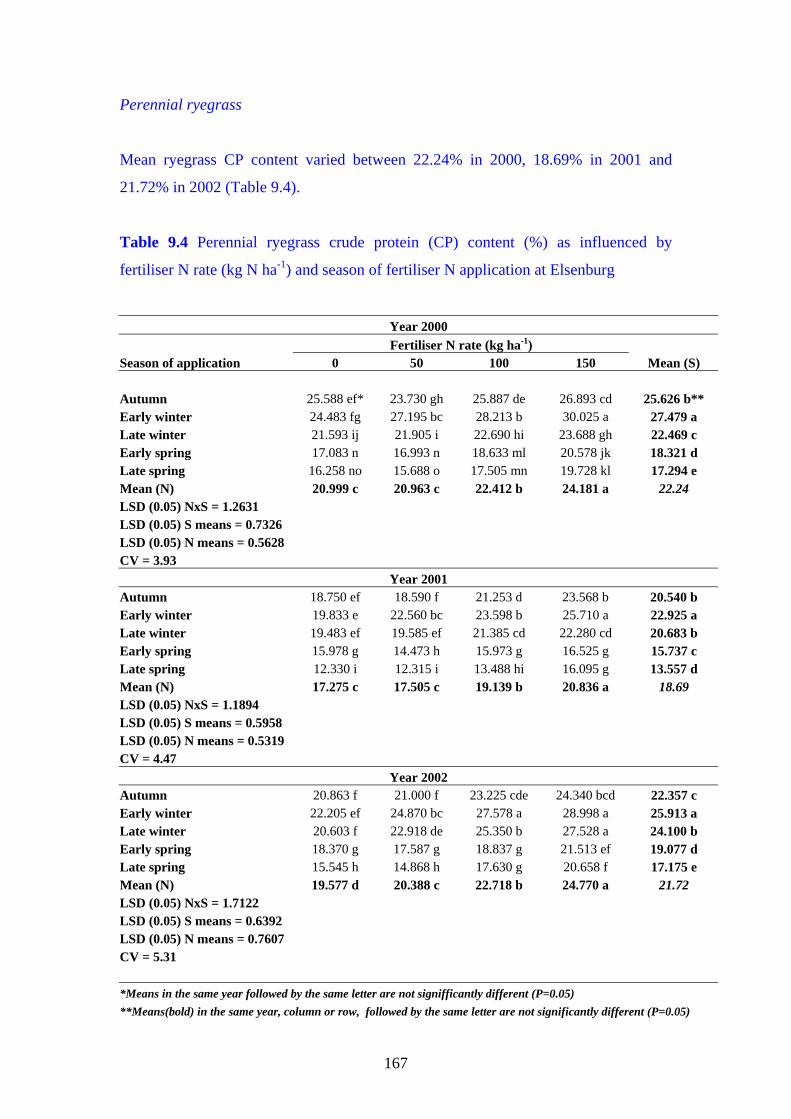
167
Perennial ryegrass
Mean ryegrass CP content varied between 22.24% in 2000, 18.69% in 2001 and
21.72% in 2002 (Table 9.4).
Table 9.4 Perennial ryegrass crude protein (CP) content (%) as influenced by
fertiliser N rate (kg N ha-1) and season of fertiliser N application at Elsenburg
Year 2000 Fertiliser N rate (kg ha-1) Season of application 0 50 100 150 Mean (S) Autumn 25.588 ef* 23.730 gh 25.887 de 26.893 cd 25.626 b** Early winter 24.483 fg 27.195 bc 28.213 b 30.025 a 27.479 a Late winter 21.593 ij 21.905 i 22.690 hi 23.688 gh 22.469 c Early spring 17.083 n 16.993 n 18.633 ml 20.578 jk 18.321 d Late spring 16.258 no 15.688 o 17.505 mn 19.728 kl 17.294 e Mean (N) 20.999 c 20.963 c 22.412 b 24.181 a 22.24 LSD (0.05) NxS = 1.2631 LSD (0.05) S means = 0.7326 LSD (0.05) N means = 0.5628 CV = 3.93
Year 2001 Autumn 18.750 ef 18.590 f 21.253 d 23.568 b 20.540 b Early winter 19.833 e 22.560 bc 23.598 b 25.710 a 22.925 a Late winter 19.483 ef 19.585 ef 21.385 cd 22.280 cd 20.683 b Early spring 15.978 g 14.473 h 15.973 g 16.525 g 15.737 c Late spring 12.330 i 12.315 i 13.488 hi 16.095 g 13.557 d Mean (N) 17.275 c 17.505 c 19.139 b 20.836 a 18.69 LSD (0.05) NxS = 1.1894 LSD (0.05) S means = 0.5958 LSD (0.05) N means = 0.5319 CV = 4.47
Year 2002 Autumn 20.863 f 21.000 f 23.225 cde 24.340 bcd 22.357 c Early winter 22.205 ef 24.870 bc 27.578 a 28.998 a 25.913 a Late winter 20.603 f 22.918 de 25.350 b 27.528 a 24.100 b Early spring 18.370 g 17.587 g 18.837 g 21.513 ef 19.077 d Late spring 15.545 h 14.868 h 17.630 g 20.658 f 17.175 e Mean (N) 19.577 d 20.388 c 22.718 b 24.770 a 21.72 LSD (0.05) NxS = 1.7122 LSD (0.05) S means = 0.6392 LSD (0.05) N means = 0.7607 CV = 5.31 *Means in the same year followed by the same letter are not signifficantly different (P=0.05) **Means(bold) in the same year, column or row, followed by the same letter are not significantly different (P=0.05)

168
The lower CP content in 2001 is indicative of low fertiliser N availability as a result
of leaching and/or the inability of ryegrass to absorb N in soil with moisture contents
near saturation point (Russell, 1988) as very high rainfall was experienced in this
year.
Increasing fertiliser N rates from 50 to 150 kg N ha-1 resulted in significant increases
in mean CP content in all years covered by the study. Similar observations were
reported by Eckard (1994) and Wilkins, Allen & Mytton (2000). No differences
(P>0.05) in CP % between the 0 and 50 kg N ha-1 application rates were found in
2000 and 2001. However in 2002 the CP content of forage from the 50 kg N ha-1
application rate was higher (P=0.05) than from the 0 kg N ha-1 treatment.
The highest mean CP content was recorded where fertiliser N was applied in early
winter and gradually decreased to a low in early and late spring.
A significant interaction between season - and rate of fertiliser N application was
noted for all three years covered by the study due to the much larger response to
nitrogen when applied in early winter compared to other seasons. On average the
highest CP contents were recorded where 150 kg N ha-1 was applied in early winter
and the lowest where 50 kg N ha-1 was applied in late spring. The crude protein levels
at early and late spring applications of 50 and 100 kg N ha-1 tend to be low, but not
deficient (Smith, 1986; Reuter & Robinson, 1997).
An important consideration with interpretation of this data set is that the pasture was
only grazed in summer and all herbage was removed during the cutting cycle (April-
November). The lack in return of N through excreta and mineralisation of trampled
organic matter due to the said management may have resulted in a gradual decrease in
nitrogen supply to the ryegrass as illustrated by the 0 kg N ha-1 treatments (Table 9.4).
White clover
Mean clover CP levels showed the same trend as ryegrass namely a lower CP content
in 2001 (23.90 %) compared to 2000 (28.52%) and 2002 (25.88 %) (Table 9.5).

169
Table 9.5 White clover crude protein (CP) content (%) as influenced by fertiliser N
rate (kg N ha-1) and season of fertiliser N application at Elsenburg
Year 2000 Fertiliser N rate (kg ha-1) Season of application 0 50 100 150 Mean (S) Autumn 30.955 30.373 30.235 30.188 30.438 b** Early winter 32.265 33.155 33.290 33.468 33.044 a Late winter 29.093 27.978 28.423 27.418 28.228 c Early spring 27.555 26.098 25.613 25.667 26.271 d Late spring 25.848 24.397 23.435 24.728 24.615 e Mean (N) 29.143 a 28.611 ab 28.199 b 28.432 b 28.52 LSD (0.05) NxS = NS LSD (0.05) S means = 1.2331 LSD (0.05) N means = 0.6735 CV = 3.65
Year 2001 Autumn 27.388 25.138 24.550 25.218 25.573 b Early winter 28.883 27.345 28.107 27.487 27.978 a Late winter 25.768 24.540 24.130 24.655 24.790 c Early spring 22.640 22.810 21.940 22.173 22.391 d Late spring 18.520 18.659 18.568 19.408 18.788 e Mean (N) 24.640 a 23.698 b 23.214 b 23.468 b 23.90 LSD (0.05) NxS = NS LSD (0.05) S means = 0.7386 LSD (0.05) N means = 0.6043 CV = 3.87
Year 2002 Autumn 27.300 25.878 26.808 27.063 26.762 c Early winter 29.643 28.790 29.973 30.230 29.659 a Late winter 27.965 27.265 28.085 28.740 28.014 b Early spring 24.803 24.063 23.570 22.823 23.815 d Late spring 21.598 20.445 20.318 22.305 21.166 e Mean (N) 26.338 a 25.353 b 25.865 ab 26.412 a 25.88 LSD (0.05) NxS = NS LSD (0.05) S means = 0.8053 LSD (0.05) N means = 0.584 CV = 3.43 **Means(bold) in the same year, column or row, followed by the same letter are not significantly different (P=0.05)
The effect of fertiliser N was inconsistent although treatments that did not receive
fertiliser N tend to have higher CP contents. The highest CP contents were recorded
where fertiliser N was applied in early winter, declining to the lowest CP contents
during late spring. Eckard (1994) reported that white clover N content increased

170
marginally in late winter and declined with the onset of summer. The summer decline
in N content can be ascribed to a possible dilution effect as clover growth rate
increases. In contrast to ryegrass, mean clover CP content at 0 kg N ha–1 tended to be
higher than treatments receiving fertiliser N, possibly as a result of symbiotic N
fixation.
No interaction (P>0.05) was recorded between season of application and fertiliser N
rate. CP content of clover receiving fertiliser N during early and late spring tended to
be low (< 27.5 %). Smith (1986) recommended a CP content of 27.5 to 29.4% to
maintain optimal clover productivity while Reuter & Robinson (1997) regard tissue N
contents of more than 3.2 to 3.6% (20 to 22.5% CP) as adequate. Clover CP content in
late spring 2001 was marginally lower than the minimum levels suggested by Reuter
& Robinson (1997). The CP content of the white clover in the current study was
higher than that of the companion perennial ryegrass highlighting the positive effect
of clover on pasture quality.
In vitro organic matter digestibility (IVOMD)
IVOMD in both ryegrass and clover was influenced (P<0.05) only by season of
fertiliser N application (Tables 9.6 & 9.7). These results supported the findings of
Schils, Vellinga & Kraak, (1999) who reported no difference in IVOMD and CP
where 0 and 50 kg N ha-1 were applied in spring. Mean IVOMD of clover tended to
be higher than perennial ryegrass only in 2000.
Perennial ryegrass
Mean IVOMD varied between 74.625% in 2000, 75.601% in 2001 and 81.923% in
2002 (Table 9.6). Frame (1987) also reported an increase in IVOMD over time. The
high rainfall in 2001 did not influence ryegrass IVOMD values.
Fertiliser N rate did not influence IVOMD in this study, but Valente, Borreani,
Peiretti & Tabacco (2000) reported that nitrogen fertiliser may cause a slight decrease
in digestibility in Italian ryegrass.
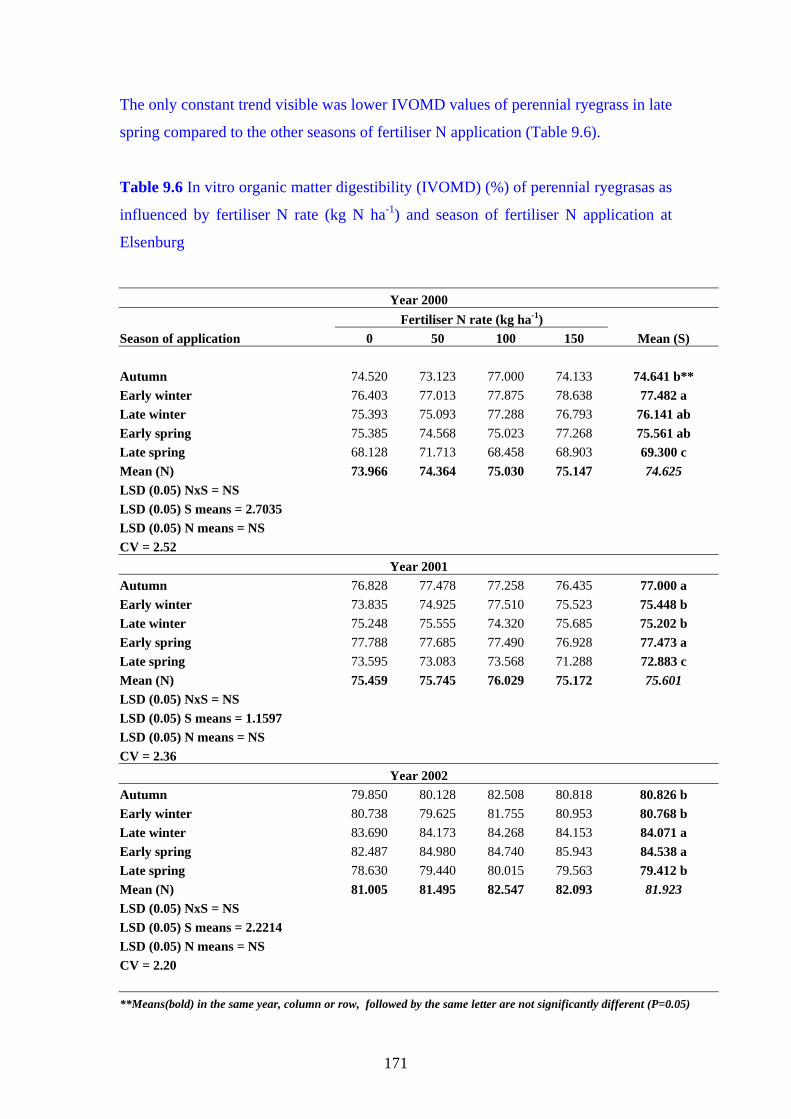
171
The only constant trend visible was lower IVOMD values of perennial ryegrass in late
spring compared to the other seasons of fertiliser N application (Table 9.6).
Table 9.6 In vitro organic matter digestibility (IVOMD) (%) of perennial ryegrasas as
influenced by fertiliser N rate (kg N ha-1) and season of fertiliser N application at
Elsenburg
Year 2000 Fertiliser N rate (kg ha-1) Season of application 0 50 100 150 Mean (S) Autumn 74.520 73.123 77.000 74.133 74.641 b** Early winter 76.403 77.013 77.875 78.638 77.482 a Late winter 75.393 75.093 77.288 76.793 76.141 ab Early spring 75.385 74.568 75.023 77.268 75.561 ab Late spring 68.128 71.713 68.458 68.903 69.300 c Mean (N) 73.966 74.364 75.030 75.147 74.625 LSD (0.05) NxS = NS LSD (0.05) S means = 2.7035 LSD (0.05) N means = NS CV = 2.52
Year 2001 Autumn 76.828 77.478 77.258 76.435 77.000 a Early winter 73.835 74.925 77.510 75.523 75.448 b Late winter 75.248 75.555 74.320 75.685 75.202 b Early spring 77.788 77.685 77.490 76.928 77.473 a Late spring 73.595 73.083 73.568 71.288 72.883 c Mean (N) 75.459 75.745 76.029 75.172 75.601 LSD (0.05) NxS = NS LSD (0.05) S means = 1.1597 LSD (0.05) N means = NS CV = 2.36
Year 2002 Autumn 79.850 80.128 82.508 80.818 80.826 b Early winter 80.738 79.625 81.755 80.953 80.768 b Late winter 83.690 84.173 84.268 84.153 84.071 a Early spring 82.487 84.980 84.740 85.943 84.538 a Late spring 78.630 79.440 80.015 79.563 79.412 b Mean (N) 81.005 81.495 82.547 82.093 81.923 LSD (0.05) NxS = NS LSD (0.05) S means = 2.2214 LSD (0.05) N means = NS CV = 2.20 **Means(bold) in the same year, column or row, followed by the same letter are not significantly different (P=0.05)

172
White clover
Highest mean white clover IVOMD of 82.45% was produced in 2002, compared to
77.48% in 2000 and 75.50% in 2001 (Table 9.7).
Table 9.7 In vitro organic matter digestibility (IVOMD) (%) of white clover as
influenced by fertiliser N rate (kg N ha-1) and season of fertiliser N application at
Elsenburg
Year 2000 Fertiliser N rate (kg ha-1) Season of application 0 50 100 150 Mean (S) Autumn 79.145 78.113 78.060 80.118 78.859 a** Early winter 78.940 80.310 79.695 79.338 79.571 a Late winter 79.513 78.890 78.880 78.690 78.993 a Early spring 77.018 76.020 76.855 78.010 76.907 b Late spring 73.625 74.140 72.358 72.503 73.091 c Mean (N) 77.648 77.671 77.170 77.717 77.484 LSD (0.05) NxS = NS LSD (0.05) S means = 1.675 LSD (0.05) N means = NS CV = 1.74
Year 2001 Autumn 81.325 78.197 79.925 80.720 80.046 a Early winter 77.530 77.353 79.098 79.283 78.315 b Late winter 70.680 72.818 72.223 NA 71.906 d Early spring 76.313 76.143 75.765 75.107 75.880 c Late spring 71.123 72.420 71.165 70.710 71.354 d Mean (N) 75.394 75.238 75.158 75.501 75.501 LSD (0.05) NxS = NS LSD (0.05) S means = 1.4409 LSD (0.05) N means = NS CV = 2.91
Year 2002 Autumn 80.558 83.455 83.028 81.280 82.080 c Early winter 81.257 81.155 78.840 77.810 80.560 d Late winter 84.613 83.693 83.745 84.940 84.201 b Early spring 86.587 86.053 85.653 88.587 86.720 a Late spring 77.837 78.980 78.853 78.905 78.697 e Mean (N) 82.219 82.489 82.394 82.609 82.452 LSD (0.05) NxS = NS LSD (0.05) S means = 19.426 LSD (0.05) N means = NS CV = 2.14 **Means(bold) in the same year, column or row, followed by the same letter are not significantly different (P=0.05)

173
The highest IVOMD values were measured for fertiliser N application in autumn and
winter of 2000, autumn of 2001 and early spring in 2002 and the lowest during late
spring in all years (Table 9.7). The rapid growth rate in late spring (as a result of
higher temperatures and increasing photoperiod as shown in Chapters 2 & 4) could
promote early plant maturity (both ryegrass and clover) and therefore lowered the
digestibility of the forage if harvesting was delayed, especially where a fixed
regrowth cycle is practised (Morrison, 1980).
Calcium (Ca)
While the Ca content of all ryegrass samples (Table 9.8) can be regarded as deficient
(NRC 2001), values for clover (Table 9.9) over all treatment combinations were much
higher than the 0.67 % required by a dairy cow for optimum milk production (NRC
2001). The mean Ca content of the herbage (grass and legume combined), over all
treatment combinations, was 0.73 % leaving few treatment combinations in short
supply to sustain optimal milk production. These results further emphasise the
advantage of growing perennial ryegrass and white clover as companion crops as a
pasture. No interaction (P>0.05) between season of fertiliser N application and
fertiliser N rate on Ca content was recorded (Tables 9.8 & 9.9).
Perennial ryegrass
Mean Ca contents of the ryegrass were 0.477% (2000), 0.425% (2001) and 0.396% in
2002 (Table 9.8). This decrease is not related to climatic conditions. No definite trend
in the reaction of Ca content to fertiliser N rate or season of application was found,
but in general the highest Ca contents were recorded during early winter. All
treatments resulted in Ca levels higher than the 0.25% required for optimum plant
productivity (Reuter & Robinson, 1997).
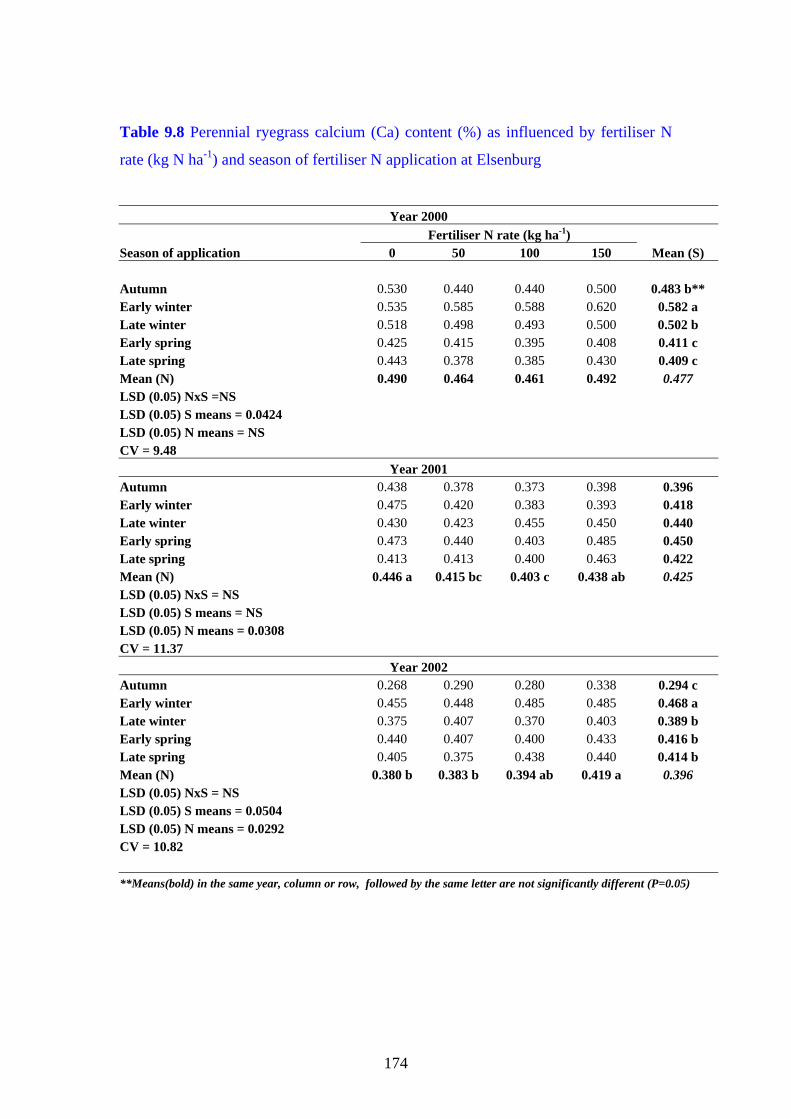
174
Table 9.8 Perennial ryegrass calcium (Ca) content (%) as influenced by fertiliser N
rate (kg N ha-1) and season of fertiliser N application at Elsenburg
Year 2000 Fertiliser N rate (kg ha-1) Season of application 0 50 100 150 Mean (S) Autumn 0.530 0.440 0.440 0.500 0.483 b** Early winter 0.535 0.585 0.588 0.620 0.582 a Late winter 0.518 0.498 0.493 0.500 0.502 b Early spring 0.425 0.415 0.395 0.408 0.411 c Late spring 0.443 0.378 0.385 0.430 0.409 c Mean (N) 0.490 0.464 0.461 0.492 0.477 LSD (0.05) NxS =NS LSD (0.05) S means = 0.0424 LSD (0.05) N means = NS CV = 9.48
Year 2001 Autumn 0.438 0.378 0.373 0.398 0.396 Early winter 0.475 0.420 0.383 0.393 0.418 Late winter 0.430 0.423 0.455 0.450 0.440 Early spring 0.473 0.440 0.403 0.485 0.450 Late spring 0.413 0.413 0.400 0.463 0.422 Mean (N) 0.446 a 0.415 bc 0.403 c 0.438 ab 0.425 LSD (0.05) NxS = NS LSD (0.05) S means = NS LSD (0.05) N means = 0.0308 CV = 11.37
Year 2002 Autumn 0.268 0.290 0.280 0.338 0.294 c Early winter 0.455 0.448 0.485 0.485 0.468 a Late winter 0.375 0.407 0.370 0.403 0.389 b Early spring 0.440 0.407 0.400 0.433 0.416 b Late spring 0.405 0.375 0.438 0.440 0.414 b Mean (N) 0.380 b 0.383 b 0.394 ab 0.419 a 0.396 LSD (0.05) NxS = NS LSD (0.05) S means = 0.0504 LSD (0.05) N means = 0.0292 CV = 10.82 **Means(bold) in the same year, column or row, followed by the same letter are not significantly different (P=0.05)

175
White clover
Mean white clover Ca content showed the same trend as perennial ryegrass namely a
gradual decrease from 2000 (1.385%) to 1.208% in 2002 (Table 9.9).
Table 9.9 White clover calcium (Ca) content (%) as influenced by fertiliser N rate (kg
N ha-1) and season of fertiliser N application at Elsenburg
Year 2000 Fertiliser N rate (kg ha-1) Season of application 0 50 100 150 Mean (S) Autumn 1.283 0.895 0.765 1.016 0.990 c** Early winter 1.810 1.565 1.485 1.535 1.599 a Late winter 1.313 1.428 1.223 1.228 1.298 b Early spring 1.763 1.658 1.573 1.540 1.639 a Late spring 1.358 1.327 1.415 1.478 1.399 b Mean (N) 1.505 1.377 1.292 1.350 1.385 LSD (0.05) NxS = NS LSD (0.05) S means = 0.1643 LSD (0.05) N means = NS CV = 18.58
Year 2001 Autumn 1.263 NA NA NA 1.263 Early winter 1.435 1.400 1.240 1.250 1.368 Late winter 1.380 1.290 1.207 1.100 1.283 Early spring 1.453 1.347 1.285 1.520 1.406 Late spring 1.350 1.353 0.895 1.123 1.218 Mean (N) 1.382 1.343 1.153 1.251 1.308 LSD (0.05) NxS = NS LSD (0.05) S means = NS LSD (0.05) N means = NS CV = 16.47
Year 2002 Autumn 0.893 0.880 0.905 0.863 0.885 c Early winter 1.583 1.525 1.595 NA 1.562 a Late winter 1.378 1.330 1.340 1.285 1.341 a Early spring 1.147 1.420 1.375 1.400 1.317 ab Late spring 0.845 0.983 0.943 0.963 0.933 bc Mean (N) 1.170 1.211 1.168 1.025 1.208 LSD (0.05) NxS = NS LSD (0.05) S means = 0.3944 LSD (0.05) N means = NS CV = 15.94 **Means(bold) in the same year, column or row, followed by the same letter are not significantly different (P=0.05)
176
Only season of fertiliser N application influenced clover Ca content in 2000 (P<0.05)
and 2002 (P<0.05). There were no definite trends except that the lowest Ca levels
were observed in late winter and late spring. Autumn 2000 and 2002 and late spring
2002 resulted in Ca concentrations of between 0.9 and 1.1%, a range regarded by
Reuter & Robinson (1997) as marginally deficient.
Phosphorus (P)
Most treatment combinations for ryegrass (Table 9.10) and clover (Table 9.11)
resulted in higher values than the 0.38% recommended to maintain optimal dairy
production (NRC, 1989). The mean calculated pasture P content of 0.50% should
therefore be adequate to maintain optimal dairy production (NRC, 1989).
Perennial ryegrass
Mean P content of the ryegrass decreased from 0.516% in 2001 and 0.508% in 2002
to 0.496% in 2000 (Table 9.10).
P concentration of perennial ryegrass tends to decrease as fertiliser N rate increases.
The highest (P=0.05) P content in all years covered by the study was recorded where
no fertiliser N was applied. No differences between 50 and 100 kg N ha-1 were
recorded in any year covered by the study. The P concentration of ryegrass was lower
in the 150 kg N ha-1 treatment than in the 100 kg N ha-1 treatment only in 2001.
The effect of season of application on ryegrass P content was inconsistent with the
highest (P=0.05) values recorded in late winter (2000) and winter as well as early
spring (2001) and autumn (2002).
An interaction between treatment combinations in 2002 showed that P content
decreased with increased N application rates in autumn and spring, but not in winter.
The highest (P=0.05) P value was recorded in autumn with no fertiliser N and the
lowest (P=0.05) in late spring where 100 and 150 kg N ha-1 were applied.

177
The P content of all treatments, excluding treatments receiving fertiliser N in early
spring 2000, was higher than the minimum of 0.2 to 0.25% which can be classified as
marginal deficient (Reuter & Robinson, 1997).
Table 9.10 Perennial ryegrass phosphorus (P) content (%) as influenced by fertiliser
N rate (kg N ha-1) and season of fertiliser N application at Elsenburg
Year 2000 Fertiliser N rate (kg ha-1) Season of application 0 50 100 150 Mean (S) Autumn 0.575 0.300 0.273 0.280 0.367 c** Early winter 0.478 0.373 0.385 0.355 0.398 c Late winter 0.988 0.878 0.845 0.778 0.872 a Early spring 0.213 0.173 0.170 0.165 0.180 d Late spring 0.895 0.650 0.570 0.545 0.665 b Mean (N) 0.630 a 0.484 b 0.458 bc 0.4245 c 0.496 LSD (0.05) NxS = NS LSD (0.05) S means = 0.1169 LSD (0.05) N means = 0.0586 CV = 18.17
Year 2001 Autumn 0.525 0.468 0.433 0.430 0.464 b Early winter 0.633 0.565 0.535 0.533 0.566 a Late winter 0.598 0.585 0.575 0.548 0.576 a Early spring 0.683 0.528 0.595 0.468 0.568 a Late spring 0.470 0.418 0.380 0.363 0.408 b Mean (N) 0.582 a 0.513 b 0.504 b 0.468 c 0.516 LSD (0.05) NxS = NS LSD (0.05) S means = 0.0922 LSD (0.05) N means = 0.0319 CV = 9.71
Year 2002 Autumn 0.750 a* 0.643 b 0.555 c 0.495 cdef 0.611 a Early winter 0.553 c 0.518 cde 0.528 cd 0.515 cde 0.528 b Late winter 0.510 cdef 0.513 cde 0.528 cd 0.515 cde 0.518 b Early spring 0.530 cd 0.397 gh 0.443 fg 0.453 efg 0.449 c Late spring 0.530 cd 0.475 def 0.375 h 0.363 h 0.436 c Mean (N) 0.588 a 0.515 b 0.488 bc 0.469 c 0.508 LSD (0.05) NxS = 0.0682 LSD (0.05) S means = 0.0644 LSD (0.05) N means = 0.0298 CV = 8.62 *Means in the same year followed by the same letter are not signifficantly different (P=0.05) **Means(bold) in the same year, column or row, followed by the same letter are not significantly different (P=0.05)
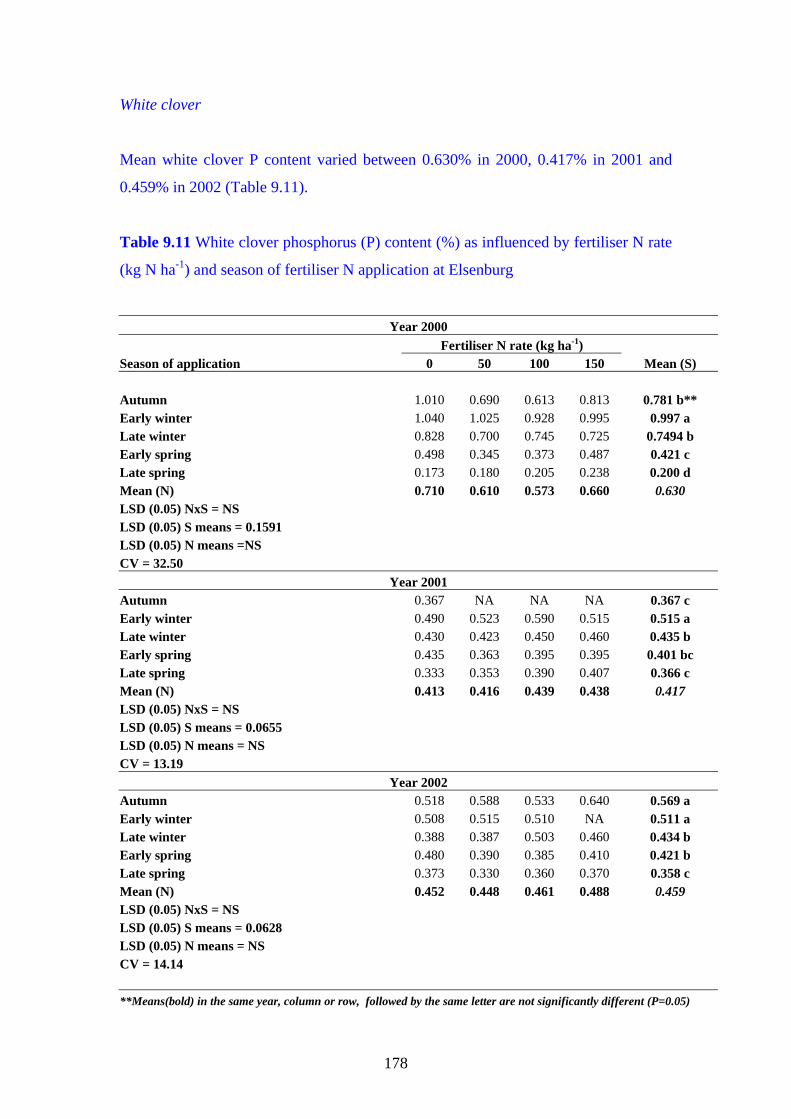
178
White clover
Mean white clover P content varied between 0.630% in 2000, 0.417% in 2001 and
0.459% in 2002 (Table 9.11).
Table 9.11 White clover phosphorus (P) content (%) as influenced by fertiliser N rate
(kg N ha-1) and season of fertiliser N application at Elsenburg
Year 2000 Fertiliser N rate (kg ha-1) Season of application 0 50 100 150 Mean (S) Autumn 1.010 0.690 0.613 0.813 0.781 b** Early winter 1.040 1.025 0.928 0.995 0.997 a Late winter 0.828 0.700 0.745 0.725 0.7494 b Early spring 0.498 0.345 0.373 0.487 0.421 c Late spring 0.173 0.180 0.205 0.238 0.200 d Mean (N) 0.710 0.610 0.573 0.660 0.630 LSD (0.05) NxS = NS LSD (0.05) S means = 0.1591 LSD (0.05) N means =NS CV = 32.50
Year 2001 Autumn 0.367 NA NA NA 0.367 c Early winter 0.490 0.523 0.590 0.515 0.515 a Late winter 0.430 0.423 0.450 0.460 0.435 b Early spring 0.435 0.363 0.395 0.395 0.401 bc Late spring 0.333 0.353 0.390 0.407 0.366 c Mean (N) 0.413 0.416 0.439 0.438 0.417 LSD (0.05) NxS = NS LSD (0.05) S means = 0.0655 LSD (0.05) N means = NS CV = 13.19
Year 2002 Autumn 0.518 0.588 0.533 0.640 0.569 a Early winter 0.508 0.515 0.510 NA 0.511 a Late winter 0.388 0.387 0.503 0.460 0.434 b Early spring 0.480 0.390 0.385 0.410 0.421 b Late spring 0.373 0.330 0.360 0.370 0.358 c Mean (N) 0.452 0.448 0.461 0.488 0.459 LSD (0.05) NxS = NS LSD (0.05) S means = 0.0628 LSD (0.05) N means = NS CV = 14.14 **Means(bold) in the same year, column or row, followed by the same letter are not significantly different (P=0.05)
179
Only season of fertiliser N application influenced clover P concentration (Table 9.10).
White clover P content decreased as season of fertiliser N application progressed from
early winter to late spring (Table 9.11). Clover P contents for all treatments except
late spring fertiliser N applications in 2000 were higher than the minimum of 0.25 to
0.3 % recommended by Reuter & Robinson (1997).
Nitrogen yields
Herbage nitrogen yields refer to the total N removed (kg ha-1) by the pasture in the
first regrowth cycle after fertiliser N application.
Herbage N yields
Herbage nitrogen yields (kg N ha-1) are presented in Table 9.12. Mean herbage N
yield decreased from 73.32 kg N ha-1 in 2000 and 64.30 kg N ha-1 in 2002 to 57.78 kg
N ha-1 in 2001. The lower N values in 2001 were most probably the result of the high
rainfall as discussed earlier.
Increased fertiliser N rates resulted in increased (P=0.05) herbage N yields. With the
exception of autumn 2000, the highest herbage N yields were noted in early and late
spring, which may be the result of higher N mineralisation due to increasing soil
temperatures.
An interaction between fertiliser N rate and season of application recorded in 2001
showed a clear seasonal response where no nitrogen was applied in contrast to no
seasonal response where 150 kg ha-1 was applied. The highest herbage N yields were
recorded in autumn and spring (early and late) at 150 kg N ha-1, while the lowest
herbage N yields were recorded in autumn and winter (early and late) where no
fertiliser N was applied.
The mean yields of herbage N, over a single regrowth cycle of 5 weeks, varied
between 17.24 kg N ha-1 and 119.98 kg N ha-1 in the 0 kg N ha-1 and 150 kg N ha-1
fertiliser N treatments respectively (Table 9.12). Ball et al. (1978) recorded an annual
turnover of 720 and 920 kg N ha-1 by the herbage of a grass-clover pasture with
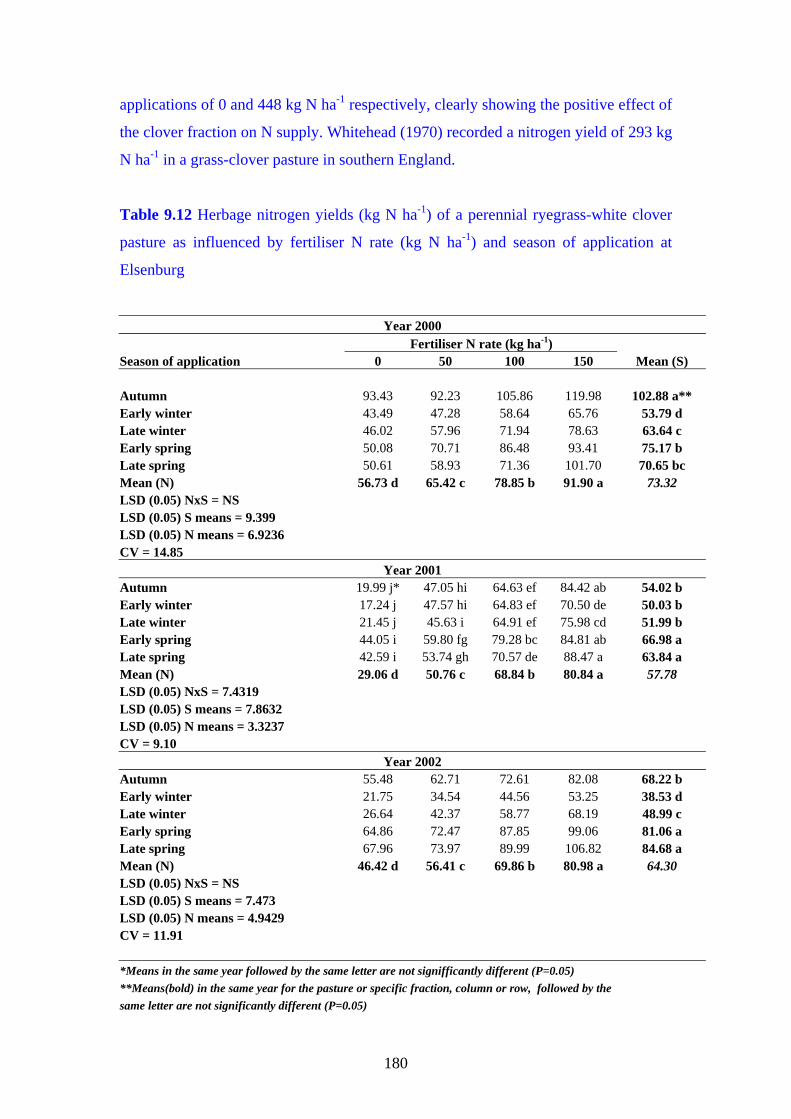
180
applications of 0 and 448 kg N ha-1 respectively, clearly showing the positive effect of
the clover fraction on N supply. Whitehead (1970) recorded a nitrogen yield of 293 kg
N ha-1 in a grass-clover pasture in southern England.
Table 9.12 Herbage nitrogen yields (kg N ha-1) of a perennial ryegrass-white clover
pasture as influenced by fertiliser N rate (kg N ha-1) and season of application at
Elsenburg
Year 2000 Fertiliser N rate (kg ha-1) Season of application 0 50 100 150 Mean (S) Autumn 93.43 92.23 105.86 119.98 102.88 a** Early winter 43.49 47.28 58.64 65.76 53.79 d Late winter 46.02 57.96 71.94 78.63 63.64 c Early spring 50.08 70.71 86.48 93.41 75.17 b Late spring 50.61 58.93 71.36 101.70 70.65 bc Mean (N) 56.73 d 65.42 c 78.85 b 91.90 a 73.32 LSD (0.05) NxS = NS LSD (0.05) S means = 9.399 LSD (0.05) N means = 6.9236 CV = 14.85
Year 2001 Autumn 19.99 j* 47.05 hi 64.63 ef 84.42 ab 54.02 b Early winter 17.24 j 47.57 hi 64.83 ef 70.50 de 50.03 b Late winter 21.45 j 45.63 i 64.91 ef 75.98 cd 51.99 b Early spring 44.05 i 59.80 fg 79.28 bc 84.81 ab 66.98 a Late spring 42.59 i 53.74 gh 70.57 de 88.47 a 63.84 a Mean (N) 29.06 d 50.76 c 68.84 b 80.84 a 57.78 LSD (0.05) NxS = 7.4319 LSD (0.05) S means = 7.8632 LSD (0.05) N means = 3.3237 CV = 9.10
Year 2002 Autumn 55.48 62.71 72.61 82.08 68.22 b Early winter 21.75 34.54 44.56 53.25 38.53 d Late winter 26.64 42.37 58.77 68.19 48.99 c Early spring 64.86 72.47 87.85 99.06 81.06 a Late spring 67.96 73.97 89.99 106.82 84.68 a Mean (N) 46.42 d 56.41 c 69.86 b 80.98 a 64.30 LSD (0.05) NxS = NS LSD (0.05) S means = 7.473 LSD (0.05) N means = 4.9429 CV = 11.91 *Means in the same year followed by the same letter are not signifficantly different (P=0.05) **Means(bold) in the same year for the pasture or specific fraction, column or row, followed by the same letter are not significantly different (P=0.05)

181
Perennial ryegrass
Mean ryegrass N yields were found to be 42.02 kg ha-1 in 2000, 43.23 kg ha-1 in 2001
and 35.70 kg ha-1 in 2002 (Table 9.13).
Table 9.13 Nitrogen yields (kg N ha-1) of perennial ryegrass in a perennial ryegrass-
white clover pasture as influenced by fertiliser N rate (kg N ha-1) and season of
application at Elsenburg
Year 2000 Fertiliser N rate (kg ha-1) Season of application 0 50 100 150 Mean (S) Autumn 28.05 38.56 51.67 69.06 46.84 a** Early winter 16.59 23.03 32.59 38.33 27.64 b Late winter 18.44 33.58 45.36 55.74 38.28 ab Early spring 20.41 43.51 63.10 75.76 50.70 a Late spring 19.33 38.00 51.90 77.31 46.64 a Mean (N) 20.57 d 35.34 c 48.93 b 63.24 a 42.02 LSD (0.05) NxS = NS LSD (0.05) S means = 14.854 LSD (0.05) N means = 6.4148 CV = 23.97
Year 2001 Autumn 12.77 hi* 42.16 f 61.24 c 81.24 a 49.35 a Early winter 8.34 i 35.45 fg 54.41 de 61.18 cd 39.85 c Late winter 8.59 i 30.52 g 52.57 e 70.60 b 40.57 c Early spring 17.73 h 40.81 f 60.73 cd 70.49 b 47.44 ab Late spring 18.13 h 33.50 g 51.80 e 65.51 bc 42.23 bc Mean (N) 13.11 d 36.49 c 56.15 b 69.80 a 43.89 LSD (0.05) NxS = 6.776 LSD (0.05) S means = 5.7551 LSD (0.05) N means = 3.0303 CV = 10.84
Year 2002 Autumn 19.99 28.66 43.16 50.19 35.50 b Early winter 9.71 21.50 33.49 42.69 26.85 c Late winter 7.72 19.92 33.16 44.18 26.25 c Early spring 17.15 36.92 52.55 66.87 43.37 a Late spring 20.30 41.41 57.23 67.13 46.51 a Mean (N) 14.86 d 29.30 c 43.46 b 53.55 a 35.70 LSD (0.05) NxS = NS LSD (0.05) S means = 6.7516 LSD (0.05) N means = 4.8923 CV = 21.17 *Means in the same year followed by the same letter are not signifficantly different (P=0.05) **Means(bold) in the same year for the pasture or specific fraction, column or row, followed by the same letter are not significantly different (P=0.05)
182
Increases in fertiliser N rate resulted in increased (P=0.05) N yields emphasising the
positive response of perennial ryegrass to fertiliser N applications. Fertiliser N
applications in autumn and spring (early and late) tends to result in higher ryegrass N
yields compared to winter applications mainly as a result of increased DM production,
most probably caused by improved N uptake at higher temperatures and increased soil
N mineralisation during these seasons.
A significant interaction recorded in 2001 showed a more prominent response to N
rates in autumn compared to other seasons of application. The lowest ryegrass N
yields were produced in early and late winter where no fertiliser N was applied and
the highest in autumn in combination with 150 kg N ha-1.
White Clover
The highest mean clover N yield was produced in 2000 namely 31.21 kg N ha-1
compared to 13.49 kg N ha-1 in 2001 and 28.60 kg N ha-1 in 2002 (Table 9.14).
Mean clover N yields (kg N ha-1) were higher where no fertiliser N was applied
compared to treatments that received fertiliser N. Reaction to season of application
was inconsistent although spring applications resulted in higher (P=0.05) clover N
yields in 2001 and 2002.
A significant interaction between fertiliser N rate and season of application in 2002
showed that although clover N yield was suppressed by all N applications,
suppressions were more severe in spring compared to autumn and early winter. The
lowest and highest fertiliser N yields were recorded in early winter and spring
respectively.
Apparent recovery of fertiliser nitrogen.
Apparent recovery of fertiliser N was calculated through expressing the total N yield
on the fertilised plots (50, 100 and 150 kg N ha-1) minus the N yield on the
unfertilised plots (0 kg N ha-1) as a percentage of the fertiliser N applied (Table 9.15).

183
Mean apparent N recoveries of 20.99% (2000), 50.26% (2001) and 32.43% (2002)
were recorded.
Table 9.14 Nitrogen yields (kg N ha-1) of white clover in a perennial ryegrass-white
clover pasture as influenced by fertiliser N rate (kg N ha-1) and season of application
at Elsenburg
Year 2000 Fertiliser N rate (kg ha-1) Season of application 0 50 100 150 Mean (S) Autumn 65.39 53.67 54.19 50.92 56.04 a** Early winter 26.89 24.25 26.05 27.43 26.16 b Late winter 27.57 24.39 26.58 22.89 25.36 b Early spring 29.67 27.19 23.37 17.64 24.47 b Late spring 31.27 20.94 19.45 24.39 24.01 b Mean (N) 36.16 a 30.09 b 29.93 b 28.66 b 31.21 LSD (0.05) NxS = NS LSD (0.05) S means = 8.266 LSD (0.05) N means = 5.477 CV = 27.56
Year 2001 Autumn 7.22 4.89 3.39 3.17 4.67 c Early winter 8.90 12.12 13.89 12.42 11.64 b Late winter 12.86 15.11 12.34 10.76 13.05 b Early spring 26.32 18.98 18.55 14.32 19.54 a Late spring 24.46 20.24 18.78 22.97 21.61 a Mean (N) 15.95 14.27 13.36 12.98 13.49 LSD (0.05) NxS = NS LSD (0.05) S means = 2.2392 LSD (0.05) N means = NS CV = 28.00
Year 2002 Autumn 35.49 bc* 34.05 bc 29.45 cdef 31.89 bcde 32.72 b Early winter 12.04 hi 13.04 hi 11.07 hi 10.56 i 11.68 d Late winter 18.92 gh 22.45 fg 25.61 defg 24.01 efg 22.75 c Early spring 47.71 a 35.55 bc 35.30 bc 32.19 bcd 37.69 a Late spring 47.66 a 32.57 bcd 32.76 bcd 39.69 ab 38.17 a Mean (N) 31.56 a 27.11 b 26.39 b 27.43 b 28.60 LSD (0.05) NxS = 8.1094 LSD (0.05) S means = 3.9682 LSD (0.05) N means = 3.6027 CV = 19.57 *Means in the same year followed by the same letter are not signifficantly different (P=0.05) **Means(bold) in the same year for the pasture or specific fraction, column or row, followed by the same letter are not significantly different (P=0.05)

184
Table 9.15 Apparent N recovery rates (%) of a perennial ryegrass-white clover
pasture as influenced by fertiliser N rate (kg N ha-1) and season of application at
Elsenburg
Year 2000 Fertiliser N rate (kg N ha-1) Season of application 50 100 150 Mean (S) Autumn -2.41* 12.42 17.70 **9.24 b Early winter 7.59 15.15 14.85 12.53 b Late winter 23.89 25.93 21.74 23.85 ab Early spring 41.25 36.39 28.88 35.51 a Late spring 16.65 20.75 34.06 23.82 ab Mean (N) 17.39 22.13 23.45 20.99 LSD (0.05) NxS = NS LSD (0.05) S means = 18.461 LSD (0.05) N means = NS CV =74.76
Year 2001 Autumn 30.83 42.90 53.75 42.49 bc Early winter 62.81 81.12 81.13 74.99 a Late winter 41.59 60.44 69.53 57.19 ab Early spring 22.33 40.91 44.02 35.75 c Late spring 22.20 55.37 45.12 40.90 bc Mean (N) 35.95 b 56.15 a 58.71 a 50.26 LSD (0.05) NxS = NS LSD (0.05) S means = 21.303 LSD (0.05) N means = 9.602 CV = 29.58
Year 2002 Autumn 15.00 26.71 31.84 24.52 b Early winter 27.83 34.22 44.64 35.57 ab Late winter 34.41 50.85 54.93 46.73 a Early spring 12.94 28.46 39.53 26.97 b Late spring 11.55 30.24 43.31 28.37 ab Mean (N) 20.35 c 34.10 b 42.85 a 32.43 LSD (0.05) NxS = NS LSD (0.05) S means = 19.459 LSD (0.05) N means = 7.56 CV = 37.66 *Means in the same year followed by the same letter are not signifficantly different (P=0.05) **Means(bold) in the same year, column or row, followed by the same letter are not significantly different (P=0.05)
Apparent N recovery rates increased (P=0.05) as fertiliser N rate was increased for all
years covered by the study. The increasing clay content (10 to 22.8%) within the top

185
300 mm soil possibly contributed to the relative high apparent recovery of fertiliser N
at the higher N rates as leaching of N was restricted by the higher clay content as soil
depth increases.
No definite trend regarding the effect of season of application on apparent N recovery
was noted.
Conclusions
Nitrogen application rate and season of application had a significant effect on the
quality parameters measured in this study. However the range of values within which
the concentration of forage quality parameters varied exceeded the requirements for
optimum animal performance. There was a small but significant decrease in pasture
DM content as fertiliser N rate increased. A decrease in DM content could result in
decreased DM intake relative to ryegrass-clover pastures that receive no N, and
therefore reduced production per animal. Decreased production per animal must
however be measured against increased availability of forage per hectare and
increased stocking rate. However the low herbage availability during the cool winter
months is likely to be of more importance to livestock production at a given stocking
rate than DM content of the forage on offer. Increasing pasture dry matter production
in the cooler months must be weighted against the potential negative effects of
decreased DM content of the forage.
Due to above minimum levels found for most parameters tested, it is envisaged that
the treatment combinations as used in this study will not be at any major disadvantage
to pasture mineral content or quality as well as the grazing animal if grazing
management is practised according to established norms.
References
ANON., 1998. ALASA, Handbook of Feeds and Plant Analysis. Vol 1. Agricultural
Laboratories South Africa.
186
AOAC., 1970. Official methods of analysis. (11th ed.). Association of Official
Analytical Chemists. Washington DC, USA.
BALL, P.R., MOLLOY, L.F. & ROSS, D.J., 1978. Influence of fertiliser nitrogen on
herbage dry matter and nitrogen yields, and botanical composition of a grazed
grass-clover pasture. New Zealand Journal of Agricultural Research 21, 47-
55.
BOTHA, P.R., 2003. Die produksiepotensiaal van oorgesaaide kikoejoeweiding in die
gematigde kusgebied van die Suid-Kaap. Ph.D (Agric)- proefskrif,
Universiteit van die Vrystaat, Bloemfontein.
ECKARD, R.J., 1990. The relationship between the nitrogen and nitrate content and
nitrate toxicity potential of Lolium multiflorum. Journal of the Grassland
Society of Southern Africa 7, 174-178.
ECKARD, R.J., 1994. The nitrogen economy of three irrigated temperate grass
pastures with and without clover in Natal. Ph.D Thesis. The University of
Natal, Pietermaritzburg. South Africa.
ECKARD, R.J. & DUGMORE, T.J., 1993. Livestock health and production as
influenced by nitrogen fertiliser management. In: Pastures in Natal, Natal
Region, Department of Agriculture, Cedara.
FRAME, J., 1987. The effect of strategic fertilizer nitrogen and date of primary
harvest on the productivity of perennial ryegrass/white clover sward. Grass
and Forage Science 42, 33-42.
FRAME, J. & BOYD, A.G., 1987. The effect of strategic use of fertilizer nitrogen in
spring and/or autumn on the productivity of perennial ryegrass/white clover
sward. Grass and Forage Science 42, 429-438.

187
LAIDLAW, A.S., 1984. Quantifying the effect of nitrogen fertilizer applications in
spring on white clover content in perennial ryegrass-white clover swards.
Grass and Forage Science 39, 317-321.
McKENZIE, F.R., JACOBS, J. L. & KEARNEY, G., 2003. Long term effects of
multiple applications on nitrogen fertiliser on grazed dryland perennial
ryegrass/white clover dairy pastures in south-west Victoria. 3. Botanical
composition, nutritive characteristics, mineral content, and nutrient selection.
Australian Journal of Agricultural Research 54, 477-485.
McKENZIE, F.R., RYAN, M.J., JACOBS, J.L. & KEARNEY, G., 1999. Effect of
rate and time of nitrogen application from autumn to midwinter on perennial
ryegrass-white clover dairy pastures in western Victoria. 1. Growth and
composition. Australian Journal of Agricultural Research 50, 1059-65.
MEISSNER, H.H., ZACHARIAS, P.J.K. & O’REAGAIN, P.J., 2000. Forage quality
(feed value). In N.M. Tainton (ed.). Pasture Management in South Africa.
University of Natal Press, Pietermaritzburg.
MILES, N., DE VILLIERS, J.F. & DUGMORE, T.J., 1995. Macromineral
composition of kikuyu herbage relative to the requirements of ruminants.
Tydskrif Suid-Afrikaanse Veeartsenykundige Vereniging 66 (4), 206-212.
MORRISON, I.M., 1980. Changes in lignin and hemicellulose concentrations of ten
varieties of temperate grasses with increasing maturity. Grass Forage Science
35, 287-293.
NRC, 1989. Nutrient requirements of dairy cattle. 6th revised edition. National
Research Council. National Academy Press: Washington.
NRC, 2001. Nutrient requirements of dairy cattle. 7th revised edition. National
Research Council. National Academy Press: Washington.

188
REUTER, D.J. & ROBINSON, J.B., 1997. Plant Analysis: An Interpretation Manual.
2nd ed. CSIRO Publishing, Collingwood, Victoria, Australia.
RUSSELL, E.W., 1988. Russell’s Soil Conditions and Plant Growth. 11th edition. A.
Wild (ed.). Longman: London, New York.
SCHILS, R.L.M., VELLINGA, Th.V. & KRAAK, T., 1999. Dry-matter yield and
herbage quality of perennial ryegrass/white clover sward in a rotational
grazing and cutting system. Grass and Forage Science 54, 19-29.
SMITH, F.W., 1986. Pasture Species. In D.J. Reuter & J.B. Robinson (ed.). Plant
Analysis: an interpretation manual, 2nd edn, Melbourne (Australia): Inkata.
STOUT, W.l., WEAVER, R.S. & ELWINGER, G.F., 2001. Effects of early season
nitrogen on grass-clover swards in the Northern USA. Agronomy Journal 93,
1000-05.
VALENTE, M.E., BORREANI, G., PEIRETTI, P.G. & TABACCO, E., 2000.
Codified morphological stage for predicting digestibility of Italian ryegrass
during the spring cycle. Agronomy Journal 92, 967-973.
WHITEHEAD, D.C., 1970. The Role of Nitrogen in Grassland Procductivity.
Bulletin, Commonwealth Burreau of Pastures and Field Crops. No. 48
Farnhum Royal; Commonwealth Agricultural Burreau.
WILKINS, P.E., ALLEN, D.K. & MYTTON, L.R., 2000. Differences in nitrogen use
efficiency of perennial ryegrass varieties under simulated rotational grazing
and their effects on nitrogen recovery and herbage nitrogen content. Grass and
Forage Science 55, 69-76.
WILMAN, D. & MARTINS, V.M., 1977. Senescence and death of herbage during
periods of regrowth in ryegrass and red and white clover, and the effect of
applied nitrogen. Journal of Applied Ecology 14, 615-620.
189
Chapter 10
CONCLUSION
General
The study was initiated to develop fertiliser N strategies with the aim of minimizing
the negative effect of the winter gap on fodder flow management. Glasshouse and
field trials were done to develop a better understanding of the response of perennial
ryegrass and white clover plants, either singularly or as companion species in a mixed
pasture, to environmental factors likely to restrict plant performance during the cool
season in the Western Cape Province. The knowledge obtained will be used to address
the winter - or feed gap experienced in perennial ryegrass-white clover pastures,
through strategic N fertilisation management. The study comprised of two
components. Glasshouse studies were done to evaluate the effect of soil temperature,
soil water potential and growing season on the response of perennial ryegrass and
white clover to different N rates under controlled conditions. Simultaneously a field
study was done to evaluate the effect of 0, 50, 100 and 150 kg N ha-1 applied as a
single dressing in autumn, early winter, late winter, early spring or late spring on dry
matter production, clover content and forage quality. Soil ammonium-N and nitrate-N
content were measured in both studies.
Glasshouse studies have shown that:
• White clover dry matter production was not negatively influenced even at
application rates of 150 kg N ha-1. These results were obtained under a range
of soil temperatures varying between 6 and 18 °C under 18 °C day - and 12 °C
night ambient temperature conditions. The reaction of a perennial ryegrass-
white clover pasture under field conditions may however differ as day and
night temperatures differ with seasons. The competitive effect of the two
species growing as companion crops under field conditions may also influence
the performance of the ryegrass and clover components.

190
• Soil water potentials of –10 to – 35 kPa did not negatively influence the
primary dry matter production of white clover but ryegrass PDM was
significantly reduced by soil water potentials of – 25 and – 35 kPa. The – 25
and – 35 kPa soil water potentials caused lower rygrass TDM yields, a
reaction not observed in white clover.
• Increased fertiliser N rates generally caused significant (P=0.05) increases in
perennial ryegrass TDM production. The same reaction was found with white
clover although not significant.
• The highest root dry mass was measured at the –35 kPa soil water potential
but this benefit was not reflected in increased dry matter production in any of
the two pasture crops.
• The relatively high –10 kPa water potential treatments were not detrimental to
the productivity of both crops as proved by non-significant differences in
TDM production.
• Results suggest that N movement to the root surface and subsequent N uptake
by perennial ryegrass were restricted at – 25 and – 35 kPa especially at the
lower (30 and 60 kg N ha-1) fertiliser rates. White clover was hovever not
affected showing its independency on soil N supply.
• The lower fertiliser N rates (30 and 60 kg N ha-1) were not able to maintain
prolonged high perennial ryegrass productivity as exposure to increased
photoperiod during October/November did not result in significant ryegrass
yield increases, a situation not observed for white clover.
• The application of fertiliser N may increase the number of perennial ryegrass
tillers and place ryegrass at a competitive advantage relative to white clover
especially if applied to pastures under unfavourable environmental conditions.

191
The application of fertiliser N to manipulate dry matter production under field
conditions were tested during autumn, early winter, late winter, early spring and late
spring. It is envisaged that fertiliser N strategies will relate to season of application
and this discussion will therefore be based on individual seasons within the cool
season of the year. This conclusion is further based on the assumption that the pasture
continuously grew under optimum environmental and management conditions as were
experienced during years 2000 and 2002. The application of fertiliser N on perennial
ryegrass-white clover pastures exposed to adverse conditions normally results in the
senescence of root nodules and fertiliser N may further suppress white clover growth
as was found in 2001. The application of fertiliser N under these conditions are
therefore very risky and generally not recommended as only ryegrass tiller
development will be stimulated placing white clover under severe competitive
disadvantages relative to the companion perennial ryegrass component.
This field study has shown that the application of fertiliser N, in four of the five
seasons tested, reduced the negative effect of the cool season (winter gap) on pasture
productivity. The results obtained by fertiliser N application during the different
seasons were as follows:
• Autumn – Extend pasture productivity later into autumn and thereby
effectively shortening the duration of the winter gap.
• Early winter – Increased dry matter production in the season characterized by
the most severe fodder shortages.
• Late winter – Advancing the attainment of pasture readiness for grazing
sooner in spring and thereby reducing the duration of the winter gap.
• Early spring – Same as late winter although less effective in terms of
advancing grazing readiness.
• Late spring – Too late to be of any benefit regarding the management of the
winter gap as pasture productivity was at the same - or higher levels of dry
matter production compared to dry matter production at the onset of the winter
gap.
Calculating the required N input (fertiliser N + recycled N) at a known initial clover
percentage is strongly influenced by the productivity of the pasture, the season when

192
applied and the predicted clover percentage at the end of the first regrowth cycle.
Multiple regression lines were developed for each of the three years covered by the
study. Decreasing and increasing clover contents were observed for years 2000 and
2002 respectively. Year 2001 represents a perennial ryegrass-white clover pasture
exposed to adverse environmental conditions causing possible senescence of clover
root nodules placing clover at a competitive disadvantage relative to ryegrass with
fertiliser N application. Using regression lines as listed in tables 7.2 and 8.2 shows
great potential in calculating the desired fertiliser N rate and the resultant expected
PDM production and maintaining a clover content of between 30 and 50% as
prescribed by Martin (1960). Varifying the regression lines on independent data could
result in the development of models instrumental in predicting the effect of fertiliser
N rate on dry matter production and expected clover content with a high degree of
accuracy.
Regression lines do not include parameters like leaching potential and N response
efficiencies and the final N rate should be set after some observations regarding
season of application had been taken into consideration.
Autumn application of fertiliser N
In addition to the results obtained through regression lines, the following information
will assist in deciding on the fertiliser N rate to be applied. Clover DM production
was not influenced by fertiliser N rate, indicating that rygrass dry matter production
was stimulated without any negative effects on clover productivity. Although the
highest DM production was found with applications of 150 kg N ha-1, the application
of 50 kg N ha-1 will result in the highest N response efficiencies as applications of 50,
100 and 150 kg N ha-1 resulted in N response efficiencies of 9.7, 7.2 and 6.5 kg
additional DM produced per kg N applied. Application of 150 kg N ha-1 also exceeds
the N uptake capacity of the pasture and thereby increases the risk of N leaching.
Early winter application of fertiliser N
Clover DM production was not influenced by fertiliser N rate, the drastic decrease in
clover % possibly the result of generally lower clover productivity as temperatures

193
decreased. Although the highest DM production was found with applications of 100
and 150 kg N ha-1, the application of 50 kg N ha-1 will result in the highest N response
efficiencies as applications of 50, 100 and 150 kg N ha-1 resulted in N response
efficiencies of 7.6, 6.6 and 5.0 kg additional DM produced per kg N applied.
Applications of 150 kg N ha-1, and to a lesser extent 100 kg N ha-1, also exceeded the
N uptake capacity of the pasture and thereby increase the risk of N leaching. Low
uptake, as shown by low herbage N yield (Table 9.12), and high carry-over of soil N
at the 100 and 150 kg N ha-1 rates render these rates as risky under environmental
conditions prevailing in the Western Cape Province.
Late winter application of fertiliser N
Clover DM production was not influenced by the 50 and 100 kg N ha-1 application
rates however 150 kg N ha-1 significally reduced clover DM content. Although the
highest DM production was found with applications of 100 and 150 kg N ha-1, the
application of 50 kg N ha-1 will result in the highest N response efficiencies as
applications of 50, 100 and 150 kg N ha-1 resulted in N response efficiecies of 10.3,
9.0 and 7.5 kg additional DM produced per kg N applied. Application of 150 kg N ha-
1 also exceeds the N uptake capacity of the pasture, as reflected in significantly higher
residual dry matter production during the second regrowth cycle. The higher N yield
(Table 9.12) shows that the pasture’s N uptake capacity increased relative to early
winter making the 100 kg N ha-1 treatment less risky compared to early winter.
Early spring application of fertiliser N
These results show that the application of 50 kg N ha-1 can be recommended as the
29% clover content found in 2000 quickly recovered to 36% at the end of the second
regrowth cycle. The application of fertiliser N might be used as management tool to
manupulate clover percentage as the clover fraction may benefit from higher
temperatures in late spring and summer as optimum temperatures for white clover
growth is higher than for perennial ryegrass. Clover DM production was reduced by
all fertiliser N rates illustrating the increased sensitivity of the pasture composition as
temperatures increase in spring. Although the highest DM production was found with
applications of 100 and 150 kg N ha-1, the application of 50 kg N ha-1 will result in the

194
highest N response efficiencies as applications of 50, 100 and 150 kg N ha-1 caused N
response efficiencies of 14.8, 12.1 and 9.0 kg additional DM produced per kg N
applied. No increases in RDM production relative to the 0 kg N ha-1 treatments
showed that the uptake capacity of the pasture increased due to increased pasture
productivity as a result of higher temperatures and increased photoperiod, causing a
sharp decrease in N leaching potential. The high N yield (Table 9.12) shows that the
pasture’s N uptake capacity increased by between 27.8 (48%) and 43, 3 kg N ha-1
(97%) if 100 kg N ha-1 rates in early spring as compared to early winter figures. The
same comparison at the 150 kg N ha-1 resulted in figures of 27.7 (42%) and 45.8 kg N
ha-1 (86%). The higher N uptake during the first regrowth cycle therefore clearly
reduced the risk of N leaching.
Late spring application of fertiliser N
The effect of the application of fertiliser N in late spring showed the same effects as
early spring. The dry matter yield increase was however too late, as the benefit of
increased dry matter production occured when early season dry matter yields in
unfertilized perennial ryegrass-white clover pastures as found at the 0 kg N ha-1
treatments, were at levels comparable with those at the onset of the winter gap.
This study has shown that the effect of the winter feed gap can successfully be
addressed through the application of fertiliser N during the cool season. The benefits
of strategic fertiliser N applications to perennial ryegrass-white clover pastures during
the cool season should however be evaluated in terms of the amount and quality of
available stored forage, the price and quality of available off-farm forages and the cost
per unit N (R kg-1) of the N fertiliser to be applied. The fertiliser N rate to be
considered will be dictated by the productivity of the pasture, clover content and
season when dry matter will be needed.
Future research
• Quantifying the recovery of recycled N under grazing is necessary to
determine the actual fertiliser N to be applied, as the N inputs in this study
refers to fertiliser N only. Under permanent grazing the contribution of

195
recycled N should be included as contributor to total N input and thereby
reducing the amount of chemical fertiliser N needed.
• Economic evaluation of the data collected in the field study.