
To Carry Out Tolerance Analysis of an Aeronautic Assembly
28
9 To Carry Out Tolerance Analysis of an Aeronautic Assembly Involving Free Form Surfaces in Composite Material Wilma Polini Dipartimento di Meccanica, Strutture, Ambiente e Territorio, Università degli Studi di Cassino, Cassino Italy 1. Introduction The increasing competition in aerospace industries has brought to cutting programs in manufacturing, design and assembly of aircraft structural frame. An aircraft is made of several assemblies including 3D complex shapes and the different functional requirements from design and manufacturing that these assemblies should respect are various. Nowadays the most important policy is the “Concurrent Engineering” which rule is to lead in a parallel way, design and manufacturing, making them communicate with the aim of reducing reworking times and discard products; such requirements are strongly felt in the aerospace industries. Tolerance analysis has a considerable weight in the Concurrent Engineering and represents the best way to solve assembly problems in order to ensure higher quality and lower costs. It is a critical step to design and to build a product and its importance has grown in the past years. In fact, the need to assign dimensional and geometric tolerances to assembly components is due to the standardization of the production and to the correct working of the assembly. The appropriate allocation of tolerances among the different parts of an assembly can result in lower costs per assembly and higher probability of fit, reducing the number of rejects or the amount of rework required on components. A product is designed and manufactured to perform a task, and its issue depends on one or more parameters of the assembly that are commonly called “project functions”. A project function is a dimension or a geometric variable of the assembly whose value depends by the dimensions, the geometry and the tolerances assigned to the components constituting the assembly. The nominal value and the tolerance range of the project function allow us to guarantee the assembly functionality. Practically, the dimensions and the tolerances of the assembly components combine, according to the assembly sequences, and generate the tolerance stack-up functions. Solving a tolerance stack-up function means to determine the nominal value and the tolerance range of a project function by combining the nominal values and the tolerance ranges assigned to the assembly components. Tolerance analysis may consider alternative assembly cycles in order to identify that one allowing to obtain the assembly functionality with the maximum value of the tolerance range assigned to the components. Huge problems may present during the assembly www.intechopen.com
Transcript of To Carry Out Tolerance Analysis of an Aeronautic Assembly
9
To Carry Out Tolerance Analysis of an Aeronautic Assembly Involving Free Form
Surfaces in Composite Material
Wilma Polini Dipartimento di Meccanica, Strutture, Ambiente e Territorio,
Università degli Studi di Cassino, Cassino Italy
1. Introduction
The increasing competition in aerospace industries has brought to cutting programs in
manufacturing, design and assembly of aircraft structural frame. An aircraft is made of
several assemblies including 3D complex shapes and the different functional requirements
from design and manufacturing that these assemblies should respect are various. Nowadays
the most important policy is the “Concurrent Engineering” which rule is to lead in a parallel
way, design and manufacturing, making them communicate with the aim of reducing
reworking times and discard products; such requirements are strongly felt in the aerospace
industries.
Tolerance analysis has a considerable weight in the Concurrent Engineering and represents the best way to solve assembly problems in order to ensure higher quality and lower costs. It is a critical step to design and to build a product and its importance has grown in the past years. In fact, the need to assign dimensional and geometric tolerances to assembly components is due to the standardization of the production and to the correct working of the assembly. The appropriate allocation of tolerances among the different parts of an assembly can result in lower costs per assembly and higher probability of fit, reducing the number of rejects or the amount of rework required on components. A product is designed and manufactured to perform a task, and its issue depends on one or more parameters of the assembly that are commonly called “project functions”. A project function is a dimension or a geometric variable of the assembly whose value depends by the dimensions, the geometry and the tolerances assigned to the components constituting the assembly. The nominal value and the tolerance range of the project function allow us to guarantee the assembly functionality. Practically, the dimensions and the tolerances of the assembly components combine, according to the assembly sequences, and generate the tolerance stack-up functions. Solving a tolerance stack-up function means to determine the nominal value and the tolerance range of a project function by combining the nominal values and the tolerance ranges assigned to the assembly components. Tolerance analysis may consider alternative assembly cycles in order to identify that one allowing to obtain the assembly functionality with the maximum value of the tolerance range assigned to the components. Huge problems may present during the assembly
www.intechopen.com

Advances in Composites Materials - Ecodesign and Analysis
196
process if the tolerance study on a sub-component was not carried out or was ineffectual (Whitney, 2004). It is even possible that the product design may have to be subsequently changed because of unforeseen tolerance problems not detected prior to actual assembly took place. In this case costs to the business will be high. It was estimated that 40%-60% of the production cost is due to the assembly process (Delchambre, 1996). The study of the tolerance stack-up functions, during the design stage, is very critical for aeronautic field whereas the complexity of the structures, to which high performances are required; so advanced material, design techniques and assembly technologies are needed. In fact, the aeronautic structures involve free-form surfaces, which are often made in composite material. They may be considered as non-rigid parts that could be subjected to significant distortion after the removal of manufacturing forces. This condition, know as free-state variation, is principally due to weight and flexibility of the part and the release of internal stresses resulting from fabrication. Many well-known approaches exist in the literature to tolerance analysis (Hong & Chang, 2002; Shen et al., 2004). However, these methods are not easy to apply, especially for complex aerospace assemblies, since they were born to deal with elementary features, such as plane, hole, pin and so on. So the aid of computer is called for. In the recent years, the development of efficient and robust design tools has allowed to foresee manufacturing or assembly problems during the first steps of product modeling by adopting a concurrent engineering approach. Today Computer Aided Tolerance (CAT) Software is readily available, but even if these tools provide good results they have not been widely used. Commercial CATs are not completely true to the GD&T standards and need improvement after a better mathematical understanding of the geometric variations. The user needs expertise and great experience combined with a through understanding of the packages’ theoretical base plus modeling principles to build a valid model and obtain relatively accurate results. Computer Aided Tolerance software efficiently deals with mechanical assemblies where the feature to align are planes, hole-pin, but it hardly treats of free-form surfaces to connect. The present work deals with the tolerance analysis of freeform surfaces belonging to parts in composite material and that may be non-rigid. The aim of this chapter is to present the steps to carry out the tolerance analysis of an assembly involving free-form surfaces in composite material by using a commercial CAT software. The great effort of the present work is overcome the limits of the CAT software to deal with dimensional and geometric tolerances applied to free form surfaces in composite material. This paper tries to answer to some questions on tolerance analysis without clear answer: What are the functions of the product, how do we flow down these key product functions through into its detail parts? How to model a free-form surface for a tolerance analysis? How to deal with a composite material for a tolerance analysis? How to improve the assembly process in order to reduce the tolerance impacts on these functions? An aeronautic component is considered as case study. This is an internal frame of a winch arm mounted on an helicopter. The part addressed in this paper is the after internal frame that allows to mount the fairing covers of the head of the winch arm directly on its structural beam. It is made in carbon fiber composite material. The frame is made with five layer of carbon fiber imbued in a matrix of epoxy resin for a total stack thickness of 1.65 mm. After the stratification process, a curing process is carried out by autoclave with a control of temperature and pressure. The weight of the part is about 350 g. Assembly operation among the parts are done by using special grub screws that are inserted in the holes of each
www.intechopen.com

To Carry Out Tolerance Analysis of an Aeronautic Assembly
197
component. No adhesives or resins are used to secure the surfaces, since a perfect adhesion is not required. The paper is organized as follows: In Sec. 2, the mean of tolerance analysis is deeply discussed. In Sec. 3, the main models found in the literature for tolerance analysis are presented. In Sec. 4, the main functions of the commercial CAT softwares are shown. In Sec. 5, the steps of the proposed method for tolerance analysis of an assembly involving free-form surfaces in composite material are shown. In Sec. 6, the application of the proposed steps to an aeronautic case study is deeply discussed.
2. Tolerance analysis
The aim of a tolerance analysis of an assembly is to evaluate the cumulative effect due to the
tolerances, that are assigned to the assembly components, on the functional requirements of
the whole assembly. Each functional requirement is schematized through an equation, that
is usually called stack-up function, whose variables are the model parameters that are
function of the dimensions and the tolerances assigned to the assembly components. It looks
like
FR = f(p1, p2,…,pn) (1)
where FR is the considered functional requirement, p1,…,pn are the model parameters and f(p) is the stack-up function, that is usually not linear. A functional requirement is usually a characteristic that relates two features. Its analytical
expression is obtained by applying the equations of the Euclidean geometry to the features
that define the functional requirement or to the points of the features that define the
functional requirement.
A stack-up function has to model two possible assembly variations. The first variation is due
to the tolerances assigned to the features of the assembly components. The obtained model
(that is called “local model”) has to be able to schematize all the tolerance kinds, i.e.
dimensional, form, and so on, but in the same time it has to be able to represent the
Envelope Principle (Rule # 1 of ASME standard) or the Independence Principle (according
with ISO 8015 standard) applied to different dimensions of the same part. The local model has
to define the range of variation of the model’s parameters from the assigned tolerances and
it has to schematize the interaction among the assigned tolerance zones. The second
variation is due to the contact among the assembly components. The variability of the
coupled features, by which the link among the parts is made, gives a deviation in the
location of the coupled parts. The resulting model (that is called “global model”) has to be
able to schematize the joints with contact and the joints with clearance between the coupled
features.
Once modeled the stack-up functions, they may be solved by means of a worst case or a
statistical approach (Creveling, 1997). To carry out a worst case approach, it is needed to
define the worst configurations of the assembly (i.e. those configurations due to the
cumulative effect of the smallest and the highest values of the tolerances assigned to the
assembly components) that satisfy its assigned tolerances. This means to solve a problem of
optimization (maximization and/or minimization) under constraints due to the assigned
tolerances. Many are the methods developed by the literature to carry out a worst case
approach (see Luenberger, 2003). To carry out a statistical approach, it is needed to translate
www.intechopen.com

Advances in Composites Materials - Ecodesign and Analysis
198
each tolerance assigned to an assembly component into one or more parameters of the stack-
up function. Therefore, a Probability Density Function (PDF), that is function of both the
manufacturing and the assembly processes, is assigned to each parameter. Being the
definition of the relationship among the production and assembly processes and the
probability density function of the tolerance of the component strongly hard to estimate, the
commonly used assumption is to adopt a Gaussian probability density function. Moreover,
a further assumption is to consider independent the parameters used to represent the
variability of the features delimiting each dimensional tolerance. The variation of the FR is
obtained by means of a Monte Carlo simulation technique (Nigam & Turner, 1995; Nassef &
ElMaraghy, 1996) it is usually calculated as ± three times the estimated standard deviation
(three sigma paradigm of (Creveling, 1997)).
3. Literature review
The foremost works on the tolerance modeling problem are found in (Requicha, 1983; Requicha, 1993) that introduced the mathematical definition of the tolerance’s semantic. He focused on constructing semantically correct tolerance zones and he proposed a solid offset approach for this purpose. Since then, a lot of models are proposed by the literature to perform the tolerance analysis of an assembly whose components may be considered as rigid parts (Hong & Chang, 2002). The vector loop model uses vectors to represent relevant dimensions in an assembly (Chase et al., 1995; Chase et al., 1996; Chase et al., 1997a). Each vector represents either a component dimension or an assembly dimension. Vectors are arranged in chains or loops to reproduce the effects of those dimensions that stack together to determine the resultant assembly dimensions. Three types of variations are modelled in the vector loop model: dimensional variations, kinematic variations and geometric variations. Dimensional variations defined by dimensional tolerances are incorporated as +/- variations in the length of the vector. Kinematic variations describe the relative motions among mating parts, i.e. small adjustments that occur at assembly time in response to the dimensional and geometric variations of the components. Geometric variations capture those variations that are imputable to geometric tolerances. The variational solid modelling approach involves applying variations to a computer model of a part or an assembly of parts (Martino & Gabriele, 1989; Boyer & Stewart, 1991; Gupta & Turner, 1993). To create an assembly, the designer identifies the relevant features of each component and assigns dimensional and geometrical tolerances to them. In real conditions (i.e. manufactured part), the feature has been characterized by a roto-translational displacement with respect to its nominal position. This displacement is modelled to summarize the complete effects of the dimensional and geometric variations affecting the part by means of a differential homogeneous transformation matrix. Once the variabilities of the parts are modelled, they must be assembled together. Another set of differential homogeneous transformation matrices is introduced to handle the roto-translational deviations introduced by each assembly mating relation. The matrix model aims at deriving an explicit mathematical representation of the boundary of the entire spatial region that encloses all possible displacements due to one or more variability sources. In order to do that, homogenous transformation matrices are considered as the foundation of the mathematical representation. A displacement matrix is used to describe any roto-translational variation a feature may be subjected to. The matrix model is
www.intechopen.com

To Carry Out Tolerance Analysis of an Aeronautic Assembly
199
based on the positional tolerancing and the Technologically and Topologically Related Surfaces (TTRS) criteria (Clément et al., 1998); by classifying the surfaces into several classes, each characterized by some kind of invariance with respect to specific displacement kinds (e.g. a cylinder is invariant to any rotation about its axis) the resulting displacement matrix can be simplified (Clément et al., 1994). In the terminology adopted by the jacobian model approach, any relevant surface involved in the tolerance stack-up is referred to as functional element (FE). In the tolerance chain, FEs are considered in pairs: the two paired surfaces may belong to the same part (internal pair), or to two different parts, and paired since they interact as mating elements (kinematic pair, also referred to as external pair). The parts should be in contact to be modelled by this model. Transformation matrices may be used to locate a FE of a pair with respect to the other: these matrices can be used to model the nominal displacement between the two FEs, but also additional small displacements due to the variabilities modelled by the tolerances. The main peculiar aspect of the jacobian approach is how such matrices are formulated, i.e. by means of an approach derived from the description of kinematic chains in robotics (Laperrière & Lafond, 1999; Laperrière & Kabore, 2001). The torsor model uses screw parameters to model three dimensional tolerance zones (Chase et al., 1996). Screw parameters are a common approach adopted in kinematics to describe motion; they are used to describe a tolerance zone, since a tolerance zone is the region where a surface is allowed to move. The screw parameters are arranged in a particular mathematical operator called torsor, hence the name of the approach. To model the interactions between the parts of an assembly, three types of torsors (or Small Displacement Torsor SDT) are defined (Ballot & Bourdet, 1997): a part SDT for each part of the assembly to model the displacement of the part; a deviation SDT for each surface of each part to model the geometrical deviations from nominal; a gap SDT between two surfaces linking two parts to model the mating relation. The Tolerance Maps model is being developed at the Arizona State University (Davidson et al., 2002; Mujezinovic et al., 2004; Ameta et al., 2007). It is based on a two-levels model: the local model, that models part variations in order to consider the interactions of the geometric controls applied to a feature of interest and the global model that interrelates all control frames on a part or assembly. A Tolerance-Map (T-Map) is a hypothetical solid of points in n-dimensions which represent all possible variations of a feature or an assembly. Overlaying the coordinates of the T-Map the stack-up equations to perform the tolerance analysis are obtained. However, these methods are not easy to apply, especially for complex aerospace assemblies, since they were born to deal with elementary features, such as plane, hole, pin and so on. So the aid of computer is called for. In the recent years, the development of efficient and robust design tools has allowed to foresee manufacturing or assembly problems during the first steps of product modeling by adopting a concurrent engineering approach. Efforts to deal with the tolerance analysis in aeronautic field were carried out. Sellakh proposed an assisted method for tolerance analysis of aircraft structures through assembly graphs and TTRS theory (Sellakh et al., 2003). Marguet presented a methodology to analyse and optimise the assembly sequence of simple shape assemblies (Marguet & Mathieu, 1998; Marguet et Mathieu, 1999). Ody showed a comparison among Error Budgeting techniques and 3D Tolerance Software Packages (Ody et al., 2001). Those papers present solutions of typical mechanical assemblies that involve the alignment of plane, holes and pins, but the aeronautic surfaces have a free form generally.
www.intechopen.com

Advances in Composites Materials - Ecodesign and Analysis
200
Some are the works found in the literature to deal with the tolerance analysis of compliant assemblies, i.e. assemblies that contain deformable parts, such as sheet-metal, plastics, composites and glass. Some of the first research related to this area was done by (Gordis & Flannely, 1994). They used frequency domain analysis to predict in-plane loads and displacements from misalignment of fastener holes in flexible components. Liu and Hu have used simple finite element models to predict assembly variation of flexible sheet metal assemblies (Liu & Hu, 1995; Liu & Hu, 1997). Their work was focused on the effect of part fixturing and order of assembly. Merkley uses the assumptions of Francavilla and Zienkiewicz (Francavilla & Zienkiewicz, 1975) to linearize the elastic contact problem between mating flexible parts (Merkley, 1998). Merkley derived a method for predicting the mean and the variance of assembly forces and deformations due to assembling two flexible parts having surface variations. He describes the need for a covariance matrix representing the interrelation of variations at neighboring nodes in the finite element model. The interrelation is due to both surface continuity, which Merkley calls geometric covariance, and elastic coupling, which he calls material covariance. Merkley used random Bezièr curves to describe surface variations and to calculate geometric covariance. Bihlmaier presents a new method for deriving the covariance matrix using spectral analysis techniques (Bihlmaier, 1999). The new method, called the Flexible Assembly Spectral Tolerance Analysis method, or FASTA, also includes the effect of surface variation wavelength on assemblies.
4. Computer Aided Tolerancing software
Today Computer Aided Tolerance (CAT) software is readily available for tolerance analysis of rigid part assemblies, but even if these tools provide good results they have not been widely used (Turner & Gangoiti, 1991; Chase et al., 1997b; Salomons et al., 1998; Prisco &
Giorleo, 2002). The CAT system known as CE/TOL® is based on the vector loop model. Many commercial CAT software packages are based on the variational model, such as eM-TolMate
of UGS®, 3-DCS of Dimensional Control Systems®, VisVSA of UGS®. Commercial CATs are not completely true to the GD&T standards and need improvement after a better mathematical understanding of the geometric variations. The user needs expertise and great experience combined with a through understanding of the packages’ theoretical base plus modeling principles to build a valid model and obtain relatively accurate results. Computer Aided Tolerance software efficiently deals with mechanical assemblies where the feature to align are planes, hole-pin, but it hardly treats of free-form surfaces to connect. A CAT software shares the same user interface and the same database of a CAD package; the CAT information is stored within the CAD model with no need of translation.
The CAT software used in the following of this work is eM-TolMate of UGS® and, therefore, further information about this package has been discussed in the following. EM-TolMate involves the building of the model through the feature definition, the tolerance specification, the assembly and the measurement definitions. The feature definition process must be performed for each component of the final assembly (there must be a separate CAD model for each component); it uses the existing CAD geometry of the model to create its own features. Therefore, full associativity with CAD entities is assured. The basic features supported in eM-TolMate are plane, pin (cylindrical, tapered, threaded), hole, point, tab, slot, constant profile surface, constant cross section, sphere, surface of revolution, general 3D surface. Edge features (for thin-walled parts) are
www.intechopen.com
To Carry Out Tolerance Analysis of an Aeronautic Assembly
201
also available. In many cases, the user needs to mathematically derive some feature from existing features (e.g. line of intersection between a plane and a parallel cylinder, centroid of several points or best fit line between several points). The tolerance specification allows the user to define the dimensional or geometric tolerances supported by the existing international standards of GD&T (ASME and ISO). There is no limit on the number of tolerances applied to a feature. Diameter modifier and material modifier (MMC and LMC) may be added to tolerances applied to a feature of size. Available statistical distributions are normal (default), uniform, triangular, exponential, gamma, Weibull, Laplace or Pearson distribution. The assembly definition creates an empty CAD model which represents the assembly. The sequence of assembly, represented by a tree structure, has to be defined by using the source components into the correct position of the assembly tree. Afterwards the assembly operations have to be specified by the selection of the mating features that are involved in each operation. Except for the first component of the assembly, the assembly operation has to be defined for each component which will be constrained to the target features of the components inserted before it in the tree. The constraint scheme can be isostatic, but also under or overconstrained. The measurement definition specifies the geometric relationship that is to be put under control in the assembly or in the single part. EM-TolMate supports various types of measurements: linear distance, angle, clearance, virtual size. The built model is simulated according to Monte Carlo technique in a statistical approach. EM-TolMate determines simulation order for each feature on each component, the tolerance priority order and the tolerance degree of control (i.e. the degrees of freedom constrained by the tolerance on a feature). The system warns the user about any lack of completeness or ambiguity in tolerancing scheme (e.g. loops, unreferenced datums). Based on this information, eM-TolMate uses random numbers to create several sets of feature variations from nominal geometry, according to the specified tolerances. The simulations (one for each set of variations) proceed based on the mating features specified by the user and components are assembled into position relative to each other. Finally, measurements of the actual assembly are performed and the results are stored in memory. Worst-case limits can be estimated when the sample size of simulations are big enough and setting the estimated limits to “Actual”. To assure a high level of accuracy, a large number of simulations has to be carried out. The user performs the results analysis phase interactively after the simulations are finished. There are two kinds of results: the variation analysis, which computes statistical parameters and reports the overall variation range for each measurement, and the contributors analysis, which determines the sources of variation and presents this information in a sorted list. The user may view the results analysis on the screen or output the information to a file in various file formats.
5. The proposed method
Concurrent Engineering imposes that the design of the manufacturing and the assembly jigs, of the manufacturing and assembly cycles, be in the same time of the product design. In fact, only the concurrent design of the final product, of the single components, of the manufacturing processes and jigs, of the assembly cycle and jigs and of the inspection procedures assures to achieve a high quality with the smallest costs.
www.intechopen.com
Advances in Composites Materials - Ecodesign and Analysis
202
The proposed method adapts the steps of the tolerance analysis process suggested by the eM-TolMate® package and described in the previous paragraph to the case of an assembly involving non-rigid freeform surfaces in composite material. It is constituted by the following 7 steps: a. Verify the stiffness of the assembly components. Non-rigid parts may be subjected to
significant distortion after the removal of manufacturing forces. This condition, known
as free state variation, is principally due to weight and flexibility of the parts and the
release of internal stresses resulting from fabrication. This distortion is acceptable if the
part surfaces remain within the indicated tolerances, once the part is coupled to another
part of the final product by applying reasonable forces. Therefore, the first step of the
proposed method is to analyse the internal stress and the relative strain of each
assembly components due to the assembly sequence, since those components have
freeform surfaces of a small thickness in composite material. This means to simulate the
assembly configuration of each assembly components through a fixturing equipment on
a coordinate measuring machine and, then to measure the displacements from the
nominal configuration represented by the CAD model through an inspection process.
This is true if the effect of the inspection process on the measured deviation is indeed
non significant and this hypothesis needs to be verified. The displacements between
the real part and the nominal one, obtained in the inspection process, may be used as
input values for a structural numerical analysis with the objective to obtain the stress
and strain fields induced in the material when the part is assembled in the final
product. The numerical analysis may be carried out with a Finite Element Method®,
but before implementing the real case simulation, an assessment of the software
capability on composite material is required through a simple 2D case study. If the
results of the numerical analysis demonstrate that the deformations induced by the
assembly sequence are at least of an order of magnitude smaller than the applied
tolerances, the part may be considered rigid and the models or software of the
traditional tolerance analysis literature may be applied. In this way the complexity to
consider the compliant of the assembly components may be avoided.
b. Design the measurements of the assembly. A first analysis of the assembly working allows
to identify all the functional requirements that the product should perform. This means
translating the functionality of the design assembly in all the couplings or kinematic
constraints among assembly components that are needed for the assembly to work
correctly. Then, the pairs of assembly components involved in each functional
requirements are defined. The features of each pair of components, that are involved in
each functional requirement, are identified and are generally assigned to them a set of
tolerances. Therefore, the functional requirements and the assembly constraints are
translated into measurement of the assembly, while the coupling parts and their feature
are passed to the following step of the method. A widespread measurement in
aeronautic field is the distribution of the minimum distances along two faced freeform
surfaces, e.g. when the adhesive thickness between the faced parts to connect should be
as constant as possible in order to obtain an efficient structural connection and to avoid
local compressions at the interface of faced parts due to strong reduction of thickness.
In this case it has been demonstrated that the minimum distance among the two
patterns of points, belonging to the two faced surfaces, calculated by projecting the
point to point distance along the direction perpendicular to the nominal surfaces is very
www.intechopen.com
To Carry Out Tolerance Analysis of an Aeronautic Assembly
203
near to the minimum distance and it is easy to calculate by eM-TolMate® (Polini et al.,
2007). c. Define the features of the assembly components, specify the tolerances and the related statistical
distribution. The features of the coupling parts of the assembly may be free-form
surfaces or basic surfaces. The free-form surfaces of each assembly components have to
be schematically represented by a set of control points. The number and distribution of
the control points depends by the slope of the free form surface. If two freeform
surfaces are faced, the pattern of control points of the second surface may be obtained
by intersecting the second surface with the pattern of vectors, that are normal to the
first surface in each control point. The tolerances applied to the freeform surface should
be applied to each control point defined on the surface. The basic surfaces are plane,
pin, hole, point, tab, slot, constant profile surface, constant cross section, sphere, surface
of revolution, general 3D surface, edge features and derived features. Dimensional
tolerancing is supported as +/- tolerances (symmetric or not, sizes or distance from an
origin feature) and for size tolerances of pins, holes, slots and tabs. Tolerance attributes
can be freely modified to reflect effectively the parameters of actual features. The most
common attribute is the tolerance probability density function for each tolerance
applied to each feature of the assembly component. The probability density function
depends by the manufacturing process of the feature and it is generally hardly to
estimate. Therefore, the default distribution is assumed to be the Gaussian, since it is
symmetric, it is simply to use and it is well known by the literature. However, it is
always to change it. Finally, it is needed to verify the datum reference frames (DRFs),
the assembly should have its DRF, that is generally considered “global”; while each
component should have its DRF, that is considered “local”. Moreover, the elements
(planes, axes and so on) that constitute a local DRF should be easily identified,
manufactured with the design specifications and accessible for verification. The
elements of the local DRFs should be qualified by tolerances. The elements of the local
DRFs should be used to manufacture, to assembly and to control the assembly
components. These simple rules on the definition of the DRFs allow to obtain whose
components may be manufactured, assembled and controlled. Obviously, they have to
be applied by means of a concurrent approach that is implemented by a designer of
product, by a planner of manufacturing processes, by a designer of assembly cycles and
by a designer of inspection processes.
d. Design the assembly cycle and jigs. If required, the assembly jigs should be designed at first. The assembly jigs should have a plane and two pins in order to locate and fix the coupling component. The tooling hole (TH) system is the assembly system that is widespread in aeronautic field and consists in jigs mated with the assembly components by means of pins that are inserted into tooling holes (TH) located on the assembly components. The tolerances of the TH are very critical, since they influence the location and orientation among the different components of the assembly and, therefore, the functional requirements of the assembly. Some suggestions to choice the tolerances of a TH may be found in (Marziale & Polini, 2007).The positioning of a component on its jig is made by the contact of two planar surfaces (one on the part and one on the assembly jig) and the clearance fit between two Tooling Holes (positioned on the part) with the corresponding pins (positioned on the assembly jig), as shown in Fig. 1. The position of the THs has an important role in order to limit the flag waving effect
www.intechopen.com

Advances in Composites Materials - Ecodesign and Analysis
204
of the component as regards its assembly jig, since a small change in THs position cause a great variation in the location and the orientation of the part on the corresponding jig due to the large dimensions of the parts. Therefore, the distance among the tooling holes must be as larger as the dimensions of the part increases, but this condition is difficult to achieve in some practical cases. Another important consideration is that it is preferred to position the THs out of the part shape, on appendixes that will be trimmed once the part is assembled, in order to have lower production costs. Through these considerations an assembly jig has to be designed for each part. Each assembly jig has a set of tolerances, since it is realised by manufacturing processes.
Fig. 1. Aircraft skin’s jig with tooling hole system
The design of the assembly cycle foresees as first step the location of each component on its designed jig. Each component has micro-movements respect to its jig due to the tolerances of the jig and of the component applied to the coupling system, i.e. to the TH system. These micro-movements influence the positioning of the part and, therefore, they have to be characterized by means of probability density function, such as done for tolerances of the parts. The probability density function depends by the manufacturing process of the jig and the component and by the assembly constraints. It is generally hardly to estimate, since it should involve many experimental tests. The default probability density function is the Gaussian. Therefore, each couple of components is assembled by moving near the related jigs and, then, by putting the constrain elements, such as adhesive, bolts or screws. In this way a sub-assembly more and more complex is generated up to obtain the final product. The positioning of the components and, therefore, the accuracy of the final product, depends by the stack-up function of dimensions and tolerances belonging to the components and to the jigs.
e. Choose the simulation runs and carry out simulations. Monte Carlo simulation has been used to reproduce the combined effect of all the assigned tolerances and the component degrees of freedom respect the assembly jigs on the assembly functional requirements. The assigned tolerances and the component degrees of freedom have been simulated by means of the probability density functions assigned in the previous steps. The number of runs of simulation has been fixed at the value for which the estimated mean and standard deviation of the obtained probability density function of each functional requirement achieve an asymptotic trend. A step by step procedure has been adopted to evaluate the simulation runs, the starting value has been 10000 runs.
supportingsaddles
www.intechopen.com

To Carry Out Tolerance Analysis of an Aeronautic Assembly
205
f. Analyse the results. During the assembly simulation, the results of the measurement
calculations are stored in memory. When the assembly simulation is finished, a table
containing all the measurement results remains in memory. These results may be
exported to make statistical analysis. It is possible to evaluate the distribution of the
results of each measurement and, therefore, to calculate the percentage of parts outside
the tolerance ranges. Another possibility is to evaluate the reasonable tolerance range to
assign to each measuring by starting from its estimated distribution in order to satisfy
the tolerance analysis. Finally, a sensitivity analysis may be carried out in order to
identify the tolerances mainly affecting each gap trend. The percentage weight of each
tolerance has been calculated by evaluating the variance of a measurement σTOT, when
all the tolerances are applied to assembly’s components, and the variance of the same
measurement σTOT-Ti, once i-th tolerance is not applied to the assembly’s components:
2 2
2TOT TOT Ti
i
TOT
Cσ σ
σ −−= [%] (2)
6. Application example
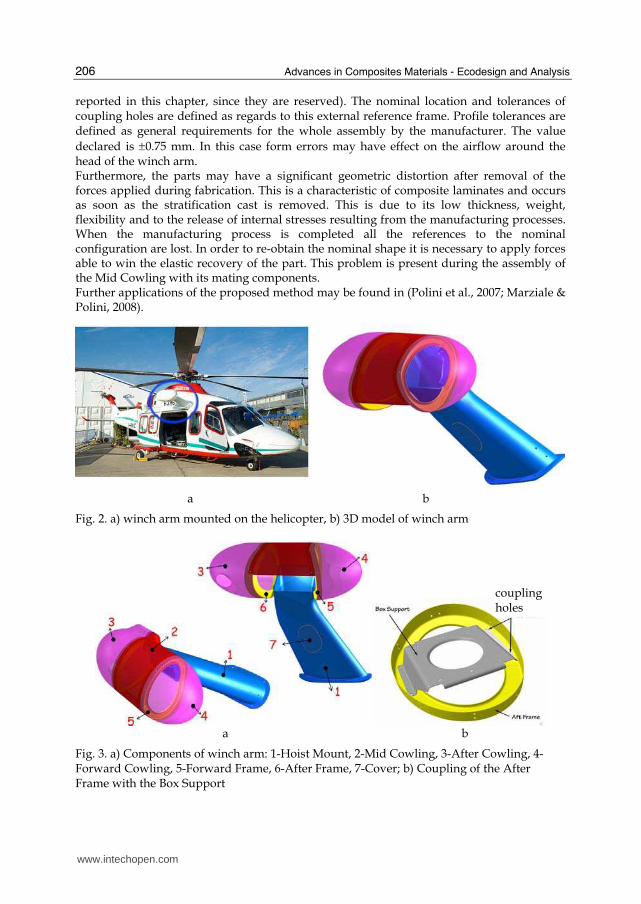
6.1 Case study The proposed approach has been carried out considering as case study an aeronautical
component. This is a winch arm mounted on an helicopter (see Fig. 2). The winch arm is the
external unit that allows the helicopter to rescue people or things where it is impossible to
land through a rope lowered by an electrical motor.
The winch arm have a main arm and a head covered by three thin fairings. On the main arm (the part with number 1 in Fig. 3a) are assembled two frames (the yellow
parts 5 and 6 in Fig. 3a) that are two cambered elements connecting and supporting all the
structure. The parts with number 5 and 6 in Fig. 3a are the forward and the after internal
frames that allow to mount the fairing covers of the head (parts 3 and 4 in Fig. 3a) of the
winch arm directly on its structural beam. Finally, the Mid Cowling (part 2 in Fig. 3a) is the
central exterior fairing that covers the head of the winch arm The part 7 in Fig. 3a is a cover
for the overhaul of the winch arm. All the components of the winch arm assembly are made
in carbon fiber composite material. Both of the frames are made with five layers of carbon
fibers imbued in a matrix of epoxy resin for a total stack thickness of 1,65 mm. The carbon
fibers are oriented in a ± 45° alternated arrangement within a steel cast which reproduces
the part. After the stratification process, a curing process is carried out by autoclave with a
control of temperature and pressure. The obtained part has size of 300 mm x 400 mm x 500
mm.
The weight of each part is about 350g. Assembly operations among the parts are done using
of special grub screws that are inserted in the holes of each component. No adhesives or
resins are used to secure the surfaces, since a perfect adhesion is not required.
Even if the form of the frame may appear simple, the shapes of its surfaces aren’t regular.
The After Frame is coupled to a metallic part, called Box Support, that allows to fix the
engine of the winch arm (see Fig. 3b).
Each part has three datum planes as component references. Those planes are external to the part geometry, as shown in Fig. 4 for the Mid Cowling (dimensions and tolerances are not
www.intechopen.com
Advances in Composites Materials - Ecodesign and Analysis
206
reported in this chapter, since they are reserved). The nominal location and tolerances of coupling holes are defined as regards to this external reference frame. Profile tolerances are defined as general requirements for the whole assembly by the manufacturer. The value
declared is ±0.75 mm. In this case form errors may have effect on the airflow around the head of the winch arm. Furthermore, the parts may have a significant geometric distortion after removal of the forces applied during fabrication. This is a characteristic of composite laminates and occurs as soon as the stratification cast is removed. This is due to its low thickness, weight, flexibility and to the release of internal stresses resulting from the manufacturing processes. When the manufacturing process is completed all the references to the nominal configuration are lost. In order to re-obtain the nominal shape it is necessary to apply forces able to win the elastic recovery of the part. This problem is present during the assembly of the Mid Cowling with its mating components. Further applications of the proposed method may be found in (Polini et al., 2007; Marziale & Polini, 2008).
a b
Fig. 2. a) winch arm mounted on the helicopter, b) 3D model of winch arm
a b
Fig. 3. a) Components of winch arm: 1-Hoist Mount, 2-Mid Cowling, 3-After Cowling, 4-Forward Cowling, 5-Forward Frame, 6-After Frame, 7-Cover; b) Coupling of the After Frame with the Box Support
coupling holes
www.intechopen.com
To Carry Out Tolerance Analysis of an Aeronautic Assembly
207
Fig. 4. Datum planes of the Mid Cowling
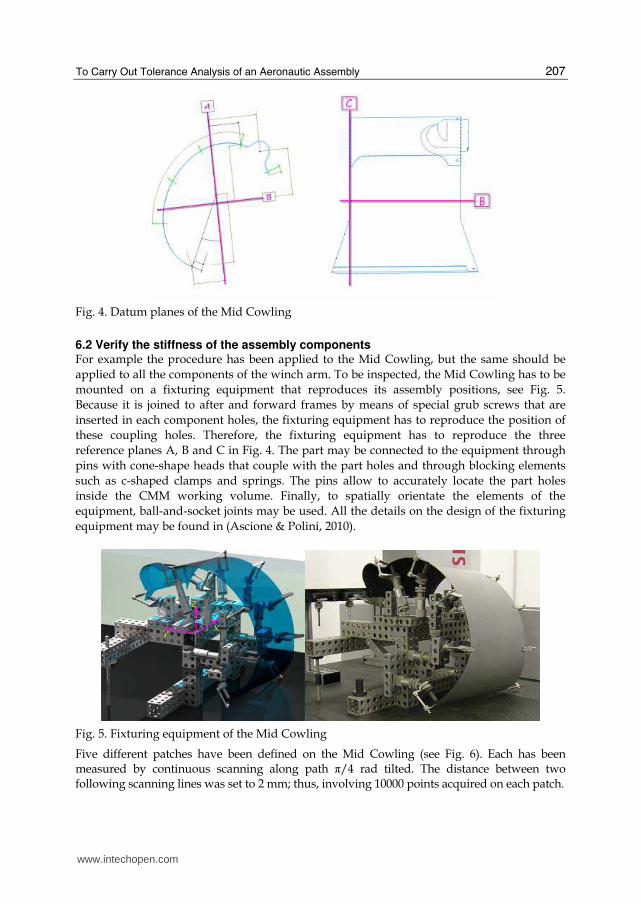
6.2 Verify the stiffness of the assembly components For example the procedure has been applied to the Mid Cowling, but the same should be
applied to all the components of the winch arm. To be inspected, the Mid Cowling has to be
mounted on a fixturing equipment that reproduces its assembly positions, see Fig. 5.
Because it is joined to after and forward frames by means of special grub screws that are
inserted in each component holes, the fixturing equipment has to reproduce the position of
these coupling holes. Therefore, the fixturing equipment has to reproduce the three
reference planes A, B and C in Fig. 4. The part may be connected to the equipment through
pins with cone-shape heads that couple with the part holes and through blocking elements
such as c-shaped clamps and springs. The pins allow to accurately locate the part holes
inside the CMM working volume. Finally, to spatially orientate the elements of the
equipment, ball-and-socket joints may be used. All the details on the design of the fixturing
equipment may be found in (Ascione & Polini, 2010).
Fig. 5. Fixturing equipment of the Mid Cowling
Five different patches have been defined on the Mid Cowling (see Fig. 6). Each has been measured by continuous scanning along path π/4 rad tilted. The distance between two following scanning lines was set to 2 mm; thus, involving 10000 points acquired on each patch.
www.intechopen.com

Advances in Composites Materials - Ecodesign and Analysis
208
a) b)
Fig. 6. Detected scan patches; a)top view; b) front view
The force of 0.1N applied by CMM probe to the non-rigid freeform surface of the Mid Cowling does not produce a significant deformation. In fact, the maximum deviation is equal to 0.35 µm as shown in (Moroni et al., 2007), while typical value of profile tolerance in
this kind of application is around 50 μm. The deviation along the normal curvature of the surface of the part was calculated for each acquired point. The distribution of the deviations on the surface represents the overall error of shape. Such a value may be seen as the sum of three different contributions; the first due to component production process; the second due to the assemblage of the part and the third due to the measuring procedure. The deviation was calculated for each acquired point with Holos® measuring software. The data analysis has been performed on each patch extracted from the Mid Cowling. From the analysis of distance colour maps it is possible to observe that no systematic behaviour of the deviations is present (see Fig. 7). To estimate the repeatability of the measuring procedure, the scanning on the 5 patches was repeated 5 times, maintaining the same Mid Cowling coupling position on the equipment. Therefore, the inspecting procedure may be considered the only responsible of variability of the measuring results. Then, the average deviation was calculated for each of the 50000 measuring points. Finally, the difference between each measurement point and the average deviation was calculated. The values thus calculated were distributed according to a Gaussian probability density function, as verified with the Anderson-Darling statistic test (p-value > 0.1). The value of the overall repeatability of the measuring process, that has been calculated as the standard deviation of the sample of 250000 values, is equal to 8.5 mμ . This value is very
small; this means to say that the effect of the inspection process on the measured deviation is indeed non significant. The idea introduced in this work is that the displacement between the real part and the nominal one, obtained in the inspection process, may be used as input values for a structural numerical analysis with the objective to obtain the stress and strain fields induced in the material when the part is assembled in the final product. That is possible because the measured field of displacement represent the real configuration of the component in its assembly state. The inspection process simulate the assembly configuration of the real part; therefore, the measured displacements are the differences from the real part, assembled on the winch arm, and its nominal configuration represented by the CAD model. The measured displacements have been used as loads applied on the components in its nominal
www.intechopen.com

To Carry Out Tolerance Analysis of an Aeronautic Assembly
209
configuration for the numerical simulation. In this way the results of the structural analysis are characteristic values of the assembled parts, since the assembly process locks the components of the assembly in the same way the assembly is bounded in the inspection process and in the numerical simulation. The numerical analysis has been carried out with the MSC_Patran/Nastran® software but, before implementing the real case simulation, an assessment of its capability on composite material has been required to obtain a validation of the results for our case. In this sense a matching procedure between experimental results and numerical results on the same material in the same configuration has been necessary.
Fig. 7. Chromatic mapping of the deviations between measured points and nominal geometry
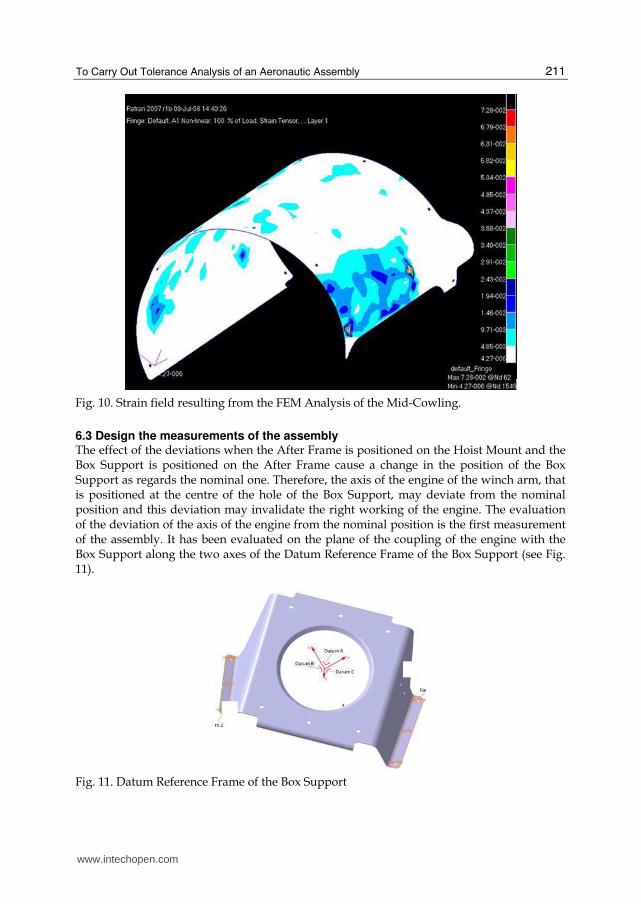
Having available experimental results for a tensile test on the composite material constituting the Mid Cowling, the matching procedure has been carried out by simulating the same test mean the numerical software and then comparing the obtained values with the correspondents of experimental test. All the details of the tensile test are reported in (Ascione & Polini, 2010). Fig. 8 shows in blue the stress-strain curve obtained from the analysis for the first node of the mesh (the node at the intersection of the two plane of symmetry) and in green the stress-strain curve for the experimental test. It is possible to see that the results obtainable with the used numerical software on the considered material are reliable. The same procedure used to simulate the tensile test has been performed to model the Mid Cowling. In Fig. 9 it is possible to see the finite element representation of the Mid Cowling, where triangular shell elements have been used to replace the continuous geometry. In this case triangular elements have been used, since this kind of elements is the best approximation of the distribution of the displacements measured through the inspection process. In Fig. 9 there are green and light blue elements, since the green elements represent the part’s geometry, while the light blue elements represent the points where the displacement has been applied. Further details on the setting of the numerical analysis are deeply described in (Ascione & Polini, 2010). The results of this simulation have been the stress and strain fields induced in the Mid Cowling subjected to the loads explained above. The strain field is showed in Fig. 10. The values of the strain showed in these results are congruent as magnitude with those ones of
www.intechopen.com

Advances in Composites Materials - Ecodesign and Analysis
210
the tensile test and with the values of the displacements imposed as loads. Therefore, it is possible to consider the obtained values representative of the real state of the component in
its real configuration of assembly. The maximum value of the strain field is about 7.28 μm that is very smaller than the applied tolerances. Therefore, the Mid Cowling may be considered as a rigid part for the tolerance analysis.
Fig. 8. Stress-strain diagram with green curve for the experimental test and with red curve for the numerical results
Fig. 9. FEM model used to simulate the Mid Cowling
www.intechopen.com
To Carry Out Tolerance Analysis of an Aeronautic Assembly
211
Fig. 10. Strain field resulting from the FEM Analysis of the Mid-Cowling.
6.3 Design the measurements of the assembly The effect of the deviations when the After Frame is positioned on the Hoist Mount and the Box Support is positioned on the After Frame cause a change in the position of the Box Support as regards the nominal one. Therefore, the axis of the engine of the winch arm, that is positioned at the centre of the hole of the Box Support, may deviate from the nominal position and this deviation may invalidate the right working of the engine. The evaluation of the deviation of the axis of the engine from the nominal position is the first measurement of the assembly. It has been evaluated on the plane of the coupling of the engine with the Box Support along the two axes of the Datum Reference Frame of the Box Support (see Fig. 11).
Fig. 11. Datum Reference Frame of the Box Support
www.intechopen.com
Advances in Composites Materials - Ecodesign and Analysis
212
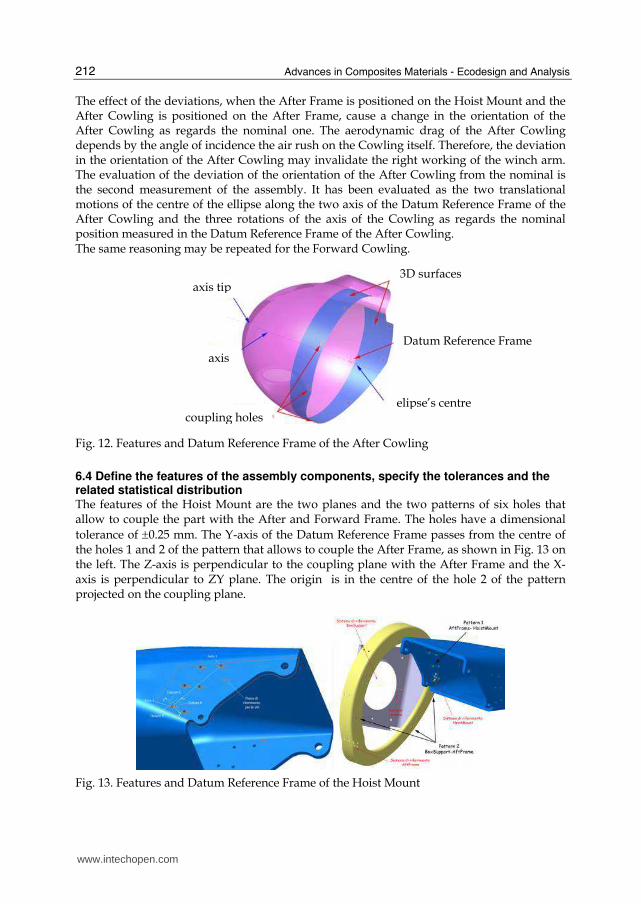
The effect of the deviations, when the After Frame is positioned on the Hoist Mount and the After Cowling is positioned on the After Frame, cause a change in the orientation of the After Cowling as regards the nominal one. The aerodynamic drag of the After Cowling depends by the angle of incidence the air rush on the Cowling itself. Therefore, the deviation in the orientation of the After Cowling may invalidate the right working of the winch arm. The evaluation of the deviation of the orientation of the After Cowling from the nominal is the second measurement of the assembly. It has been evaluated as the two translational motions of the centre of the ellipse along the two axis of the Datum Reference Frame of the After Cowling and the three rotations of the axis of the Cowling as regards the nominal position measured in the Datum Reference Frame of the After Cowling. The same reasoning may be repeated for the Forward Cowling.
Fig. 12. Features and Datum Reference Frame of the After Cowling
6.4 Define the features of the assembly components, specify the tolerances and the related statistical distribution The features of the Hoist Mount are the two planes and the two patterns of six holes that allow to couple the part with the After and Forward Frame. The holes have a dimensional
tolerance of ±0.25 mm. The Y-axis of the Datum Reference Frame passes from the centre of the holes 1 and 2 of the pattern that allows to couple the After Frame, as shown in Fig. 13 on the left. The Z-axis is perpendicular to the coupling plane with the After Frame and the X-axis is perpendicular to ZY plane. The origin is in the centre of the hole 2 of the pattern projected on the coupling plane.
Fig. 13. Features and Datum Reference Frame of the Hoist Mount
axis
elipse’s centre
Datum Reference Frame
coupling holes
3D surfacesaxis tip
www.intechopen.com

To Carry Out Tolerance Analysis of an Aeronautic Assembly
213
The features of the After Frame are the pattern 1 of six holes that couples the part with the Hoist Mount and the pattern 2 of four holes that couples the part with the Box Support, as shown in Fig. 14. The X-axis of the Datum Reference Frames is due to the intersection of the
two planes containing the two patterns. The Z-axis is perpendicular to the plane that contains the pattern 1 and that mates the Hoist Mount. The Y-axis is perpendicular to ZY plane. The origin is due to the intersection of the X-axis with the cylindrical surface on the side of the After Frame. Moreover, there are two further patterns of six and eight holes on
the lateral cylindrical surface for the coupling with the Mid Cowling and the After Cowling
(see Fig. 15). All the holes have a dimensional tolerance of ±0.25 mm. To the lateral cylindrical surface a profile tolerance of 0.076 mm and a dimensional tolerance to the
thickness of ±0.10 mm are applied, as shown in Fig. 16. The same features and the same datum reference frame may be found in the Forward
Frame.
Fig. 14. Features and Datum Reference Frame of the After Frame
Fig. 15. Coupling of the After Frame with the After Cowling
The features of the Box Support are constituted by a pattern of four holes that allows to couple the After Frame, the central hole where the axis of the engine of the winch arm is
fitted and the pattern of six holes that allows to fix the engine (see Fig. 11). The central hole and the pattern of six holes lie on the same plane. The pattern of four holes lies on a plane
www.intechopen.com

Advances in Composites Materials - Ecodesign and Analysis
214
that mates with the plane of the After Frame. The Z-axis of the Datum Reference Frame is perpendicular to the plane where the central hole lies. The origin is the centre of the hole to fit the engine. The X-axis connects the origin with the centre of one hole of the pattern to fix
the engine. The holes of the patterns have a dimensional tolerance of ±0.25 mm. The After Cowling is constituted by a cylindrical surface, that is signed in blue in Fig. 12, where there is a pattern of eight holes for coupling it to the After Frame. To this surface a profile tolerance of 0.076 mm is applied, while its thickness has a dimensional tolerance of
±0.10 mm (see Fig. 16). Moreover, it has an elliptical surface, that is signed in pink in Fig. 12, with aerodynamic properties. The Datum Reference Frame is located in the centre of the ellipse that generates the cylindrical surface for coupling with the After Frame. The Y-axis is parallel to the largest axis and the X-axis is parallel to the smallest axis of the ellipse. The Z-axis is perpendicular to YX plane with a positive orientation outside the material. The origin is in the centre of the ellipse. The same features and the same datum reference frame may be found in the Forward Cowling.
Fig. 16. Tolerances applied to the coupling surfaces of the After Frame and the After Cowling
The applied tolerances have been considered distributed as a Gaussian probability density function, whose parameters (mean and standard deviation) have been estimated as the
nominal value of the surface property and one third of the applied tolerance range respectively.
6.5 Design the assembly cycle and jigs After the curing process, the patterns of holes are manually made by means of a brace and brit with the help of a mask that is placed on the part as guide. Therefore, the After Frame is
coupled with the Host Mount by means of special grub screws that are inserted in the holes of each component, as shown in Fig. 17 on the left. No adhesives or resins are used to secure the surfaces, since a perfect adhesion is not required. The Box Support is coupled to the obtained sub-assembly, as shown in Figure 17 in the middle. Finally, the Frames (Forward
and Cowlings) are coupled, as shown in Fig. 17 in the middle and on the right. No jigs have been used, since the assembly is small and it is manually caught.
www.intechopen.com

To Carry Out Tolerance Analysis of an Aeronautic Assembly
215
Fig. 17. Assembly cycle of the winch arm
6.6 Choose the simulation runs, carry out simulations and analyze the results Monte Carlo simulation has allowed to perturb dimensions and geometry of the winch arm components inside the tolerance ranges in order to give the statistical distribution of the
deviations of the axis of the engine and of the orientation of the After Cowling. Monte Carlo simulation has been carried out by a well-known Computer Aided Tolerance software, eM-
Tolmate of UGS®. The number of runs of simulation has been fixed at 200000, once many tests have been carried out, since this value guarantees a stable estimation of the mean and the standard deviation of the probability distribution characterising the two measurements.
The deviation of the axis of the engine follows an estimated probability density function near to Gaussian along the considered X and Y-axes, as shown in Fig. 18 and Fig. 19. The estimated mean is equal to -0.0005 mm along the X-axis and 0.000 mm along the Y-axis,
while the estimated standard deviation is equal to 0.251 mm along the X-axis and 0.294 mm along the Y-axis. Therefore, the axis of the engine may range between -0.88 mm and +0.88
mm (i.e. ±3σ) that include 99.73% of the obtained Gaussian distribution. This range does not significantly influence the right working of the engine. The deviation of the orientation of the After Cowling has been evaluated as the three translational motions (ΔX, ΔY and ΔZ) of the centre of the ellipse along the three axis of the
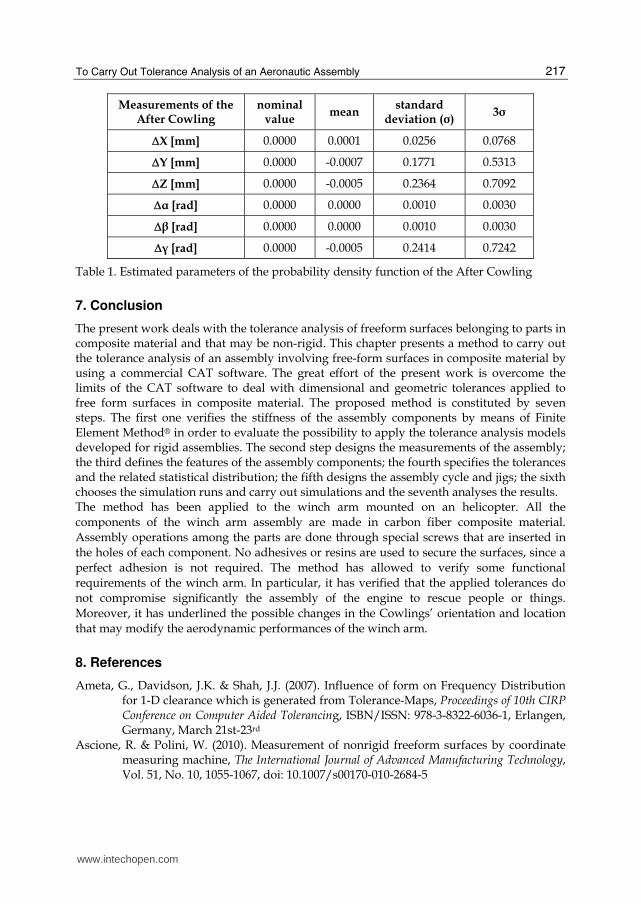
DRF of the After Cowling and the three rotations (Δα, Δβ and Δγ) of the axis of the Cowling around the three axes of the DRF of the After Cowling. The three translations and the three rotations follow an estimated probability density function that may be considered Gaussian, as shown in Fig. 20 and in Fig. 21. Table 1 shows the mean and standard deviation that have been estimated for the obtained probability density functions.
min= -0.784 mm max= 0.783 mm range= 1.568 mm
Fig. 18. Probability density function of the deviation of the axis of the engine along the X-axis of the DRF belonging to the Box Support
www.intechopen.com

Advances in Composites Materials - Ecodesign and Analysis
216
min= -1.049 mm max= 1.050 mm range= 2.100 mm
Fig. 19. Probability density function of the deviation of the axis of the engine along the Y-axis of the DRF belonging to the Box Support
Fig. 20. Probability density function of the three translations motions of the centre of the ellipse of the After Cowling along the three axes of its DRF: X-axis on the left, Y-axis in the middle and z-axis on the right
Fig. 21. Probability density function of the three rotations of the axis of the After Cowling around the three axes of its DRF: X-axis on the left, Y-axis in the middle and Z-axis on the right
The obtained results underline that the After Cowling may significantly translate along the
largest axis of the ellipse (Y-axis) of about ± 0.531 mm and along the axis perpendicular to
the plane of coupling of the After Cowling with the After Frame (Z-axis) of about ± 0.709
mm, while the translation along the X-axis is negligible. Moreover, the After Cowling may
significantly rotate around the Z of about ± 0.724 radiants, while the rotations around X and
Y axes are negligible. This is due to the coupling of the After Cowling with the After Frame
by means of the screws that get into the holes of the parts with a certain clearance.
www.intechopen.com
To Carry Out Tolerance Analysis of an Aeronautic Assembly
217
Measurements of the After Cowling
nominal value
mean standard
deviation (σ) 3σ
ΔX [mm] 0.0000 0.0001 0.0256 0.0768
ΔY [mm] 0.0000 -0.0007 0.1771 0.5313
ΔZ [mm] 0.0000 -0.0005 0.2364 0.7092
Δ┙ [rad] 0.0000 0.0000 0.0010 0.0030
Δ┚ [rad] 0.0000 0.0000 0.0010 0.0030
Δ┛ [rad] 0.0000 -0.0005 0.2414 0.7242
Table 1. Estimated parameters of the probability density function of the After Cowling
7. Conclusion
The present work deals with the tolerance analysis of freeform surfaces belonging to parts in composite material and that may be non-rigid. This chapter presents a method to carry out the tolerance analysis of an assembly involving free-form surfaces in composite material by using a commercial CAT software. The great effort of the present work is overcome the limits of the CAT software to deal with dimensional and geometric tolerances applied to free form surfaces in composite material. The proposed method is constituted by seven steps. The first one verifies the stiffness of the assembly components by means of Finite Element Method® in order to evaluate the possibility to apply the tolerance analysis models developed for rigid assemblies. The second step designs the measurements of the assembly; the third defines the features of the assembly components; the fourth specifies the tolerances and the related statistical distribution; the fifth designs the assembly cycle and jigs; the sixth chooses the simulation runs and carry out simulations and the seventh analyses the results. The method has been applied to the winch arm mounted on an helicopter. All the components of the winch arm assembly are made in carbon fiber composite material. Assembly operations among the parts are done through special screws that are inserted in the holes of each component. No adhesives or resins are used to secure the surfaces, since a
perfect adhesion is not required. The method has allowed to verify some functional requirements of the winch arm. In particular, it has verified that the applied tolerances do not compromise significantly the assembly of the engine to rescue people or things.
Moreover, it has underlined the possible changes in the Cowlings’ orientation and location that may modify the aerodynamic performances of the winch arm.
8. References
Ameta, G., Davidson, J.K. & Shah, J.J. (2007). Influence of form on Frequency Distribution for 1-D clearance which is generated from Tolerance-Maps, Proceedings of 10th CIRP Conference on Computer Aided Tolerancing, ISBN/ISSN: 978-3-8322-6036-1, Erlangen, Germany, March 21st-23rd
Ascione, R. & Polini, W. (2010). Measurement of nonrigid freeform surfaces by coordinate measuring machine, The International Journal of Advanced Manufacturing Technology, Vol. 51, No. 10, 1055-1067, doi: 10.1007/s00170-010-2684-5
www.intechopen.com
Advances in Composites Materials - Ecodesign and Analysis
218
ASME Standard. (1994). Dimensioning and tolerancing, ASME Y14.5M, American Society of Mechanical Engineering, New York.
Ballot, E. & Bourdet, P. (1997). A computational method for the consequences of geometric errors in mechanisms, Proceedings of the 5th CIRP Seminar on Computer Aided Tolerancing, April 27-29, Toronto, Canada.
Bihlmaier, B.F. (1999). Tolerance Analysis of Flexible Assemblies using Finite Element and Spectral Analysis, MS Thesis, Brigham Young University, Provo, Utah
Boyer, M. & Stewart, N.F. (1991). Modeling spaces for toleranced objects, Int. Journal of Robotics Research, Vol.10, No.5, 470-582.
Chase, K.W., Gao, J. & Magleby, S.P. (1995). General 2-D tolerance analysis of mechanical assemblies with small kinematic adjustments, J Des Manuf, Vol. 5, 263-274
Chase, K.W., Gao, J., Magleby, S.P. & Sorensen, C.P. (1996). Including geometric feature variations in tolerance analysis of mechanical assemblies, IIE Trans, Vol. 28, 795-807
Chase, K.W., Gao, J. & Magleby, S.P. (1997a). Tolerance analysis of 2-and 3D mechanical assemblies with small kinematic adjiustments, In: Advanced Tolerancing Techniques, Zhang H.C., (Ed.), 103-138, Wiley, ISBN 978-0-471-14594-3, New York
Chase, K.W., Magleby, S.P. & Glancy, C.G. (1997b). A compressive system for Computer-Aided Tolerance Analysis of 2-D and 3-D Mechanical Assemblies, Proc. of the 5th Int. CIRP Seminar on Computer-Aided Tolerancing, April 27-29, Toronto, Canada.
Clément, A., Rivière, A. & Temmerman, M. (1994). Cotation tridimensionelle des systèmes mécaniques, théorie & pratique, PYS, ISBN 2-85330-132-X, Ivry-Sur-Seine, France.
Clément, A., Riviére, A., Serré, P. & Valade, C. (1998). The TTRSs: 13 Constraints for Dimensioning and Tolerancing, In: Geometric design tolerancing: theories, standards and applications, ElMaraghy H.A., (Ed.), 122-131, ISBN 978-0-412-83000-6, Chapman & Hall, London.
Creveling, C.M. (1997). Tolerance Design, Addison-Wesley, ISBN 0201634732, Boston. Davidson, J.K., Mujezinovic, A. & Shah, J.J. (2002). A new mathematical model for geometric
tolerances as applied to round faces, ASME Trans, J Mech Des, Vol. 124, 609-622 Delchambre, A. (1996). CAD Method for Industrial Assembly. Concurrent Design of Product,
Equipment and Control Systems, Wiley, ISBN 978-0-471-96261-8, New York Francavilla, A. & Zienkiewicz, O. (1975). A Note on Numerical Computation of Elastic
Contact Problems, Int. Journal for Numerical Methods in Engineering, Vol. 9, 913-924 Gordis, J. & Flannelly, W. (1994). Analysis of stress due to fastener tolerance in assembled
components, AIAA Journal, Vol. 32, No. 12, 2440-2446 Gupta S. & Turner, J.U. (1993). Variational solid modelling for tolerance analysis; IEEE
Computer Graphics and Applications, Vol.13, 64-74. Hong, Y.S. & Chang, T.C. (2002). A comprehensive review of tolerancing research. Int. J.
Prod. Res., Vol. 40, No. 11, (July 2002) 2425-2459 ISO Standard, (1985). ISO 8015: Fundamental Tolerancing Principle Laperrière, L. & Lafond, P. (1999). Modelling tolerances and dispersions of mechanical
assemblies using virtual joints, Proceedings of ASME Design Engineering Technical Conferences, ISBN 0791819671, September 12-15, Las Vegas, Nevada, USA.
Laperrière, L. & Kabore, T. (2001). Monte Carlo simulation of tolerance synthesis equations, Int. J. Prod. Res, Vol. 39, 2395-2406
www.intechopen.com

To Carry Out Tolerance Analysis of an Aeronautic Assembly
219
Liu, S. & Hu, S. (1995). An Offset Finite Element Model and Its Applications In Predicting Sheet Metal Assembly Variation, Int. Journal of Machine Tools and Manufacture, Vol. 35, No. 11, 1545-1557
Liu, S. & Hu, S. (1997). Variation Simulation for Deformable Sheet Metal Assemblies using Finite Element Methods, Journal of Manufacturing Science and Engineering, Transactions of the ASME, Vol. 119, No. 3, 368-374
Luenberger, D.G. (2003). Linear and Nonlinear Programming, Addison-Wesley, ISBN 020115794, Boston
Marguet, B. & Mathieu, L. (1998). Tolerancing problems for aircraft industries, In: Geometric Design Tolerancing: Theories, Standards and Applications, ElMaraghy H.A., (Ed.), 419-427, ISBN 978-0-412-83000-6, Chapman & Hall
Marguet, B. & Mathieu, L. (1999). Aircraft Assembly analysis method taking into account part geometric variations, In: Global Consistency of Tolerances, Van Houten F. and Kals H., (Eds.), 365-374, ISBN 0-7923-5654-3, Kluwer Academic Publishers
Martino, P.M. & Gabriele, G.A. (1989). Application of variational geometry to the analysis of mechanical tolerances, Failure Prevention and Reliability, ASME Paper n.DE - Vol.16, 19-27.
Marziale, M. & Polini, W. (2007). Tooling Hole Tolerance Analysis in Aeronautic Field, Proceedings of 10th CIRP International Seminar on CAT, ISBN 978-3-8322-6036-1, March 21st-23rd, Erlangen, Germany
Marziale, M. & Polini, W. (2008). Tolerance Analysis of an Aircraft Tail Beam, Proceedings of 18th FAIM International Seminar on Flexible Automation and Intelligent Manufacturing, 30 June - 2 July, Skovde, Sweden.
Merkley, K. (1998). Tolerance Analysis of Compliant Assemblies. Ph.D Thesis, Brigham Young University, Provo, Utah
Moroni, G., Polini, W., & Rasella, M. (2007). Non-Rigid Free Form Surface Inspection: an aeronautical composite component case study, Proceedings of the 10th CIRP Conference on Computer Aided Tolerancing, Erlangen, Germany, March 21-23.
Mujezinovic, A., Davidson, J.K. & Shah, J.J. (2004). A new mathematical model for geometric tolerances as applied to polygonal faces, ASME Trans, J Mech Des, Vol. 126, 504-518
Nassef, A.O. & ElMaraghy, H.A. (1996). Probabilistic Analysis of geometric tolerances. In: Computer Aided Tolerancing. Kimura F., (Ed.), 187-203, Chapman & Hall, London
Nigam, S.D. & Turner, J.U. (1995). Review of statistical approaches to tolerance analysis. Computer Aided Design. Vol. 27, 6-15
Ody, R., Burley, G., Naing, S. & Corbett, J. (2001). Geometric and Dimensioning Tolerances in error budgeting for assembly-centric design of aero-structures, Proceedings of the 7th CIRP Int. Seminar on Computer Aided Tolerancing, pp. 111-120, ENS de Cachan, France, April 24-25.
Polini, W., Marrocu, M. & D’Ambrosio, L. (2007). Tolerance Analysis of Free-Form Surfaces in Composite Material, Journal of Computing and Information Science in Engineering, Vol. 7, (March 2007) 31-43
Prisco, U. & Giorleo, G. (2002). Overview of Current CAT Systems, Integrated Computer Aided Engineering, Vol. 9, No. 4, 373-387
Requicha, A.A.A. (1983). Toward a theory of geometric tolerancing, Int J Rob Res, Vol. 2, No. 4, 45-60
www.intechopen.com

Advances in Composites Materials - Ecodesign and Analysis
220
Requicha, A.A.A. (1993). Mathematical definitions of tolerance specifications, Manuf Rev, Vol. 6, No. 4, 269-274
Salomons, O.W., van Houten, F.J.A.M. & Kals, H.J.J. (1998). Current status of CAT Systems, In: Geometric Design Tolerancing: Theories, Standards and Applications, ElMaraghy H.A., (Ed.), 438-452, Chapman & Hall, London.
Sellakh, R., Rivière, A., Chevassus, N. & Falgarone H. (2003). An assisted method for tolerancing applied to aircraft structures, Proc. of 8th CIRP Int. Seminar on Computer Aided Tolerancing, pp. 187-198, Charlotte, North Carolina
Shen, Z.; Ameta, G.; Shah, J.J. & Davidson, J.K. (2004). A Comparative Study of Tolerance Analysis Methods, Proceedings of ASME 2004 Design Engineering Technical Conferences and Computers and Information in Engineering Conference, Paper No. DETC2004-57699, Salt Lake City, Utah, Semptember 28-October 2
Turner, J. & Gangoiti, A.B. (1991). Tolerance Analysis Approaches in commercial software, Concurrent Engineering, Vol. 1/2, 11-23
Whitney, D.E. (2004). Mechanical Assemblies. Their Design, Manufacture and Role in Prnsoduction Development, Oxford University Press Inc., ISBN 0-19-565782-6, New York
www.intechopen.com

Advances in Composite Materials - Ecodesign and AnalysisEdited by Dr. Brahim Attaf
ISBN 978-953-307-150-3Hard cover, 642 pagesPublisher InTechPublished online 16, March, 2011Published in print edition March, 2011
InTech EuropeUniversity Campus STeP Ri Slavka Krautzeka 83/A 51000 Rijeka, Croatia Phone: +385 (51) 770 447 Fax: +385 (51) 686 166www.intechopen.com
InTech ChinaUnit 405, Office Block, Hotel Equatorial Shanghai No.65, Yan An Road (West), Shanghai, 200040, China
Phone: +86-21-62489820 Fax: +86-21-62489821
By adopting the principles of sustainable design and cleaner production, this important book opens a newchallenge in the world of composite materials and explores the achieved advancements of specialists in theirrespective areas of research and innovation. Contributions coming from both spaces of academia and industrywere so diversified that the 28 chapters composing the book have been grouped into the following main parts:sustainable materials and ecodesign aspects, composite materials and curing processes, modelling andtesting, strength of adhesive joints, characterization and thermal behaviour, all of which provides an invaluableoverview of this fascinating subject area. Results achieved from theoretical, numerical and experimentalinvestigations can help designers, manufacturers and suppliers involved with high-tech composite materials toboost competitiveness and innovation productivity.
How to referenceIn order to correctly reference this scholarly work, feel free to copy and paste the following:
Wilma Polini (2011). To Carry Out Tolerance Analysis of an Aeronautic Assembly Involving Free FormSurfaces in Composite Material, Advances in Composite Materials - Ecodesign and Analysis, Dr. Brahim Attaf(Ed.), ISBN: 978-953-307-150-3, InTech, Available from: http://www.intechopen.com/books/advances-in-composite-materials-ecodesign-and-analysis/to-carry-out-tolerance-analysis-of-an-aeronautic-assembly-involving-free-form-surfaces-in-composite-

© 2011 The Author(s). Licensee IntechOpen. This chapter is distributedunder the terms of the Creative Commons Attribution-NonCommercial-ShareAlike-3.0 License, which permits use, distribution and reproduction fornon-commercial purposes, provided the original is properly cited andderivative works building on this content are distributed under the samelicense.


