To Buy or Not to Buy: Shopping Behavior in a Recession Economy: … · 2018-08-23 · affiliated...
33
Transcript of To Buy or Not to Buy: Shopping Behavior in a Recession Economy: … · 2018-08-23 · affiliated...

To Buy or Not to Buy:Shopping Behavior in aRecession EconomyA Survey of Washington Residents 18+
April 2010

To Buy or Not to Buy: Shopping Behavior in a Recession Economy
A Survey of Washington Residents 18+
Copyright © 2010 AARP
Knowledge Management 601 E Street, NW
Washington, DC 20049
Reprinting with Permission

AARP is a nonprofit, nonpartisan membership organization that helps people 50+ have independence, choice and control in ways that are beneficial and affordable to them and society as a whole. AARP does not endorse candidates for public office or make contributions to either political campaigns or candidates. We produce AARP The Magazine, the definitive voice for 50+ Americans and the world's largest-circulation magazine with over 35.7 million readers; AARP Bulletin, the go-to news source for AARP's millions of members and Americans 50+; AARP Viva, the only bilingual U.S. publication dedicated exclusively to the 50+ Hispanic community; and our website, AARP.org. AARP Foundation is an affiliated charity that provides security, protection, and empowerment to older persons in need with support from thousands of volunteers, donors, and sponsors. We have staffed offices in all 50 states, the District of Columbia, Puerto Rico, and the U.S. Virgin Islands.
State Research brings the right knowledge at the right time to our state and national partners in support of their efforts to improve the lives of people age 50 and older. State research consultants provide strategic insights and actionable research to attain measurable state and national outcomes.
The views expressed herein are for information, debate, and discussion, and do not necessarily represent official policies of AARP.
Acknowledgements
AARP staff Knowledge Management contributed to the design and implementation of this study. Special thanks go to Doug Shadel, Karla Pak, and Jason Erskine of the AARP office in Washington state. Thanks to Knowledge Management staff for their review and input: Rachelle Cummins, Erica Dinger, and Darlene Matthews. Nancy Bell from the Office of General Counsel contributed input and a legal review of this report. Alan Newman Research, Inc. fielded the survey and tabulated the data on behalf of AARP, and many thanks go to their staff, especially Gail Chudoba. Jennifer Sauer, AARP Knowledge Management, designed the survey and wrote the report. For more information, please contact Jennifer Sauer at [email protected].

To Buy or Not to Buy: Shopping Behavior in a Recession Economy A Survey of Washington Residents 18+ April 2010
To Buy or Not to Buy: Shopping Behavior in a Recession Economy: An AARP Survey of Washington Residents 18+, April 2010
In Brief: This survey of 800 residents in Washington ages 18 and older provides AARP in Washington with information they can use to help consumers who are looking to reduce their overall spending on impulse purchases. While many Washingtonians took particular measures to reduce their personal spending in the past 12 months, a substantial number of them indicate feeling financially hard-pressed and not able to reduce their actual overall spending. In fact, many Washingtonians made more than two unplanned purchases either at a department store, a grocery store, or from an Internet retailer, and the average cost of the most expensive impulse purchase they made in any type of store or retailer in the past 12 months was over $300. Dissemination of this data and similar research will increase awareness of impulse buying behavior and contribute to helping consumers take the necessary steps to avoid unnecessary personal spending. This survey has a margin of error of ±3.46 percent.
Key Findings:
Washingtonians are trying to cut back. In fact, more than two-thirds say they tried very hard (33%) or tried somewhat (35%) to reduce their overall spending in some way during the past 12 months.
Many Washingtonians are still spending. Almost two-thirds (62%) say they did not reduce their spending in grocery stores; over half (57%) did not reduce their spending online, and over one-third (35%) say they did not cut back in department stores in the past 12 months.
Washingtonians make impulse purchases. Most (84%) indicate having made an impulse purchase at either a department store or similar, a grocery store, or an Internet retailer in the past 12 months. Nearly eight in ten (78%) made an impulse purchase in a grocery store, over half (58%) made an impulse purchase in a department or similar, and one in seven (16%) made an impulse purchase online.
Many Washingtonians are at their debt limit. In fact, close to four in ten (37%) adults in Washington report having as much or more debt than they can handle.
Impulse purchases can be costly to Washingtonians. Washingtonians ages 18 and older spent an average of $127 on an impulse purchase in a department store. But when asked to consider the most expensive item purchased on impulse in any type of store in the past 12 months, Washingtonians indicate an average cost for that item of $333.
Washington women report impulse purchasing more than men. Significantly more women than men made an impulse purchase in a department store or similar in the past 12 months: two-thirds of women respondents (65%) compared to half of the men (51%). Similarly, more women (81%) than men (74%) report having made an impulse purchase in grocery stores.
Retailers efforts to encourage impulse buying go unnoticed. Indeed, with respect to their most recent impulse purchase at either a department store or a grocery store, less than five percent of these Washingtonians say that store ambiance (lighting, aromas, sounds) contributed to purchasing that item.
For more information about this survey or the data, please contact Jennifer H. Sauer at AARP at [email protected]. Also, please visit the AARP research and policy site for a copy of the full report and survey or other information on this topic and more at http://www.aarp.org/research/surveys/

1 To Buy or Not to Buy: Shopping Behavior in a Recession Economy: An AARP Survey of Washington Residents 18+, April 2010
Key Findings Economic Recession and Consumer Spending among Washingtonians 18+
Economic recessions tend to bring about financial saving among consumers. Most Washingtonians age 18 and older tried very hard or tried somewhat to reduce their overall spending in the 12 months prior to this survey. Yet, nearly half of those who tried to reduce their overall spending say they actually reduced it only somewhat. Moreover, one in four indicate they actually did not reduce their spending very much or at all. One quarter do say they actually reduced their spending a great deal in the past 12 months.
Level of Effort to Reduce Overall Spending in Past 12 Months
(n=800)
Level of Actual Reduction in Spending Among Those Who Tried in Past 12 Months
(n=657 respondents who tried)
1%
16%
14%
35%
33%
0% 20% 40% 60% 80% 100%
Not sure
Didn't try at all
Didn't try too hard
Tried somewhat
Tried very hard
1%
5%
22%
47%
26%
0% 20% 40% 60% 80% 100%
Not sure
Not at all
Not very much
Somewhat
A great deal

2 To Buy or Not to Buy: Shopping Behavior in a Recession Economy: An AARP Survey of Washington Residents 18+, April 2010
Self-Reported Level of Current Personal Debt
(n=800)
1%
19%
41%
29%
8%
0% 20% 40% 60% 80% 100%
Not sure
Have no debt
Enough, could handle more debt
As much as can handle
More debt than can handle
Impact of Recession on Washington Adults18+
While many respondents indicate efforts to reduce their overall spending over the past 12 months, the economic downturn did not result in reduced spending ncertain experiences for some Washingtonians. About six in ten say they did not reduce the amount of money they spent on groceries or shopping online, and about half say they did not reduce the amount of money spent on vacation. In addition, over four in ten did not reduce their use of credit cards and over one-third did not reduce the amount of money they spent shopping at department stores. Still, considerable proportions did take actions or make lifestyle changes to reduce spending in the past 12 months: roughly four in ten put off going on vacation, delayed upgrading home technologies, or used more coupons. One in five Washingtonians say they withdrew fund early from their 401k account, and about ten percent reduced contributions to their 401k or moved into a more affordable home. Notable proportions of Washington adults say the economic downturn resulted in problems paying for items like food or utility bills or paying their rent or mortgage.
Actions or Experiences as Result of Economic Downturn In Past 12 Months
(n=800)
Action taken or Experience Had Yes No Not sure
Reduced amount of money spent shopping at department stores 63% 35% 1%
Reduced use of credit cards 51% 46% 2%
Reduced amount of money spent on vacation 47% 51% 2%
Put off going on vacation 44% 55% 1%
Delayed upgrading home technology (TV, computer, etc) 41% 58% 1%
Used more coupons 41% 58% 1%
Reduced amount of money spent shopping online 39% 57% 2%
Withdrew money from personal savings 39% 60% 1%
Reduced amount of money spent on groceries 37% 62% 1%
Withdrew funds early from 401k or retirement account(s) 21% 75% 2%
Had problems paying for items like food or utility bills 15% 84% 1%
Had problems paying rent or mortgage 12% 87% 1%
Reduced contribution to 401k or retirement account(s) 10% 87% 2%
Moved into more affordable apartment or home 9% 90% 1%
Interestingly, nearly one in ten Washingtonians say they have more debt than they can handle and over a quarter say they have as much as they can handle. Four in ten indicate they could handle more debt, and a notable one in ten volunteered that they do not have debt. (see Annotated Survey, Question 26)

3 To Buy or Not to Buy: Shopping Behavior in a Recession Economy: An AARP Survey of Washington Residents 18+, April 2010
Shopping Behavior of Washington Adults 18+
All Americans are experiencing a profound and damaging economic recession with a national unemployment hovering around 10 percent. The unemployment rate in Washington state is nearly identical at 9.5 percent.1 Still, just as in other recessions, many Washington adults are able to hold on to jobs and salaries and disposable income for spending, saving, or investing. While economic downturns prompt many to avoid shopping altogether, spend less, or rethink purchases, many still shop as they did before the recession. A 2009 Consumer Reports survey of women found that sixty percent made an impulse purchase in the 30 days prior to their survey, and the average price of the most recent purchase was $108.2 Depending on household income, bills, and debt, such purchases may negatively impact personal budgets or maintaining family needs.
Not surprisingly, most Washingtonians indicate shopping more frequently at the grocery store than at a department store or mall or from an Internet retailer. Two-thirds of all respondents say they have made purchases at the grocery store weekly. Over a third of all of respondents say they shop monthly at department stores or malls, while half say they purchased a product or service from an Internet retailer monthly or every two to three months.
Level of Frequency: Shopping at Department Store/Mall/Similar
(n=800)
Level of Frequency: Shopping at Grocery Store
(n=800)
Level of Frequency: Shopping from Internet Retailer
(n= 800)
1%
7%
17%
20%
35%
19%
2%
0% 20% 40% 60% 80% 100%
Not sure
Not at all
Once/twiceyr.
Every 2-3mos
Monthly
Weekly
Daily
1%
4%
2%
4%
18%
65%
7%
0% 20% 40% 60% 80% 100%
Not sure
Not at all
Once/twiceyr.
Every 2-3mos
Monthly
Weekly
Daily
1%
5%
40%
22%
27%
6%
0%
0% 20% 40% 60% 80% 100%
Not sure
Not at all
Once/twiceyr.
Every 2-3mos
Monthly
Weekly
Daily
1 Kaiser Family Foundation, State Health Facts, Washington http://www.statehealthfacts.org/profileind.jsp?cat=1&sub=6&rgn=49 2 Dolliver, M. Impulse Buying is Alive and Well, ADWEEK, Nov. 17, 2009 http://www.adweek.com/aw/content_display/news/e3i45e1bcc0b65a294fbf7b410cc605aad9

4 To Buy or Not to Buy: Shopping Behavior in a Recession Economy: An AARP Survey of Washington Residents 18+, April 2010
Among the Washingtonians who indicate they have purchased items at a large department store or shopping mall in the past 12 months (n=746), about half say they paid by debit card, shopped alone, or shopped with family or friends most of the time or always. Interestingly, only about a third says they paid with a credit card. Similar proportions say they paid for their purchases always or most of the time with cash, or they had taken children along, or used coupons. With respect to shopping at grocery stores in the past 12 months (n=768), a majority of Washingtonians say they took a shopping list of what they intended to buy always or most of the time, and nearly six in ten paid for their purchases with a debit card. Another half say they shopped alone always or most of the time.
Always Most of the time Not very often Never Not sure
Measure Dept. store
(n=746)
Grocery store
(n=768)
Dept.store
(n=746)
Grocery store
(n=768)
Dept.store
(n=746)
Grocery store
(n=768)
Dept. store
(n=746)
Grocery store
(n=768)
Dept.store
(n=746)
Grocery store
(n=768)
Taken shopping list 26% 36% 37% 39% 21% 16% 17% 9% <1% <1%
Paid by debit card 19% 21% 34% 36% 17% 13% 29% 29% 1% <1%
Paid by credit card 11% 9% 23% 12% 29% 19% 36% 59% <1% <1%
Paid with cash 14% 16% 23% 19% 45% 46% 18% 19% 1% <1%
Taken children along3 10% 10% 23% 20% 28% 29% 39% 41% <1% <1%
Used coupons 9% 10% 22% 24% 43% 42% 26% 23% 1% <1%
Shopped alone 10% 15% 39% 39% 39% 35% 12% 10% <1% <1%
Shopped with family/ friends
14% 11% 33% 31% 41% 38% 11% 21% 1% <1%
General View of Shopping at Department Stores, Malls, or Similar
Most Washington adults ages 18 and older view shopping at department stores or similar large retailers as a necessity while just one in five view it as fun. More men than women (men: 72% vs. women: 58%) view it as a necessity and more women than men view it as fun (men: 13% vs. women: 28%). Moreover, shopping for fun significantly decreases after age 29 (18-29: 35%; 30-49: 18%; 50-64: 16%; 65+: 18%).
General View of Shopping at Department Store/Mall/Similar (n=800)
1%
4%
1%
3%
5%
21%
65%
0% 20% 40% 60% 80% 100%
Not sure
None of these describe my view
Shopping is social activity
Shopping is something to do when feeling down
Shopping is stressful
Shopping is fun
Shopping is necessity
3 Many respondents may not even have children. This survey did not ask if they had children.

5 To Buy or Not to Buy: Shopping Behavior in a Recession Economy: An AARP Survey of Washington Residents 18+, April 2010
Impulse Buying
Among those Washingtonians who indicate they have purchased items in the last 12 months at any one of the three types of retailers tested in the survey (at a department store or shopping mall: n=746; at a grocery store: n=768; or from an Internet retailer: n=484), most (84%) also indicate they have made an unplanned purchase at any one of those three types of retailers.4 However, more respondents indicate having made an impulse purchase at the grocery store than at a department store or mall or from an internet retailer (see Annotated Survey, Questions 2, 49, 11, 17 and 18, 19).
Made Impulse Purchase at Dept. Store in Last 12 Months
(n=746 dept. store shoppers)
Made Impulse Purchase at Grocery Store in Last 12 Months
(n=768 grocery store shoppers)
Made Impulse Purchase from Internet Retailer in Last 12 Months
(n= 484 Internet shoppers)
1%
41%
58%
0% 20% 40% 60% 80% 100%
Not sure
No
Yes
1%
22%
78%
0% 20% 40% 60% 80% 100%
Not sure
No
Yes
1%
84%
16%
0% 20% 40% 60% 80% 100%
Not sure
No
Yes
More impulse purchases are made at the grocery store. Of those Washingtonians who made an impulse purchase at a department store in the past 12 months, almost half made between two and five impulse purchases. Of those who made an impulse purchase at a grocery store, four in ten say they made ten or more impulse purchases. And of those sixteen percent who say they made an impulse purchase from an Internet retailer in the past 12 months, half made between two and five purchases, but almost a third made six or more impulse or unplanned purchases.
Number of Impulse Purchases at Department Store/Mall
(n=431 impulse buyers)
Number of Impulse Purchases at Grocery Store
(n=596 impulse buyers)
Number of Impulse Purchases from Internet Retailer (n= 76 impulse buyers)
1%
7%
17%
22%
46%
7%
0% 20% 40% 60% 80% 100%
Not sure
Too many
to count
More than
10 items
Between 6
to 10
Between 2
to 5
Only one
item
1%
15%
43%
22%
17%
2%
0% 20% 40% 60% 80% 100%
Not sure
Too many
to count
More than
10 items
Between 6
to 10
Between 2
to 5
Only one
item
0%
0%
15%
16%
49%
20%
0% 20% 40% 60% 80% 100%
Not sure
Too many to
count
More than
10 items
Between 6
to 10
Between 2
to 5
Only one
item
4 This proportion is calculated by counting the occurrences of the those who say ‘yes’ to one or each of the three types of retailers. See Questions 4, 11,19.

6 To Buy or Not to Buy: Shopping Behavior in a Recession Economy: An AARP Survey of Washington Residents 18+, April 2010
When asked to think about the cost of their most recent unplanned purchase made at a department store or mall or similar retailer in the past 12 months and then how much it cost, while over half say that item cost less than $50, the average cost among all these respondents is $127 for that item. The average cost for the most recent unplanned item purchased at the grocery store or from an Internet retailer was $6 and $68, respectively.5 Interestingly, when next asked about the most expensive impulse purchase they made in any type of store or retailer in the past 12 months, the average cost of that item was $333.6
Cost of Recent Impulse Purchase at Department Store/Mall/Similar
(n=352 who recall item and price of recent dept. store impulse purchase)
Cost of Recent Impulse Purchase at Grocery Store
(n=477 who recall item and price of recent grocery store impulse purchase)
Cost of Recent Impulse Purchases from Internet Retailer
(n= 76 who recall item and price of recent Internet retailer impulse purchase)
1%
58%
18%
17%
7%
0% 20% 40% 60% 80% 100%
Not sure
Less than
$50
$50 ‐ $99
$100‐$499
$500 or
more
4%
0%
99%
<1%
<1%
0% 20% 40% 60% 80% 100%
Not sure
Less than
$50
$50 ‐ $99
$100‐$499
$500 or
more
0%
61%
19%
18%
2%
0% 20% 40% 60% 80% 100%
Not sure
Less than
$50
$50 ‐ $99
$100‐$499
$500 or
more
5 Each of the three retail types where consumers made impulse purchases included respondents who reported a cost that was 3 or more standard deviations over the mean and an obvious outlier. These respondents were not included in the average cost calculation. Charts do not delete these outliers since the category of $500 or more is less than 8 percent in each retail type tested (department store, grocery store, Internet retailer. See Question 6). 6 Again, with outliers removed.

7 To Buy or Not to Buy: Shopping Behavior in a Recession Economy: An AARP Survey of Washington Residents 18+, April 2010
The price of the item or service or needing the item or service at the time of the purchase are the top two reasons Washingtonians give for making their most recent unplanned purchase at either a department store, a grocery store, or from an Internet retailer. While ads or promotions for the item or service are a reason one in ten respondents made an impulse purchase at a department store or mall or at the grocery store, it is a reason for only 5 percent of those who made an impulse purchase from an Internet retailer. Store ambiance was not a factor contributing to respondent’s recent impulse purchase at a department store or a grocery store. At least one in ten Washingtonians indicate their most recent impulse purchase from either a department store, a grocery store, or from an Internet retailer was made because it was something to help them feel better at the time or they had a coupon or discount card. However, fourteen percent of those who made an impulse purchase from an internet retailer in the past six months say that a websites recommendation based on their previous purchases was a contributing factor in making the purchase. Another one in ten Internet impulse buyer say that the Internet or website pop-up, sidebar advertisement or email promotion contributed that most recent unplanned purchase. Few (6 percent or less) respondents indicate that any of the other reasons tested in the survey question contributed to their unplanned purchase at a department store, grocery store, or from an Internet retailer.
Reason for Recent Impulse Purchase At Department Store/Mall(n=431 impulse buyers)
At Grocery Store (n=591 impulse buyers)
From Internet Retailer(n=76 impulse buyers)
Price 42% 32% 42%
Needed item/service at the time 33% 22% 27%
Ads or promotions for item/service 11% 14% 5%
Something to help feel better at the time 11% 15% 10%
A coupon or discount card for item/service
10% 11% 15%
Sales person 6% 2% N/A
General overall store atmosphere 6% 5% N/A
Pressure from kids to purchase item/service
6% 8% 2%
Offered on way out, at register/checkout 4% 6% N/A
Store music or sounds 2% 1% N/A
Store lighting 2% 1% N/A
Store smells or aromas 1% 4% N/A
Website recommendation based on previous purchases
N/A N/A 14%
Internet pop-up/sidebar ad/email promo N/A N/A 9%
Not sure/Can’t remember 3% 4% 4%
Other 13% 21% 12%

8 To Buy or Not to Buy: Shopping Behavior in a Recession Economy: An AARP Survey of Washington Residents 18+, April 2010
Feelings about Most Recent Unplanned Purchase
Among those Washingtonians who say they have made an impulse or unplanned purchase in the past 12 months at a department store or mall, a grocery store, or from an Internet retailer, most indicate feeling satisfied with their most recent impulse purchase from these respective retailers. Notably, about one in ten respondents who made their most recent impulse purchase at one of these three types of retailers actually say they feel smart about that purchase.
Feelings After Recent Impulse Purchase at Department Store/Mall
(n=431 impulse buyers)
Feelings After Recent Impulse Purchase at Grocery Store
(n=591 impulse buyers)
Feelings After Recent Impulse Purchase from Internet Retailer
(n= 76 impulse buyers)
2%
0%
3%
2%
5%
2%
4%
69%
11%
0% 20% 40% 60% 80% 100%
Not sure
None
No feeling
Regretful
Guilty
Nervous
Lucky
Satisfied
Smart
1%
0%
3%
4%
3%
3%
76%
9%
<1%
0% 20% 40% 60% 80% 100%
Not sure
None
No feeling
Regretful
Guilty
Nervous
Lucky
Satisfied
Smart
2%
0%
2%
5%
3%
2%
12%
61%
12%
0% 20% 40% 60% 80% 100%
Not sure
None
No feeling
Regretful
Guilty
Nervous
Lucky
Satisfied
Smart
Impulse Buyers in Washington
Data from this survey suggest that Washington adults who say they have made an impulse purchase either at a department store type retailer, a grocery store, or from an Internet retailer may share certain characteristics or attributes. For example, respondents in this survey who say they have made an impulse or unplanned purchase at a department store in the past 12 months are more likely to be younger than 65 years old, women, and report an annual income of $35,000 or more.
IImpulse Purchase Made at Department Store or Similar in Last 12 Months by Age, Gender, Income
Age Gender Income 18-29
(n=159) 30-49
(n=329) 50-64
(n=133) 65+
(n=105) Men
(n=363) Women (n=383)
<$35k (n=168)
$35k-<60K (n=164)
$60k or more (n=288)
59% 64% 56% 37% 51% 65% 47% 62% 65%

9 To Buy or Not to Buy: Shopping Behavior in a Recession Economy: An AARP Survey of Washington Residents 18+, April 2010
Among Washingonians who say they have made an impulse purchase at the grocery store in the past 12 months, those ages 30 to 49 are more likely than those younger and those ages 65+ to say they have done so. Similar to impulse purchases at a department store, more women than men say they have made an impulse purchase at the grocery store. Interestingly, no one income level is more likely to make an impulse purchase at the grocery store.
IImpulse Purchase Made at Grocery Store in Last 12 Months by Age, Gender, Income
Age Gender Income 18-29
(n=158) 30-49
(n=333) 50-64
(n=139) 65+
(n=117) Men
(n=374) Women (n=394)
<$35k (n=182)
$35k-<60K (n=166)
$60k or more (n=288)
70% 84% 76% 72% 74% 81% 76% 77% 81% Among the few who say they have made an impulse purchase from an Internet retailer in the past 12 months, there are no significant differences between groups.
IImpulse Purchase Made from an Internet Retailer in Last 12 Months by Age, Gender, Income
Age Gender Income 18-29 (n=92)
30-49 (n=256)
50-64 (n=88)
65+ (n=38)
Men (n=241)
Women (n=243)
<$35k (n=69)
$35k-<60K (n=101)
$60k or more (n=247)
10% 19% 14% 13% 15% 16% 12% 11% 19%
There are differences between those Washingtonians who made an impulse purchase at any of the three retail types (n=642) and those who did not (n=104). Further consideration of impulse buying or not (those respondents who made a purchase at any of the three retail types tested in the survey) by the frequency of certain shopping behaviors reveal the following: Significantly fewer impulse shoppers than non-impulse shoppers say they paid with cash when
shopping at department stores, shopping malls, or larger chain retailers in the last 12 months.
Impulse Buying by Paying with Cash in Department Store
Frequency of Behavior Total Any unplanned purchase
Yes (n=642)
No (n=104)
Always/most of the time 37% 34% 56% Not often/Never 63% 66% 44% Not sure 1% 1% 1%

10 To Buy or Not to Buy: Shopping Behavior in a Recession Economy: An AARP Survey of Washington Residents 18+, April 2010
Similarly, impulse buyers are significantly less likely than non-impulse buyers to say they always/most of the time paid with cash at the grocery store in the last 12 months.
Impulse Buying by Paying with Cash at the Grocery Store
Frequency of Behavior Total Any unplanned purchase
Yes (n=658)
No (n=110)
Always/most of the time 35% 32% 53% Not often/Never 65% 68% 47% Not sure <1% <1% <1%
Significantly more impulse buyers than non-impulse buyers say they paid with a debit card always/most of the time when shopping in department stores, shopping malls, or larger chain retailers in the last 12 months.
Impulse Buying by Paying by Debit Card in Department Store
Frequency of Behavior Total Any unplanned purchase
Yes
(n=642)
No (n=104)
Always/most of the time 53% 56% 38% Not often/Never 46% 43% 63% Not sure 1% 1% 1%
Impulse buyers are more likely than non-impulse buyers to say they always/most of the time paid with a debit card at the grocery store in the last 12 months.
Impulse Buying by Paying with Debit Card at Grocery Store
Frequency of Behavior Total Any unplanned purchase
Yes (n=659)
No (n=110)
Always/most of the time 57% 59% 43% Not often/Never 37% 40% 56% Not sure <1% <1% <1%

11 To Buy or Not to Buy: Shopping Behavior in a Recession Economy: An AARP Survey of Washington Residents 18+, April 2010
Impulse buyers are more likely than non-impulse buyers to say they always/most of the time took children along to the grocery store in the last 12 months.
Impulse Buying by Taken Children Along to Grocery Store7
Frequency of Behavior Total Any unplanned purchase
Yes (n=658)
No (n=110)
Always/most of the time 30% 32% 17% Not often/Never 70% 68% 81% Not sure <1% <1% <1%
Although not statistically significant, fewer impulse shoppers than non-impulse shoppers say they
shopped alone always/most often at department stores or grocery stores in the past 12 months.
However, impulse shoppers at are statistically more likely than non-impulse shoppers to say they shopped alone in the department store in the last 12 months (7% vs. 27%) and the grocery store in the past 12 months (13% vs. 27%) (see Annotated Survey, Question 3g).
Summary
The economic downturn has caused a majority of Washingtonians to try to reduce their spending. The results of these efforts have been mixed. While many report reduced overall spending, a significant number of Washington consumers report not reducing spending on groceries, in department stores, or online. Moreover, at least one in ten Washingtonians say they had problems paying for necessities like food or utility bills, paying their rent or mortgage, or reduced or withdrew money from personal savings or their retirement accounts. About four in ten Washingtonians say they have as much or more debt than they can handle. Still, most (84%) Washingtonians have made an impulse purchase either at a department store, grocery store, or from an Internet retailer in the past 12 months, and most have made at least two or more purchases from each retail type. Moreover, Washingtonians made quite a few impulse purchases across each retail type: one in five say they have made between six to ten impulse purchases at a department store while over four in ten purchased more than ten items on impulse at the grocery store. Price and feeling like they needed the item or service at the time are the top two reasons Washingtonians give for making their impulse purchase at either of the three retail types. Very few consumers listed store environmental factors such as lighting, smells or music as factors relating to impulse purchases. Interestingly, the average cost of their most recent impulse purchase at the department store was $127. The average cost of the most recent purchase at the grocery store was $6, and from an Internet retailer it was $68, and most respondents report feeling satisfied after making that most recent impulse purchase. The data from this survey also show that impulse purchases at department stores tend to be made by those younger than 65, women and those with incomes greater than $35,000. However, the majority of consumers across three demographic groups (age, gender, and income) report having made an impulse purchase at the grocery store. Slightly more women than men say they made an impulse purchase at the grocery store. Few
7 Caution should be used when interpreting this finding as respondents were not asked IF they had children or not. Those respondents who do not have children also answered this question.

12 To Buy or Not to Buy: Shopping Behavior in a Recession Economy: An AARP Survey of Washington Residents 18+, April 2010
respondents in any of these demographic categories indicate making an impulse purchase from an Internet retailer and the data reveal no significant sub-group differences. While many Washington consumers are trying to reduce spending to cope with the recession, many continue to struggle to do so. A majority of Washingtonians make impulse purchases that can work against the desire to cut back and conserve during difficult economic times. The survey reveals a number of insights about how and why consumers make impulse purchasing decisions. This information could be useful to consumers who want to further cut back on their spending, as well as consumer advocates who help Washington adults with personal budget or money management issues. Ideally, increasing awareness of the implications of impulsive buying behavior and disseminating research on this issue across the state may help consumers begin to take steps to avoid unnecessary spending.

13 To Buy or Not to Buy: Shopping Behavior in a Recession Economy: An AARP Survey of Washington Residents 18+, April 2010
Methodology In March 2010, AARP engaged Alan Newman Research to conduct a research study among the general population in the state of Washington to gauge their experiences with and opinions of shopping in general. Interviews took place March 11th through March 21st, 2010 and were conducted from RDD sample among Washington residents age 18 or older. ANR completed a total of 800 interviews. All numbers were called at various times of the day as well as days of the week to maximize each resident’s opportunity for inclusion in the study.
A sample size of 800 respondents yields a maximum statistical error of ± 3.46% at the 95% level of confidence. This means that in 95 out of 100 samples of this size, the results obtained in the sample would be within ± 3.46 percentage points of the results obtained had everyone in the population been interviewed.
Data were weighted to reflect the distribution of gender and age based on 2000 Census data. Percentages of some questions may exceed 100% due to rounding or the use of multiple response question formats. Statistical tests have been performed to determine whether observed differences in the tables are statistically significant at both the .01 and .05 level of significance.

14 To Buy or Not to Buy: Shopping Behavior in a Recession Economy: An AARP Survey of Washington Residents 18+, April 2010
ANNOTATED SURVEY

15 To Buy or Not to Buy: Shopping Behavior in a Recession Economy: An AARP Survey of Washington Residents 18+, April 2010
WA Consumer Behavior Poll – 800 Residents 18+
(ME = 3.46%)
GENERAL VIEW OF SHOPPING
To begin, we’d first like to learn a little more about how Washingtonians shop in general.
1. I’m going to read some general views of shopping people could have when they think of shopping at major department stores like Macy’s, shopping malls, or other large chain retailers like Target or Home Depot. When I have finished, please tell me which statement best describes your personal general view of shopping: [ONLY ONE RESPONSE ALLOWED] [RANDOMIZE a-f]
% N=800 21 Shopping is usually a fun activity 65 Shopping is usually a necessity 5 Shopping is usually stressful 1 Shopping is a social activity 3 Shopping is something to do when feeling down or sad, or 0 Shopping is something to do to get away from other pressures 4 None of these describe my view of shopping [VOLUNTEERED] [DO NOT READ] 1 Not sure [DO NOT READ]
<1 Refused [DO NOT READ]
SHOPPING BEHAVIOR
2. Within the past 12 months, would you say you purchased items at a large department store, shopping mall, or larger retailer ………. [READ EACH CATEGORY - ACCEPT ONLY ONE RESPONSE]?
% N=800 2 Daily 19 Weekly 35 Monthly 20 Every 2-3 months 17 Once or twice a year 7 OR not at all [GO TO QUESTION 9]
<1 Not sure [DO NOT READ] <1 Refused [DO NOT READ]
16 To Buy or Not to Buy: Shopping Behavior in a Recession Economy: An AARP Survey of Washington Residents 18+, April 2010
RETAIL STORE SHOPPING
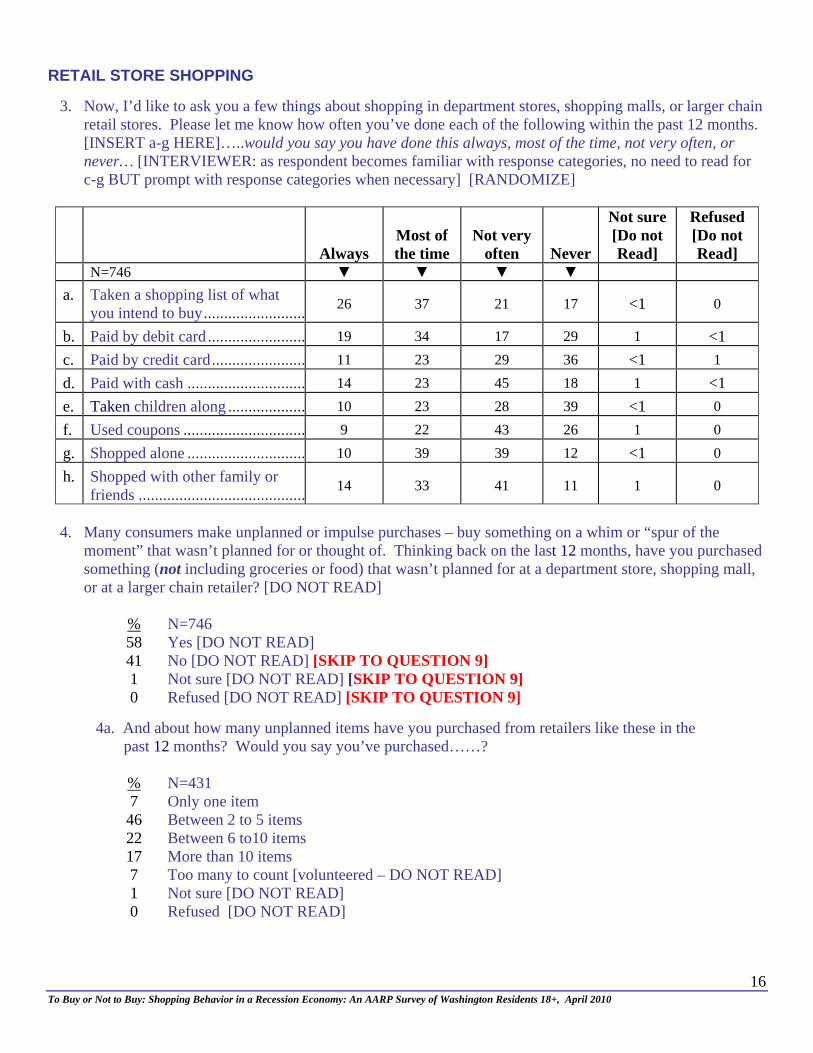
3. Now, I’d like to ask you a few things about shopping in department stores, shopping malls, or larger chain retail stores. Please let me know how often you’ve done each of the following within the past 12 months. [INSERT a-g HERE]…..would you say you have done this always, most of the time, not very often, or never… [INTERVIEWER: as respondent becomes familiar with response categories, no need to read for c-g BUT prompt with response categories when necessary] [RANDOMIZE]
Always Most of the time
Not very often Never
Not sure [Do not Read]
Refused [Do not Read]
N=746 ▼ ▼ ▼ ▼
a. Taken a shopping list of what you intend to buy .........................
26 37 21 17 <1 0
b. Paid by debit card ........................ 19 34 17 29 1 <1
c. Paid by credit card ....................... 11 23 29 36 <1 1
d. Paid with cash ............................. 14 23 45 18 1 <1
e. Taken children along ................... 10 23 28 39 <1 0
f. Used coupons .............................. 9 22 43 26 1 0
g. Shopped alone ............................. 10 39 39 12 <1 0
h. Shopped with other family or friends .........................................
14 33 41 11 1 0
4. Many consumers make unplanned or impulse purchases – buy something on a whim or “spur of the
moment” that wasn’t planned for or thought of. Thinking back on the last 12 months, have you purchased something (not including groceries or food) that wasn’t planned for at a department store, shopping mall, or at a larger chain retailer? [DO NOT READ]
% N=746 58 Yes [DO NOT READ] 41 No [DO NOT READ] [SKIP TO QUESTION 9] 1 Not sure [DO NOT READ] [SKIP TO QUESTION 9] 0 Refused [DO NOT READ] [SKIP TO QUESTION 9]
4a. And about how many unplanned items have you purchased from retailers like these in the past 12 months? Would you say you’ve purchased……?
% N=431 7 Only one item 46 Between 2 to 5 items 22 Between 6 to10 items 17 More than 10 items 7 Too many to count [volunteered – DO NOT READ] 1 Not sure [DO NOT READ] 0 Refused [DO NOT READ]

17 To Buy or Not to Buy: Shopping Behavior in a Recession Economy: An AARP Survey of Washington Residents 18+, April 2010
5. Thinking about that most recent unplanned purchase you made in a department store, mall or other larger retail chain, what was the product or service you purchased?
_______________________ [OPEN END – RECORD VERBATIM]
% N=431 82 Response given 14 Can’t remember [DO NOT READ] [SKIP TO QUESTION 7] 3 Not sure [DO NOT READ] [SKIP TO QUESTION 7] 1 Refused [DO NOT READ] [SKIP TO QUESTION 7]
6. And about how much did that product or service cost?
$_______________________ [OPEN END – RECORD VERBATIM]
% N=352 97 Response given 3 Can’t remember [DO NOT READ]
<1 Not sure [DO NOT READ] <1 Refused [DO NOT READ]
7. Which of the following best describes how you feel now about this purchase: [RANDOMIZE]
% N=431 11 Smart 69 Satisfied 4 Lucky 2 Nervous 5 Guilty 2 Regretful 3 No strong/specific feeling [VOLUTEERED] 0 None of these describe my feelings [VOLUNTEERED] 2 Can’t remember [DO NOT READ] 2 Not sure [DO NOT READ] 0 Refused [DO NOT READ]

18 To Buy or Not to Buy: Shopping Behavior in a Recession Economy: An AARP Survey of Washington Residents 18+, April 2010
8. There are many reasons why people make a decision to buy something they never planned to buy. Please tell me which of the following factors contributed to your most recent unplanned purchase at a department store, mall, or large chain retailer: [MULTIPLE RESPONSES ALLOWED] Would you say it was….? [RANDOMIZE]
% N=431 42 The price 10 A coupon or discount card for that item or service 11 Ads or promotions for the product or service 6 A sales person – their help, information, personality 1 The store smells or aromas 2 The store music or sounds 2 The store lighting 6 General overall store atmosphere 6 Pressure from kids to purchase that product or service 4 Offered on your way out, at the register or checkout 11 Something to help you feel better at the time 33 A product or service you needed at the time 13 Some other factor that I haven’t mentioned: [specify]: _________ 2 Can’t remember [DO NOT READ]1 Not sure [DO NOT READ]1 Refused [DO NOT READ]
GROCERY SHOPPING
9. Within the past 12 months, would you say you purchased items at a grocery store [if needed: like Safeway, Albertsons, or Whole Foods] ...
% N=800 7 Daily 65 Weekly 18 Monthly 4 Every 2-3 months 2 Once or twice a year 4 OR not at all [SKIP TO QUESTION 17]
<1 Not sure [DO NOT READ] 0 Refused [DO NOT READ] 1 None of types of grocery stores in my area –grocery shop at convenience
store [VOLUNTEERED – [SKIP TO QUESTION 17]

19 To Buy or Not to Buy: Shopping Behavior in a Recession Economy: An AARP Survey of Washington Residents 18+, April 2010
10. Now, I’d like to ask you a few things about shopping at grocery stores. Thinking about shopping at stores [if needed: like Safeway, Albertsons, or Whole Foods], please let me know how often you’ve done each of the following within the past 12 months. [INSERT a-g HERE]…..would you say you have done this always, most of the time, not very often, or never… [INTERVIEWER: as respondent becomes familiar with response categories, no need to read for c-g BUT prompt with response categories when necessary] [RANDOMIZE]
Always
Most of the time
Not very often Never
I never shop at these grocery stores [Do not
Read]
Not sure [Do not Read]
Refused [Do not Read]
N=768 ▼ ▼ ▼ ▼ ▼
a. Taken a shopping list of what you intend to buy ......... 36 39 16 9
<1 <1 <1
b. Paid by debit card ................. 21 36 13 29 <1 <1 <1
c. Paid by credit card ................ 9 12 19 59 0 <1 <1
d. Paid with cash ...................... 16 19 46 19 <1 <1 <1
e. Taken children along ............ 10 20 29 41 0 <1 <1
f. Used coupons ....................... 10 24 42 23 0 <1 0
g. Shopped alone ...................... 15 39 35 10 0 <1 0
h. Shopped with other family or friends ..............................
11 31 38 21 0 <1 0
11. Consumers may make unplanned or impulse purchases when shopping for groceries. Thinking back on the last 12 months, have you purchased a product at the grocery store that was not planned? [INTERVIEWER: IF RESPONDENT SAYS, “well, I forgot to add to my list”, PROMPT/tell them to consider purchases NOT or NEVER intended for a list – consider something unplanned and on impulse or a whim]
% N=768 78 Yes [DO NOT READ] 22 No [DO NOT READ] [SKIP TO QUESTION 17] 1 Not sure [DO NOT READ] [SKIP TO QUESTION 17] 0 Refused [DO NOT READ] [SKIP TO QUESTION17]
12. And about how many unplanned grocery store items have you purchased in the past 12 months? Would
you say you’ve purchased….? % N=596 2 Only one item 17 Between 2 to 5 items 22 Between 6 to10 items 43 More than 10 items 15 Too many to count [volunteered – DO NOT READ] <1 NONE – no items [SKIP TO QUESTION 17] 1 Not sure [DO NOT READ] [SKIP TO QUESTION 17] 0 Refused [DO NOT READ] [SKIP TO QUESTION 17]

20 To Buy or Not to Buy: Shopping Behavior in a Recession Economy: An AARP Survey of Washington Residents 18+, April 2010
13. Thinking about that most recent unplanned grocery store purchase you made, what was the product?
_______________________ [OPEN END – RECORD VERBATIM]
% N=591 81 Response given 17 Can’t remember [DO NOT READ] [SKIP TO QUESTION 15] 3 Not sure [DO NOT READ] [SKIP TO QUESTION 15] 0 Refused [DO NOT READ] [SKIP TO QUESTION 15]
14. And about how much did this product cost?
$_______________________ [OPEN END – RECORD VERBATIM]
% N=477 95 Response given 3 Can’t remember [DO NOT READ] 1 Not sure [DO NOT READ] 0 Refused [DO NOT READ]
15. Which of the following best describes how you feel now about this purchase: [RANDOMIZE]
% N=591 9 Smart 76 Satisfied 3 Lucky
<1 Nervous 3 Guilty 4 Regretful 3 No strong/specific feeling [VOLUTEERED] 0 None of these describe my feelings [VOLUNTEERED] 3 Can’t remember [DO NOT READ] 1 Not sure [DO NOT READ] 0 Refused [DO NOT READ]

21 To Buy or Not to Buy: Shopping Behavior in a Recession Economy: An AARP Survey of Washington Residents 18+, April 2010
16. There are many reasons why people make a decision to buy something they never planned to buy. Please
tell me which of the following factors contributed to your most recent unplanned purchase at a grocery store: [MULTIPLE RESPONSES ALLOWED] Would you say it was…? [RANDOMIZE]
% N=591 32 The price 11 A coupon or discount card for that item 14 Ads or promotions for the product or service 2 A sales person – their help, information, personality 4 The store smells or aromas 1 The store music or sounds 1 The store lighting 5 General overall store atmosphere 8 Pressure from kids to purchase that product 6 Offered on your way out, at the register or checkout 15 Something to help you feel better at the time 22 A product or service you needed at the time 21 Some other factor that I haven’t mentioned: [specify]: _________ 2 Can’t remember [DO NOT READ] 2 Not sure [DO NOT READ] 0 Refused [DO NOT READ]
INTERNET SHOPPING
17. Now I’d like to know about your experience shopping on the Internet. Would you say you shop on the internet…..?
% N=800 1 Daily 3 A few times over a week 2 Just once a week 12 A few times over a month 9 Just once a month 36 A few times over a year 36 Or do you never shop on the internet? [SKIP TO QUESTION 24] <1 Not sure [DO NOT READ] 1 Refused [DO NOT READ]

22 To Buy or Not to Buy: Shopping Behavior in a Recession Economy: An AARP Survey of Washington Residents 18+, April 2010
18. Within the past 12 months, would you say you’ve actually purchased products or services online......[READ EACH – ACCEPT ONLY ONE RESPONSE]
% N=515 0 Daily 6 Weekly 27 Monthly 22 Every 2-3 months 40 Once or twice a year 5 OR not at all [SKIP TO QUESTION 24] 1 Not sure [DO NOT READ] [SKIP TO QUESTION 24]
<1 Refused [DO NOT READ] [SKIP TO QUESTION 24]
19. Just as when shopping in a department store or grocery store, consumers may make unplanned or impulse purchases from an online retailer. Thinking back on the last 12 months, have you purchased a product or service over the Internet that was not planned? [INTERVIEWER: IF RESPONDENT SAYS, “well, I forgot to add to my list”, PROMPT/tell them to consider purchases NOT or NEVER intended for a list – consider something unplanned and on impulse or a whim]
% N=484 16 Yes [DO NOT READ] 84 No [DO NOT READ] [SKIP TO QUESTION 24] 1 Not sure [DO NOT READ] [SKIP TO QUESTION 24] 0 Refused [DO NOT READ] [SKIP TO QUESTION 24]
19a. And about how many unplanned products or services have you purchased online in the past 12 months? Would you say you purchased….. [DO NOT READ RESPONSE ITEMS – USE FOR CODING]
% N=76 20 Only one product or service 49 Between 2 to 5 products or services 16 Between 6 to10 products or services 15 More than 10 products or services 0 Too many to count [volunteered] – DO NOT READ] 0 Not sure [DO NOT READ] 0 Refused [DO NOT READ]
20. Thinking about that most recent unplanned purchase you made online, what was the product or service?
_______________________ [OPEN END – RECORD VERBATIM]
% N=76 92 Response given 6 Can’t remember [DO NOT READ] [SKIP TO QUESTION 22] 1 Not sure [DO NOT READ] [SKIP TO QUESTION 22] 0 Refused [DO NOT READ] [SKIP TO QUESTION 22]

23 To Buy or Not to Buy: Shopping Behavior in a Recession Economy: An AARP Survey of Washington Residents 18+, April 2010
21. And about how much did this product or service cost?
$_______________________ [OPEN END – RECORD VERBATIM]
% N=70 100 Response Given 0 Can’t remember [DO NOT READ] 0 Not sure [DO NOT READ] 0 Refused [DO NOT READ]
22. Which of the following best describes how you feel now about this purchase: [RANDOMIZE]
% N=76 12 Smart 61 Satisfied 12 Lucky 2 Nervous 3 Guilty 5 Regretful 2 No strong/specific feeling [VOLUTEERED] 0 None of these describe my feelings [VOLUNTEERED] 2 Can’t remember [DO NOT READ] 0 Not sure [DO NOT READ] 0 Refused [DO NOT READ]
23. And which of the following factors may have contributed to your most recent unplanned purchase over the Internet? [MULTIPLE RESPONSES ALLOWED] Would you say it was…. [RANDOMIZE]
% N=76 42 The price 15 A coupon or discount card for that item or service 5 A TV or radio ad promoting that product or service 14 Recommendation from website based on previous purchases or items in your shopping cart 9 Internet or website pop-up, sidebar advertisement, or email promotion 2 Pressure from kids to purchase that product or service 10 Something to help you feel better at the time 27 Seemed like a product or service you needed at the time 12 Some other factor that I haven’t mentioned: [specify]: _________ 4 Can’t remember [DO NOT READ] 0 Not sure [DO NOT READ] 3 Refused [DO NOT READ]

24 To Buy or Not to Buy: Shopping Behavior in a Recession Economy: An AARP Survey of Washington Residents 18+, April 2010
[IF Q4+Q11+Q19 = No/Not sure/Refused, SKIP to Q26] 24. Thinking about ALL of the unplanned or impulse purchases you have made in ANY type of store in the past
12 months, what was the MOST expensive item you purchased?
_______________________ [OPEN END – RECORD VERBATIM]
% N=767 70 Response given 20 Can’t remember [DO NOT READ] 8 Not sure [DO NOT READ] 3 Refused [DO NOT READ]
25. And how much did that item cost?
$_______________________ [OPEN END – RECORD VERBATIM]
% N=534 96 Response given 3 Can’t remember [DO NOT READ]
<1 Not sure [DO NOT READ] 1 Refused [DO NOT READ]
Personal Finance and Budgeting
26. Think for a moment about your personal debt on which you currently make interest payments like mortgages, credit cards, personal or car loans. Would you say that the amount of debt you currently have is more than you can handle financially, about as much as you can handle financially, or enough that you could handle more debt? [ALLOW ONLY ONE RESPONSE]
% N=800 8 More than you can handle financially 29 About as much as you can handle financially 41 Enough that you could handle more debt 19 Don’t have any personal debt [VOLUNTEERED] 1 Not sure [DO NOT READ] 3 Refused [DO NOT READ]

25 To Buy or Not to Buy: Shopping Behavior in a Recession Economy: An AARP Survey of Washington Residents 18+, April 2010
Impact of Economic Recession 27. Before we end, in the past 12 months, how hard did you try [INTERVIEWER PLEASE EMPHASIZE ‘TRY’ WHEN READING TO RESPONDENT] to reduce your overall spending in
some way? Would you say you tried very hard, you tried somewhat, you didn’t try too hard, or you didn’t try at all to reduce your over all spending in someway?
% N=800 33 Tried very hard 35 Tried somewhat 14 Didn’t try too hard 16 Didn’t try at all [SKIP TO 28] 1 Not sure [DO NOT READ] [IF NO, SKIP TO 28]
<1 Refused [DO NOT READ] [IF NO, SKIP TO 28]
27a. And how much did you reduce your overall spending – would you say:
% N=657 26 A great deal 47 Somewhat 22 Not very much 5 Not at all 1 Not sure [DO NOT READ] 0 Refused [DO NOT READ]

26 To Buy or Not to Buy: Shopping Behavior in a Recession Economy: An AARP Survey of Washington Residents 18+, April 2010
28. For the following, please just tell me if you or your family has done or experienced any of the following within the past 12 months as a result of the economic downturn: [RANDOMIZE] [IF NOT APPLICABLE, CODE AS “NO”]
Yes No Not sure Refused N=800 ▼ ▼ ▼ ▼
a. Reduced the amount of money spent on groceries ......................................................
37 62 1 <1
b. Reduced the amount of money spent shopping at department stores......................
63 35 1 <1
c. Reduced the amount of money spent shopping online ...........................................
39 57 2 2
d. Had problems paying for rent or mortgage ......................................................
12 87 1 1
e. Had problems paying for items like food or utility bills ...............................................
15 84 1 1
f. Withdrew funds early from a 401k or other retirement accounts .............................
10 87 2 1
g. Reduced contribution to a 401k or retirement accounts ......................................
21 75
3
1
h. Reduced the use of credit cards ................... 51 46 2 1
i. Withdrew money from personal savings 39 60 1 1
j. Put off going on vacation 44 55 1 <1
k. Reduced the amount of money spent on vacation
47 51 2 1
l. Used more coupons 41 58 1 <1
m. Delayed upgrading any technology in the home like computer software, tv, stereos
41 58 1 <1
n. Moved into a more affordable apartment or home
9 90 1 <1

27 To Buy or Not to Buy: Shopping Behavior in a Recession Economy: An AARP Survey of Washington Residents 18+, April 2010
And now for classification purposes only. Demographics D1. RECORD RESPONDENT GENDER [IF NECESSARY SAY: “To ensure it is recorded accurately, could you please state your gender?]
% N=800 49 MALE 51 FEMALE
D2. What is your age as of your last birthday? [RECORD IN YEARS]
__________________________________
% N=800 12 18-24 19 25-34 33 35-49 8 50-54 11 55-64 15 65+ 3 Refused
D3. What is your marital status? Are you currently…..
% N=800 57 Married 6 Not married, but living with your partner 1 Separated 6 Widowed 8 Divorced 20 Currently Single and never been married <1 DON’T KNOW 1 REFUSED
D4. [IF D2 = age 50 or older, ASK: “Are you or your spouse currently a member of A-A-R-P?” IF D3 = 2 ASK: “Are you or your partner currently a member of A-A-R-P?” OTHERWISE ASK: “Are you currently a member of A-A-R-P?”]
% N=270 52 Yes 47 No 1 DON’T KNOW 1 REFUSED

28 To Buy or Not to Buy: Shopping Behavior in a Recession Economy: An AARP Survey of Washington Residents 18+, April 2010
D5. What is the highest level of education that you completed? (READ)
% N=800 9 0 to 12th grade, but with no diploma 21 High school graduate or equivalent 13 Post high school education, but with no degree 13 2 year college degree 19 4 year college degree 7 Post-graduate study, but with no degree 17 Graduate or professional degree <1 DON’T KNOW 1 REFUSED
D6. Which of the following best describes your current employment status? Are you currently….
% N=800 8 Self-employed full-time 3 Self-employed part-time 39 Employed full-time 10 Employed part-time 18 Retired and not working at all 11 Unemployed, but looking for work 11 Not in the labor force for other reasons 1 DON’T KNOW 1 REFUSED
D7. Are you of Hispanic, Spanish, or Latino origin or descent?
% N=800 5 Yes 94 No <1 DON’T KNOW 1 REFUSED
D8. And which of the following best describes your race?
% N=800 86 White/Caucasian 3 Black/African American 2 Asian 2 Native American or Alaskan Native 1 Native Hawaiian or Pacific Islander 5 Or are you some other race? [Specify: ___________________________] 1 DON’T KNOW 2 REFUSED

29 To Buy or Not to Buy: Shopping Behavior in a Recession Economy: An AARP Survey of Washington Residents 18+, April 2010
D9. We realize income is a private matter and so rather than ask anything specific about your income, I’d like to ask you to please stop me when I get to the category that includes your household’s income before taxes in 2009. Was it… [READ]
% N=800 6 Less than $10,000 7 $10,000 but less than $20,000 12 $20,000 but less than $35,000 12 $35,000 but less than $50,000 10 $50,000 but less than $60,000 10 $60,000 but less than $75,000 28 $75,000 or more 6 DON’T KNOW / NOT SURE 11 REFUSED
D10. What is your 5-digit zip code?
__ __ __ __ __ DON’T KOW = 99998
REFUSED = 99999
THANKS AND HAVE A GOOD DAY / NIGHT!