TMI-2 REACTOR VESSEL LOWER HEAD HEATUP CALCULATIONS ...
48
EGG- TMI-7764 TMI-2 REACTOR VESSEL LOWER HEAD HEATUP CALCULATIONS Richard l. Moore Published August 1967 EG&G Idaho. Inc. Idaho Falls. Idaho 63415 Prepared for the U.S. Department of Energy Idaho Operations Office Under DOE Contract No. DE-AC07-76ID01510
Transcript of TMI-2 REACTOR VESSEL LOWER HEAD HEATUP CALCULATIONS ...
EGG-TMI-7764
TMI-2 REACTOR VESSEL LOWER HEAD HEATUP CALCULATIONS
Richard l. Moore
Published August 1967
EG&G Idaho. Inc. Idaho Falls. Idaho 63415
Prepared for the U.S. Department of Energy Idaho Operations Office
Under DOE Contract No. DE-AC07-76ID01510
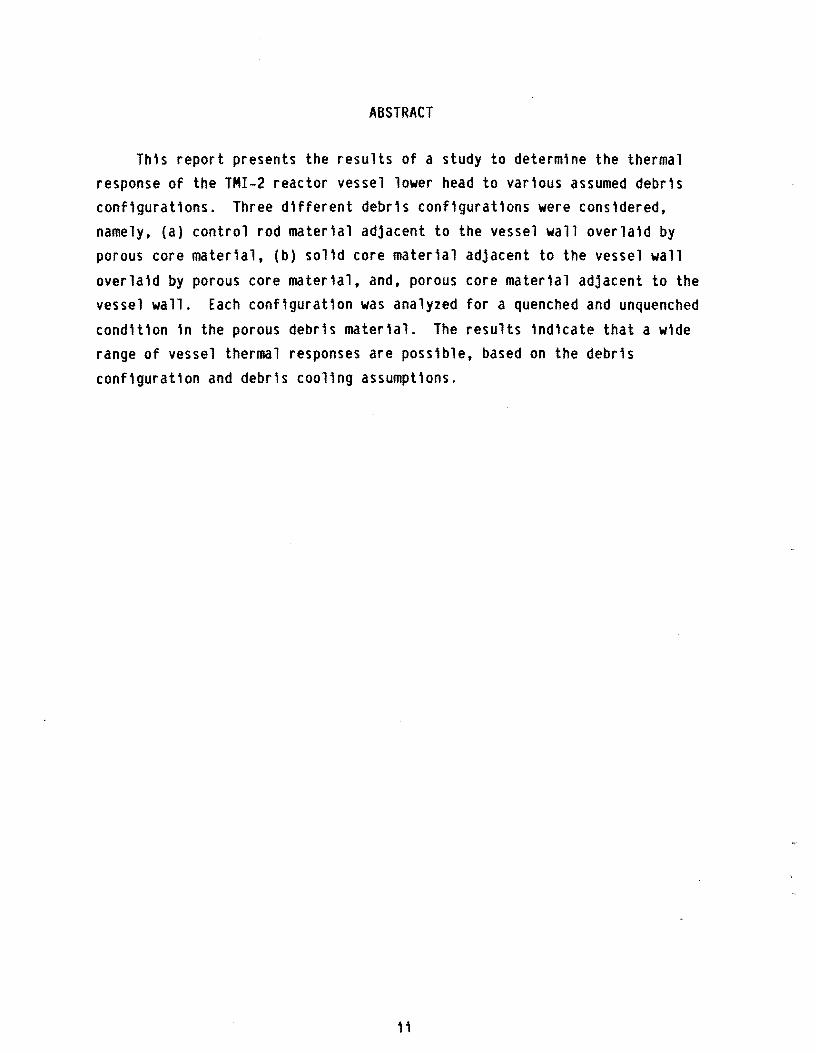
ABSTRACT
This report presents the results of a study to determine the thermal response of the TM1-2 reactor vessel lower head to various assumed debris configurations. Three different debris configurations were considered, namely, (a) control rod material adjacent to the vessel wall overlaid by porous core material, (b) solid core material adjacent to the vessel wall
overlaid by porous core material, and, porous core material adjacent to the vessel wall. Each configuration was analyzed for a quenched and unquenched
condition in the porous debris material. The results indicate that a wide range of vessel thermal responses are possible, based on the debris configuration and debris cooling assumptions.
11
CONTENTS
ABSTRACT .............................................................. 11
1. INTRODUCTION. . . . . . . . . . . . . . . . . . . . . . . . . . . . . . . . . . . . . . . . . . .. . . .. . . . . . 1
2. COMPOSITION OF RELOCATED CORE MATERIAL AND CONFIGURATIONS MOD ELED ................................. "................................................................................... 4
3. COUPLE MODEL OF THE LOWER PLENUM AND VESSEL WALL ................. 8
3.1 Lower Head Configuration Model ...........................•. 10
3.2 Boundary Conditions ........................................ 13
3.3 Thermal Properties ......................................... 15
3.4 Decay Heating Rates........................................ 19
4. CREEP RUPTURE FAILURE............................................ 22
5. CALCULATED VESSEL THERMAL RESPONSE ............................... 25
6. CONCLUSIONS AND RECOMMENDATIONS .................................. 41
7. REFERENCES........................ ..•........•................... 43
FIGURES
1. Hypothesized core damage configuration at 224 min (lowerplenum relocation) ..........................•.................... 2
2. Schematic showing the configurations considered in the analys1s ................ " .................................................................. ,............................. 7
3. Node numbers ............................•.....•.......•......•... 11
4. Element numbers.................................................. 12
5. Average wall temperature versus rupture time for a carbon steel RPV lower head subjected to system pressures ............... 23
6. Temperature history of vessel wall node 3 ........ " ...................................... 27
7. Temperature history of vessel wall node 25 ............................................. 28
8. Temperature history of vessel wall node 42 .......... " .................................. 29
9. Temperature h1story of vessel wall node 63 .............................. " .............. 30
10. Temperature history of debris node 68 ............................ 32
11. Temperature history of solid layer node 38 ....................... 35
12. Mid-wall temperature profile at 1200 s into the transient (quenched cases) ..........................•...................... 36
13. Mid-wall temperature profile at 1200 s into the transient (unquenched cases) ........................................•...... 37
TABLES
1. Radial quench position as a funcUon of time..................... 16
2. TMI-2 reactor core decay heat power (MW) ......................... 21
3. Description of cases .......................•..................... 26
4. SUll'KIlary of results .................................... to to..................................................... 39
iv
TMI-2 REACTOR VESSEL LOWER HEAD HEATUP CALCULATIONS
1. INTRODUCTION
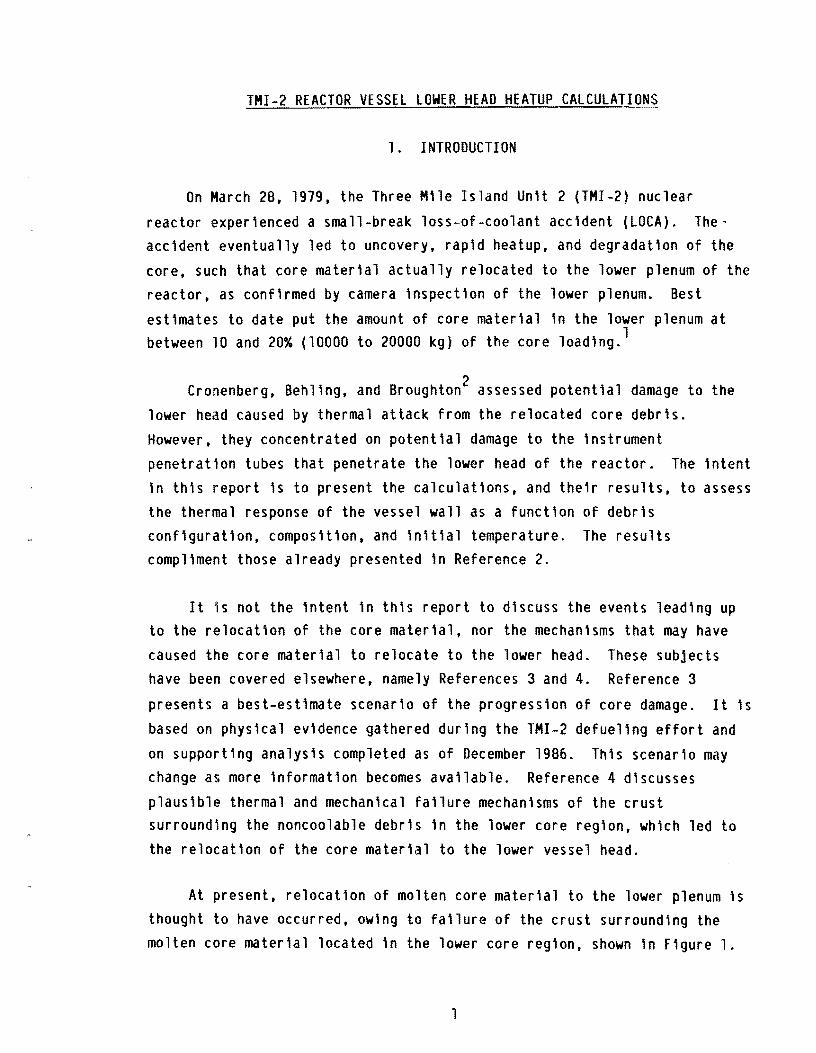
On March 28, 1979, the Three Mile Island Unit 2 (TMI-2) nuclear
reactor experienced a small-break loss-of-coolant accident (LOCA). The· accident eventually led to uncovery, rapid heatup, and degradation of the core. such that core material actually relocated to the lower plenum of the reactor, as confirmed by camera inspection of the lower plenum. Best
estimates to date put the amount of core material in the lower plenum at 1between 10 and 20% (10000 to 20000 kg) of the core 10ad1ng.
2Cronenberg, Behling, and Broughton assessed potential damage to the lower head caused by thermal attack from the relocated core debris. However. they concentrated on potential damage to the instrument penetration tubes that penetrate the lower head of the reactor. The intent in this report is to present the calculations, and their results, to assess the thermal response of the vessel wall as a function of debris configuration, composition, and initial temperature. The results compliment those already presented in Reference 2.
It is not the intent in this report to discuss the events leading up to the relocation of the core material, nor the mechanisms that may have caused the core material to relocate to the lower head. These subjects have been covered elsewhere, namely References 3 and 4. Reference 3
presents a best-estimate scenario of the progression of core damage. It is based on physical evidence gathered during the TMI-2 defue1ing effort and
on supporting analysis completed as of December 1986. This scenario may change as more information becomes available. Reference 4 discusses plausible thermal and mechanical failure mechanisms of the crust surrounding the noncoo1ab1e debris in the lower core region. which led to the relocation of the core material to the lower vessel head.
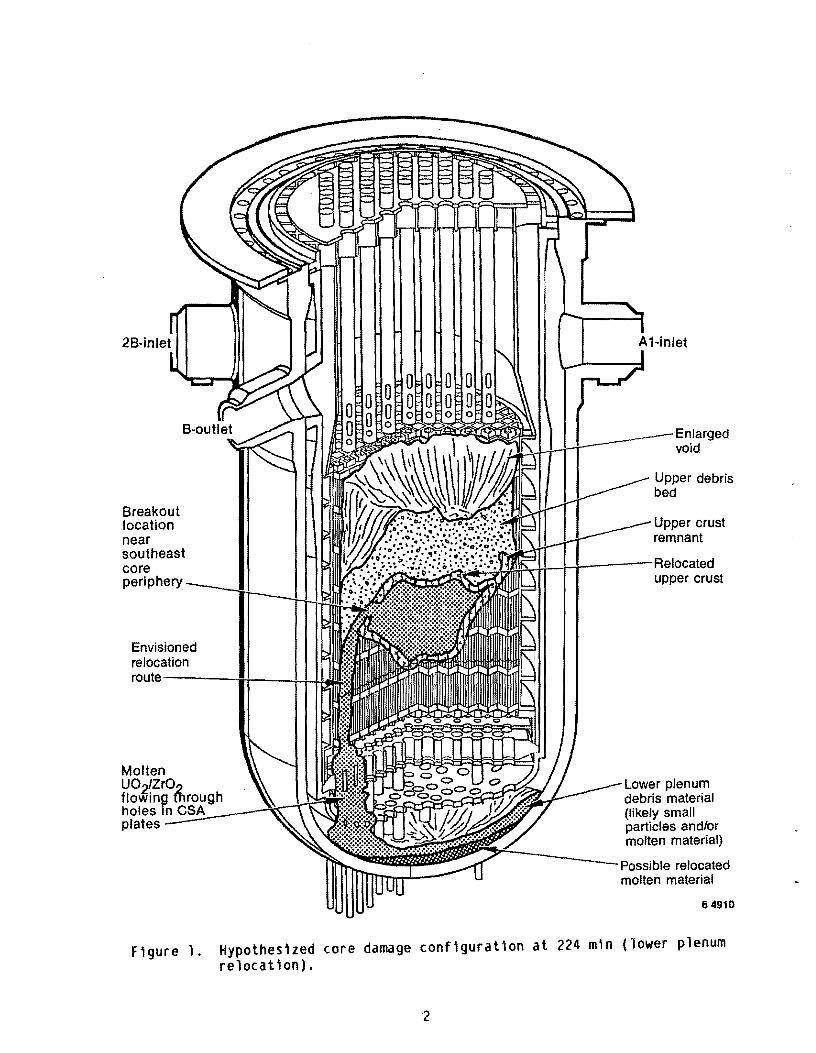
At present, relocation of molten core material to the lower plenum is thought to have occurred, owing to failure of the crust surrounding the molten core material located in the lower core region, shown in Figure 1.
1
2B·j 1·inlet
__--Enlarged void
Upper debris bed
Breakout location Upper crust near remnant southeast core W-l--l---il---- Relocated
upper crust periphery
Envisioned relocation route-----Ji---+-!-!1
Molten UO IZrO Lower plenum
debris material flo~ing ~,rr(o~u~gh~~~~~[l~~j!t~~~~d:?i~1n.~holes in C~A II:: (likely small plates particles and/or
molten material)
Possible relocated molten material
F1gure 1. Hypothes1zed core damage conf1guration at 224 m1n (lower plenum relocat1on) .
64910
TMI-2 on-line data (neutron count rate at the source-range monitor, sudden increase in primary system pressure, and the simultaneous alarms of the self-powered neutron detectors) suggest that the molten core material may have relocated in about one minute. It is estimated that the coolant liquid level at time of relocation was above or near the top of the core.
3
2. COMPOSITION OF RELOCATED CORE MATERIAL AND CONFIGURATIONS MODELED
To assess the potential damage to the lower head by thermal attack from the relocated core material requires a knowledge of the composition of such material and its geometrical configuration.
Based on events recorded approximately 224 min into the accident, it is highly likely that molten core material relocated to the lower plenum during a short interval centered around the 224-min time frame. Postaccident examination of the TMI-2 reactor further reveals that the molten core material probably originated from near the top of the lower core blockage, owing to a break in the crust at the periphery of the blockage. Preliminary analysis of the blockage in the lower core reglon indicates that prior to this relocation approximately 12000 kg of core
4material in the blockage could have been molten. At these high temperatures, convection currents in the melt should have developed. thus providing a homogeneous-like mixture of U02, Zr, Zr02, and some control rod material (silver-indium-cadmium).
Postaccident visual inspection of the lower plenum indicates that most of the molten core mixture relocated to the lower plenum. Examination of the loose debris from the lower plenum (top surface of the debr1s)
indicates the relocated material is composed primarily of ceramic fuel (U02) and cladd1ng (Zr).5 It is assumed for the analysis presented in this report that the core material in the lower plenum is a homogenized mixture, 80 and 20 percent by mass of U02 and Zr. The effects of control rod material on the thermal properties of the mixture have been neglected for this analysis; however, if more extensive sampling of the lower plenum debris should show significant amounts of control rod material \n the debris its effect will have to be accounted for in later analyses.
The specific location of the greater part of the control rod material
has not yet been identified. The question of control rod material location arises from examination of the gamma-scanning data obtained via insertion
6 7 of a thin-tube ion chamber in the single open penetration tube (L-U). '
4
The f1nd1ngs d1ffer from what would be expected 1f a layer of U-Zr-O ceram1c ex1sted at the bottom of the plenum. The data show the act1vity of fission products increased with 1ncreased height above the lower head. suggesting a nonfuel layer of material approximately 9 in. in height at the
2centerline of the reactor. At present. it is difficult to assess how much control rod material is contained in the relocated core material. The control rod material has a melting temperature of approximately 1100 K. With such a low melting temperature. it is likely that control rod material was the first material, along with its stainless steel cladding, to reach
melting temperature and relocate to the lower core region, thus forming the initial lower core blockage. Later. h1gh-temperature molten fuel and zirca10y cladding relocated on top of the control rod material. At this point, one can only speculate as to what happened to the control rod material. One possible scenar10 is that the control rod material remelted from the heat of the mater1a1 above it. and, thus. relocated to the lower plenum prior to the mass1ve core material relocation. Such relocation would have involved re1at1ve1y small amounts of material. thus producing small fragments that would have been totally quenched by the time the control rod material reached the lower head. A second scenario assumes that the control rod material stayed in the lower core region, remelted. w1th most of it mixing and remaining in the lower region of the molten pool. In a convecting molten pool. experimental evidence 1ndicates that the heat transfer from the bottom of the molten pool behaves as though the
8heat 1s be1ng conducted, rather than convected. from the molten pool. This impl1es that convective motion is neglig1b1e or absent in the lower pool region. If this is the case, the more dense control rod material may not have mixed with the molten fuel but remained at the bottom of the
molten lower core pool.
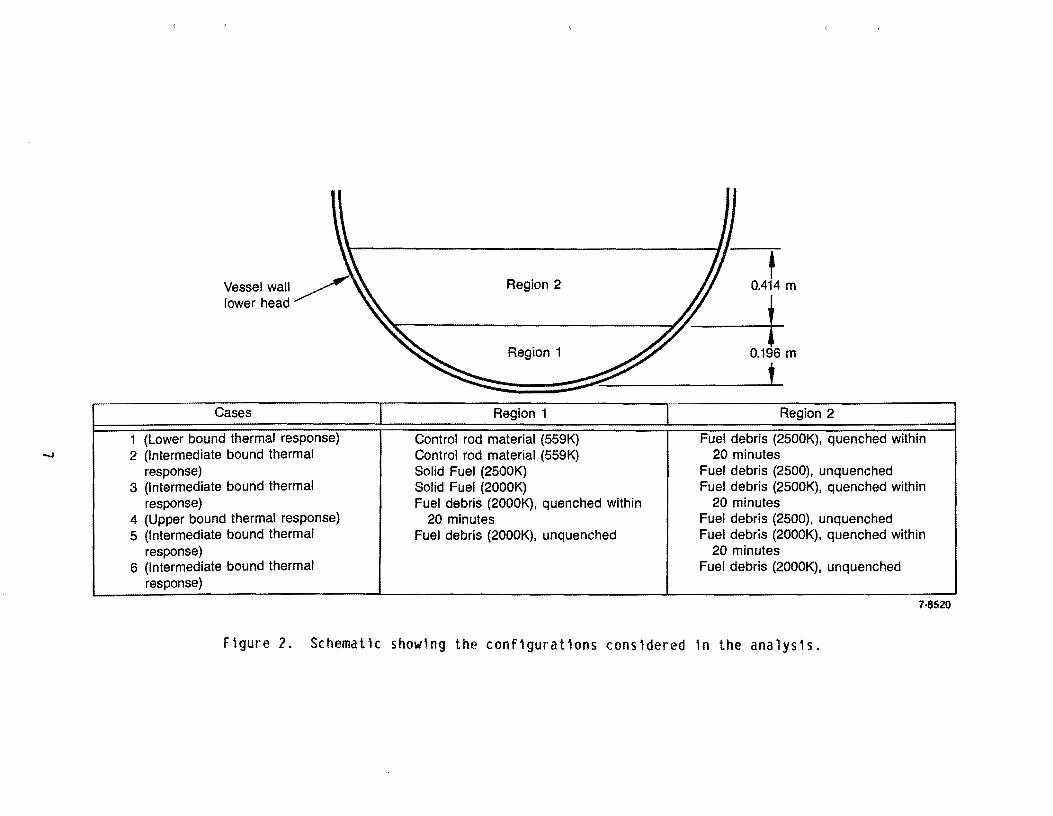
Based on the uncertaint1es of the conf1guration and compos1t1on of material 1n the lower plenum, as well as the quenchabi1ity of the relocated
material, six cases were considered to bound the thermal response of the vessel wall. Case 1 consists of a 7.7-in.-thick (O.196-m- at reactor center11ne) layer of nonfue1 material (control rod-l1ke mater1a1; porosity = 0) initially at 559 K, over1a1d w1th a layer of heat-generating porous U-Zr-O ceramic (poros1ty = 0.65) initially at 2500 K. as shown in
5
Flgure 2. Thls layer of control rod materlal represents 10% of the orlglnal control rod materlal. For thls case. we assume that the porous debris material quenches within 20 mln. Case 2 is the same as Case 1. except that we assume the porous debris is unquenchable. The porous layer 1s assumed to be 16.3 In. (0.414 m) high. which yields an overall helght of relocated materlal of 24.0 In. (0.610 m). The total height of 24 In. ls the same for all cases considered. Case 3 1s a mlxture of heat-generat1ng U-Zr-O ceramlc (no porosity) initlally at 2500 K. overlald with a porous layer of U-Zr-O (porosity = .65) inltially at a temperature of 2500 K. We assume that the porous debr1s materlal quenches wlth1n 20 m1n from the t1me the bed formed. The helght of the solld layer (control rod materlal for Cases 1 and 2. core materlal for Cases 3 and 4) 1s the same for all cases where lt has been assumed that a so11d layer of material lies adjacent to the lower head. Case 4 is the same as Case 3. with the exception that the porous debrls 1s unquenchable. Case 5 assumes that the entire debris bed 1s porous (no solid region; porosity = .65) with an initial temperature of 2000 K. We assume that the debr1s bed is quenched within 20 min from the time of formation. Case 6 is the same as Case 5 except. again. we assume that the debris is unquenched during the transient considered.
6
-.J
t Region 2 Vessel wall f 0.414 m
lower head y Region 1 0.196 m
t Cases
1 (Lower bound thermal response) 2 (Intermediate bound thermal
response) 3 (Intermediate bound thermal
response) 4 (Upper bound thermal response) 5 (Intermediate bound thermal
response) 6 (Intermediate bound thermal
response)
Region 1
Control rod material (559K) Control rod material (559K) Solid Fuel (2500K) Solid Fuel (2000K) Fuel debris (2000K). quenched within
20 minutes Fuel debris (2000K). unquenched
Region 2
Fuel debris (2500K), quenched within 20 minutes
Fuel debris (2500), unquenched Fuel debris (2500K). quenched within
20 minutes Fuel debris (2500), unquenched Fuel debris (2000K). quenched within
20 minutes Fuel debris (2000K), unquenched
I
I
7·8520
Figure 2. Schematic showing the conf'gurat'ons cons'dered in the analys's.
3. COUPLE MODEL OF THE LOWER PLENUM AND VESSEL WALL
The lower head and relocated core matetial were modeled us1ng COUPLE/FLUID, a two-dimensional finite element transient heat conduction
9and advection code. where advection refers to the transport of energy by means of a flowing fluid. For the analysis presented in this report the code solves the following two-dimensional energy transport equation:
aT(pC)e at = v • KVT + Q (1 )
where
(pC)e = $ (pC)t + (1 - $)(pC)s
-3 p = dens Hy (kg m )
-1 -1C = specific heat (J kg K )
-1k thermal conductivity (w m K-l )=
Q = volumetric heat generation rate (w m -3 )
T temperature (K)=
= porosity of solid material.
The subscripts are defined as follows:
e equivalent
= liquid
s = solid.
8
Equation (1) is solved using Galerkin's weighted residual technique in conjunction with linear basic functions. This is a standard technique used to obtain approximate solutions to linear and nonlinear partial
differential equations via the finite element method. The capability to model the freezing and/or melting of various reactor materials has been
added to the code through the addition of several subroutines.
The numerical modeling of heat transfer 1n a region that is undergoing a change of phase (freezing or melting) is more difficult than modeling a
nonphase change region. This is due to the changing location of the lnterface between liquid and solid region as a function of time. dependent on the development of the transient temperature field. In addition. the local liberation of latent heat may cause a significant heat flux
discontinuity at the phase boundary.
At present. there are two generally accepted ways of numerically
approximating a phase change problem. One method uses a moving mesh
technique; the other method uses a fixed mesh technique. At this time. the
moving mesh technique is primarily used to solve one-dimenSlonal problems. The moving mesh technique is not easily adapted to two-dimensional problems. owing to its tendency to cause mesh distortion. Thus. we have chosen a fixed mesh technique to model the phase change in the debris. The
particular method we have chosen is described in Reference 10. The method consists of using the material enthalpy to determine an effective density time specific heat (p C ) value to use in Equation (l). The enthalpypper unit volume is defined as
(2 )H" dTf p Cp
thus
pCp dH/dT (3)
9
wh1ch can be wr1tten as
dH dX pCp = dX dT (4)
where
dH = enthalpy grad1ent normal to phase change 1nterfacedX
dX = inverst of the temperature grad1ent normal to the phase dT
change 1nterface.
For computat10n, 1t 1s eas1er to calculate dH/dX and dX/dT than 1t 1s dH/dT d1rectly. Us1ng the enthalpy approach. a local d1scont1nu1ty such as an enthalpy jump at the phase change boundary w1l1 automat1cally be accounted for. s1nce the enthalpy of any mater1al 1s a monoton1cally 1ncreas1ng funct10n of temperature.
3.1 lower Head Conf1gurat10n Model
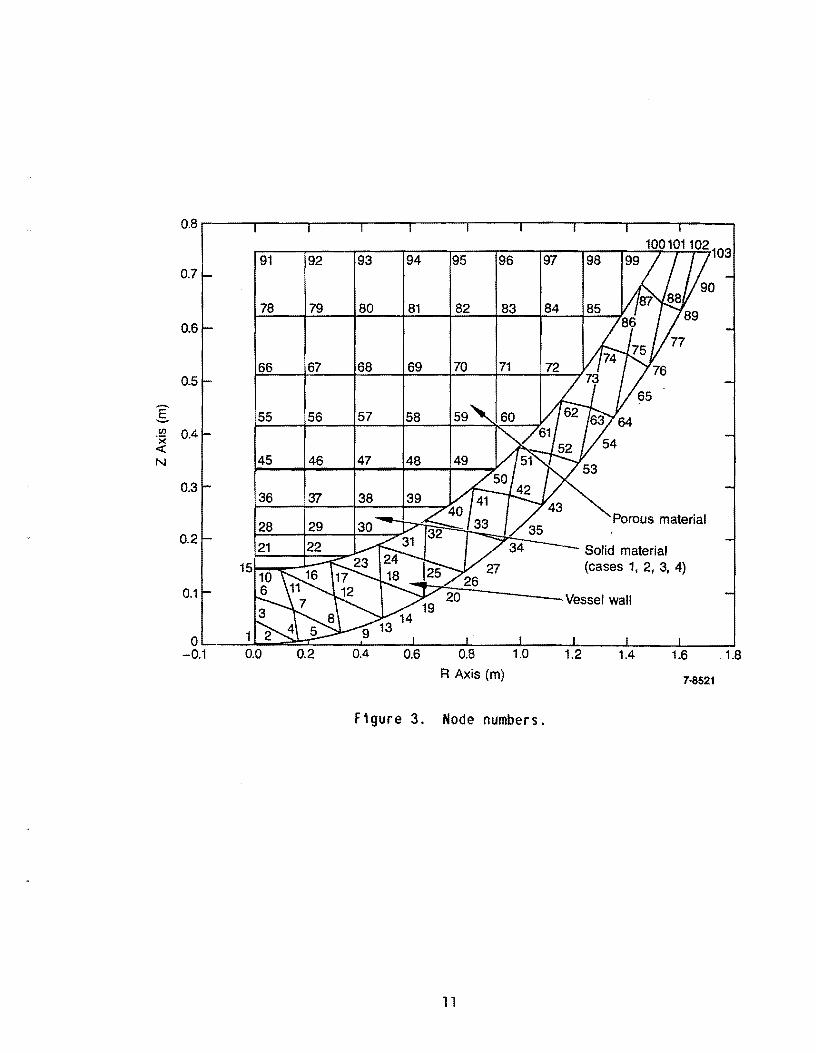
The lower head of the TMI-2 reactor cons1sts of a 5-1n.-th1ck carbon steel wall 1n the shape of a hem1sphere. The 1ns1de rad1us of the hem1sphere 1s 2.215 m. The lower head 1ns1de surface 1s covered w1th a th1n layer of sta1nless steel (3/8 1n. th1ck). The outs1de surface of the lower head 1s assumed to be sh1elded from the external env1ronment by a th1n sta1nless steel rad1at10n sh1eld. For ease of mode11ng. 1t has been assumed that the top surface of the core mater1al 1n the lower plenum forms a level surface 1n the hor1zontal plane. The total he1ght of the relocated core mater1al was assumed to be 0.6 meters at the center11ne of the reactor, as measured from the 1ns1de surface of the vessel wall. The he1ght of the sol1d layer of mater1al for Cases 1, 2. 3, and 4 was assumed to be approx1mately 0.2-meters h1gh at the center11ne of the reactor.
The f1n1te element mesh developed for th1s analys1s 1s shown 1n F1gures 3 and 4. F1gure 3 d1splays the node numbers assoc1ated w1th the
10
I 'xC/)
~
N
0.8
0.7
0.6
0.5
0.4
0.3
0.2
0.1
0 -0.1
91 92 93 94 95 96 97 98
78 79 80 81 82 83 84 85
66 67 68 69 70 71 72
55 56 57 58
45 46 47 48
36 37
28 29 Porous material
21 Solid material (cases 1, 2, 3, 4)
Vessel wall
1.8 R Axis (m) 7·8521
Figure 3. Node numbers.
11
0.8
0.7
0.6
0.5
-.s (J) 0.4'x «
N
0.3
0.2
0.1
0 -0.1 0.0
67 68 69 70 71 72 73 74 78
56 57 58 59 60 61
46 47 48 57
37 38 39
29 30 31
22 23
Solid material (cases 1, 2, 3, 4)
1.8 R Axis (m) 7·8522
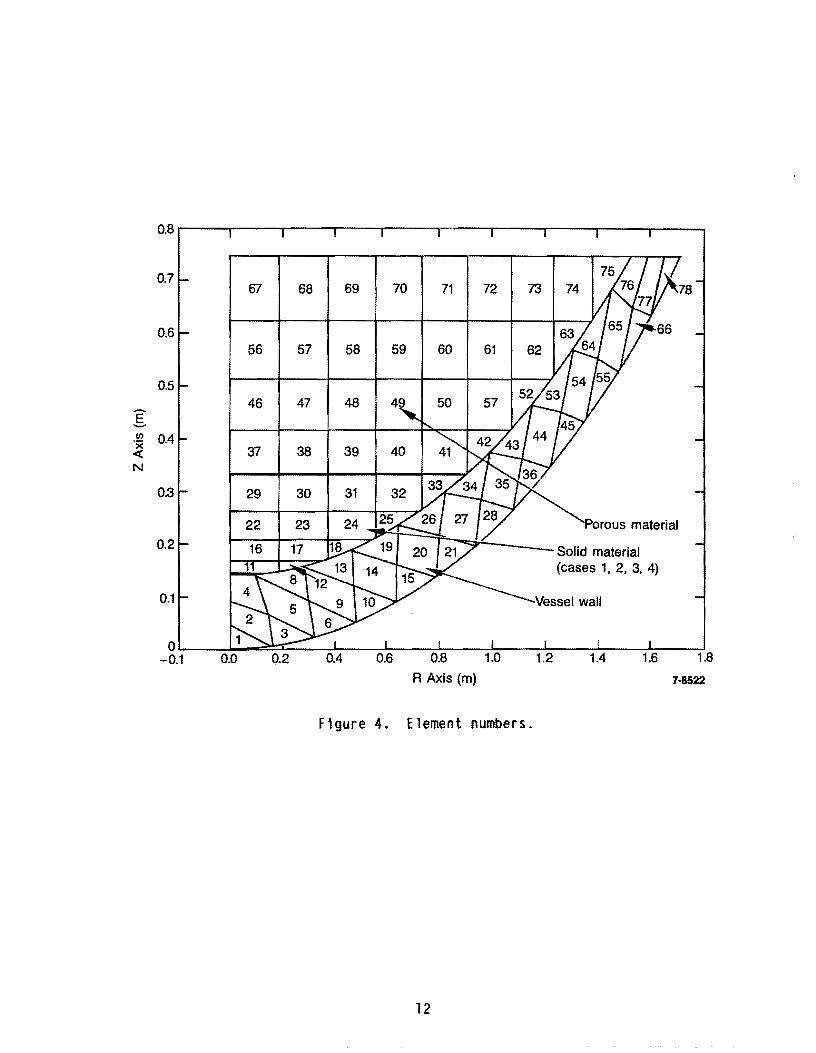
F1gure 4. Element numbers.
12
mesh, whereas Figure 4 contains the element numbers associated with each element of the model. The model was developed using cylindrical coordinates. Axial-symmetry was also assumed about the reactor centerline. The lower head vessel wall is represented by the elements lying between the two curved lines 1n Figure 4. The thin stainless liner has been construed as part of the vessel wall. This was done for ease of modeling, and will have no noticeable effect on the predicted temperatures.
3.2 Boundary Conditions
In order to predict the transient temperature history of the lower plenum vessel wall. as well as the relocated core material, several boundary conditions are needed. As the outer surface temperature of the reactor vessel wall increases above the containment temperature, energy is transferred from the wall to the containment environment by means of convection and radiation. For this analysis, the outer surface of the lower head is assumed to radiate to a thin stainless steel shield, which in turn radiates and convects to the containment environment. Effective
radiation and convective heat transfer coefficients were calculated and applied between the outer surface of the lower head and a 31l-K sink temperature used to represent the external environment. The init'a1 temperature of the reactor vessel wall was assumed to be 559 K, corresponding to the coolant saturation temperature at a pressure of 7.0 MPa.
Thermal boundary conditions are also necessary to simulate the environment surrounding the relocated core material. For this study, we
assume that the top surface of the debris immediately Quenches to 559 K. This condition is used to simulate nucleate boiling along the top of the
debris bed and results in the removal of the maximum amount of heat possible from the top of the heat-generating debris bed. In the model,
this is simulated by constraining the top surface of the debris bed to be 559 K and holding the surface at the constrained temperature for the duration of the transient considered. We have also assumed for some of the cases that the porous debris bed will become completely Quenched sometime during the transient.
13
From recent THI-2 debr1s coolab11ity stud1es,ll it has been estimated that 1t will require approximately 20 m1n to quench a debris bed of the size s1milar to the one produced 1nTHI. How the quench front will propagate is an unknown parameter; however. for our analysis we assume the follow1ng: since the lower head wall 1s cool relative to the debris
mater1al. we w11l assume that water penetrates the debris bed adjacent to the vessel wall and quenches radially from the vessel wall inward toward the reactor centerline. This gives us some insight as to how the vessel wall w1l1 respond thermally for quenched and unquenched debr1s conf1guraUons.
The posit10n of the quench front was calculated by assuming that the area swept out by the quench front was constant in time and was independent of the vert1cal coordinate. In equation form, we have
(5)
where
initial quench velocity (m sec- l )=
outer debris radius (m)ro =
v instantaneous quench front velocity (m sec -1 )=
r = position of quench front (m).
The time rate of change of the quench front is equal to the velocity of the quench front.
dr (6)dt = -v
Solving for V, using Equat10n (5), and'subst1tut1ng into Equation (6) y1elds
14
- V rdr o 0 (7)dt = r
Integratlng Equation (7) we have the quench front positlon as a function of time
2)1/2r :0 -2V r t + r (8)( 000
The lnitlal quench velocity is glven by
(9)
where t is the total quench time (20 min).
Table 1 presents the tlme of quench for the nodes 1n the porous core material. When the quench front is calculated to coincide with a node, that nodal temperature is decreased from 2500 to 559 K and held at 559 K until the end of the translent.
3.3 Thermal Properties
The thermal properties used for the analysis were obtained from MATPRO,12 a data base for lWR material propertles. Glven the atomic fraction of each component of the mixture. the MATPRO thermal property package will return mixture density. specific heat. enthalpy. and thermal
conductivity values. The mixture thermal conductivity values calculated by MATPRO were replaced by values calculated internal to the code. The
approach used was to calculate two thermal conductivity values for the mixture (one based on a series model. the other based on a parallel model)
and average these values to obtain the overall mixture thermal conductivity_ The two models used are
15
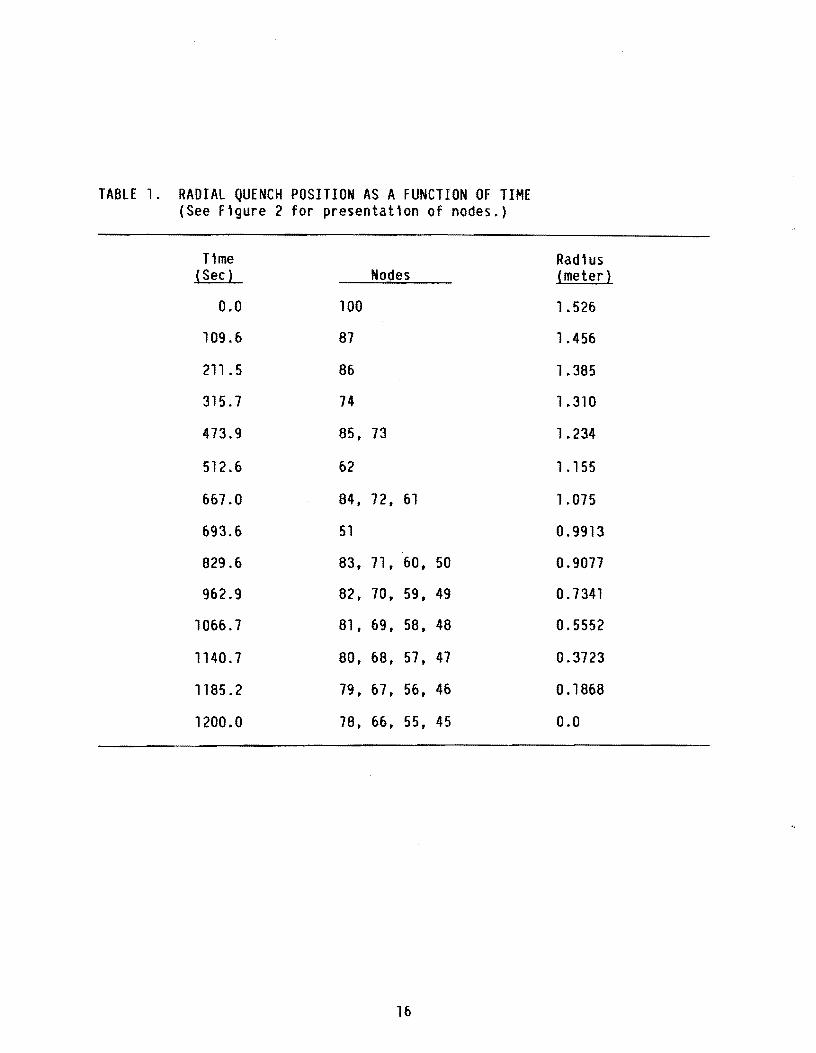
TABLE 1. RADIAL QUENCH POSITION AS A FUNCTION OF TIME (See Flgure 2 for presentatlon of nodes.)
T1me Radlus (Sec) Nodes (meter)
0.0 100 1.526
109.6 87 1.456
211 .5 86 1.385
315.7 74 1.310
473.9 85, 73 1.234
512.6 62 1.155
667.0 84, 72, 61 1.075
693.6 51 0.9913
829.6 83, 71, 60, 50 0.9077
962.9 82, 70, 59, 49 0.7341
1066.7 81, 69, 58, 48 0.5552
1140.7 80, 68. 57. 47 0.3723
1185.2 79, 67. 56, 46 0.1868
1200.0 78, 66. 55. 45 0.0
16
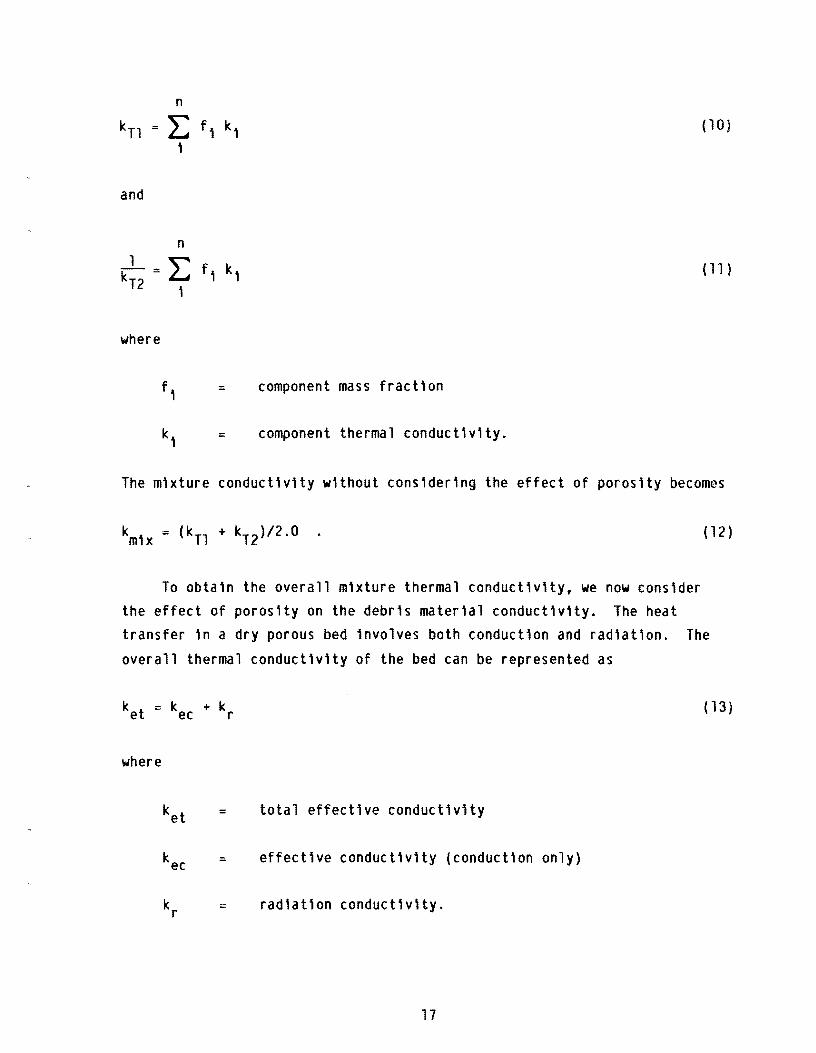
n
k (10)n 2: f, k, 1
and
n
2: f 1 k 1 ( 11)k~2 = 1
where
= component mass fraction
= component thermal conductivity.
The mixture conductivity without considering the effect of porosity becomes
( 12)
To obtain the overall mixture thermal conductivity, we now consider the effect of porosity on the debris material conductivity. The heat transfer in a dry porous bed involves both conduction and radiation. The
overall thermal conductivity of the bed can be represented as
k t = k + k (13)e ec r
where
= total effective conductivity
= effective conductivity (conduction only)
radiation conductivity.
17
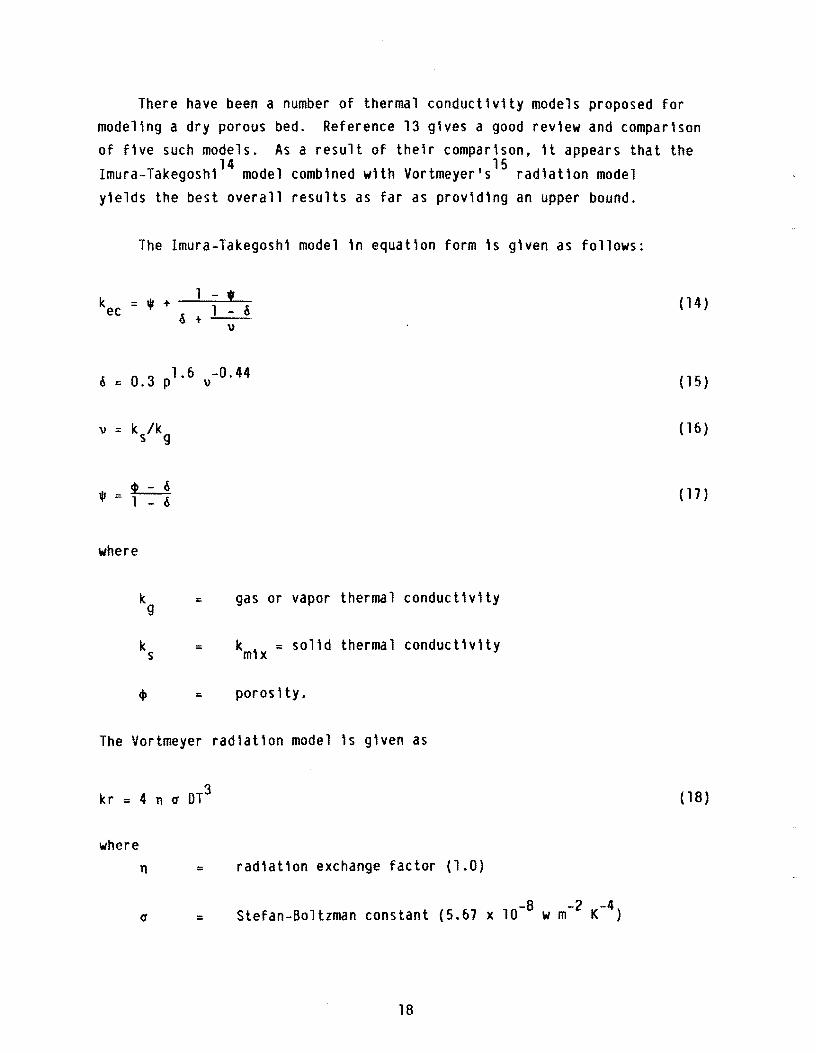
There have been a number of thermal conduct1vity models proposed for modeling a dry porous bed. Reference 13 gives a good review and comparison of five such models. As a result of their comparison, it appears that the
14 15Imura-Takegoshi model combined with Vortmeyer's radiation model yields the best overall results as far as providing an upper bound.
The Imura-Takegoshi model in equation form is given as follows:
1 - •kec = • + (14 )
r 1 - & I;) +-
" I 0 3 1.0 -0.44 0= • P \) (15 )
(10)
~ (17 )• = 1 - ()
where
k gas or vapor thermal conductivityg
k = k i = solid thermal conductivitys m x
poros ity.
The Vortmeyer radiation model is given as
3kr = 4 T1 a OT ( 18)
where T1 = radiation exchange factor (1.0)
-8 -2-4 a = Stefan-Boltzman constant (5.07 x 10 w m K )
18
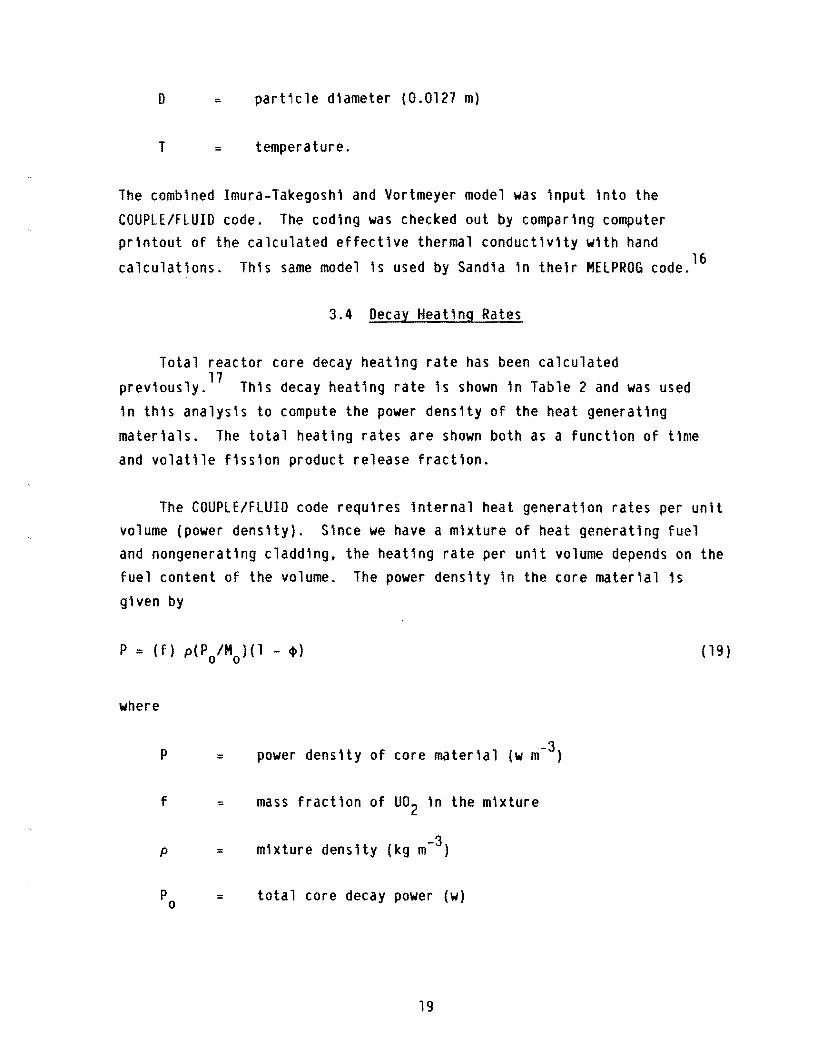
D particle dlameter (O.0121 m)
T = temperature.
The comblned Imura-Takegoshl and Vortmeyer model was lnput into the COUPLE/FLUID code. The codlng was checked out by comparlng computer printout of the calculated effectlve thermal conductivity with hand
calculations. This same model is used by Sandia in their MELPROG code. 16
3.4 Decay Heating Rates
Total reactor core decay heating rate has been calculated 11previously. This decay heating rate is shown in Table 2 and was used
in this analysis to compute the power denslty of the heat generating materials. The total heating rates are shown both as a function of time and volatile fisslon product release fraction.
The COUPLE/FLUID code requires internal heat generation rates per unit volume (power density). Since we have a mixture of heat generating fuel and nongenerating cladding. the heating rate per unit volume depends on the fuel content of the volume. The power density in the core material 1s glven by
(19)
where
-3p = power density of core material (w m )
f mass fraction of U02 in the mixture
-3 p = mixture density (kg m )
P = total core decay power (w)o
19
total mass of U02 tn the core (93100 kg)
porosity.
For this analysis. we assume a volatile f1ssion product release fract10n of 0.5. wh1ch 1s consistent with that used 1n the calculations presented 1n Reference 17. As indicated in Reference 17. the actual release fractions have not yet been determined; thus. the use of 0.5 is only an est1mate of the real value. The use of 0.5 equates into a total core power of 20.0 HW at 224 m1n. The core power at 360 and 600 m1n are 18.2 and 14.8 HW. respectively. Equation 20 1s then used to generate the appropriate power densities needed by the code.
20
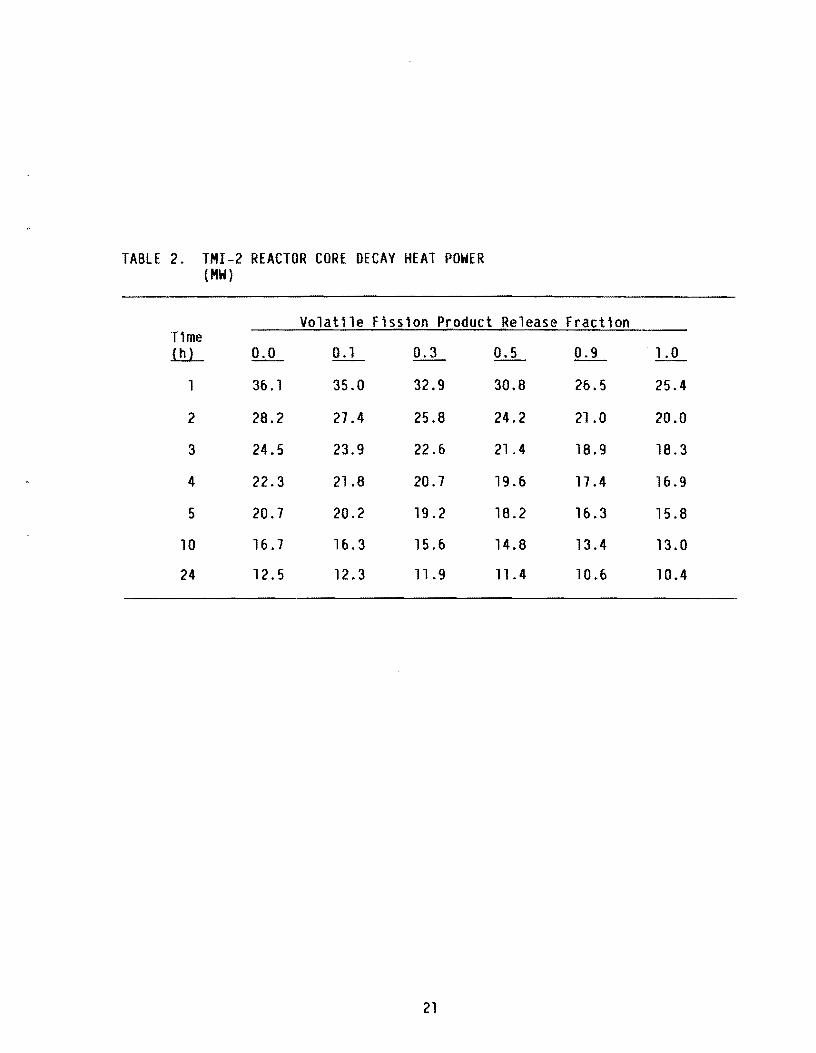
TABLE 2. TMI-2 REACTOR CORE DECAY HEAT POWER (MW)
Volatile Fission Product Release Fraction nme 1l!.L Q.JL 0.1 !!.:..L ~ !L.L lJL
1 36.1 35.0 32.9 30.8 26.5 25.4
2 28.2 27.4 25.8 24.2 21.0 20.0
3 24.5 23.9 22.6 21.4 18.9 18.3
4 22.3 21.8 20.7 19.6 17 .4 16.9
5 20.7 20.2 19.2 18.2 16.3 15.8
10 16.7 16.3 15.6 14.8 13.4 13.0
24 12.5 12.3 11.9 11.4 10.6 10.4
21
4. CREEP RUPTURE fAILURE
When hot debr1s mater1al comes \n contact wlth the lower head, the
head w1ll e1ther surv1ve. fa1l because of melt through, or fa11 because of creep rupture.
Fa1lure caused by creep rupture can be determ1ned us1ng the Larson-Miller criter10n. The tlme to rupture at a specified set of conditions for A-50B. Class 2 carbon steel. is given as
t = 10(PLM/T - 20) (20)
where
t = time to fa1lure (hr)
PLM Larson-Miller parameter
T = material temperature (oR).
For A-50B. Class 2 carbon steel. the Larson-M1ller parameter is
PLM = (-9603.0)(10g a) + 46454.0 (21)
where
Pr (22)= 2h
and
P system pressure (ksi)
r = inside radius of vessel
h th1ckness of vessel wall=
22
1200r-------------r-------------r-----------~r_----------_.
5.0 MPa
900~____________~_____________L____~~____~~--~------~
0.1 10 100 1000 Rupture Time (hr)
7·8523
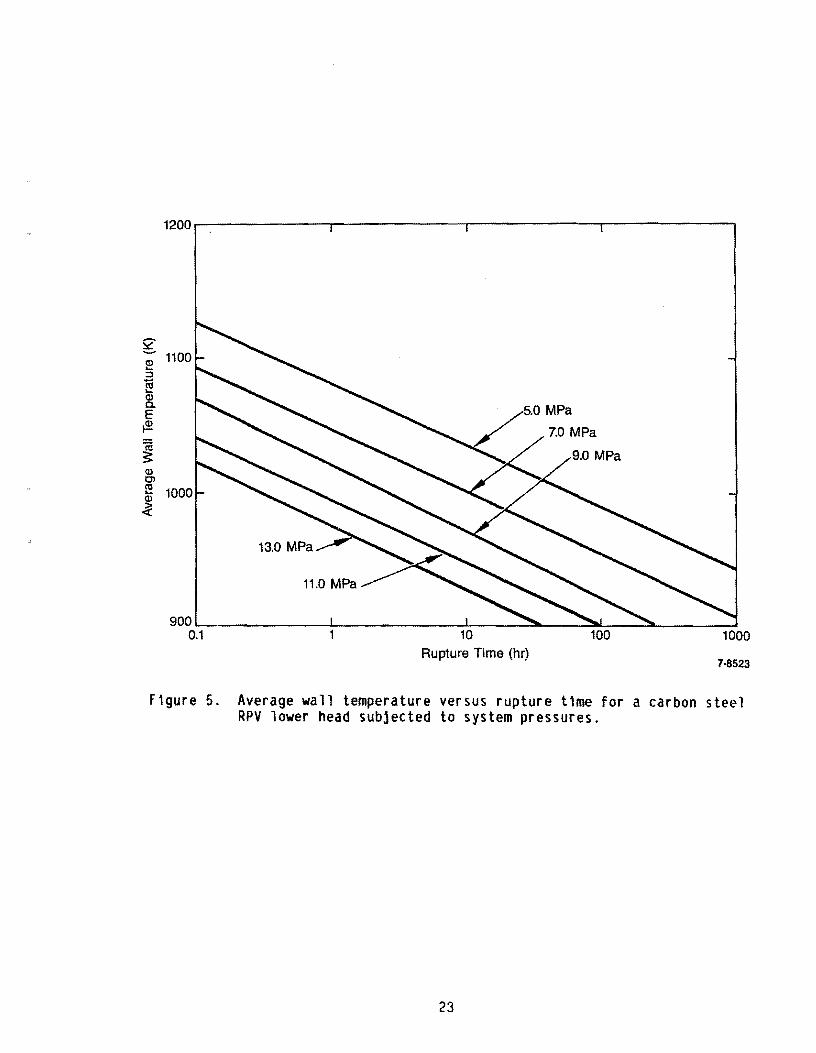
F1gure 5. Average wall temperature versus rupture t1me for a carbon steel RPV lower head subjected to system pressures.
23

a = stress (ks1).
A plot of rupture t1me versus average wall temperature for f1ve dlfferent system pressures 1s presented 1n Flgure 5. The lmportance of temperature relat1ve to creep rupture of the vessel ls eas1ly observed from the F1gure. For example, lf the lower head ls at an average temperature of 1000 K w1th a pressure dlfferent1al across the vessel wall of 7 MPa we can expect the lower head to fall wlth1n 10 hours, ow1ng to creep rupture. However, 1f the vessel wall is ma1nta1ned at an average temperature of 1100 K results presented 1n F1gure 5 ind1cate that the vessel wall w11l fall wlth1n 0.1 hours from the time the wall average temperature exceeds 1100 K.
Flgure 5 111ustrates the dramatlc effect the wall temperature has on the predlcted tlme to creep rupture fa1lure of the reactor primary vessel lower head. There is one maln l1mltation to the use of F1gure 5 1n the predict10n of creep rupture fal1ure--the use of an average wall temperature proflle through the wall. To accurately pred1ct the failure t1me assoclated with creep rupture would requ1re a detalled flnlte element stress analys1s; however, the rupture times shown ln Figure 5 should g1ve a reasonable est1mate of the true rupture t1mes.
24
5. CALCULATED VESSEL THERMAL RESPONSE
The results presented in this section show the temperature history of a few selected locations in the model (nodes; see Figure 3) which represent the lower head and debris material. For this study, we are mainly interested in the spatial thermal response of the lower head for the six cases described at the outset.
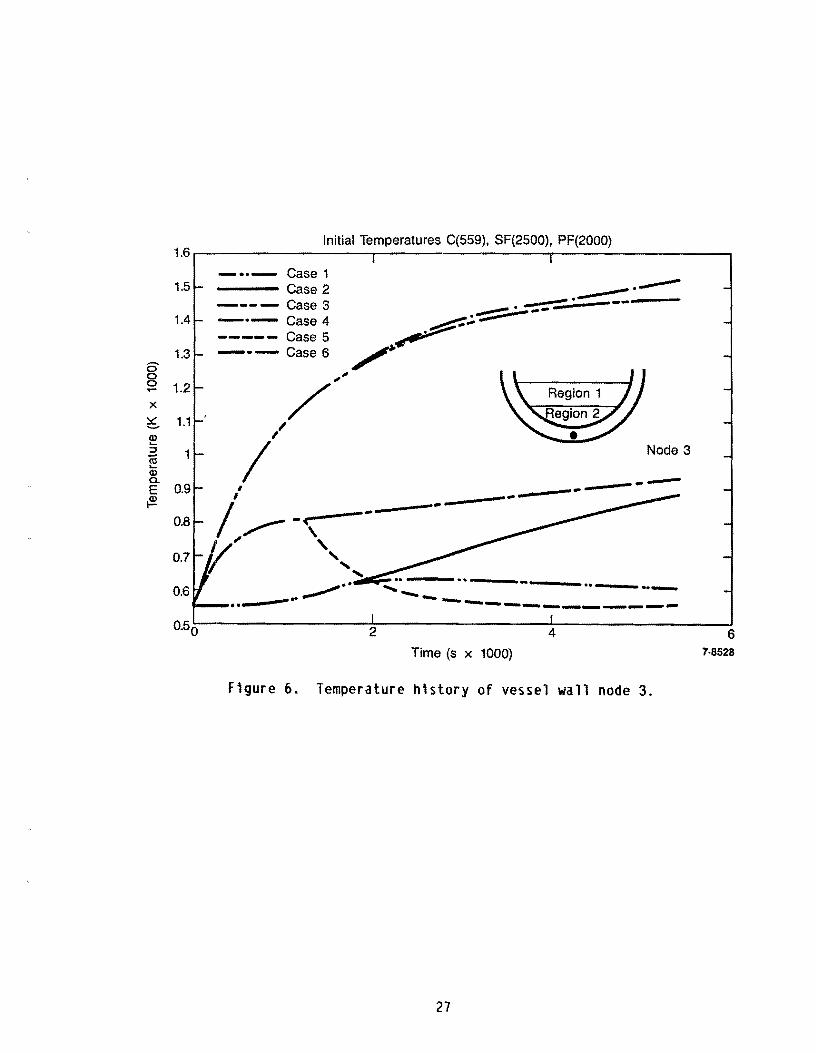
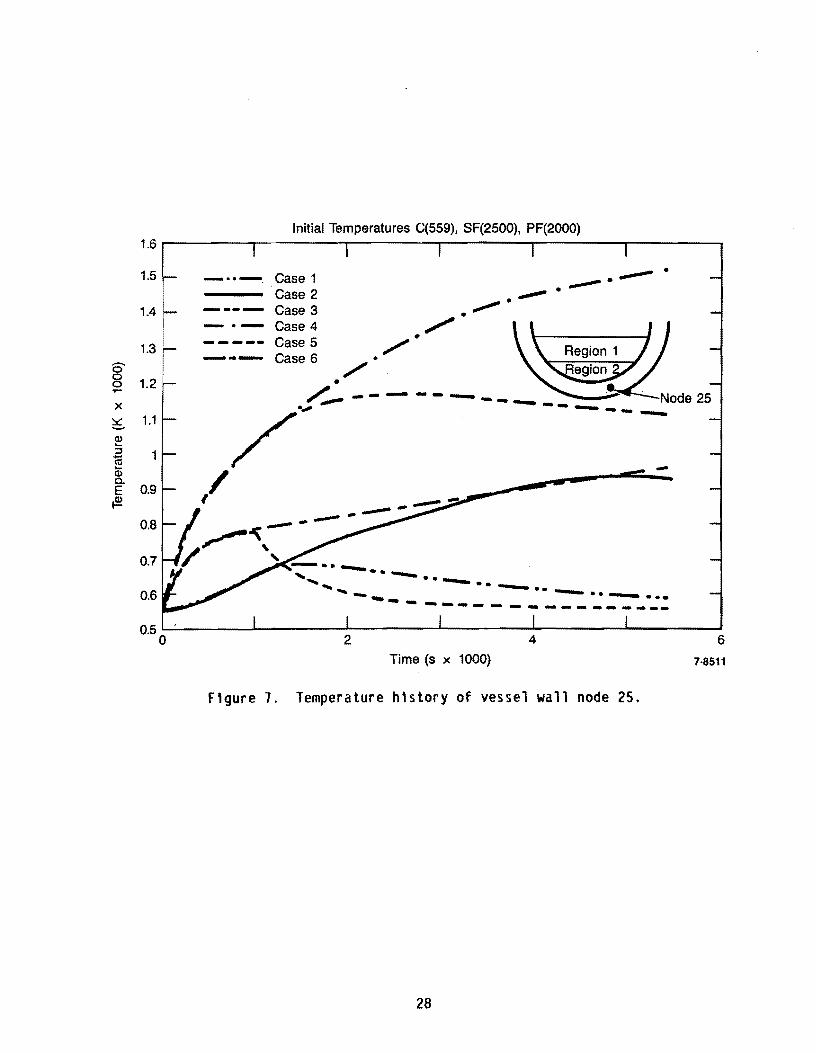
Figures 6, 7, 8, and 9 depict the temperature history of nodes 3, 25,
42, and 63 (see Figure 3 for node locations) for the six cases considered in this study. Nodes 3, 25, 42, and 63 represent four locations in the reactor vessel lower head of the TMI-2 reactor. Node 3 is located at the very bottom of the reactor at the midplane of the vessel wall. Node 42 represents a location in the midplane of the vessel wall adjacent to the location where the control rod material, the porous debris material, and the vessel wall coincide. Node 25 represents a vessel wall location approximately halfway between nodes 3 and 42. Node 63 represents a vessel wall location between node 42 and the upper surface of the debris.
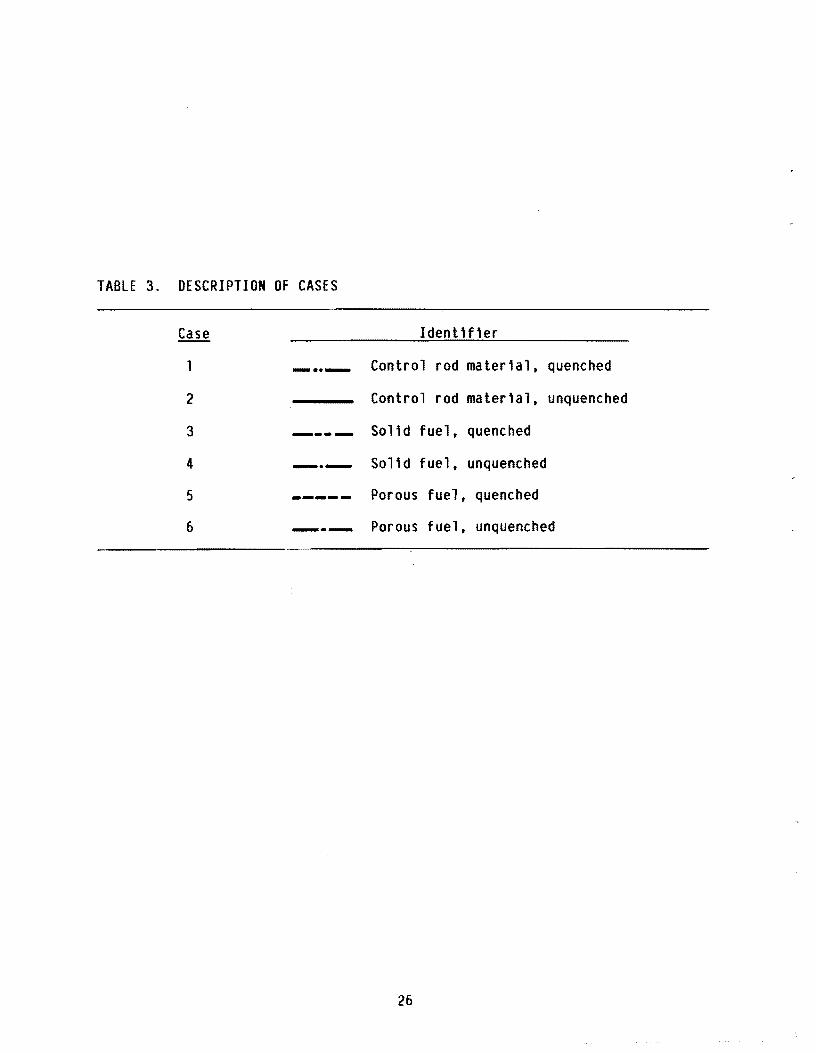
Use Table 3 to identify each case presented in the figures. The identifier quenched or unquenched refers to the debris material lying above the solid layer of material, except for Cases 5 and 6 where we have all porous material. For Case 5. all the porous material is assumed to quench
in 20 min.
The nomenclature at the top of each figure identifies the initial temperature of the various materials. The control rod material is assumed to have an initial temperature of 559 K [C(559)], the solid fuel material an initial temperature of 2500 K [SF(2500)]. and the porous material for
Cases 5 and 6 an initial temperature of 2000 K [PF(2000)]. The porous debris material lying on top of the solid layer for Cases 1. 2, 3. and 4 is
assumed to have an initial temperature of 2500 K.
As previously shown, vessel wall failure at high internal pressures is predicted to occur within minutes (owing to creep rupture) when the average vessel wall temperature exceeds 1100 K. Carbon steel (vessel wall
, 25
1
2
3
4
5
TABLE 3. DESCRIPTION OF CASES
Case Ident H1er
- ..- Control rod mater1al. quenched
Control rod mater1al, unquenched
quenched---- So'1d fuel.
--- So11d fuel, unquenched
------ Porous fuel, quenched
£> --- Porous fuel, unquenched
26
x
Initial Temperatures C(559), SF(2500), PF(2000) 1.6r-----------------~------------------T_----------------~
- •• - Case 1 1.5 ---- Case 2 _ ._-_-::----.---_
---- Case 3 _.- Case 4 ~.-:;::::::-:--------- Case 5 """"'~~ .....
1.4
1.3 --- Case 6 , is o ~ 1.2 /"~ 1.1
Node 3
,/ /
------/ I
~ 0.8
1/' "" _.. .. ..- ~
Q50~-----------------=2------------------~4----------------~6
Time (s x 1000) 7·8528
Figure 6. Temperature history of vessel wall node 3.
-------_... -- -~-\---------------
--- .._- -- .. -----------
27
1.6
1.5
1.4 L
Initial Temperatures C(559). SF(2500). PF(2000)
• _ •• -, Case 1 ___ • --- Case 2 .~.
- .... - Case 3 • """"
=-:-- g:':i ,,;-/ Region~./ Region
/..,.- - - - - - - - _ _ Node 25 /... •
------
- .. -- ...-••-- - ---- -
,I
.. .. - - - .. -2 4 6
Time (s x 1000) 7·8511
Figure 7. Temperature history of vessel wall node 25.
-0 0 0 ..... x
~ G).... :::J Cii.... G) 0. E ~
1.3
1.2
1.1
1
0.9
0.8
0.7
0.6
0.5 0
28
Initial Temperatures C(559), SF(2500). PF(2000) 1.2..-------------,r------------r-------------,
."",....,.. . _ •• - Case 1 ~. ---Case 2
1.1 ---- Case 3 _.- Case 4 ---- Case 5 _ .. - Case 61
6' 0 0 ~
x 0.9 ~-Q;).... :::I til... Q;) .. \ E a.
\ \ ~ V
I \:.\.
~ Node 42 -, ......
0.6 ",~",,:-----..:~..-----
~-...---=---.. --=-.~=="I'__=bL:i __
2 4 6 Time (5 x 1000) 7·8525
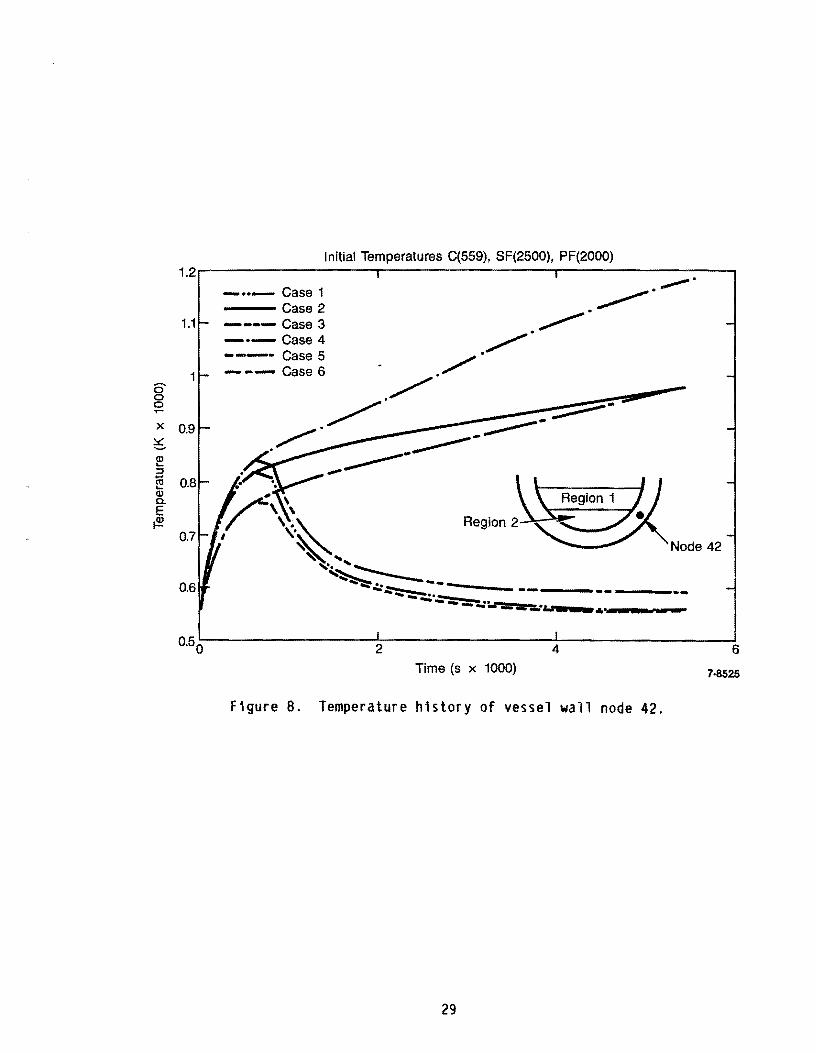
Figure 8. Temperature history of vessel wall node 42.
29
Initial Temp C(559). SF(2500). PF(2000}. 1.1r------------------.------------------~----------------~
_ •• - Cases 1 and 3 Case 2
_.- Case 4 1 ---- Case 5 --- Case 6 .. '
. ---0.9 .. ----0 --- .. ---------0
0,... ".,.,- .x 0.8 tJJ '\ ,/-*-(I)
E / Y. i= .Node 63 0.4 :/\~
f "~~. 0.6 ~ •• _
--~-------"..-- .._--- ----,._-
2 4 6 7·9012Temperature (K x 1000)
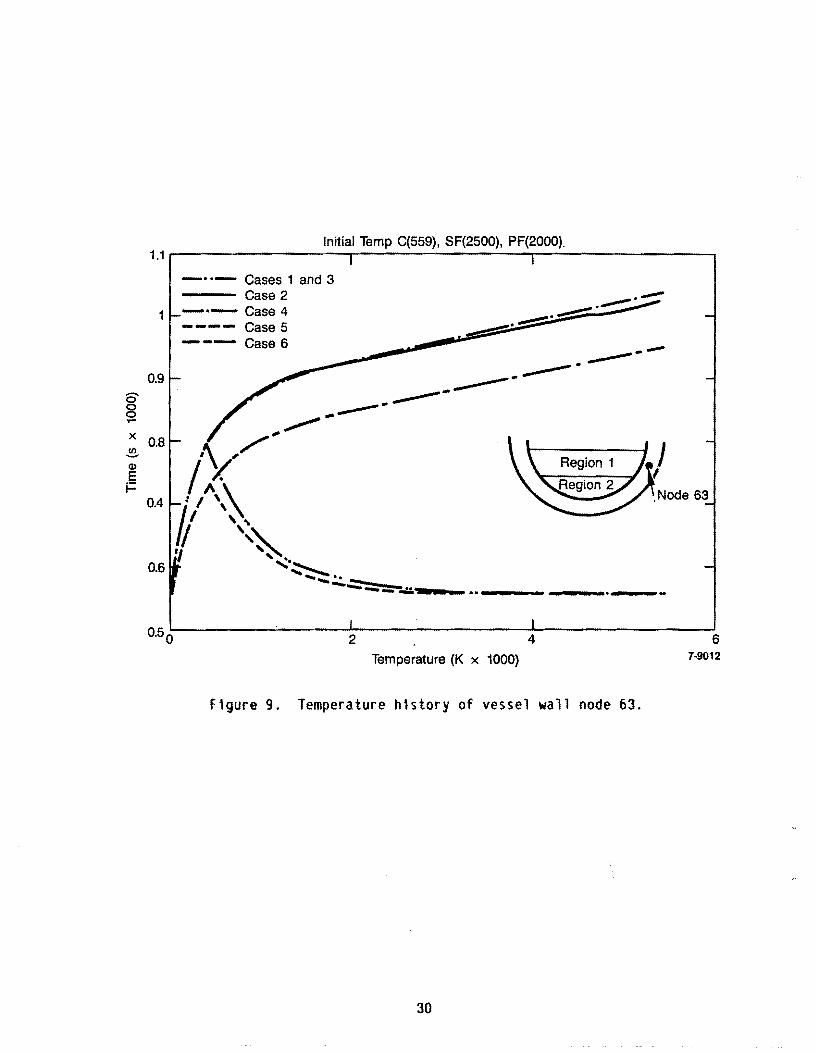
F1gure 9. Temperature h1story of vessel wall node 63.
30
mater1a1) beg1ns to melt around 1650 K; thus, 1t 1s l1kely the reactor vessel wall will fail as a result of creep rupture rather than melting.
For this reason, we have chosen to present mid-wall temperature histor1es,
which are assumed to represent the vessel wall average temperature. At the time peak m1d-wa11 temperatures occur. the temperature prof1le through the
wall 1s approximately 11near; thus. the assumpt10n that the mid-wall temperature represents the average wall temperature 1s reasonable for the scop1ng type ca1culat10n in this report. A table summarizing our analysis of the cases is presented later, wherein the max1mum vessel wall temperature and peak average wall temperature are shown.
For Case 1, we see from Figures 6, 7. 8, and 9 that the lnner vessel wall just below the control rod materlal debris interface (node 42) experlences the hlghest average temperature. Flgure 8 shows the temperature of node 42 rising from 559 K to a peak temperature of 825 K at 680 s into the transient. From that point on. the temperature of node 42
decreases rapidly, owing to the assumed quench of the fuel debris. At
5400 s. the temperature of node 42 has dropped to 560 K. The rapid heatup of node 42 compared to the vessel 10cat10ns beneath the control rod mater1al (nodes 3 and 25) 1s due to the closeness of the high-temperature debris bed (initial temperature 2500). Thus, we clearly see that the peak average vessel wall temperature for an assumed layer of control rod material between the fuel debr1s and vessel is not sufficlent to cause melting or creep rupture of the vessel.
Case 2 (same as Case 1 except no fuel debris quench) shows the peak average vessel wall temperature (node 63) to be at the vessel wall
m1dplane, m1dway between the control rod mater1al debris interface and the top of the debr1s. The temperature is seen to rapidly increase to 896 K by
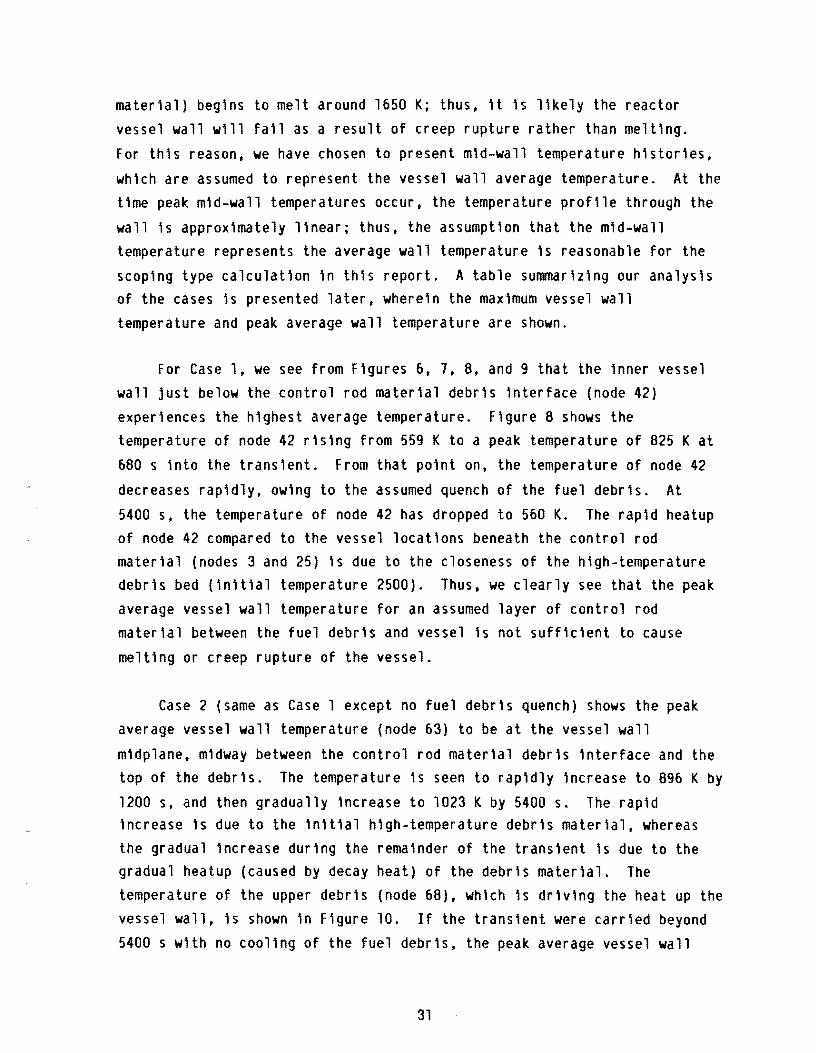
1200 s, and then gradually increase to 1023 Kby 5400 s. The rapid increase is due to the initlal high-temperature debris material, whereas the gradual increase during the remainder of the trans1ent 1s due to the gradual heatup (caused by decay heat) of the debris material. The temperature of the upper debris (node 68). which is driving the heat up the vessel wall, is shown in Figure 10. If the transient were carried beyond 5400 s with no cooling of the fuel debris, the peak average vessel wall
31
Initial Temperatures C(559), SF(2500), PF(2000)
4~----------------~----~----------.-----------~----~
3.5
3
25e'
2
1.5
1
.. W·
2
_.._.------
au
4
Cases 1 and 3 Case 2 Case 4 CaseS Case 6
Time (s x 1000)
S o o.... x
~ ::l
f! Q) a. E ~
6
NJ524
Figure 10. Temperature h'story of debr\s node 68.
32
temperature (node 63) would eventually exceed 1100 K and vessel failure caused by creep rupture would be possible. However, if the debris bed were to quench any time during the 5400 s transient the vessel peak average
temperature (node 63) would immediately start to decrease, as indicated by the Case 1 calculation. Thus, the integrity of the vessel wall is seen to
be a strong function of the fuel debris cooling.
In Case 3, the layer of control rod material is replaced by a layer of
solid heat-generating U-Zr-O ceramic, and the debris layer above the solid
layer is totally quenched 20 min after the start of the transient. For this case, the vessel peak average temperature occurred at the vessel wall midplane located on the reactor centerline (node 3). Figure 6 shows the peak average temperature of node 3 increasing from 559 to 1100 K within 1000 s after the start of the transient. The temperature continues to increase and reaches 1460 K at 5400 s. Using the Larson-Miller criterion,
the reactor vessel is expected to fail at this temperature. The quenching of the upper debris bed has little effect on the calculated vessel temperatures. This is expected, since the vessel location (node 3) is
relatively isolated from the effects of quenching the upper debris material. However, as seen in Figure 7, the quenching of the debris bed has a strong influence on the temperature history at the vessel mid-radius location (node 42).
Case 4 is the same as Case 3, except the debris bed is unquenched during the transient. Figure 6 shows very little difference in the
calculated peak average vessel temperatures (node 3) between cases 3 and 4. Again this is due to the relative isolation of node 3 compared to
nodes 25. 42, and 63. Toward the end of the transient, the temperature of node 3 for the quench case is slightly lower than for the unquenched case.
Cases 5 and 6 correspond to an all porous debris bed at an initial temperature of 2000 K, Case 5 being the quenched case, Case 6 the unquenched case. For the quenched case, node 3 reaches a maximum temperature of 800 K at 1200 s, and steadily decreases to 560 K at the end of the transient. For the unquenched case, node 42 reaches a maximum temperature of 974 K at the end of the 5400 s transient. Thus, a porous
33
unquenched debris bed could reside on the lower head for as long as 5400 s without fear of a lower head failure for the gtven cond1t10ns used 1n th1s analysts.
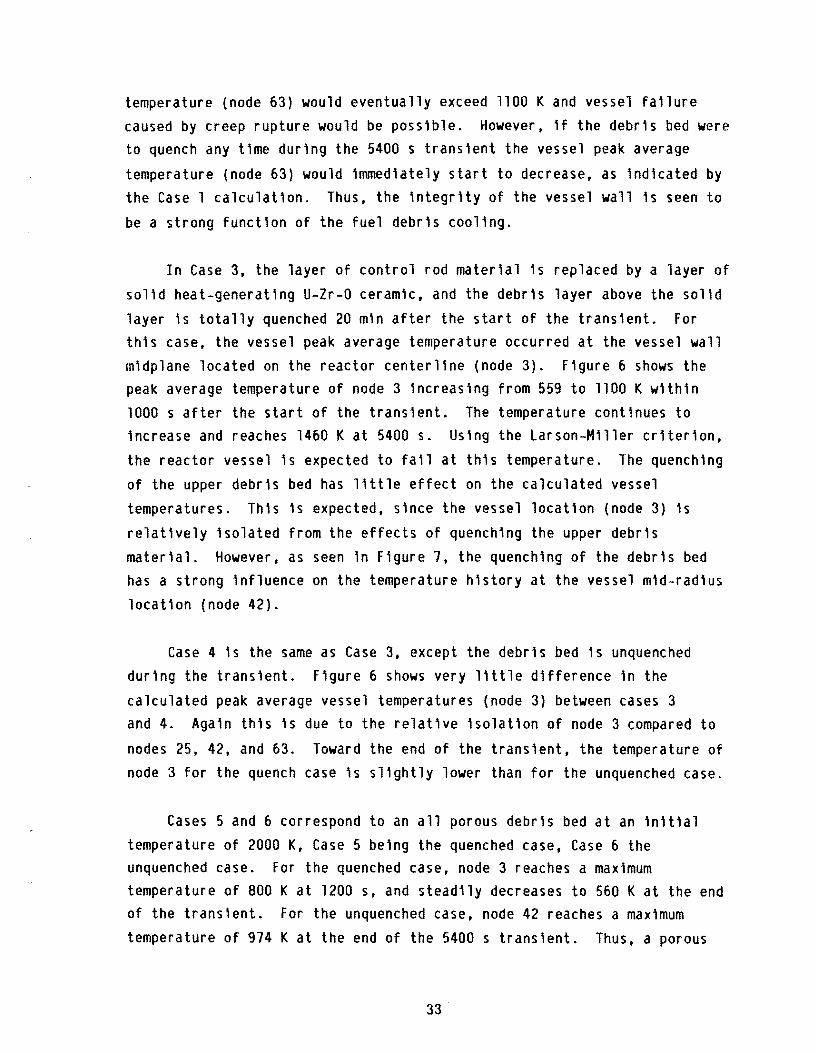
As stated earlier. Figure 10 presents the temperature htstory of node 68. which corresponds to a porous debr1s node (see F1gure 3). Figure 11 shows the temperature htstory of node 38. whtch 1s used to represent the sol1d debr1s materta1. The sharp drop 1n temperature 1n these figures represents the quenching of the node. As ind1cated by the
results presented tn Flgures 10 and 11. the porous debrls regton (unquenched case) and the solld fuel reglon (quenched and unquenched cases)
both experience temperatures that exceed the melttng temperature of U0 2 (-2850 K). thus. a convect1ng molten pool would likely develop. The effects on the results presented 1n this report of a convect1ng molten pool have been neglected for th1s study; however, compar'ng F1gures 6 and 11 we see by the t1me the solid layer of fuel has reached a temperature of 2850 K (-2500 s) the average vessel wall temperature is predicted to be 1340 K. Thus. as indicated by F1gure 5. the vessel wall would probably have fa' led ow1ng to creep rupture long before any molten pool was created. If th1s were not the case. a convecting molten pool would tend to cause the vessel wall to heat up at a more rap1d rate once the pool became highly convect1ve.
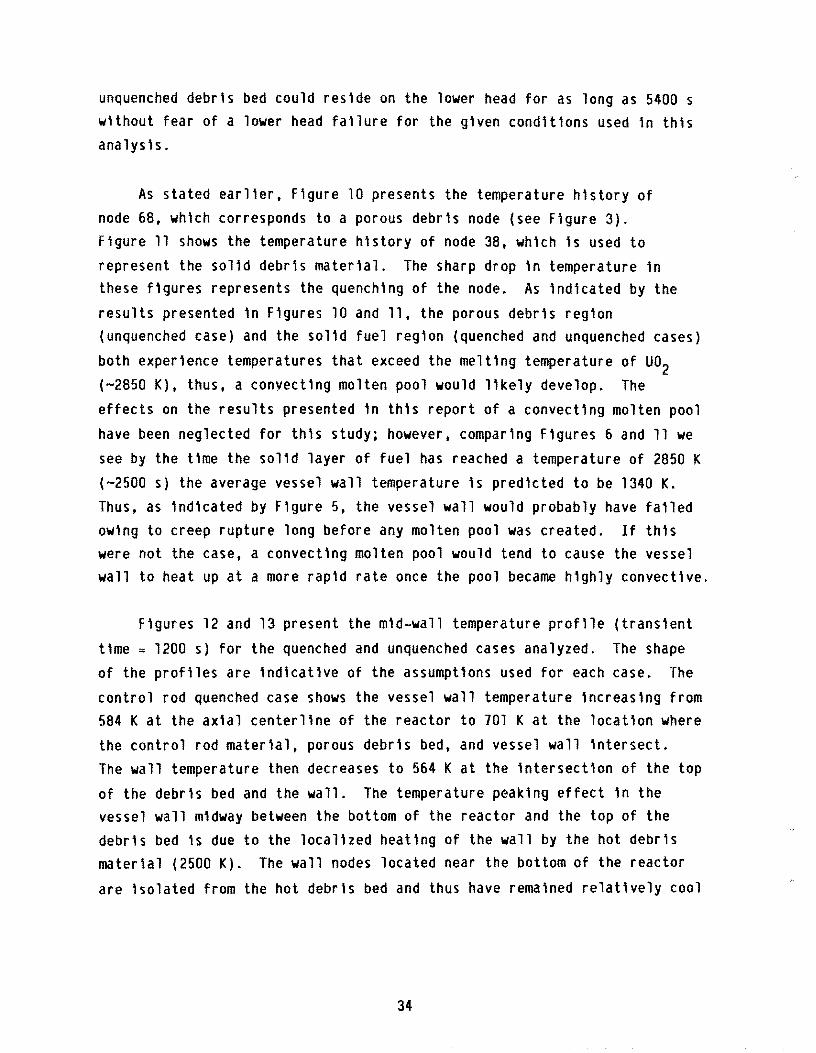
F1gures 12 and 13 present the m1d-wall temperature prof11e (trans1ent
time = 1200 s) for the quenched and unquenched cases analyzed. The shape of the prof11es are 1ndicat1ve of the assumpt10ns used for each case. The
control rod quenched case shows the vessel wall temperature 1ncreasing from 584 Kat the ax1al center11ne of the reactor to 701 Kat the locat10n where the control rod materlal. porous debrls bed, and vessel wall 1ntersect. The wall temperature then decreases to 564 K at the 1ntersect10n of the top of the debr1s bed and the wall. The temperature peaking effect 1n the vessel wall midway between the bottom of the reactor and the top of the debrts bed 1s due to the 10ca11zed heating of the wall by the hot debr1s matertal (2500 K). The wall nodes located near the bottom of the reactor
are isolated from the hot debr1s bed and thus have remained relatively cool
34
3
2.8
2.6
Initial Temperatures C(559), SF(2500), PF(2000) 3A ------- ....----.
~ .. 3.2
.---- ------ .. ------- ..--------.---- ~--... -----==~ ~ ... ~ .. -0
0 ,~ '-. ~-----f~.giOn 20 T"" -~ .....X
Node 38 , _ •• _ Case 1--___- __ _\ ~--e(I) 1.8 .... , Case 2 ---- :::l
, ---- Case 37a 1.6.... (I) , _._ Case 4 a. 1A , _____ Case 5E ~ , --- Case 61.2 ,
0.8 ··--"K.._L -.... ... •• :.:.:a0.6 --------------- -_ ...... OAO 2 4 6
Time (s x 1000) 7·8527
f1gure 11. Temperature h1story of so11d layer node 38.
35
Initial Temperatures C(S59), SF(2500) PF(2000) 1.2 ,....----,----,----,---,----,----,....--.......,.--.....,---.....,.----,
----.......... ............1.1 ........,
~~\-0 1
0 0
x 0.9 ~-~ \::I
T§ 0.8 ,Q,)
- •• - Case 1 0. .. ~~ ~ ..~~ ..-~ ..~\/E ---- Case 3 ~ .... ,",,:,c __ ... ------ Case 5 0.7 ""'" .......... .., ... ~...- ....... ... ......... ..~ ........,......0.6 .. .."."",,- . ... ~............--0.5 '---_---''--__''--__''--__-'--__-'--__:"'-__-'--__--'--__-'--__....J
o '0.2 0.4 0.6 0.8 1 1.4 1.6 1.8 2.0
Distance (m) 7·8512
Figure 12. M'd-wall temperature profile at 1200 s 1nto the trans1ent (quenched cases).
36
1.2r-----r-----r-----r-----r-----r-----r-----r-----r-----r-~
1.1
1 s o o,... x 0.9 ~ ~ ::::Ie 0.8 (l) a. E ~
0.7
-~-__
0.61--_---
---
Distance (m)
F\gure 13. M\d-wa11 temperature prof11e at 1200 s \nto the trans1ent (quenched cases).
37
7-8526
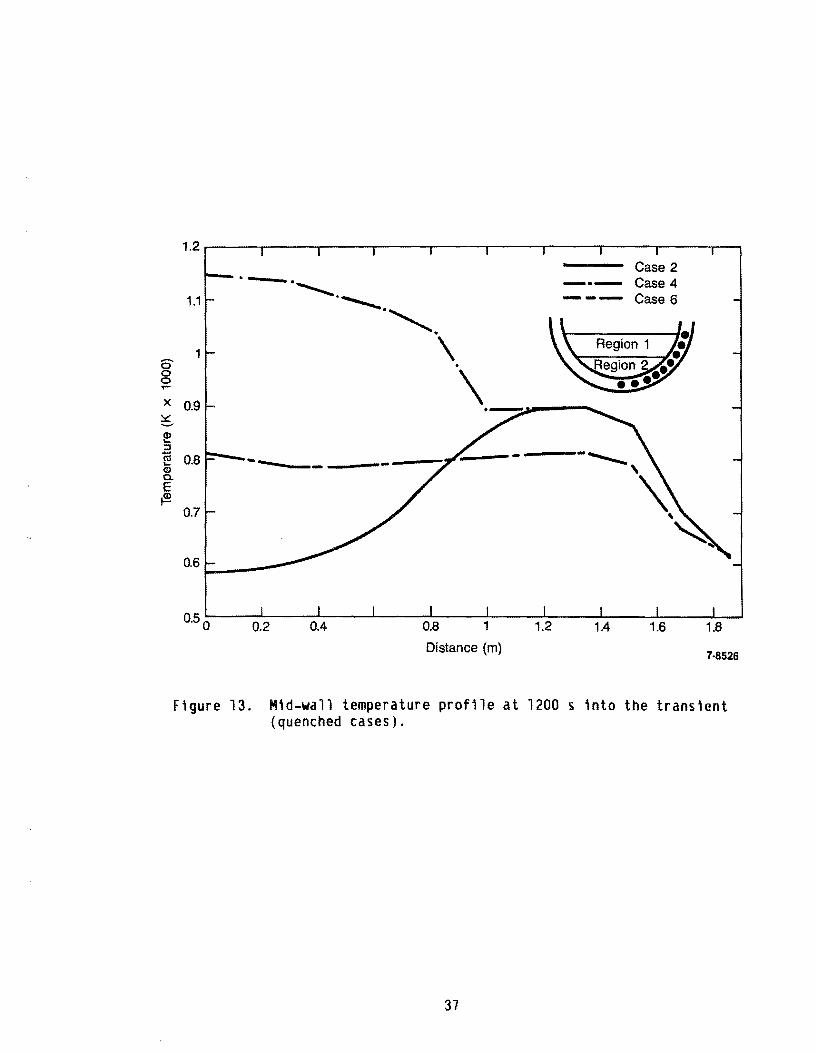
durlng this per10d. The wall nodal temperature near the top of the debr1s bed has been 1nf1uenced by the quenching actlon in the debris bed and 1S
thus cooler, as 1ndicated by the wall temperature prof11e.
The temperature profile for the so11d fuel case shows a max1mum wall temperature of 1148 K (1200 s) at the bottom of the reactor. The temperature 1n the wall then decreases to -1000 K at the 1ntersect of the wall w1th the porous debr1s bed and so11d fuel mater1al. The wall temperature then decreases sharply to 100 K. This sharp decrease 1n wall
temperature is due to the reduced heat transfer from the porous debrls bed to the wall as compared to the heat transfer from the so11d fuel materla1 to the wall. The thermal conduct1v1ty of the porous bed ls less than that of the so11d fuel ow1ng to the steam-f111ed void ln the porous mater1a1. Steam has a thermal conductivity value of -0.14 w/m-k compared to -6.0 w/m-k for the so11d fuel reg10n; thus, the transfer of heat from the
debr1s bed to the vessel wall wl1l be less that from the so11d reg10n to the wall, result1ng in the temperature gradient shown 1n F1gure 12. An add1t10nal effect on the prof11e 1s the quench1ng of the debr1s bed, wh1ch
w1ll result 1n cooler wall temperatures toward the top of the debr1s bed.
The all-porous debr1s bed case w1th quenching shows a maxlmum wall temperature of 809 K (1200 s) at the bottom of the reactor. The wall temperature decreases unlform1y to 566 K at the top of the debris bed.
This decrease 1s due to the quench1ng of the debris bed.
F1gure 13 presents the same type of results for the unquenched cases. The decrease 1n wall temperature toward the top of the debr1s bed for all cases is due to assuming a quenched condit1on along the top of the debr1s bed. A summary of results presented 1n Figures 6 through 13, lnclud1ng
maximum vessel wall temperatures, are presented \n Table 4. The results \n Table 4 show some meltlng (T wall >1650 K) of the lnner vessel wall will occur lf consolldated (lnterna1 heat generat1ng) debris forms adjacent to the vessel wall. The meltlng of the inner wall occurs late in the
trans1ent (~3000 s) resulting in the vessel wall being 30% molten at the
38
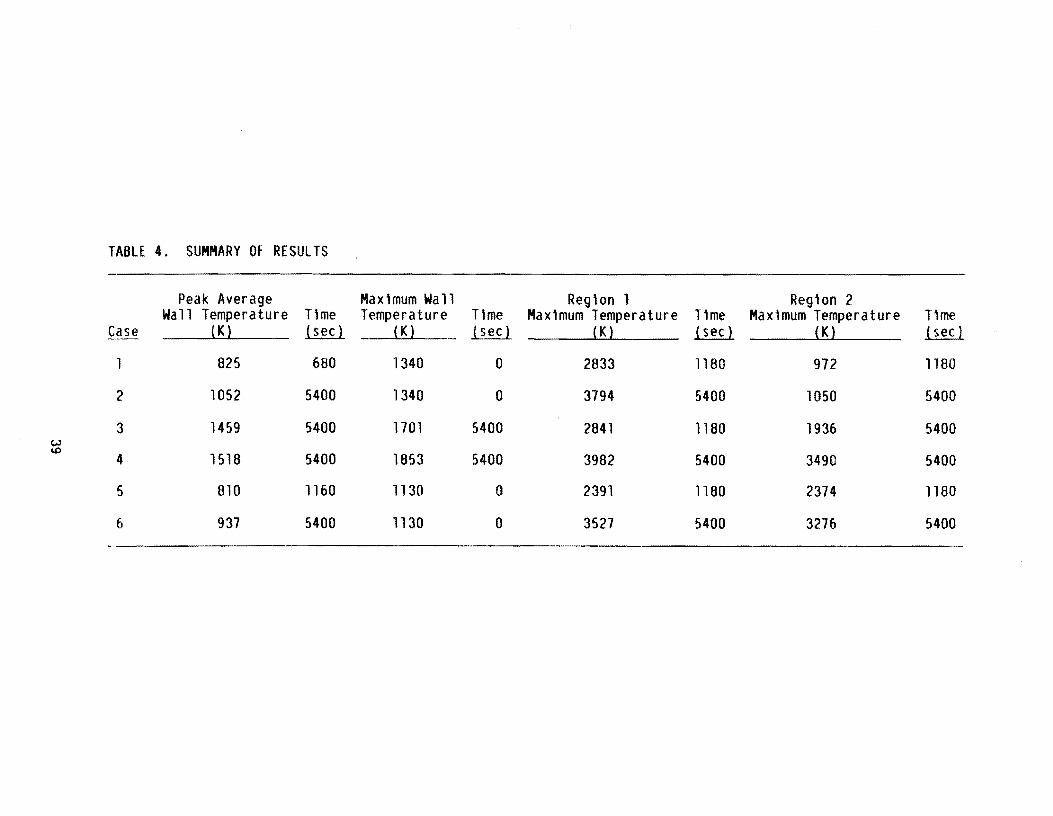
TABLE 4. SUMMARY OF RESULTS
Peak Average Max lmum Wa 11 Reglon 1 Reglon 2 Wall Temperature Tlme Temperature Tlme Maxlmum Temperature Tlme Maximum Temperature Tlme
~ill~ (K) .llitl (K) .llitl (K) .llitl (K) .llitl
825 680 1340 0 2833 1180 972 1180
2 1052 5400 1340 0 3794 5400 1050 5400
3 1459 5400 1701 5400 2841 1180 1936 5400 (.,.) I.P
4 1518 5400 1853 5400 3982 5400 3490 5400
5 810 1160 1130 0 2391 1180 2374 1180
6 937 5400 1130 0 3527 5400 3276 5400

end of the transient (5400 s) for the most severe case. Case 4. If a high 1nternal pressure is present. the vessel wall will likely fail. owing to creep rupture long before failure caused by a melt-through.
40
6. CONCLUSIONS AND RECOMMENDATIONS
The thermal response of the TMI-2 lower reactor vessel has been analyzed for three assumed lower plenum degraded core material configurations, i.e., (a) a porous debris bed resting on the vessel head,
(b) a debris bed resting on top of approximately 8 inches of consolidated molten fuel adjacent to the vessel, and (c) a porous debris bed resting on
top of approximately 8 inches of assumed control rod material adjacent to the vessel. For each configuration, the vessel thermal response was
calculated assuming the debris was both coolable and noncoolable.
The calculations show a wide range of vessel thermal response is
possible based on the debris configuration and debris cooling assumptions.
Vessel melting temperatures were predicted for two of the cases (cases 3
and 4); however, for the relatively short transient (5400 s) very little
melting was predicted. The most rapid heatup (resulting in the highest
vessel wall temperatures) occurred for the case with assumed consolidated fuel adjacent to the vessel wall. For this case, temperatures in excess of 1100 K were achieved in less than 20 minutes and these temperatures are expected to have resulted in creep rupture during the first hour after the major core relocation. Cooling of the porous debris resting on top of the consolidated molten material had little effect on the maximum vessel temperatures for this case.
The calculations show that for a porous debris bed, vessel wall temperatures would have been sufficiently low that creep rupture of the vessel would not be expected. In addition, a layer of control rod material
adjacent to the vessel wall does provide an effective insulation to the wall at locations away from the wall/fuel debris interface.
The analysis results show that the configuration of the degraded core
material is crucial in estimating the vessel thermal response and ultimately the margin to failure of the vessel through mechanical analysis. The results show clearly that the configuration of the lower vessel debris material must be characterized, particularly the extent of both the loose, porous debris and the consolidated lava-like material.
41
Careful visual examination of the lower plenum debris should be obtained during defue1ing to provide suff1cient detail to define the extent of the debris vs consolidated material. In addition. samples similar to the grab samples acquired from the upper core debris bed18 should be acquired at each lower plenum inspection location (fuel assembly locations D4, D12. K9. N5 and N12) to characterize the debris material (particle size distribution, material composition and retained fission products) at several different axial locations. Several samples of consolidated material are necessary to characterize material composition and retained
fission products versus material location.
42
7. REFERENCES
1. J. P. Adams and R. P. Smith, TMI-2 Lower Plenum Video Data Summary,EGG-TMI-7429, July 1987.
2. A. Cronenberg et al., Assessment of Oamage Potential to the TMI-2 Lower Head Due to Thermal Attack by Core Debris, EGG-TMI-7222. June 1986.
3. E. L. Tolman et al., TMI-2 Accident Scenario Update, EGG-TMI-7489, December 1986.
4. P. Kuan, Core Relocation in the TMI-2 Accident, EGG-TMI-7402. November 1986.
5. E. L. Tolman et al .• TMI-2 Core Bore Acquisition Summary Report,EGG-TMI-7385, September 1986.
6. R. Rainisch, Gamma Scanning of In-Core Detectors, TMI-2 Technical Planning Bulletin, April 23, 1985.
7. R. Rainisch, Analysis of Gamma Scanning of In-Core Detector No. 18 L-ll in Lower Reactor Vessel Head, GPU Nuclear Report TPO/TMI-175, June 1985.
8. L. Baker, Jr., et al., Postaccident Heat Removal Technology, ANL/RAS77-2, January 1977.
9. E. C. Lemmon, COUPLE/FLUID, A Two-Dimensional Finite Element Thermal Conduction and Advection Code, EGG Internal Technical ReportISD-SCD-80-1, february 1980.
10. E. C. Lemmon, IIMultidimensional Integral Phase Change Approximationsfor Finite Element Conduction Codes," Numerical Methods in Heat Transfer, John Wiley &Sons, p. 201-213. 1981.
11. P. Kuan. TMI-2 Upper-Core Particle Bed Thermal Behavior, EGG-TMI-7757. to be published.
12. "MATPRO-Version 11 (Revision 1), A Handbook of Material Properties for Use in the Analysis of Light Water Reactor Fuel Rod Behavior," NUREG/CR-0947, TREE-1280, Rev. 1 (1980).
13. J. E. Kelly, J. T Nitchevek, and M. L. Schway, IIHeat Transfer Characteristic of Dry Porous Particular Beds with Internal Heat Generation," Proc. of ASME/JSME Thermal Engineering Joint Conference, Honolulu, Hawaii, Vol. 4, p. 13 (1974).
14. S. Imura and E. Takegoshi, "Effect of Gas Pressure on the Effective Thermal Conductivity of Pack Beds," Heat Transfer Japanese Research, Vol. 3, No.4, p. 13, (1974).
43
15. D. Vortmeyer. IIRad1at1on 1 n Packed So11ds. II 6th Int. Heat Trans. Conf. Toronto. Canada. (1978).
16. W. J. Camp. MElPROG-PWR/MUDO: A Mechan1st1c Code for Ana1ys1s of Reactor Core Melt Progress1on and Vessel Attack under Severe Acc1dent Cond1t10ns. SAND85-023.
17. P. Kuan. TMI-2 Core Debr1s Bed Coo1ab111ty. EGG-TMI-7140. March 1986.
18. D. Akers et a1 .• TMI-2 Core Debr1s Grab Samp1es--Exam1nat10n and Analys1s (Part 1). GEND-INF-075. September 1986.
44