Title- Performance of Malaysian Real Estate Investment ... · PDF file1 Title- Performance of...
25
1 Title- Performance of Malaysian Real Estate Investment Trusts: Evidence from the first six M-REITS Writers: Rubi Ahmad and Chin Yuen Hin ABSTRACT This chapter covers the growth and past performance of the first six Malaysian Real Estate Investment Trusts or M-REITS in the early years of their development. The REITs investment sector of Malaysia has grown tremendously from only six in 2005 to 16 by the end of 2012. M-REITs are increasingly popular among Malaysian investors due to their attractive returns. This chapter analyses the market performance of the first six listed M-REITs relative to the Kuala Lumpur Composite Index (KLCI) and the Kuala Lumpur Property Index (PI) from 1990 to 2006. It is hoped that the analysis will enhance readers’ knowledge on the attractiveness of M-REITs as an alternative investment possibility that also helps with protection against inflation. I Introduction This chapter begins with a brief explanation of what Real Estate Investment Trusts (REITs) are as an investment option. Based on the first six Malaysian REITS or M-REITS, namely AmFirst Property Trust (AmFirst), Amanah Harta Tanah PNB (AHP), Amanah Harta Tanah PNB 2 (AHP2), Axis REIT, Starhill REIT and UOA REIT, a chronology of the development of M-REITs and the regulations for them provides a backdrop for the early years of growth in Malaysia. The performance of the first six M-REITS are presented and analysed in terms of financial results followed by examining the risks involved. Comparisons with other alternative investments instruments namely the10-years MGS, the 12-months Fixed Deposit and the dividend earned on Employee Provident Fund (EPF) are then discussed.
Transcript of Title- Performance of Malaysian Real Estate Investment ... · PDF file1 Title- Performance of...

1
Title- Performance of Malaysian Real Estate Investment Trusts: Evidence
from the first six M-REITS
Writers: Rubi Ahmad and Chin Yuen Hin
ABSTRACT
This chapter covers the growth and past performance of the first six
Malaysian Real Estate Investment Trusts or M-REITS in the early years of their
development. The REITs investment sector of Malaysia has grown tremendously
from only six in 2005 to 16 by the end of 2012. M-REITs are increasingly popular
among Malaysian investors due to their attractive returns. This chapter analyses the
market performance of the first six listed M-REITs relative to the Kuala Lumpur
Composite Index (KLCI) and the Kuala Lumpur Property Index (PI) from 1990 to
2006. It is hoped that the analysis will enhance readers’ knowledge on the
attractiveness of M-REITs as an alternative investment possibility that also helps
with protection against inflation.
I Introduction
This chapter begins with a brief explanation of what Real Estate Investment
Trusts (REITs) are as an investment option. Based on the first six Malaysian REITS
or M-REITS, namely AmFirst Property Trust (AmFirst), Amanah Harta Tanah PNB
(AHP), Amanah Harta Tanah PNB 2 (AHP2), Axis REIT, Starhill REIT and UOA
REIT, a chronology of the development of M-REITs and the regulations for them
provides a backdrop for the early years of growth in Malaysia. The performance of
the first six M-REITS are presented and analysed in terms of financial results
followed by examining the risks involved. Comparisons with other alternative
investments instruments namely the10-years MGS, the 12-months Fixed Deposit
and the dividend earned on Employee Provident Fund (EPF) are then discussed.
2
II What are REITs in Malaysia?
First, there is no single definition of a REIT because REITs differ from country
to country in terms of dividend distribution, taxation structure, borrowing limits,
ownership and other requirements. The basic mechanism of REITs is however
similar across countries. Generally, REIT is an investment company that invests
funds raised from investors in real estate such as office buildings, resorts, hotels,
shopping complexes, apartments and other real estate-related assets. Shares of
REITS companies are traded in the stock exchanges and they are less risky than
share. Hence, REITs allow investors to own a property indirectly through the
purchase of shares of REITs. As in the cased of Malaysian unit trusts that were
introduced to Malaysian investors in the early 1980s, the creation of property
portfolio in REITs provides investors with a greater opportunity to achieve desirable
combinations of risks and returns. The holders of REITs earn returns in the form of
capital gain or price appreciation, and annual distributions from investment incomes
usually from space rental. A REIT distributes all or almost all of its net income to
investors at certain intervals, for example annually, to enable investors to benefit
from tax exemptions. Hence, one of the advantages of REITs over ordinary shares is
that their investors are assured of certain amount of annual income streams.
Figure 1 below shows the structure of M-REITs which is similar to the
organization structure of unit trust funds and hence, M-REITs are governed by
Securities Commission of Malaysia (SC) which is a statutory body that investigate
and enforce power under the Securities Commission Act 1993. The Board of Director
appoints experienced real estate professionals as the management team of REITs to
manage the investment and operations of REITs. Appointments of the management
team, headed by a registered valuer, the Board members and the Investment
Committee must get Securities Commission’s approval.

3
Figure 1: Structure of Malaysian REITs.
Source: Phuah (2005).
III. Launch and Growth of M-REITs
The history of M-REITs dates back to 1989 when the Property Trust
Guidelines (PTG) was issued to provide a framework for the establishment of
property trust funds in Malaysia. Malaysia was the first country in Asia to establish a
legal and regulatory framework for property trusts.
Table 1 below shows the chronology of events for the development of M-REITs
regulation till 2005.
Table 1: Chronology of events for the development of M-REITs regulation.
DATE DESCRIPTIONS
1986 - Regulatory framework for listed property trusts was approved by the Central Bank of Malaysia (with the principal legislation being the Companies Act 1965 and Securities Industry Act 1983).
1989 - Property Trust Guidelines (PTG) was issued to provide a framework for the establishment of property trust funds in Malaysia.
October, 1991 - Developed Specific Securities Commission guidelines for property trust funds.
4
June 16, 1995 - Guidelines on Property Trust Funds (1st
Edition)
October, 2001 - In Budget 2002, Minister of Finance advocated the establishment of REITs to facilitate corporate restructuring efforts.
November 13, 2002 - Guidelines on Property Trust Funds (2nd
Edition)
Jan 3, 2005 - Guidelines on Real Estate Investment Trusts (REITs) (3
rd Edition)
September 30, 2005 - In Budget 2006, Minister of Finance proposed to allow tax deductions on legal, valuation and consultancy expenses incurred in the establishment of REITs.
November 21, 2005 - Guidelines for Islamic Real Estate Investment Trusts
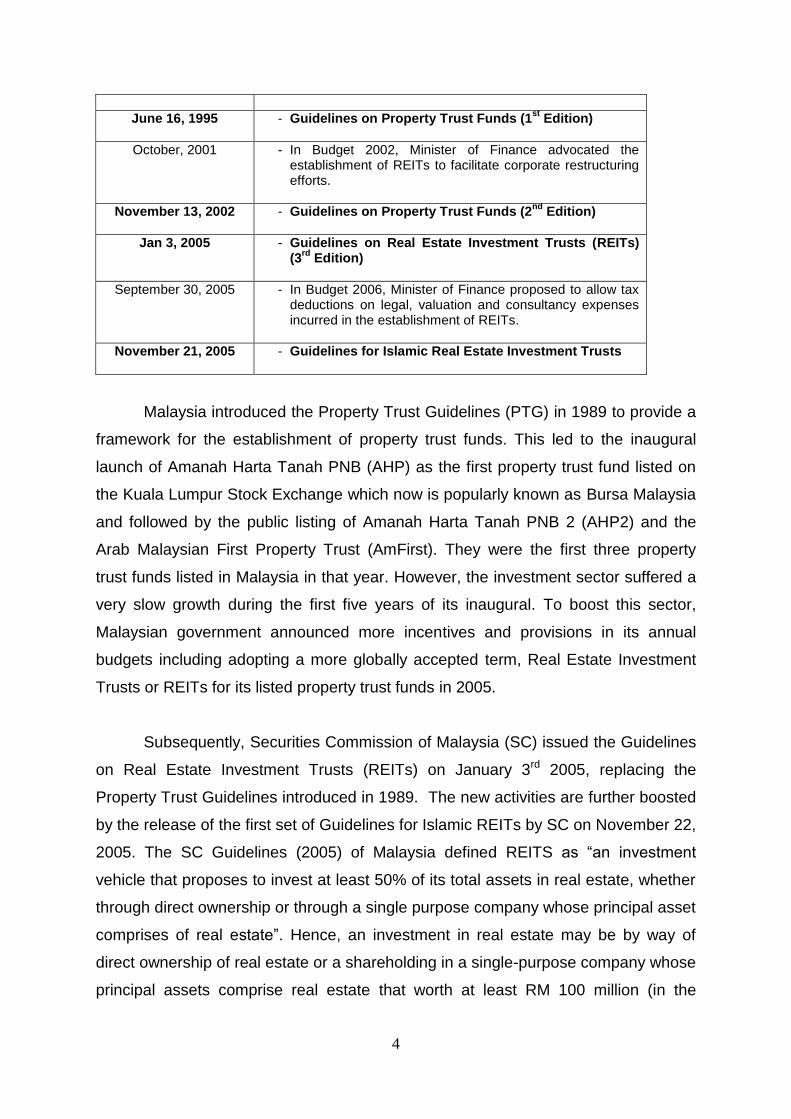
Malaysia introduced the Property Trust Guidelines (PTG) in 1989 to provide a
framework for the establishment of property trust funds. This led to the inaugural
launch of Amanah Harta Tanah PNB (AHP) as the first property trust fund listed on
the Kuala Lumpur Stock Exchange which now is popularly known as Bursa Malaysia
and followed by the public listing of Amanah Harta Tanah PNB 2 (AHP2) and the
Arab Malaysian First Property Trust (AmFirst). They were the first three property
trust funds listed in Malaysia in that year. However, the investment sector suffered a
very slow growth during the first five years of its inaugural. To boost this sector,
Malaysian government announced more incentives and provisions in its annual
budgets including adopting a more globally accepted term, Real Estate Investment
Trusts or REITs for its listed property trust funds in 2005.
Subsequently, Securities Commission of Malaysia (SC) issued the Guidelines
on Real Estate Investment Trusts (REITs) on January 3rd 2005, replacing the
Property Trust Guidelines introduced in 1989. The new activities are further boosted
by the release of the first set of Guidelines for Islamic REITs by SC on November 22,
2005. The SC Guidelines (2005) of Malaysia defined REITS as “an investment
vehicle that proposes to invest at least 50% of its total assets in real estate, whether
through direct ownership or through a single purpose company whose principal asset
comprises of real estate”. Hence, an investment in real estate may be by way of
direct ownership of real estate or a shareholding in a single-purpose company whose
principal assets comprise real estate that worth at least RM 100 million (in the

5
Malaysian context), In Malaysia, there is no restriction regarding the minimum
distribution of dividend. The relaxation of tax and deregulation have helped the
introduction of REITs in the Malaysian capital market.
In response to the new guidelines, Axis REIT was launched as the first official
REIT listed on Bursa Malaysia in August 2005, followed by the listing of Starhill REIT
and UOA REIT in December 2005. Unlike the first three property trusts (AHP, AHP2
and AmFirst) which we named as “old versions” of M-REITS launched in 1989, the
initial public offer of Axis REIT, Starhill REIT and UOA REIT had attracted so much
attention from investors, fund managers, multinational companies, government
agencies and financial institutions. Hence, unlike the first three property trusts, these
three “newer versions” M-REITs led to higher institutional investor participation in the
M-REITs market in the following years.
Among the major factors that constrained the initial development and growth
of the industry in 1990s were capital market requirements in capital raising, a
restrictive SC’s Guidelines on Property Trust Funds issued in 1995 and the low
participation from the institutional investors. In other words, the potential of listed
property trusts in Malaysia was not fully realized due to the unfavorable risk-adjusted
performance over 1991-2000. It was reported that an average of only 4% of listed
property trust units was held by institutional investors over 1990-1999 while in 2005
onwards, they represent the majority shareholders of M-REITs as evident in Table 2.
The institutional investors held between 28.5% and 52.1% of the total shares of M-
REITs listed on Bursa Malaysia while the parent company (except for AHP and
AHP2) held between 46.8% and 65.8% in 2005.
In addition, the attractiveness of REITs also depends on its tax transparency
status. Tax transparency is defined as an entity which is not taxed either in
representative capacity or in its own capacity as a tax paying entity. Initially, the
status of tax transparency in Malaysia was not as attractive as compared to
Singapore, where there was total tax exemption for income distributions by REITs.
Table 3 below shows the comparison of M-REITs and Singapore-REITs (S-REITs) in
2005.

6
Table 2: Breakdown of shareholdings for M-REITs.
No. M-REITs Percentage Shareholding By:
Parent Company
Institutional Investors
Public Investors
1. AmFirst* 46.8% (64,802,025 units)
N/A N/A
2. AHP* 3.4% (3,428,400 units)
52.1% (52,057,775 units)
44.5% (44,513,825 units)
3. AHP2** 13.1% (13,917,200 units)
30.0% (31,822,110 units)
56.9% 60,297,690 units)
4. Axis REIT*** 52.2% (107,501,000 units)
39.5% (81,400,000 units)
8.3% (17,000,000 units)
5. Starhill REIT*** 51% (530,401,000 units)
46.1% (479,600,000 units)
2.9% (29,999,000 units)
6. UOA REIT*** 65.8% (150,000,000 units)
28.5% (65,000,000 units)
5.7% (13,000,000 units)
* Based on Annual Report ending December 2005. ** Based on Annual Report ending June 2005. *** Based on IPO data respectively.
Table 3: Tax treatment of M-REITs and S-REITs.
Tax Treatment M-REITs S-REITs
Residents - Taxed at unit-holders’ tax rates.
- Total tax exemption.
Non-residents - Withholding tax at 28%. - Withholding tax at 10%.
Source: Foong (2005).
IV. Recent Developments of M-REITs in 2011-2012
From only six M-REITs listed on Bursa Malaysia in 2005, the number rose to sixteen
in 2012. At the end of December 2011 Malaysians saw the 14th and only premium
REIT in Malaysia, the Pavilion REIT, listed on the Main Board of Bursa Malaysia,
which in its real estate portfolio includes the iconic Pavilion KL. Two new M-REITs
were listed in the following year including the IGB Real Estate Investment Trust (IGB
REIT) which saw its share price rising 11.2 percent above its initial public offering
(IPO) price of RM1.25 on its first day of listing. Between September 2011 and 2012,
the total market capitalization for M-REITs grew from RM11.3 billion to RM24.3
billion while its weighted average Net Asset Value (NAV) rose from RM 1.18 per
share from RM 1.17. It was reported that the weighted average dividends paid to the
investors in 2012 was 8.12 cents while the total returns (capital gains plus dividends)
from M-REITs recorded a weighted average of 27.3 percent. This showed that most
M-REITs investors enjoyed very high returns in 2012. As of 30 November 2012, the
total combined market capitalization of M-REITs was RM24.1 billion which was the

7
fourth largest REITs in the Asia Pacific region in that year. Table 4 gives the list of M-
REITs together with some key indicators for each of them as at the end of 2012.

8
Table 4: Details of current M-REITs as at the end of 2012
V The Return-Risk Performance of the First Six M-REITs from 1990-2006.
For the purpose of in-depth analysis to provide better insights and
understanding of the performance of M-REITs, this section provides detailed
financial data on the overall performance of the six listed M-REITs during their initial
years from 1990 to March 2006. The six M-REITs were AmFirst, AHP, AHP2, Axis
REIT, Starhill REIT and UOA REIT. The scope of the investigation was made
covering a period from the listing of the first M-REIT, which was Amanah Harta
Tanah PNB (AHP) to the listing of UOA REIT on March 31, 2005. Table 5 shows the
market information of these six M-REITs as of December 2005.
REIT Period DPU (sen) Price (RM) Yield NAV (RM) Assets Type
AmanahRaya Q3 – Dec12 1.7890 0.925 7.736% 1.0490 Retail
Tower 2H – Dec12 6.0400 1.510 7.629% 1.8252 Office
AmFirst 1H – Sep12 3.1600 1.060 7.538% 1.2075 Office
Axis Q4 -Dec12 5.6000 3.110 7.203% 2.1679 Office
UOA 2H – Dec12 4.9500 1.380 7.174% 1.4976 Office
Quill Capita 2H – Dec12 4.1000 1.200 7.133% 1.3128 Office
Hektar Q4 – Dec12 2.6000 1.470 7.075% 1.4700 Retail
Atrium Q4 -Dec12 2.2000 1.270 6.929% 1.2373 Industrial
Starhill 1H – Dec12 3.5873 1.130 6.349% 1.1165 Diversified
Al-AQAR Healthcare 2H – Dec12 4.5400 1.340 5.821% 1.1000 Plantation
Sunway Q2 – Dec12 2.1900 1.550 5.652% 1.0964 Diversified
Al-Hadharah 2H – Dec12 5.5000 1.870 5.348% 1.8275 Diversified
Pavilion 2H – Dec12 3.5100 1.480 4.743% 1.0975 Malls
IGB REIT FY12 – IPO 6.3800 1.360 4.691% 1.0247 Malls
CMMT 2H – Dec12 4.2400 1.850 4.584% 1.1547 Malls

9
Table 5: Details of the first 6 M-REITs as at December 2005.
No.
M-REITs Date of
Listing
Offer
Price
(RM)
Price as
at March
31, 2006
(RM)
No. of Shares
(Units)
Market
Capitalization
(RM)
1. AmFirst 28-Sep-89 1.00 1.30 138,400,225 179,920,293
2. AHP 28-Dec-90 N/A 0.71 100,000,000 71,000,000
3. AHP2 25-Mar-97 N/A 0.41 106,037,000 43,475,170
4. Axis REIT 3-Aug-05 1.25 1.67 205,901,000 343,854,670
5. Starhill REIT 16-Dec-05 0.96 0.97 1,040,000,000 1,008,800,000
6. UOA REIT 30-Dec-05 1.15 1.15 228,000,000 262,200,000
Total = 1,909,250,133
The performance of M-REITs is evaluated using a number of indicators. They
include the total revenue and net income, average return and total return, dividend
yield, and Management Expense Ratio (MER). The Price/NAV ratio shows the
market performance of each M-REIT to determine whether it was traded at a
discount or premium from 2000-2005. The total return earned from an investor’s
viewpoint is the sum of dividends and capital gain or loss from the share value, that
is from an appreciation or a depreciation. Following, the average return of each M-
REIT is compared to Kuala Lumpur Composite Index (KLCI) and Property Index (PI)
to indicate whether it outperformed or underperformed the market during the study
period. The risks measured are annualized standard deviation, Risk-adjusted return
(Sharpe Ratio), Value-at-Risk (VaR), Beta, Alpha and R-squared. In addition, we
used scatter plots, covariance and Pearson correlation coefficient, r to illustrate the
M-REITs’ relationships with the KLCI and the PI to see whether M-REITs behaved
as a stand-alone asset class or similar to how a common stock would.
The comparison was carried out based on the six M-REITs’ dividend yield
from 1991-2005 and their performance relative to other investment assets, namely
the 10-year MGS (Malaysian Government Securities), the 12-month Fixed Deposit
rates of commercial banks, the Employees Provident Fund’s dividend payment and
the inflation rate as per the Consumer Price Index. The main data used for analysis
was the historical data of all the daily M-REITs’ stock price, KLCI and PI obtained
from Perfect Analysis online database.i

10
Total Revenue and Net Income
The total revenue and net income data of M-REITs are important for
performance analysis because they show the consistency of dividends distributed to
unit-holders which is based on the net income. Figure 2 shows comparison of the
total revenue for M-REITs from 2000-2005 while Figure 3 shows the net income
respectively. Comparisons can only be made for AmFirst, AHP and AHP2 from
2000 to 2005 because the other three M-REITs namely, Axis REIT, Starhill REIT and
UOA REIT were only listed at the end of year 2005. It was found that AmFirst’s and
AHP’s total revenue were relatively stable from year 2000 to 2005, at an average RM
18.9 million per annum and RM 10.6 million per annum respectively. AHP2’s total
revenue was however low at an average of only RM 4.2 million in the same period.
In terms of net profit after tax, the performance of AHP2 was unstable due to losses
in the years 2001 and 2002, with average net loss of RM 0.078 million in the years
2000 to 2005. However, AmFirst recorded the highest increased in net income
making it the most attractive M-REITs during that period.
Figure 2: Total Revenue for M-REITs.
Total Revenue for M-REITs
0
5
10
15
20
25
2000 2001 2002 2003 2004 2005
Year
RM
(m
illio
n)
AmFirst AHP AHP2 Axis REIT* Starhill REIT** UOA REIT***
* For period from August 3, 2005 to December 31, 2005
** For period from November 18, 2005 to December 31, 2005
*** For period from December 1, 2005 to December 31, 2005

11
Figure 3: Net Income for M-REITs.
Price to NAV ratios
As M-REITS are managed in the same way as established unit trusts,
Price/NAV ratios are used to evaluate its market performance similar to how unit
trusts are usually evaluated. Table 6 shows an old M-REIT, AmFirst was traded at a
discount of 42 percent of its initial NAV in 2000 but by the end 2005 it was only 18
percent. This was probably due to growing market confidence in AmFirst. In contrast,
the new version M-REITs traded at premiums to their initial NAV: Axis REIT (28%),
Starhill (8%) and UOA REIT (12%) as at December 2005. This could be due to the
increased awareness in M-REITs market and the issuance of new SC Guidelines
(2005) which attracted more institutional investors to invest in this market.
Net Income for M-REITs
-10
-8
-6
-4
-2
0
2
4
6
8
10
12
2000 2001 2002 2003 2004 2005
Year
RM
(m
illio
n)
AmFirst AHP AHP2 Axis REIT* Starhill REIT** UOA REIT***
* For period from August 3, 2005 to December 31, 2005
** For period from November 18, 2005 to December 31, 2005
*** For period from December 1, 2005 to December 31, 2005

12
Table 6: Price/NAV ratio for M-REITs.
DESCRIPTION YEAR
2000 2001 2002 2003 2004 2005
a) AmFirst
NAV per unit (RM) 1.30 1.31 1.31 1.39 1.41 1.42
Market Price (RM) 0.750 0.680 0.725 0.800 0.905 1.160
Price/NAV ratio 0.577 0.519 0.552 0.575 0.643 0.817
Trading at Discount (%) 42 48 45 43 36 18
b) AHP
NAV per unit (RM) 1.37 1.27 1.26 1.27 1.27 1.32
Market Price (RM) 0.760 0.680 0.670 0.640 0.670 0.740
Price/NAV ratio 0.555 0.534 0.531 0.506 0.527 0.559
Trading at Discount (%) 44 47 47 49 47 44
c) AHP2
NAV per unit (RM) 1.13 0.93 0.90 0.90 0.84 0.91
Market Price (RM) 0.660 0.535 0.405 0.535 0.470 0.400
Price/NAV ratio 0.583 0.575 0.451 0.598 0.556 0.439
Trading at Discount (%) 42 43 55 40 44 56
d) Axis REIT
NAV per unit (RM) N/A N/A N/A N/A N/A 1.35
Market Price (RM) N/A N/A N/A N/A N/A 1.730
Price/NAV ratio N/A N/A N/A N/A N/A 1.282
Trading at Discount (%) N/A N/A N/A N/A N/A -28
e) Starhill REIT
NAV per unit (RM) N/A N/A N/A N/A N/A 0.99
Market Price (RM) N/A N/A N/A N/A N/A 1.060
Price/NAV ratio N/A N/A N/A N/A N/A 1.076
Trading at Discount (%) N/A N/A N/A N/A N/A -8
f) UOA REIT
NAV per unit (RM) N/A N/A N/A N/A N/A 1.05
Market Price (RM) N/A N/A N/A N/A N/A 1.180
Price/NAV ratio N/A N/A N/A N/A N/A 1.120
Trading at Discount (%) N/A N/A N/A N/A N/A -12
Table 7: Average return of M-REITs.
No. Descriptions AmFirst AHP AHP2 Axis REIT
Starhill REIT
UOA REIT
1. Maximum Price (RM) 2.80 5.77 0.92 1.85 1.06 1.18
2. Minimum Price (RM) 0.46 0.45 0.38 1.61 0.97 1.15
3. Latest Price as at March 31, 2006 (RM)
1.56 0.71 0.41 1.67 0.97 1.15
Annually Monthly
4. Average return (%) 8.39 -10.45 4.69 0.36 -2.91 -0.85
5. KLCI average return (%) 8.48 0.21
6. PI average return (%) 6.10 -0.64
7. Average adjusted return (%)
17.76 -2.76 10.30 0.77 -2.91 -0.85
13
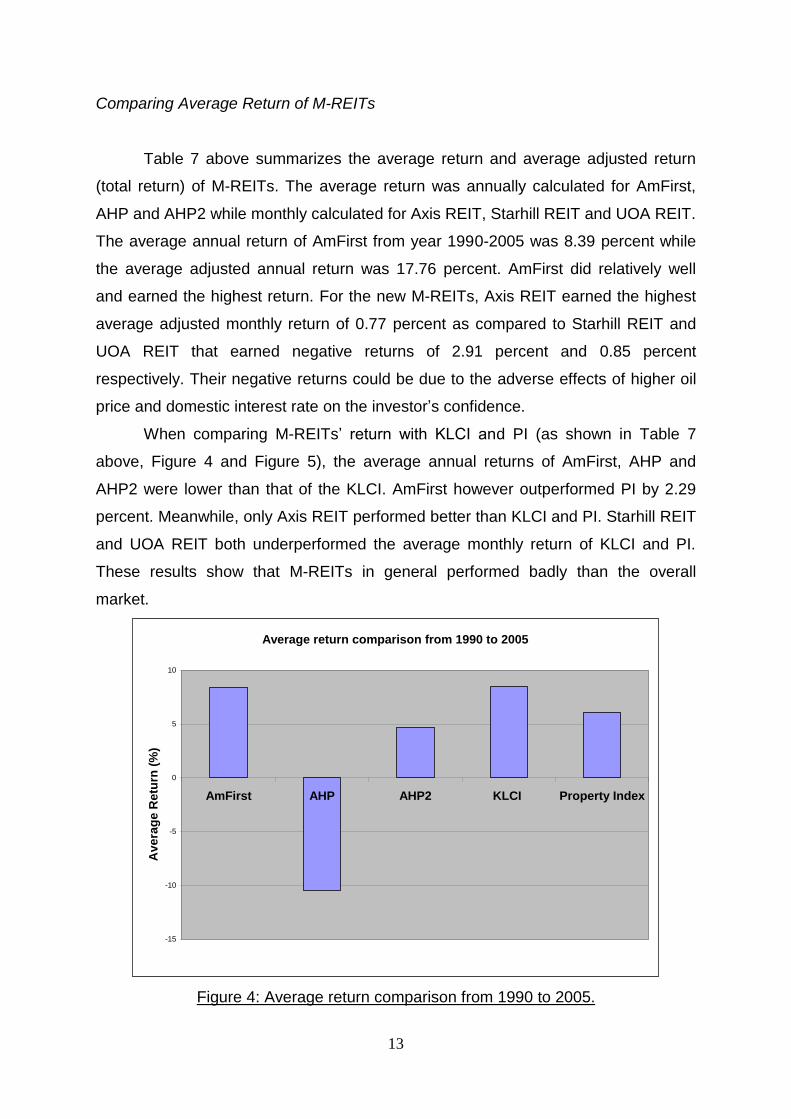
Comparing Average Return of M-REITs
Table 7 above summarizes the average return and average adjusted return
(total return) of M-REITs. The average return was annually calculated for AmFirst,
AHP and AHP2 while monthly calculated for Axis REIT, Starhill REIT and UOA REIT.
The average annual return of AmFirst from year 1990-2005 was 8.39 percent while
the average adjusted annual return was 17.76 percent. AmFirst did relatively well
and earned the highest return. For the new M-REITs, Axis REIT earned the highest
average adjusted monthly return of 0.77 percent as compared to Starhill REIT and
UOA REIT that earned negative returns of 2.91 percent and 0.85 percent
respectively. Their negative returns could be due to the adverse effects of higher oil
price and domestic interest rate on the investor’s confidence.
When comparing M-REITs’ return with KLCI and PI (as shown in Table 7
above, Figure 4 and Figure 5), the average annual returns of AmFirst, AHP and
AHP2 were lower than that of the KLCI. AmFirst however outperformed PI by 2.29
percent. Meanwhile, only Axis REIT performed better than KLCI and PI. Starhill REIT
and UOA REIT both underperformed the average monthly return of KLCI and PI.
These results show that M-REITs in general performed badly than the overall
market.
Figure 4: Average return comparison from 1990 to 2005.
Average return comparison from 1990 to 2005
-15
-10
-5
0
5
10
AmFirst AHP AHP2 KLCI Property Index
Avera
ge R
etu
rn (
%)

14
Figure 5: Average return comparison from August 2005 to March 2006.
Figure 6: Dividend Yield for AmFirst, AHP and AHP2.
Average return comparison from August 2005 to March 2006
-3.5
-3
-2.5
-2
-1.5
-1
-0.5
0
0.5
1
Axis REIT Starhill REIT UOA REIT KLCI Property Index
Av
era
ge
Re
turn
(%
)
Dividend Yield for AmFirst, AHP and AHP2
0
5
10
15
20
25
30
35
40
1991 1992 1993 1994 1995 1996 1997 1998 1999 2000 2001 2002 2003 2004 2005
Year
Yie
ld (
%)
AmFirst AHP AHP2

15
Dividend Yield
Dividend yield is an important factor in evaluating M-REITs’ performance
because investors are more concern on its presumed “high” dividend payout as
compared to other investment tools. Figure 6 shows the dividend yield of AmFirst,
AHP and AHP2 from their respective period of study. AmFirst recorded the highest
average dividend yield of 9.52 percent from 1991-2005 followed by AHP of an
average 9.29 percent from 1994-2005 and AHP2 of an average 5.25 percent from
1999-2005. The other 3 M-REITs had yet paid any dividend given that they were less
than one year old during our period of studyii.
Management Expense Ratio (MER)
Management expense ratio (MER) is normally used to compare all the
unrecoverable expenses, including all fees, as a percentage of average NAV of a
REIT. MER is a useful method to compare the costs of investment in a REIT with
other investment costs of similar nature. The MER of AmFirst, AHP and AHP2 from
2001-2005 are shown in Table 8 below. AHP2 reported an average MER of 1.15
percent from 2001-2005 while 1.21 percent and 1.65 percent for AmFirst and AHP
respectively. Hence, AHP2 was more efficient in managing its expenses than its
other two rivals.
Table 8: Management Expense Ratio for M-REITs.
NO. M-REITs MER BY YEAR Average
(%) 2001 2002 2003 2004 2005
1. AmFirst 1.21 1.22 1.22 1.19 1.19 1.21
2. AHP 1.77 1.64 1.72 1.54 1.59 1.65
3. AHP2 1.40 1.12 1.08 1.12 1.04 1.15

16
Risks of M-REITs
Table 9 presents the summary of annualized standard deviation of all M-
REITs based on daily stock return. Based on the analysis, AmFirst (33.89 percent)
was the least volatile followed by AHP2 (39.42 percent) and AHP (47.09 percent).
They were more volatile than KLCI (20.39 percent) and PI (26.97 percent). These
mean that AmFirst, AHP and AHP2 were riskier than common stocks, as opposed to
previous research findings that REITs should be less risky than stocks. However in
the case of Axis REIT, Starhill REIT and UOA REIT, these three M-REITS were less
risky than KLCI and PI. This may be caused by the closely held shares by their
parent company and institutional investors as discussed previously.
Risk-adjusted return or commonly termed as Sharpe Ratio is a method of
measuring the risk-adjusted performance of M-REITs. Table 10 shows the
calculation of Sharpe Ratio for each M-REIT. Generally, majority of M-REITs did not
perform well per unit of risk. However, this result was inconclusive.
Value-at-Risk (VaR) is an important measure of risk that presents risk in terms
of potential financial loss on any portfolio. Using historical simulation method, we can
analyze the worst case scenario of M-REITs. The summary of the result of VaR’s
historical simulation is shown in Table 11. We were 95 percent confident that the
worst daily return of AmFirst, AHP and AHP2 would not exceed -4 percent, -5
percent and -4 percent respectively. Meanwhile, we were 96 percent confident that
the worst daily return of Axis REIT, Starhill REIT and UOA REIT would not exceed -2
percent, -2 percent and -1percent respectively. These results showed that the new
M-REITs (Axis, Starhill and UOA) recorded higher VaR than the old M-REITs
(AmFirst, AHP and AHP2). Hence, the new M-REITs had lower probability of
maximum financial loss as compared to old M-REITs. These were due to their better
calculated market performance as well as lesser time span of data studied on the
new M-REITs.

17
Table 9: Annualized standard deviation of M-REITs.
No. Descriptions AmFirst AHP AHP2 Axis REIT*
Starhill REIT*
UOA REIT*
1. Maximum annualized Std Dev (%)
67.926 100.400 59.797 23.592 26.622 10.966
2. Minimum annualized Std Dev (%)
15.697 16.928 24.849 7.550 8.436 6.076
3. Average annualized Std Dev (%)
33.891 47.088 39.424 15.686 15.585 8.842
4. KLCI average annualized Std Dev (%)
20.388
5. PI average annualized Std Dev (%)
26.966
* Annualized standard deviation is derived from average monthly standard deviation.
Table 10: Sharpe Ratio of M-REITs.
No. Descriptions AmFirst AHP AHP2 Axis REIT
Starhill REIT
UOA REIT
1. Average adjusted annual return, ri (%)
17.76 -2.76 10.30 0.77* -2.91* -0.85*
2. Risk free rate, rf (%) ** 5.817 5.817 5.817 2.794 2.794 2.794
3. Average annualized Std Dev, σi (%)
33.891 47.088 39.424
4. Average monthly Std Dev, σi (%)
4.528 4.499 2.552
5. Sharpe Ratio,
i
fi r - r
0.35 -0.18 0.11 -0.45 -1.27 -1.43
* Average adjusted monthly return. ** Based on average 10-year MGS (1992-2005) for AmFirst, AHP and AHP2; and average 3-months Treasury Bills (August 2005-March 2006) for Axis REIT, Starhill REIT and UOA REIT.
Table 11: Value-at-Risk of M-REITs.
No. Descriptions AmFirst AHP AHP2 Axis REIT
Starhill REIT
UOA REIT
1. Level of confidence (%)
97.2 96.7 95.8 97.1 98.6 96.9
2. Worse daily return with respective level of confidence (%)
-4 -5 -4 -2 -2 -1
Beside the M-REITs’ risk, we analyzed the market risk exposure (Beta, Alpha
and R-squared) of M-REITs which measures the systematic risk of M-REITS. Table
11shows that the Beta of all M-REITs were less than 1.0 except for AHP, which
means majority of M-REITs were less volatile than the KLCI market return based on

18
all available historical data until March 31, 2006. A change of 1 percent in the stock
market index return would lead to less than 1percent change in the M-REITs’
returns. The lower value of Beta will further strengthen the initial assumption that M-
REITs’ return are less sensitive to market return and subsequently give a better
portfolio diversification benefits with M-REITs. Meanwhile, the Alpha represents the
excess return of an M-REIT over and above that is predicted by the CAPM, given the
stock’s beta and the actual return. Both AmFirst and AHP reported positive excess
return of 27.8 percent and 11.4 percent above market return in year 2005 but AHP2
earned a negative excess return of 15.8 percent. However, all Axis REIT, Starhill
REIT and UOA REIT earned negative excess return over market return as at March
2006. Majority of M-REITs underperformed the market return during their early
years.
Table 12: Market risk exposure of M-REITs versus KLCI.
No. Descriptions AmFirst AHP AHP2 Axis REIT
Starhill REIT
UOA REIT
1. Beta, β 0.653 1.041 0.452 0.208 0.838 0.025
2. Actual return in 2005, ri
28.18 10.45 -14.89 -1.76* -3.00* -1.71*
Actual market return in 2005, rm
-0.84 -0.25
Risk free rate in 2005, rf
2.517** 3.100***
Alpha, α = ri - [rf + β (rm - rf)]
27.855 11.428 -15.891 -4.165 -3.293
-4.728
3. R-squared, R2 0.161 0.177 0.054 0.006 0.076 0.0003
* Based on March 2006 data. ** Based on 12-months Treasury Bills rate in 2005. *** Based on 3-months Treasury Bills rate in March 2006.
Table 12 shows the market exposure of M-REITS versus KLCI. The R-
squared values of M-REITs were very low, indicating that the model does not fit the
data perfectly, with the line not going right through every data point. For example,
only 16.1 percent of AmFirst’s movement and 17.7 percent of AHP’s movement were
explained by the movement in the market. Overall, the results do suggest that M-
REITs’ have a low market risk exposure which is good for hedging.

19
M-REITS Relationships with KLCI and PI
After analyzing the performance and risks of M-REITs, we shall also look at
the relationships of M-REITs with KLCI and PI to determine whether they are
correlated with each other. Table 13 shows the summary of correlation with KLCI
and PI.
Table 13: Covariance and Pearson correlation coefficient, r.
No. Descriptions AmFirst AHP AHP2 Axis REIT
Starhill REIT
UOA REIT
1. Versus KLCI
a) Covariance 1.324 2.328 0.762 0.029 0.120 0.004
b) Pearson correlation coefficient, r
0.401
0.421
0.233
0.075
0.276
0.018
c) Correlation category*
Moderate Moderate Low Low Moderate Low
2. Versus PI
a) Covariance 2.064 3.771 1.168 0.018 0.094 0.009
b) Pearson correlation coefficient, r
0.475
0.526
0.269
0.033
0.128
0.026
c) Correlation category*
Moderate Moderate Moderate Low Low Low
* High (r>0.75), Moderate (0.25<r<0.75) and Low (r<0.25).
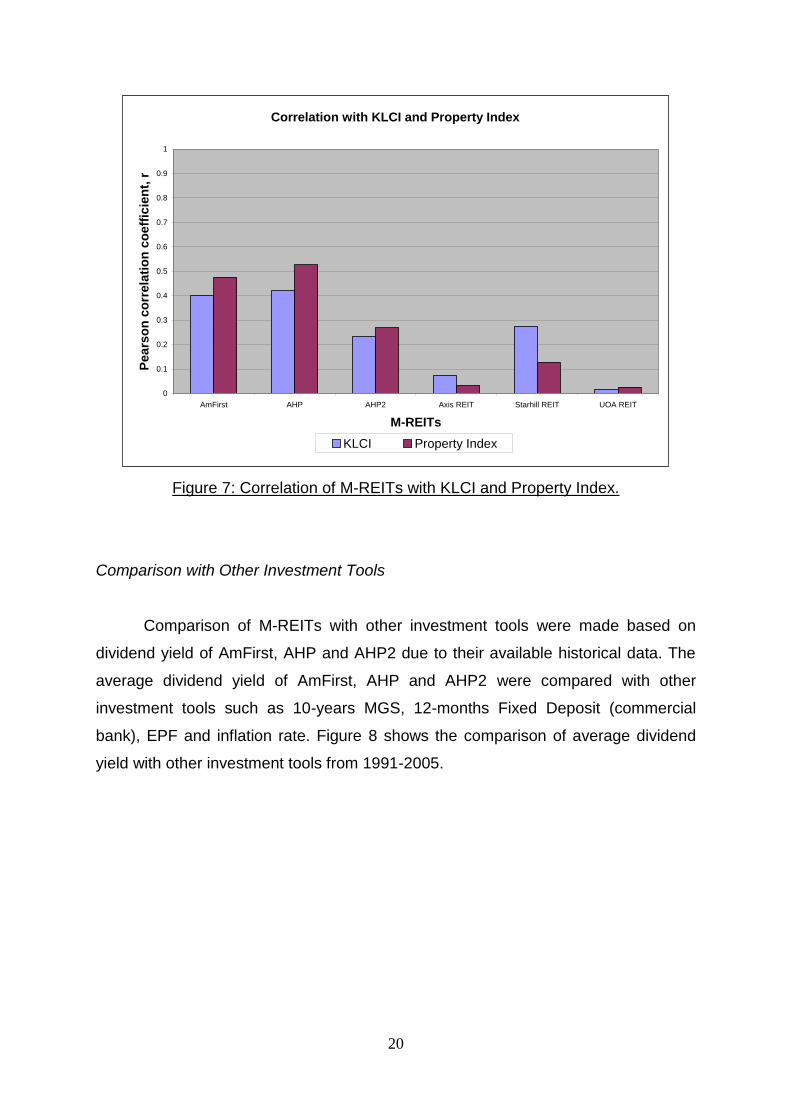
Table 13 shows that all M-REITs’ covariances were positive values which
indicated that all M-REITs tend to move together in the same direction as KLCI and
PI. However, the Pearson correlation coefficient, r, indicated a relatively low
correlation. The value of r in Axis REIT, Starhill REIT and UOA REIT were almost
zero meaning a very weak linear relationship with movements of KLCI and PI. Figure
7 shows the correlation of M-REITs with KLCI and PI. The results from the data
analysis show that M-REITs generally had moderate and low relationships with KLCI
and PI. This is in tandem with many past studies that REITs are suitable for portfolio
diversification purposes due to lower correlation with market return.
20
Figure 7: Correlation of M-REITs with KLCI and Property Index.
Comparison with Other Investment Tools
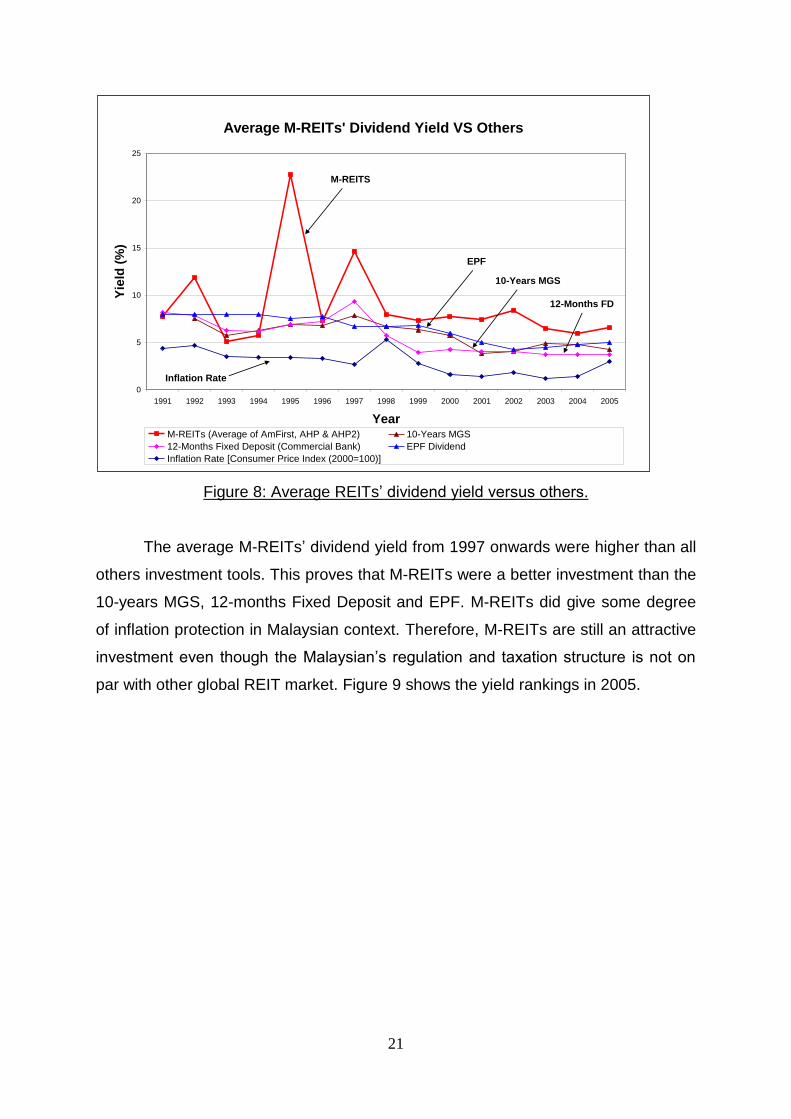
Comparison of M-REITs with other investment tools were made based on
dividend yield of AmFirst, AHP and AHP2 due to their available historical data. The
average dividend yield of AmFirst, AHP and AHP2 were compared with other
investment tools such as 10-years MGS, 12-months Fixed Deposit (commercial
bank), EPF and inflation rate. Figure 8 shows the comparison of average dividend
yield with other investment tools from 1991-2005.
Correlation with KLCI and Property Index
0
0.1
0.2
0.3
0.4
0.5
0.6
0.7
0.8
0.9
1
AmFirst AHP AHP2 Axis REIT Starhill REIT UOA REIT
M-REITs
Pe
ars
on
co
rre
lati
on
co
eff
icie
nt,
r
KLCI Property Index
21
Figure 8: Average REITs’ dividend yield versus others.
The average M-REITs’ dividend yield from 1997 onwards were higher than all
others investment tools. This proves that M-REITs were a better investment than the
10-years MGS, 12-months Fixed Deposit and EPF. M-REITs did give some degree
of inflation protection in Malaysian context. Therefore, M-REITs are still an attractive
investment even though the Malaysian’s regulation and taxation structure is not on
par with other global REIT market. Figure 9 shows the yield rankings in 2005.
Average M-REITs' Dividend Yield VS Others
0
5
10
15
20
25
1991 1992 1993 1994 1995 1996 1997 1998 1999 2000 2001 2002 2003 2004 2005
Year
Yie
ld (
%)
M-REITs (Average of AmFirst, AHP & AHP2) 10-Years MGS
12-Months Fixed Deposit (Commercial Bank) EPF Dividend
Inflation Rate [Consumer Price Index (2000=100)]
M-REITS
EPF
10-Years MGS
12-Months FD
Inflation Rate

22
Figure 9: Yield rankings of investment tools in year 2005.
Summary on the M-REIT’s overall performance during its early years of inception
(1990-2006)
From Table 14 below, the average annual return of AmFirst was 8.39 percent
followed by AHP2 and AHP that recorded 4.69 percent and -10.45 percent
respectively. Hence, their returns were below the KLCI market return of 8.48 percent.
In addition, AmFirst was the only one that outperformed the PI and both AHP and
AHP2 underperformed the PI. All the first three M-REITS were riskier than KLCI
market return and PI return.
Among the new M-REITs, Axis REIT was the only REIT that performed better
than KLCI market return and PI return. But in respect to risk, all of them were less
risky than KLCI market return and PI return. When we look at the Price/NAV ratio,
Axis REIT was trading at 28 percent premium as compared to UOA REIT (12
percent) and Starhill REIT (8 percent) in 2005. Investors seem to be very confident
with the new M-REITs as compared to the old M-REITs.
Yield Rankings in 2005 (%)
6.250
5.000
4.238
3.000
3.700
6.6386.757
0.000
1.000
2.000
3.000
4.000
5.000
6.000
7.000
8.000
AHP AmFirst AHP2 EPF 10-Years
MGS
12-Months
Fixed
Deposit
Inflation
Rate
Investment Tools
Yie
ld (
%)

23
Table 14: Performance analysis summary of old M-REITs.
No. Descriptions Average
Annual Return
(%)
Risk
(Annualized
Standard
Deviation, %)
% of KLCI
Market Risk
1. AmFirst 8.39 33.891 166
2. AHP -10.45 47.088 231
3. AHP2 4.69 39.424 193
4. KLCI 8.48 20.388 100
5. Property Index 6.10 26.966 132
Table 15: Performance analysis summary of new M-REITs.
No. Descriptions Average
Monthly Return
(%)
Risk
(Annualized
Standard
Deviation, %)
% of KLCI
Market Risk
1. Axis REIT 0.36 15.686 77
2. Starhill REIT -2.91 15.858 78
3. UOA REIT -0.85 8.842 43
4. KLCI 0.21 20.388 100
5. Property Index -0.64 26.966 132
Conclusion
As a conclusion, M-REITs are generally underperformed but have lower risk
than KLCI market return and PI return. But our results are based on the market
performance of the first six M-REITS listed on Bursa Malaysia. This finding is
however consistent with what we have earlier presumed because REITs should have
lower return and lower volatility as compared to common stocks. For market risk
exposure, the Beta of most M-REITs (0.03 to 0.84) appear to be less than 1.0 which
means majority of M-REITs are less volatile than the KLCI market return. The lower
value of Beta further supports the notion that M-REITs’ returns are less sensitive to
market return and subsequently M-REITS give a better portfolio diversification
benefits than other investment assets. Overall, the results also suggest that M-
REITs’ have a low market risk exposure which is good for hedging.

24
Meanwhile the conclusion from the relationship with KLCI and PI is that, M-
REITs have low correlation with KLCI and PI market return. The values of r in Axis
REIT, Starhill REIT and UOA REIT were almost zero indicating no linear relationship
with movements of KLCI and PI. Beside, the average M-REITs’ dividend yield from
1997-2005 was higher than the other investment tools. This gives some evidence
that M-REITs are a better investment alternative compared to 10-years MGS, 12-
months Fixed Deposit and EPF.
Therefore in this study, we can conclude that generally M-REITs are
underperformed as compared to stocks and they have lower risk than KLCI market
return and PI return. M-REITs also have moderate and low relationships with KLCI
and PI. This is in tandem with many past studies that REITs are suitable for portfolio
diversification purposes due to lower correlation with market return. The comparison
with other investment tools further enhances the attractiveness of M-REITs industry
as an alternative investment and inflation protection.
Implications for the 21st century
Since the Guidelines on Real Estate Investment Trusts were issued by the SC
in early 2005, we witnessed the surfacing of M-REITs as a viable and attractive
investment alternative for income producing real estate. The successful listing of
three M-REITs (Axis REIT, Starhill REIT and UOA REIT) in 2005 had led to the
growth and development of M-REITs industry. This illustrates that the industry needs
government’s continuous support and good regulatory framework for its growth and
development. For Malaysian scenario, there must also be concerted efforts and
paradigm shift in the mindset of investors towards a yield-driven market rather than
relying heavily on capital appreciation. This is because a tendency for M-REITs’
price to trade around the NAV and hence, the price will not increase much when
there is no new properties acquisition to increase the NAV. Subsequently, M-RETIs
must be aggressive in acquiring new properties. The other main challenge is
competition that the M-REIT companies are facing among each other as well as from
abroad. In 2012-13, the top three REITs markets in terms of market capitalization in
Asia are Japan, Singapore and Hong Kong. The M-REIT industry is currently in the

25
growth phase. For M-REITs market to grow, Malaysia needs new, large and quality
REITs to enter the industry. As more REITs enter the market, acquiring new assets
with earnings accretive will become more expensive and difficult to earn high yields.
i Perfect Analysis is a financial analysis, reporting and charting service providing data on over 120,000 globally listed companies. The database provides historic share prices, dividend payments, indices, currency rates and financial data that may cover up to 20 years.
iiAlias and Tho (2011) report that UOA REIT, AXIS REIT and STARHILL REIT have recorded a
growth in dividend yield of 7.17 percent, 13.46 percent and 8.11 percent in 2008 respectively.