MAINTENANCE MANAGEMENT PERFORMANCE OF MALAYSIAN PALM OIL MILLS
294
1 MAINTENANCE MANAGEMENT PERFORMANCE OF MALAYSIAN PALM OIL MILLS By NAZIM BALUCH (August 2012) Thesis Submitted to Othman Yeop Abdullah Graduate School of Business Universiti Utara Malaysia In Fulfillment of the Requirement for the Degree of Doctor of Philosophy
-
Upload
nazimbaluch -
Category
Documents
-
view
150 -
download
3
description
Performance of an organization should be appraised simultaneously, both in terms of its efficiency in resource utilization process and effectiveness in realizing the pre-determined goals. Measuring performance provides the required information to the management for effective decision making and is used by industries to assess progress against set goals and objectives in a quantifiable way. Deficient maintenance management can severely affect competitiveness of an organization by reducing throughput, increasing inventory, and leading to poor performance. Applying Overall Equipment Effectiveness, this research study, has evaluated maintenance management performance in Malaysian palm oil mills, highlighted how it helps to identify the factors causing poor performance and demonstrates how to improve and perpetuate company’s productivity, profits, and sustainability by adopting world class maintenance strategies such as Total Productive Maintenance. This research study supplicated data by mail survey questionnaire sent to all Malaysia palm oil mills, validated data through triangulation, and analyzed using descriptive statistics. The research exalts practitioner’s perspective and has determined that Scientific Management Theory axioms and Total Productive Maintenance principles are not being applied to optimize productivity in palm oil mills. The research also identified theory and practice gaps pertinent to maintenance management in palm oil mills and provided shop-level solutions to bridge those gaps. Research findings established how efficient and effective maintenance management offers, besides substantial cost savings, a wide scope of improvements for the palm oil industry. In order to ensure competitiveness and sustainability in the 21st century, it is obligatory for Malaysian palm oil mills to adopt best management practices in processing, manufacturing and maintenance.Key Words: Maintenance management, Total Productive Maintenance, Measuring performance, Overall Equipment Effectiveness, Scientific Management Theory
Transcript of MAINTENANCE MANAGEMENT PERFORMANCE OF MALAYSIAN PALM OIL MILLS

1
MAINTENANCE MANAGEMENT PERFORMANCE
OF MALAYSIAN PALM OIL MILLS
By
NAZIM BALUCH
(August 2012)
Thesis Submitted to
Othman Yeop Abdullah Graduate School of Business
Universiti Utara Malaysia
In Fulfillment of the Requirement for the Degree of Doctor of Philosophy
2
ABSTRACT
Performance of an organization should be appraised simultaneously, both in terms of its
efficiency in resource utilization process and effectiveness in realizing the pre-determined goals.
Measuring performance provides the required information to the management for effective
decision making and is used by industries to assess progress against set goals and objectives in a
quantifiable way. Deficient maintenance management can severely affect competitiveness of an
organization by reducing throughput, increasing inventory, and leading to poor performance.
Applying Overall Equipment Effectiveness, this research study, has evaluated maintenance
management performance in Malaysian palm oil mills, highlighted how it helps to identify the
factors causing poor performance and demonstrates how to improve and perpetuate company’s
productivity, profits, and sustainability by adopting world class maintenance strategies such as
Total Productive Maintenance. This research study supplicated data by mail survey
questionnaire sent to all Malaysia palm oil mills, validated data through triangulation, and
analyzed using descriptive statistics. The research exalts practitioner’s perspective and has
determined that Scientific Management Theory axioms and Total Productive Maintenance
principles are not being applied to optimize productivity in palm oil mills. The research also
identified theory and practice gaps pertinent to maintenance management in palm oil mills and
provided shop-level solutions to bridge those gaps. Research findings established how efficient
and effective maintenance management offers, besides substantial cost savings, a wide scope of
improvements for the palm oil industry. In order to ensure competitiveness and sustainability in
the 21st century, it is obligatory for Malaysian palm oil mills to adopt best management practices
in processing, manufacturing and maintenance.
Key Words: Maintenance management, Total Productive Maintenance, Measuring
performance, Overall Equipment Effectiveness, Scientific Management Theory
3
TABLE OF CONTENTS
TITLE PAGE 1
ABSTRACT 2
LIST OF FIGURES 8
LIST OF ABBREVIATIONS 9
LIST OF APPENDICES 14
REFERENCES 265
CHAPTER ONE: INTRODUCTION
1.1 Introduction to Study 15
1.2 Background 15
1.2.1 Strategic Importance of Maintenance 15
1.2.2 Maintenance Performance Measurement 16
1.2.3 Performance Measurement - an effective management tool 18
1.2.4 Driving Factors behind MPM 18
1.2.5 OEE – TPM’s key performance indicator 20
1.2.6 Malaysian Palm Oil Industry – an overview 22
1.2.7 Industrial – biofuel use of palm oil 24
1.2.8 Sustainability and the Round Table on Sustainable Palm Oil 24
1.2.9 EUREPGAP and EU-RED Protocol 25
1.2.10 Concern over GMO food 26
1.2.11 Loss of Market Share 27
1.3 Problem Statement 28
1.3.1 Particular research has not been done in the field of maintenance
performance evaluation in the palm oil mills 28
1.3.2 SME’s poor contribution to Malaysian GDP 28
1.3.3 Maintenance a low priority in Malaysian SMIs 29
1.3.4 Low productivity in palm oil mills hampering competiveness 29
4
1.3.5 Sustainable increase in productivity 31
1.3.6 Elevating Maintenance Function – The Financial Business 32
1.3.7 Malaysian Development Plan 2020 33
1.4 Research Questions 35
1.5 Research Objectives 35
1.6 Scope of this Research Study 36
1.6.1 Malaysian Palm Oil Mills 36
1.6.2 Upstream Producers 38
1.6.3 Downstream Producers 39
1.7 Significance of the Study 40
1.7.1 Palm Oil Mills and CDM Projects 40
1.7.2 Improve Foreign Exchange Earnings 41
1.7.3 Improve Sustainability – triple bottom line 42
1.7.4 Re-distribution of Wealth among Rural Population 44
1.7.5 Reduce Environmental Footprint – Green House Gases 45
1.7.6 Contribution to Knowledge 47
1.8 Thesis Organization 49
CHAPTER TWO: LITERATURE REVIEW 51
2.1 Introduction 51
2.2 Scope of Maintenance Management 52
2.3 The Maintenance Function 55
2.4 History of Maintenance Management 56
2.5 Maintenance Strategies 60
2.5.1 Reactive or Breakdown Maintenance (BDM) 60
2.5.2 Preventive Maintenance (PM) 61
2.5.3 Condition-Based Maintenance (CBM) 61
2.5.4 Reliability-Centered Maintenance (RCM) 62
2.5.5 Total Productive Maintenance (TPM) 63
2.6 The Evolution of Performance Measurement 69

5
2.7 The Performance Measurement Revolution 71
2.7.1 Financial Measures 73
2.7.2 Reasons for Redesigning Business Performance Measures 75
2.8 Who Needs to Monitor Maintenance Performance and Why? 83
2.8.1 Why Measure Maintenance Performance? 86
2.9 Description of the Maintenance Management Information System 88
2.9.1 Strategic Planning 88
2.9.2 Tactical Control 88
2.9.3 Operational Control 89
2.10 Maintenance Management Performance Evaluation 89
2.10.1 Mean Time between Failures (MTBF) 90
2.10.2 Mean Time to Repair (MTTR) 90
2.10.3 Percent Reactive Maintenance 90
2.10.4 OEE and Maintenance Performance Evaluation 91
2.11 Malaysian PO Industry – Scope, Importance and Challenges 95
2.11.1 Malaysian Palm Oil Industry and Palm Oil Mills 95
2.11.2 CPO Biodiesel Prospects 97
2.11.3 GAP and EU-RED 100
2.11.4 CPO Production Process & Developments in Milling Technology 101
2.11.5 Sustainability and the Round Table on Sustainable Palm Oil 107
2.11.6 Waste and Pollution from Palm Oil Production and Management 110
2.11.7 Clean Development Mechanism (CDM) Projects 115
2.11.8 Capitalizing on Palm Oil Sector Synergies 116
2.12 Underpinning Theory and Theoretical Framework 117
2.12.1 Scientific Management Theory (SMT) 119
2.12.2 Theoretical Framework 133
2.13 Chapter Summary 134
6
CHAPTER THREE: METHODOLOGY 136
3.1 Introduction 136
3.2 Maintenance Optimisation Models 137
3.3 Constraints in Applying Optimisation Models 138
3.4 Model and Framework applied in this study 145
3.4.1 Spread of TPM 145
3.4.2 Why TPM is so popular? 147
3.4.3 TPM and OEE 149
3.4.4 Data Collecting Issues and Challenges 151
3.4.5 OEE Calculation, explained 154
3.4.6 OEE 157
3.4.7 MMPM Model Explained 158
3.5 Variables in this Research Study 159
3.5.1 Independent Variable 159
3.5.2 Moderator Variable 165
3.5.3 Dependent Variable 165
3.6 Research Methodology 166
3.6.1 Indexes of Population and Sample Design 167
3.6.2 Measuring Instrument - Design, Testing and Validation 168
3.6.3 Measuring Instrument – Survey Questionnaire 169
3.6.4 Primary Data Collection and Validation 172
3.7 Chapter Summary 173
CHAPTER FOUR: RESULTS AND DISCUSSION 175
4.1 Introduction 175
4.2 Data Collection and Enumeration 176
4.2.1 Data Validity and Reliability 178
4.2.2 Data adaptations: presumptions conceived from the survey 179
4.2.3 Central Tendency 180
4.3 OEE – the Dependent Variable (DV) 181
7
4.3.1 Data Collecting Issues and Challenges – Theory Practice Gap 183
4.3.2 OEE: Cautions for using and Issues to be considered 186
4.4 Palm Oil Milling Sector ‘Inefficiency Cost’ Quantified 188
4.4.1 OEE 188
4.4.2 Yield 188
4.4.3 OER 188
4.5 Maintenance Inputs (IV): Sub-IVs and their Correlation with OEE 189
4.5.1 Labor in Theory and Practice: an analytical discourse 191
4.5.2 Spare-parts, Material, and Tools – (Sub-IV) 206
4.5.3 Maintenance Contracted Out 218
4.6 Moderator – Maintenance Strategy: TPM 226
4.6.1 TPM 227
4.6.2 Four Rules of Toyota Production System 228
4.7 POME Generated and POME Treated 231
4.8 Practical Implications 231
4.9 Chapter Summary 232
CHAPTER FIVE: CONCLUSION AND RECOMMENDATION 234
5.1 Introduction 234
5.2 OEE 234
5.3 Labor; Spare-parts, Material, & Tools; and Outsourced Maint. 237
5.3.1 Labor: Malaysian Skilled Labor Market 237
5.3.2 Spare parts Inventory Management 239
5.3.3 Outsourcing Maintenance: Power Generating Equipment in POM 240
5.4 Contribution to Knowledge 241
5.4.1 Identified Theory Practice Knowledge Gap pertinent to Maintenance
Management Performance in Malaysian Palm Oil Mills 241
5.4.2 Modified ‘Input-Output Model for the Enterprise System’ 245
5.4.3 e-maintenance network concept for ‘Power Generating Equipment
in Malaysian Palm Oil Mills’ 245
8
5.5 Research Findings 250
5.6 Research Accomplishments 253
5.7 Generalization 255
5.8 Recommendations for the Malaysian Palm Oil Milling Sector 258
5.9 Research Limitations 259
5.10 Future Research Recommendations 260
5.11 Chapter Summary 263
LIST OF FIGURES
1.1 Global Palm Oil Production 26
1.2 Crude Palm Oil (CPO) yield potential in tons/ha/y 31
1.3 Per Capita GNI in US $ of selected countries 34
1.4 Crude Palm Oil Processing at MPOB mill 37
1.5 Oil Palm – the most productive crop 41
1.6 Carbon Dioxide footprint of palm oil 46
2.7 Eight Pillar Model of TPM (JIPM) 67
2.8 Tsang Input Output Model 133
2.9 Theoretical Framework 134
3.10 MMPM (Maintenance Management Performance Model) 159
3.11 Variables depicted in the framework 166
3.12 Graphic depiction of methodology 168
4.13 Central Tendencies 180
4.14 OEE: mean and standard deviation 185
4.15 Palm Oil Milling Sector ‘Inefficiency Cost’ Quantified 189
9
4.16 Maintenance Inputs and OEE Correlations 190
4.17 OEE Inputs and OEE Correlations 190
5.18 Diagram showing RPGDC Concept for Palm Oil Mills 248
5.19 Individual Mill Daily Production Log & OEE Template 253
5.20 Maintenance Daily Service Log Template 254
LIST OF ABBREVIATIONS
ABI American Business Institute
ABAC Asia Business Advisory Council
ADB Asian Development Bank
AGVs Automated Guided Vehicles
AIA American Institute of Accountants
AICPA American Institute of Certified Public Accountants
APEC Asia Pacific Economic Cooperation
APOC American Palm Oil Council
BDM Break Down Maintenance
BOD Biochemical Oxygen Demand
CBM Condition Based Maintenance
CDM Clean Development Mechanism
CER Certified Emission Reductions
CI Continuous Improvement
CIMA Chartered Institute of Management Accountants
CM Corrective Maintenance
CMMS Computerized Maintenance Management System
CO2 Carbon Dioxide
CPKO Crude Palm Kernel Oil
CPO Crude Palm Oil
10
CSR Corporate Social Responsibility
DCS Distributed Control Systems
DV Dependent Variable
EFB Empty Fruit Bunch
EPD Environment Protection Department
ERV Equipment Replacement Value
ETP Economic Transformation Program
EU European Union
EU-RED European Union Renewable Energy Directive
FAO Food and Agriculture Organization
FBM Failure Based Maintenance
FDI Foreign Direct Investment
FELCRA Federal Land Consolidation & Rehabilitation Authority
FELDA Federal Land Development Authority
FFB Fresh Fruit Bunch
FMEA Failure Mode Effect Analysis
FMS Flexible Manufacturing Systems
FRBD Federal Reserve Bank Dallas
GAP Good Agricultural Practices
GE General Electric
GHG Green House Gas
GMO Genetically Modified Organism
GRI Global Reporting Initiative
HACCP Hazard Analysis Critical Control Points
HSE Health Safety & Environment
ICAS Institute of Chartered Accountants of Scotland
ICM Integrated Crop Management
ICT Information & Communication Technology
IEC International Electro-technical Commission
11
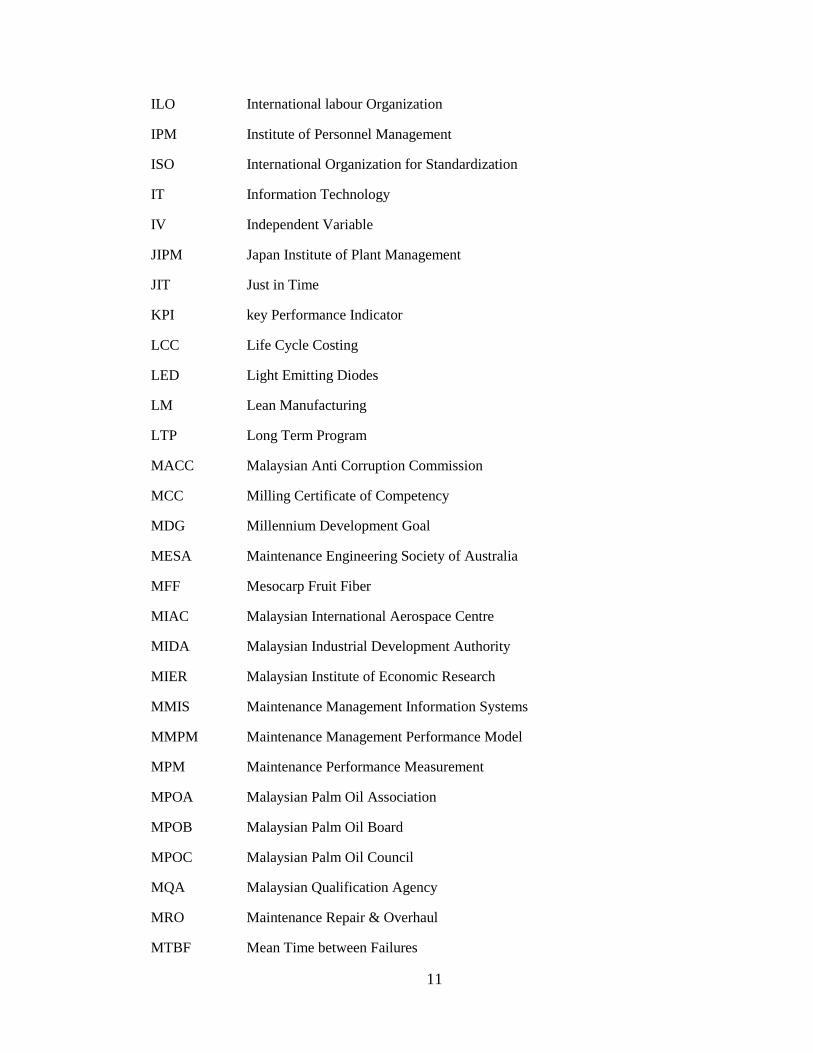
ILO International labour Organization
IPM Institute of Personnel Management
ISO International Organization for Standardization
IT Information Technology
IV Independent Variable
JIPM Japan Institute of Plant Management
JIT Just in Time
KPI key Performance Indicator
LCC Life Cycle Costing
LED Light Emitting Diodes
LM Lean Manufacturing
LTP Long Term Program
MACC Malaysian Anti Corruption Commission
MCC Milling Certificate of Competency
MDG Millennium Development Goal
MESA Maintenance Engineering Society of Australia
MFF Mesocarp Fruit Fiber
MIAC Malaysian International Aerospace Centre
MIDA Malaysian Industrial Development Authority
MIER Malaysian Institute of Economic Research
MMIS Maintenance Management Information Systems
MMPM Maintenance Management Performance Model
MPM Maintenance Performance Measurement
MPOA Malaysian Palm Oil Association
MPOB Malaysian Palm Oil Board
MPOC Malaysian Palm Oil Council
MQA Malaysian Qualification Agency
MRO Maintenance Repair & Overhaul
MTBF Mean Time between Failures
12
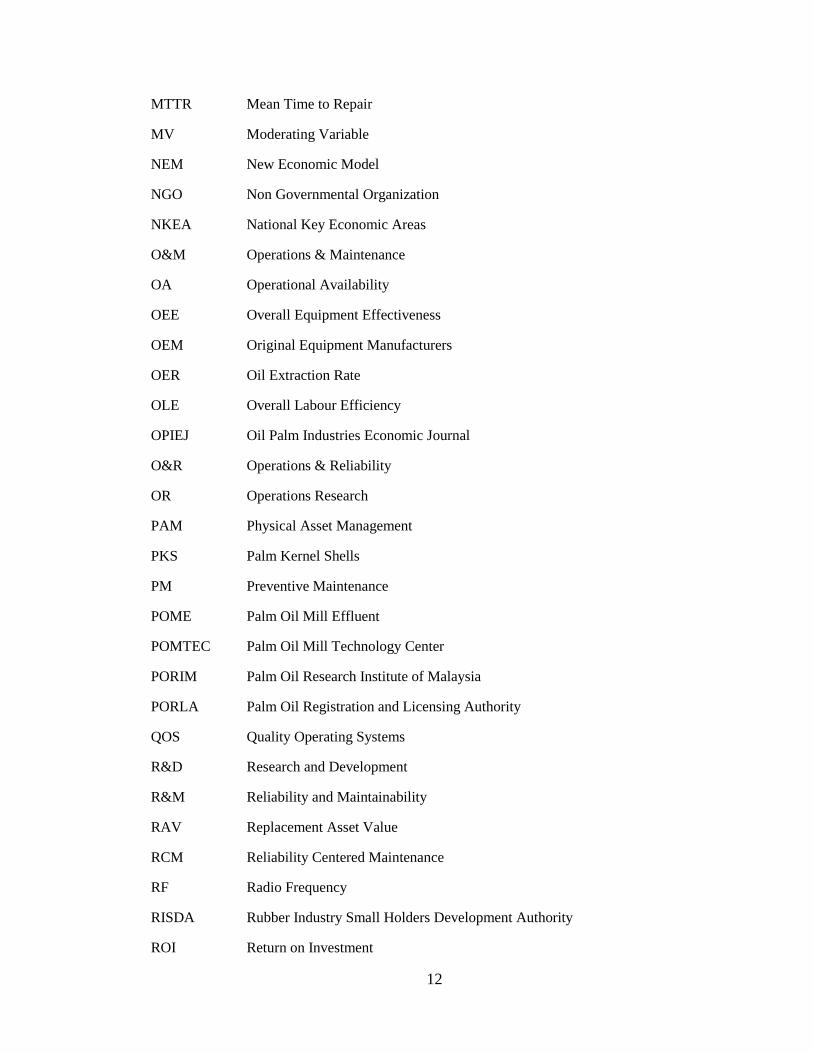
MTTR Mean Time to Repair
MV Moderating Variable
NEM New Economic Model
NGO Non Governmental Organization
NKEA National Key Economic Areas
O&M Operations & Maintenance
OA Operational Availability
OEE Overall Equipment Effectiveness
OEM Original Equipment Manufacturers
OER Oil Extraction Rate
OLE Overall Labour Efficiency
OPIEJ Oil Palm Industries Economic Journal
O&R Operations & Reliability
OR Operations Research
PAM Physical Asset Management
PKS Palm Kernel Shells
PM Preventive Maintenance
POME Palm Oil Mill Effluent
POMTEC Palm Oil Mill Technology Center
PORIM Palm Oil Research Institute of Malaysia
PORLA Palm Oil Registration and Licensing Authority
QOS Quality Operating Systems
R&D Research and Development
R&M Reliability and Maintainability
RAV Replacement Asset Value
RCM Reliability Centered Maintenance
RF Radio Frequency
RISDA Rubber Industry Small Holders Development Authority
ROI Return on Investment

13
RONA Return on Net Assets
RPGDC Remote Power Generating Diagnostics Centre
RSPO Roundtable Sustainable Palm Oil
SALCRA Sarawak Land Rehabilitation & Consolidation Authority
SCM Supply Chain Management
SKU Stock Keeping Unit
SLDB Sabah Land Development Board
SME Small & Medium Enterprises
SMI Small & Medium Industries
SMT Scientific Management Theory
SS Six Sigma
TBL Triple Bottom Line - People, Planet, Profit
TEEP Total Equipment Effectiveness Performance
TOC Theory of Constraints
TPM Total Productive Maintenance
TQM Total Quality Management
TSS Total Suspended Solids
UBM Use Based Maintenance
UK United Kingdom
UN United Nations
UNCED United Nations Conference on Environment & Development
UNEP United Nations Environment Program
USA United States of America
USDA United States Development Agency
USDOC United States Department of Commerce
USITC United States International Trade Commission
VBM Vibration Based Maintenance
WCM World Class Manufacturing
WO Work Order
14
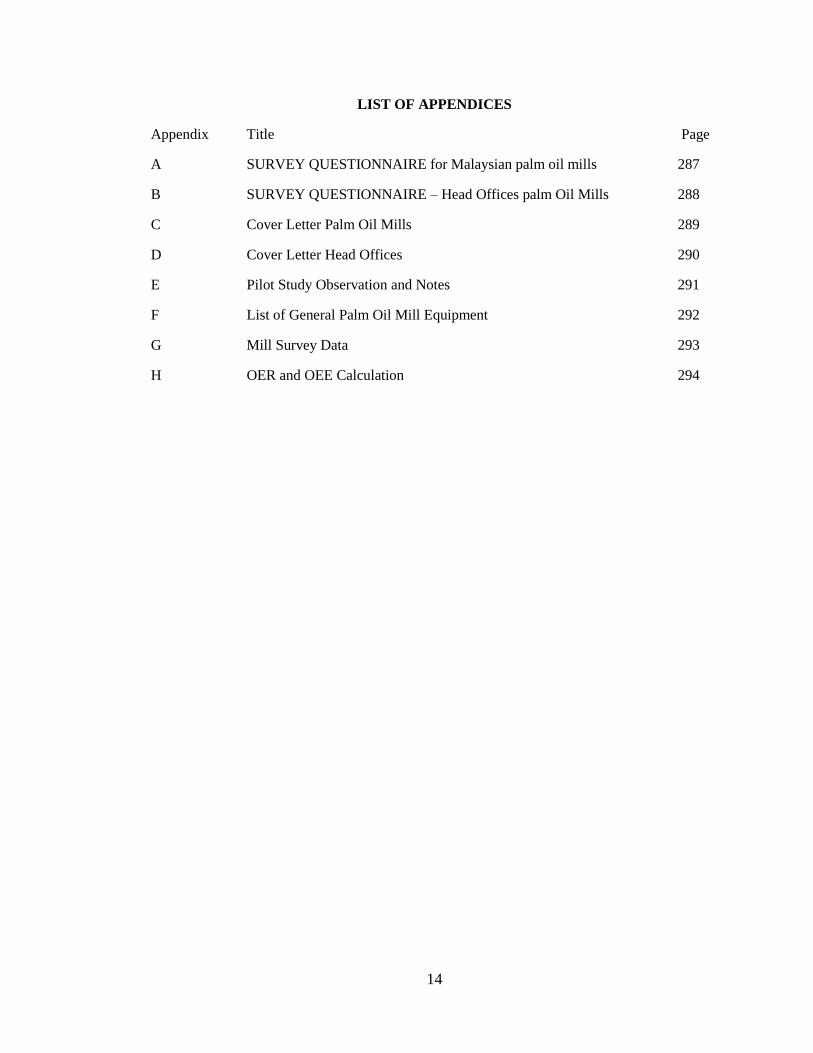
LIST OF APPENDICES
Appendix Title Page
A SURVEY QUESTIONNAIRE for Malaysian palm oil mills 287
B SURVEY QUESTIONNAIRE – Head Offices palm Oil Mills 288
C Cover Letter Palm Oil Mills 289
D Cover Letter Head Offices 290
E Pilot Study Observation and Notes 291
F List of General Palm Oil Mill Equipment 292
G Mill Survey Data 293
H OER and OEE Calculation 294
15
CHAPTER ONE
1.0 INTRODUCTION
1.1 Introduction to the Study
Management is obliged to measure performance of their organizations for effective
decision making to ensure sustainable profits. This research study espousing
practitioner’s perspective will employ Overall Equipment Effectiveness (OEE), key
performance indicator (KPI) of Total Productive Maintenance (TPM), to evaluate
maintenance management performance in Malaysian palm oil mills and accent poor
performance stimulating determinants. The study will discuss moderating effects of
maintenance strategy, TPM, to improve palm oil mills’ productivity, profits, and
sustainability. Adopting world class maintenance strategy, TPM, would enable to
establish palm oil sectors’ competitiveness in the 21st century.
1.2 Background
1.2.1 Strategic Importance of Maintenance
Intense competitive pressure is triggering many companies to look for every possible
source of competitive advantage. To achieve this, the ingenuity of each company lies in
understanding the potential of each function – say, for example, manufacturing or
maintenance. Once understood, it requires a proper strategy to exploit such potential.
Strategy at any level, say at a business and functional level will provide the company
with a sense of direction, integrity and purpose (Pintelon, Pinjala, & Vereecke, 2006).
Tsang (2002) reported that maintenance plays a vital role in any organization using
machinery and should be incorporated into an organizations’ business model.

16
Since 1990s there has been a steady increase in acknowledgement of the strategic
importance of maintenance. One of the driving factors has been the continued pressure
on costs attributable to maintenance. There has also been a growth in the awareness of
the part played by maintenance in managing the risk exposure of a corporation. In some
instances, this is driven by legislative changes in the areas of safety and environment. In
other instances, it is driven by the increasing understanding of the dramatic effect that
maintenance management can have on end product quality and overall organization’s
profitability. While cost is the issue that generally receives the majority of attention at a
corporate level, the issues associated with risk management are equally important and
vital to the responsible management of physical assets. Today maintenance is considered
as a strategic and integral part of the business process and it is an established fact that “It
creates additional value” (Liyanage & Kumar, 2003). As the understanding of the
strategic importance of maintenance has risen, so too has, the efforts to control,
measure, and better manage this function.
1.2.2 Maintenance Performance Measurement (MPM)
For nearly 30 years, the performance measurement literature has focused on developing
relevant, integrated, balanced, strategic and improvement-oriented performance
measurement systems (Bititci, Mendibil, Martinez, & Albores, 2005). Performance
measurement and evaluation is the process of quantifying the efficiency and
effectiveness of actions; it is a systematic, rigorous, and meticulous application of
scientific methods to assess the design, implementation, improvement or outcomes of a
program (Neely, Neely, Gregory, & Plats, 1995; Rossi, Lipsey, & Freeman, 2004).
17
Performance measurement provides the required information to the management for
effective decision making and is used by industries to assess progress against set goals
and objectives in a quantifiable way for effectiveness and efficiency. Efficiency and
effectiveness are the central terms used in assessing and measuring the performance of
organizations (Mouzas, 2006). Research results demonstrate that companies using
integrated balanced performance systems perform better than those who do not manage
measurements (Lingle & Schiemann, 1996; Kennerly & Neely, 2003). Poor
organisational competencies in managing the maintenance function effectively can
severely affect competitiveness by reducing throughput, increasing inventory, and
leading to poor due-date performance (Patterson, Fredendall, Kennedy, & McGee, 1996;
Ashayeri, 2007).
The business imperative for organizations seeking to achieve performance excellence
demands that these organizations continuously enhance their capability to create value
for customers and improve the cost-effectiveness of their operations. There are vast
numbers of methods, tools, and computerized systems available that claim to be able to
optimize maintenance, improve performance, or reduce costs associated with
maintenance management. It is not possible to manage what you cannot control and you
cannot control what you cannot measure (Drucker, 1994). Drucker (1977) distinguished
efficiency and effectiveness by associating efficiency to “doing things right” and
effectiveness to “doing the right things.” In his terminology, a measure of efficiency
assesses the ability of an organization to attain the output(s) with the minimum level of
input(s). Efficiency is not a measure of a success in the marketplace but a measure of
18
operational excellence in the resource utilization process. More precisely, efficiency is
primarily concerned with minimizing the costs and deals with the allocation of resources
across alternative uses (Achabal, Heineke, & McJntyre, 1984).
1.2.3 Performance Measurement - an effective management tool
Measuring performance is important because it identifies performance gaps between
current and desired performance and provides indication of progress towards closing
those gaps. Carefully selected KPIs identify precisely where to take action to improve
performance (Weber & Thomas, 2005). Performance measurement is also an effective
management tool to measure the direction and speed of change implemented by the
company and plays an important role in the improvement of progress (change) towards a
better performing organization. Therefore, we need to formulate appropriate
performance indicators that are directly linked with company’s strategic objectives
(Gasperz, 2003). Measuring maintenance performance helps us identify the factors
causing poor performance, and provides an opportunity to improve company’s profits.
Besides, performance measurement is also a way for the management to evaluate the
condition of its systems and make a decision relating to maintenance policy adapted by
the company. Therefore, improving the effectiveness of maintenance function will play
a critical role in a company's ability to compete on the basis of cost, quality and delivery
performance (Pintelon Gelders, & van-Puyvelde, 2000).
1.2.4 Driving Factors behind Maintenance Performance Measurement
Maintenance works as an important support function in business operations with
significant investment in physical assets and plays an important role in achieving
organizational goals (Tsang, 2002). The issues and challenges associated with MPM
19
concern relevance, interpretability, timeliness, reliability, validity, cost & time
effectiveness, ease of implementation, and maintenance for regular use by stakeholders.
Some of the important driving factors behind demands on maintenance performance
measures are:
I. Measuring value created by the maintenance: The most important reason for
implementing maintenance performance system is to measure the value created
by maintenance process. One must assess that what is being done is what is
needed by the business process, and that the maintenance output is
contributing/creating value for the business.
II. Justifying investment: The second basic reason for measuring maintenance
effectiveness is to justify the organization's investment made in maintenance
function, in order to verify if the investment made is producing proper return on
the resources that are being consumed.
III. Revising resource allocations: The third basic purpose for measures of
effectiveness is to determine if additional investment is required and to justify
the investment made; management needs to maximise the use of resources
allocated.
IV. Health safety and environmental (HSE) issues: The fourth reason is to
understand the contribution of maintenance towards HSE issues. A poor
maintenance performance can lead to accidents (safety issue) and pollutions
(health hazards and environmental issues), besides encouraging an unhealthy
work culture and environment.

20
V. Focus on knowledge management: Many companies are focused on effective
management of knowledge in order to stay competitive. Furthermore, technology
is ever changing and is changing faster in the new millennium. This has brought
in new sensors and embedded technology, information and communication
technology (ICT), and condition-based inspection technology such as vibration
analysis, spectroscopy, thermography and others, which is replacing preventive
maintenance with predictive maintenance. This necessitates a systematic
approach for the knowledge growth in the field of specialization.
VI. Adapting to new trends in operation and maintenance strategy: New operating
and maintenance strategy is adopted and followed by industries in quick
response to market demand, for the reduction of production loss and process
waste. MPM system measures the value created by the maintenance.
VII. Organizational structural changes: Today organizations are trying to adopt a flat
and compact organizational structure. A virtual work organization, and
empowered, self-managing, knowledge management work teams and
workstations. All these innovations need to integrate the MPM system to provide
a rewarding return for maintenance services.
1.2.5 OEE – TPM’s Key Performance Indicator
The efficiency and effectiveness of the maintenance system, now, play a pivotal role in
the organization's success and survivability. Traditional accounting based measures to
evaluate performance have been replaced by KPIs; therefore, the maintenance
management system's performance needs to be measured using appropriate KPIs.

21
KPIs are the metrics (a metric is a standard of measure) that an organization chooses to
use as their measures of process performance. They can vary among industries and
among individual processes. Some typical KPIs for manufacturing and maintenance
include; operating cost, asset availability, lost time injuries, number of environmental
incidents, OEE, operational availability, return on investment (ROI), and asset
utilization. In this research study, OEE will be used in order to evaluate the efficiency
and effectiveness of maintenance management performance, in Malaysian palm oil
mills. OEE has been selected for ease of grasp, understanding, and interpretation by the
maintenance management and technicians alike. Most other maintenance optimising
models, such as Markov decision processes, are stochastic in nature, which are not only
difficult to grasp but also difficult to understand and interpret and are barely practitioner
friendly.
OEE is a hierarchy of metrics which evaluates and indicates how effectively a
manufacturing operation is utilized. The results are stated in a generic form which
allows comparison between manufacturing units in differing industries. It is not however
an absolute measure and is best used to identify scope for process performance
improvement, and how to get the improvement. If for example the cycle time is reduced,
the OEE can also reduce, even though more products are produced for less resource.
Another example is if one enterprise serves a high volume, low variety market, and
another serves a low volume, high variety market. More changeovers (set-ups) will
lower the OEE in comparison, but if the product is sold at a premium, there could be
more margins with a lower OEE. OEE measurement is also commonly used as a KPI in
conjunction with lean manufacturing efforts to provide an indicator of success.

22
The goal of TPM is to maximize equipment effectiveness, and OEE is used as a measure
(Waeyenbergh & Pintelon, 2002). Nakajima (1988) believed that OEE measurement is
an effective way of analyzing the efficiency of a single machine or an integrated
manufacturing system, and it is a function of availability rate, performance rate, and
quality rate. TPM helps raise the value of OEE by supplying a structure to facilitate the
assessment of losses, and subsequently giving priority to dealing with the more serious
offenders (Eti, Ogaji, & Probert, 2004). Section 1.2.6 explains the relevance of the
preceding emphasis on importance of evaluating maintenance management performance
in Malaysian palm oil mills.
1.2.6 Malaysian Palm Oil Industry – an overview
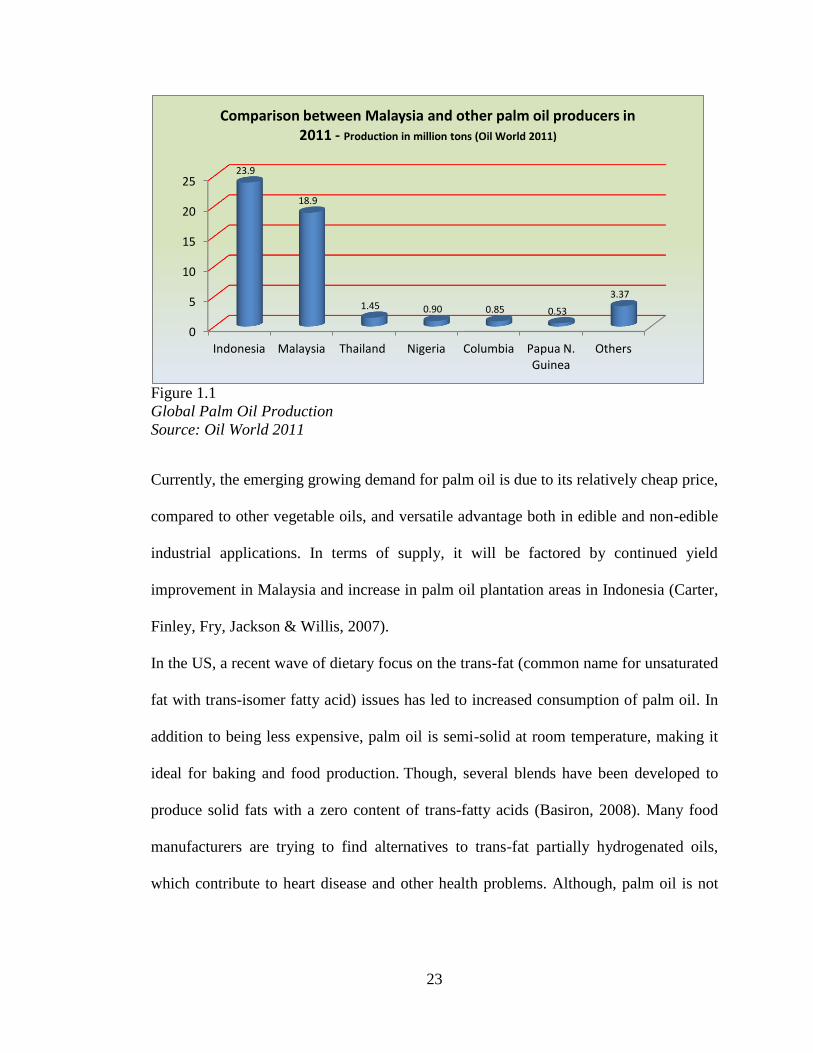
Globalization has expanded the Malaysian palm oil market to over 150 countries.
Malaysia in 2011, with 18.9 million tons production and 17.99 million tons of export,
accounted for 46% of world exports (Figure 1.1). However, over the years, Malaysia has
been losing her market share to her closest rival, Indonesia (MPOB, 2012).
Though, palm oil is predominantly used for food applications, its non-food use is
growing at a fast pace. Non-food uses of palm oil and palm kernel oil (PKO) are either
directly or through the oleo-chemical route. Direct applications include; the use of crude
palm oil (CPO) as a diesel fuel substitute, drilling mud, soaps and epoxidised palm oil
products, polyols, polyurethanes, and polyacrylates.
23
Figure 1.1
Global Palm Oil Production
Source: Oil World 2011
Currently, the emerging growing demand for palm oil is due to its relatively cheap price,
compared to other vegetable oils, and versatile advantage both in edible and non-edible
industrial applications. In terms of supply, it will be factored by continued yield
improvement in Malaysia and increase in palm oil plantation areas in Indonesia (Carter,
Finley, Fry, Jackson & Willis, 2007).
In the US, a recent wave of dietary focus on the trans-fat (common name for unsaturated
fat with trans-isomer fatty acid) issues has led to increased consumption of palm oil. In
addition to being less expensive, palm oil is semi-solid at room temperature, making it
ideal for baking and food production. Though, several blends have been developed to
produce solid fats with a zero content of trans-fatty acids (Basiron, 2008). Many food
manufacturers are trying to find alternatives to trans-fat partially hydrogenated oils,
which contribute to heart disease and other health problems. Although, palm oil is not
0
5
10
15
20
25
Indonesia Malaysia Thailand Nigeria Columbia Papua N. Guinea
Others
23.9
18.9
1.45 0.90 0.85 0.53
3.37
Comparison between Malaysia and other palm oil producers in 2011 - Production in million tons (Oil World 2011)
24
without its own contribution to heart disease, the focus on the trans-fat issue has resulted
in palm oil being considered more healthful than some other fats (USDA, 2008).
1.2.7 Industrial – biofuel use of palm oil
The industrial use of palm oil has also continued to grow dramatically; while the rapid
growth in the industrial use of palm oil before 2003/2004 was due to the expansion of
the oleo-chemical industry in Southeast Asia, recent increases were linked to the rise in
petroleum prices beginning in 2004. Palm oil is increasingly used as a fuel, especially in
the EU, though, food use still dominated the overall use of palm oil at 73.5% of
production for 2010 (USDA, 2010).
The major factor for growth in palm production is its role in sustainable energy
campaigns around the globe. European countries have promoted the use of palm oil by
injecting hundreds of millions of dollars into national subsidies towards bio-diesel.
Europe is now a leading importer of palm oil. Through the subsidizing of bio-fuels,
European governments have accelerated the demand for palm oil in Europe (USDA,
2008).
1.2.8 Sustainability and the Round Table on Sustainable Palm Oil
In response to the urgent and pressing global call for sustainably produced palm oil, the
Roundtable on Sustainable Palm Oil (RSPO) was formed in 2004. RSPO is a not-for-
profit association that unites stakeholders from seven sectors of the palm oil industry; oil
palm producers, palm oil processors or traders, consumer goods manufacturers, retailers,
banks and investors, environmental or nature conservation non-governmental
organizations (NGOs) and social or developmental NGOs in order to develop and
implement global standards for sustainable palm oil. The RSPO Principles and Criteria

25
for Sustainable Palm Oil Production (RSPO P&C) are the global guidelines for
producing palm oil sustainably. RSPO certification ensures that the palm oil so certified
meets the UN sustainability criteria; the triple bottom line, people, planet, and profit.
2011 figures indicate that 2.4 million tons, 13% of Malaysian palm oil production has
been RSPO certified (MPOB, 2012).
1.2.9 EUREPGAP, GAP and EU-RED Protocol
The Scope of the EUREPGAP protocol is defined in its document “EUREPGAP
protocol document version September 2001”, that sets out a framework for Good
Agricultural Practice (GAP) on farms which defines essential elements for the
development of best-practice for the global production of agricultural & horticultural
products. It defines the minimum standard acceptable to the leading retail groups in
Europe, however, standards for some individual retailers and those adopted by some
growers may exceed those described. This document does not set out to provide
prescriptive guidance on every method of agricultural production.
Objectives of EUREPGAP are to: Promote a clear understanding for implementing GAP
in the framework of integrated production with a food chain approach to assure quality
and safety of fresh fruits and vegetables; Analyze the scope of private certifications to
facilitate access of exports to high-value markets; Provide examples of implementing
country programs to meet the quality and safety requirements of import markets; and
Identify opportunities and difficulties in the horticultural sector to meet the quality and
safety requirements of import markets.

26
EU-RED Protocol - In April 2009, the Council of the European Union adopted directive
setting a common EU framework for the promotion of energy from renewable sources.
The aim of this legislative act is to achieve by 2020 a 20% share of energy from
renewable sources in the EU's final consumption of energy and a 10% share of energy
from renewable sources in each member state's transport energy consumption.
The European Union Renewable Energy Directive (EU-RED) and its sustainability
criteria have come into effect on December 5, 2010. The sustainability criteria are
related to two issues; Green House Gas (GHG) emissions of biofuels and the land used
to produce the biofuels. On palm-based biodiesel, the general default value for palm oil
defined in the EU directive is 19% (savings of GHG emissions as compared with fossil
fuels) which is below the 35% threshold for eligibility set in the EU-RED. All local
suppliers would need to show the data supporting that their biofuels have a greater
GHG) savings than the threshold value and they will be eligible. However, biofuels
without the sustainability criteria would not receive tax exemptions, subsidies or other
incentives from the EU 28-member states. Of Europe’s total vegetable oils import, palm
oil accounted close to 60% in 2007.
1.2.10 Concern over GMO Food
The consumer concerns against Genetically Modified Organism (GMO) will be an area
that will generate great interest in the near future. Results from a survey across the 15
EU countries showed that the general consumer concern about the GMO is high with
71% stating that they would not buy GMO products and 56% felt that GMO-based
foods are a danger to the environment. From the same survey, 95% of the consumers
27
want the right to choose whether or not to eat GMO based foods and 86% require
information on labelling to enable them to make a choice. This has forced food
manufacturers to avoid GMO soybean oil and provides an opportunity for palm oil.
Thus far, all particular shipments of palm oil from Malaysia are certified to be GMO
free. This will in no way jeopardize the current research in using biotechnology to
modify the composition of palm oil towards higher oleic content.
1.2.11 Loss of Market Share
Market Share is the yardstick to benchmark competitive strength in a sector by
comparing competing companies. If only the element of sales is used to measure
performance, it will not take into account the market conditions. Sales may increase due
to product popularity or decline in sales of CPO due to drought or recession. However,
by measuring market share, a company can exist with competitive strength. Increasing
market share is the most important objective of the corporate world. In terms of palm oil
competitiveness, Malaysia can assess her trading position compared to other countries
by continuously monitoring of her market share in key markets; China, European Union,
Pakistan, India, and USA (MPOB, 2008). Malaysia accounted for 46% of the world
exports production in 2011. However, over the years, Malaysia has been losing her
market share to her closest rival, Indonesia (Simeh & Kamarudin, 2009).
28
1.3 Problem Statement
1.3.1 Particular research has not been done in the field of “Maintenance
Management Performance Evaluation in Palm Oil Mills”
Thorough review, of local and international literature including Malaysian Palm Oil
Journals, shows that particular research has not been done in the field of “Maintenance
Management Performance Evaluation in palm oil mills”. A world class maintenance
department enhances the organization's ability to provide their product or service
(Kutucuoglu, Hamali, & Sharp, 2002; Mishra, Anand, & Kodali, 2007). Given the
strategic importance of effective maintenance management, it is imperative that palm oil
mills recognize the maintenance management role. The following sections identify some
of the gaps that exist and discuss the problematic areas that have the potential for the
palm oil mills to become more competitive, sustainable, and generate savings through
better performance; there is room for improvement.
1.3.2 SMEs poor contribution to Malaysian GDP
SMEs make up 99.2% of businesses in Malaysia, or over 567,480 business
establishments; 73.4% of the palm oil mills belong to SMEs (MPOB, 2010). Malaysian
government reiterated that it will carry on its efforts to promote SMEs which should, as
per government estimates, contribute 37% in the gross domestic product (GDP) of
Malaysia by 2020 as compared to 32% in the current financial year 2010 (SME News,
2010).

29
1.3.3 Maintenance a low priority in Malaysian SMIs
Though there are several maintenance strategies being practiced in the industrial world,
such as preventive maintenance (PM), TPM, condition based maintenance (CBM),
reliability centered maintenance (RCM); TPM is one the most practiced maintenance
strategy in the industrial world. Recent researchers (Shamsuddin, Masjuki, Hassan, &
Zahari, 2004) investigated the level of maintenance practices in SMEs in Malaysia and
remarked; it is evident from the data and information that equipment maintenance is still
a low priority. From the derived information, it can be inferred that lack of
understanding about the importance of equipment in organizational performance is one
of the main obstacles. Palm oil mills can improve their performance dramatically by
adopting globally practiced maintenance strategies, like TPM. TPM initiatives are
focused upon addressing major losses and wastes associated with the production
systems by affecting continuous and systematic evaluations of production system,
thereby inducing significant improvements in production facilities (Ravishankar,
Burczak, & Vore, 1992; Gupta, Gunalay, & Srinivasan, 2001a; Gupta, Sonwalker, &
Chitale, 2001b; Jurice, Sanchez, & Goti, 2006).
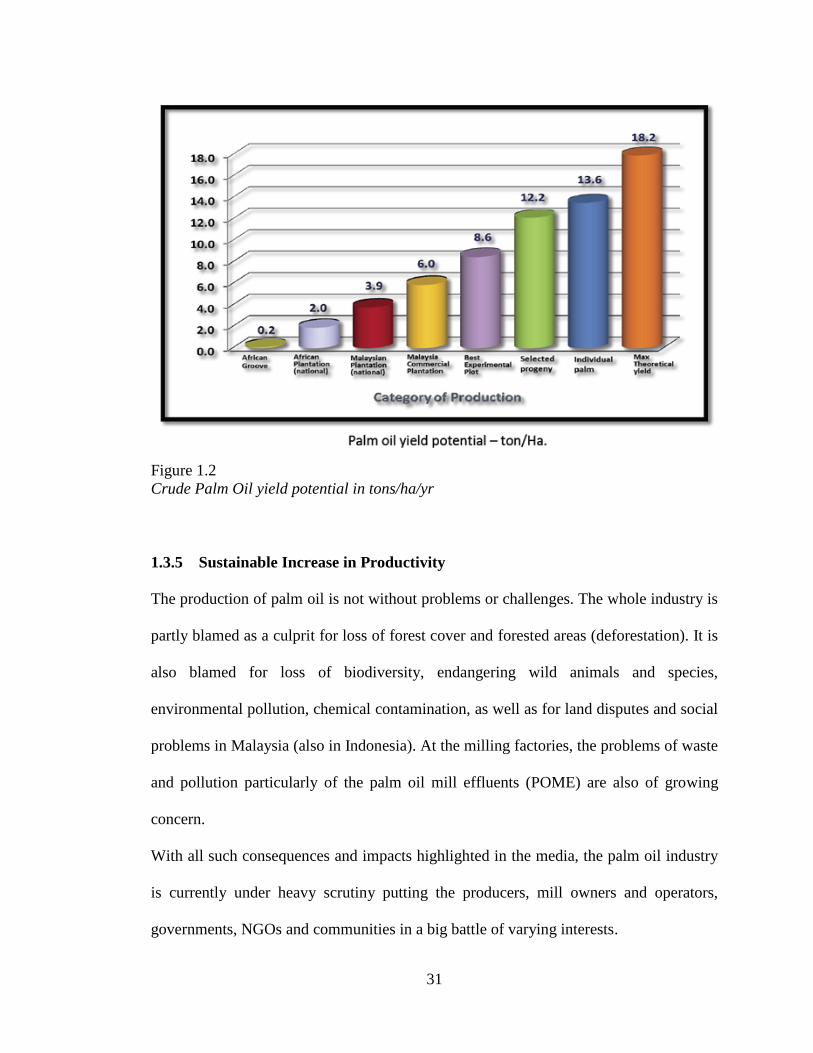
1.3.4 Low Productivity in palm oil mills hampering competitiveness
The global demand for palm oil is growing, thus prompting an increase in production in
Malaysia and Indonesia. Besides industrial use, the increasing demand for palm oil is
also ascribed to the increasing demand for biofuel as an alternative source of energy
particularly in Europe having a mandated biofuel utilisation target. The growth in palm
oil consumption has resulted in palm oil dominating the current global oil market. To

30
meet this growing demand, palm oil industry needs to better utilize maintenance
function to enhance productivity.
Malaysian Palm Oil Board (MPOB, 2010) and American Palm Oil Council (APOC,
2010), in a joint presentation entitled “Palm oil development and performance in
Malaysia” to the United States International Trade Commission (USITC), showed palm
oil productivity in Malaysia. National average yield of 3.66 tons / hectare of CPO is less
than half of those companies that have adopted best management practices (Figure 1.2).
Ineffective and inadequate implementation of good estate practices leads to low quality
output. A notable example is the poor control in the harvesting standards which results
in many unripe and under-ripe bunches being cut, leading to low oil extraction rate
(OER). The category of ripe bunches has been known to be as low as 68% although the
standard is set usually at over 90% (OPIEJ, 2002).
However, by adopting better maintenance and manufacturing management practices and
using better yielding species, much higher yields (10-15 tons/hectare) and OER (up to
30%) can be achieved. Present average OER is 20% of fresh fruit bunches (FFB) where
as best performers have reported OER as high as 30%. Biodiesel has a potential of 18
tons / hectare (MPOC, 2010). 40% of the total palm oil planted hectarage is with
smallholders farms; their productivity is even lower than the national average, part due
to lack of resources and managing skills at their disposal (MPOC, 2010).
31
Figure 1.2
Crude Palm Oil yield potential in tons/ha/yr
1.3.5 Sustainable Increase in Productivity
The production of palm oil is not without problems or challenges. The whole industry is
partly blamed as a culprit for loss of forest cover and forested areas (deforestation). It is
also blamed for loss of biodiversity, endangering wild animals and species,
environmental pollution, chemical contamination, as well as for land disputes and social
problems in Malaysia (also in Indonesia). At the milling factories, the problems of waste
and pollution particularly of the palm oil mill effluents (POME) are also of growing
concern.
With all such consequences and impacts highlighted in the media, the palm oil industry
is currently under heavy scrutiny putting the producers, mill owners and operators,
governments, NGOs and communities in a big battle of varying interests.
32
While the increasing trend on global demand for palm oil continues and with economic
benefits being weighed against the intensifying environmental and social problems, the
palm oil industry is now getting redressed through the lens of sustainable development.
Improved methods of palm oil production along with new and efficient technologies,
sound environmental and social policy measures, and greater stakeholders’ engagement
are among the new line of approaches to sustainable palm oil. Any growth to meet the
global demand will have to be met through a sustainable increase in productivity.
1.3.6 Elevating Maintenance Function - The Financial Business Case
In 2005, a study was conducted by Management Resources Group Inc., USA,
(DiStefano, 2005). Statistics from the United States Department of Commerce
(USDOC) were studied, including their measurement of what they call “Net Stock of
Private Fixed Assets” in various industries. This measurement is a close proxy of
Replacement Asset Value (RAV). In 2003, the latest statistics available from the
USDOC, there were $4.9 Trillion of physical assets on the ground in United States
industry. Four Quartile Benchmark Statistics of Maintenance Spend as a percentage, 2-
3%, of RAV was applied to dollarize the value of elevating Fourth, Third, and Second
Quartile plants to the First Quartile plants (top performers) in maintenance spend.
Industry wastes approximately $183 billion in excess maintenance spend annually in the
United States alone! Further, we can safely assume from numerous published case
studies that three to seven times the maintenance spend reduction benefit is
accomplished in operational benefits including increased uptime, improved quality,
more efficient production scheduling, reduced waste, reduced energy consumption, and
reduced inventories.

33
Taking the conservative end of that statistics, three times maintenance spend reductions,
one can see there is another $553 Billion in “Productivity Losses” that can be re-claimed
through the maintenance and reliability improvements; making the financial business
case in the United States alone $736 Billion in annual, recurring benefits (15% of the
RAV). With the total assets of Malaysian palm oil sector quoted (MPOC, 2010) at RM
93.3 billion (US$ 29.6 b); at 15% benefits recoverable rate, palm oil milling estimated at
10% of the sector, can potentially recover RM 1,399,500,000 (US$ 0.47 billion). It is,
therefore, crucial that Malaysian palm oil industry evaluates and improves the
maintenance management performance in order to re-claim this amount of maintenance
overspend.
1.3.7 Malaysian Development Plan 2020
Malaysian government unveiled its economic blue print for the next ten years in May,
2010, and identified six National Key Economic Activities (NKEAs) to be the engines
of growth to generate high growth rates including oil and gas, electronic and electrical,
tourism, agriculture and financial services. NKEAs identified will define the industrial
areas where the country has the greatest opportunity to maintain competitiveness.
Malaysia must complement on-going efforts to further develop sectors in which it has
competitive advantage and to build and capitalize on new and emerging sectors crucial
to its long-term growth. The Government emphasized that Malaysia cannot afford to
continue stale policies that do not address current and future economic imperatives. All
strategies and plans in the future need to be based on sustainable methods while taking
into account climate changes and food security. Under the New Economic Model, The
Economic Transformation Program (ETP) will provide mechanisms to strengthen the
34
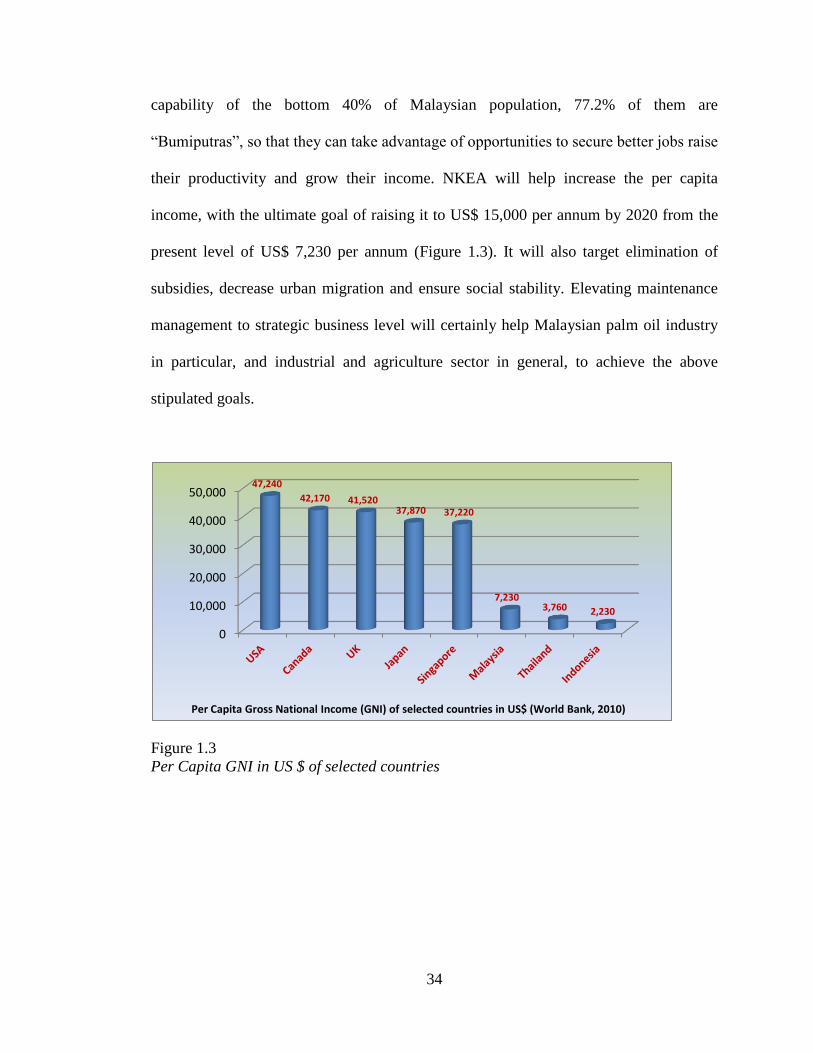
capability of the bottom 40% of Malaysian population, 77.2% of them are
“Bumiputras”, so that they can take advantage of opportunities to secure better jobs raise
their productivity and grow their income. NKEA will help increase the per capita
income, with the ultimate goal of raising it to US$ 15,000 per annum by 2020 from the
present level of US$ 7,230 per annum (Figure 1.3). It will also target elimination of
subsidies, decrease urban migration and ensure social stability. Elevating maintenance
management to strategic business level will certainly help Malaysian palm oil industry
in particular, and industrial and agriculture sector in general, to achieve the above
stipulated goals.
Figure 1.3
Per Capita GNI in US $ of selected countries
0
10,000
20,000
30,000
40,000
50,000 47,240
42,170 41,520 37,870 37,220
7,230 3,760 2,230
Per Capita Gross National Income (GNI) of selected countries in US$ (World Bank, 2010)
35
1.4 Research Questions
1. Why is the maintenance management performance of industrial organisations
evaluated?
2. What role an “efficient & effective” maintenance system management can play
in making Malaysian palm oil industry competitive in the 21st century?
3. What are the inefficiencies that plague the maintenance system management in
Malaysian palm oil mills?
4. Is Malaysian palm oil industry’s POME disposal practice sustainable?
5. Is there a knowledge gap between theory and practice in Malaysian palm oil
mills’ maintenance system management?
1.5 Research Objectives
1. To evaluate performance of maintenance system management at Malaysian palm
oil mills by measuring OEE
2. To assess process performance of CPO production in Malaysian palm oil mills
3. To identify and quantify cost savings in the maintenance system management of
Malaysian palm oil mills by benchmarking OEE with world class performers
4. To identify and quantify POME generated during CPO processing and evaluate
disposal practices for sustainability and environmental impact
5. To identify theory and practice knowledge gap in Malaysian palm oil mills’
maintenance system management
36
1.6 Scope of this Research Study
Palm Oil sector currently contributes 5-6% to the Malaysian GDP and provides
employment for 1.4 million workers (direct employment of 570,000). It triggers
upstream (oil palm plantations and relating equipment businesses) and downstream
activities (CPO refining, oleo chemicals, and oleo chemical derivatives industries) and
brings in revenues for national development and stability, with significant foreign
exchange earnings. It covers 68% of the cultivated area of Malaysia; oil palm plantation
industry is one of the few examples of an Agri-sector in the Developing World which,
with limited Government subsidies (extended only to farmers under 5 hectare land), can
successfully compete with the highly protected farmers in the G7 countries.
1.6.1 Malaysian Palm Oil Mills
Out of the 434 registered palm oil mills, 373 are operating in Malaysia (MPOB, 2010).
The processes used are broadly similar and primarily involve; transportation of FFBs,
sterilization, stripping, digestion and pressing, clarification, nut/fibre separation, nut
conditioning and cracking, cracked mixture separation, and kernel drying. The oil
extraction process, in summary, involves the harvesting of FFBs from the plantations,
sterilising and threshing of the FFBs to free the palm fruit, crushing the fruit and
pressing out the CPO. The crude oil is further treated to purify and dry it for eventual
storage and export. Large-scale plants, featuring all stages required to produce palm oil
to international standards, are generally handling from 3 to 60 tons (90 tons/h in larger
mills) of FFB/h. The large installations have mechanical handling systems (bucket and
screw conveyers, pumps and pipelines) and operate continuously, depending on the

37
availability of FFB. Boilers, fuelled by fibre and shell, produce superheated steam used
to generate electricity through turbine generators. Appendix - F shows list of palm oil
mill equipment (Ismail, Zulkifli, Makhtar, & Deros, 2009), and Figure 1.4 depicts the
CPO production process at MPOB’s palm oil mill at Labu in Negeri Sembilan.
Figure 1.4
CPO Processing at MPOB mill (MPOB, 2011)
The lower pressure steam from the turbine is used for heating purposes throughout the
factory. Latest processing operations are automatically controlled and routine sampling
and analysis by process control laboratories ensure smooth, efficient operation.
Although such large installations are capital intensive, OER of up to 30% can be
achieved from good variety of oil palms and quality FFBs.
Conversion of CPO to refined oil involves removal of the products of hydrolysis and
oxidation, colour and flavour. After refining, the oil may be separated (fractionated) into
38
liquid and solid phases by thermo-mechanical means (controlled cooling, crystallisation,
and filtering), and the liquid fraction (Olein) is used extensively as a liquid cooking oil
in tropical climates, competing successfully with the more expensive groundnut, corn,
and sunflower oils. Extraction of oil from the palm kernels is generally separated from
palm oil extraction, and often carried out in mills that process other oilseeds such as
groundnuts, rapeseed, cottonseed, shea nuts or copra. The stages in this process
comprise grinding the kernels into small particles, heating (cooking), and extracting the
oil using an oilseed expeller or petroleum-derived solvent.
The oil then requires clarification in a filter press or by sedimentation. Extraction is a
well established industry, with large numbers of international manufacturers able to
offer equipment that can process from 10 kg to several tons per hour. Palm oil
processors of all sizes go through these unit operational stages. They differ in the level
of mechanisation of each unit operation and the interconnecting materials transfer
mechanisms that make the system batch or continuous. The scale of operations differs at
the level of process and product quality control that may be achieved by the method of
mechanisation adopted (Panapanaan, Kujanpää, Soukka, Heinimö, & Linnanen, 2009).
1.6.2 Upstream Producers
Included in this category are the plantation companies and private estates, producers
under the government schemes, and the smallholders. Most of the 4.5 million hectares
(area planted by the end of 2009) of oil palm planted in Malaysia are under private
ownership, majority of which are by plantation companies (MPOC, 2010). The private
sector has been the main driver for growth in the development and production of palm
oil for more than two decades already as reflected by the increased plantation areas. The
39
sizes of plantation companies vary considerably from a few hundred hectares to more
than 100,000 hectares (Teoh, 2002). As such, plantation ownership area, as per 2009
MPOC data, stands to 60% for private estates (2.70 million hectares), 29% for
government/state schemes (1.30 million hectares), and 11% for smallholders (0.50
million hectares). The main producer under the government schemes is the Federal Land
Development Authority (FELDA) which operates 70 palm oil mills (MPOB, 2012).
1.6.3 Downstream Producers
Downstream producers can broadly be grouped under plantation-based companies;
FELDA, independent manufacturing companies, and subsidiaries or associates of
multinational companies. Plantation companies are involved in the downstream
processing activities as kernel crushing, palm oil refining, palm-based products
processing (e.g. for shortening, vanaspati, margarine, dough fat), and manufacturing of
cooking oils, specialty fats and oleo-chemicals. Besides being the largest upstream
producer FELDA is a major player in downstream processing, operating seven
refineries, six kernel crushing plants and two margarine plants. Currently, there are 60
palm kernel crushing plants and more than 50 refineries operating in Malaysia (MPOB,
2012). Majority of the operating refineries are, in one way or another, associated with
oil palm plantation and milling sectors, or both. Some of the refineries have also tied up
with manufacturers of specialty products and oleo-chemicals. Today, the palm oil
refining industry is one among the most important manufacturing sectors in Malaysia.
40
1.7 Significance of the Study
1.7.1 Palm Oil Mills and Clean Development Mechanism (CDM) Projects
Most CDM projects in palm oil mills are on waste-to-energy, co-composting, and
methane recovery with the latter being the most common. The study on GHG in the
milling process points that biogas collection and energy utilisation has the greatest
positive effect on GHG balance. On the other hand, empty fruit bunches (EFB) end-use
as energy and high energy efficiency of the mill have the least effect on GHG balance of
the mill. According to the UNEP – Year End (2008) Snapshot of the CDM, Malaysia
secured 145 out of 4237 projects, representing 3.5% of the total and ranking 5th in
securing the number of CDM projects. Some of these projects include renewable energy
projects, hydro and biomass from oil palm industry. Currently, only 20 out of 434
registered palm oil mills nationwide are involved in CDM-related projects. There is
huge CDM potential waiting to be explored. The renewable energy is not only cheaper
but also more efficient and environment-friendly than fossil fuels. The carbon credits
derived under the CDM Kyoto Protocol increase the economic viability of palm diesel
as a renewable fuel. As Malaysia is the world’s largest exporter of palm oil, it produces
some massive 168 million tons of palm oil biomass annually, the equivalent of about
330 million barrels of oil. Palm oil biomass offers great opportunities to be CDM
projects under the Kyoto Protocol. If this potential is fully tapped, the future promise
will be far and wide for Malaysia and for our climate.
41
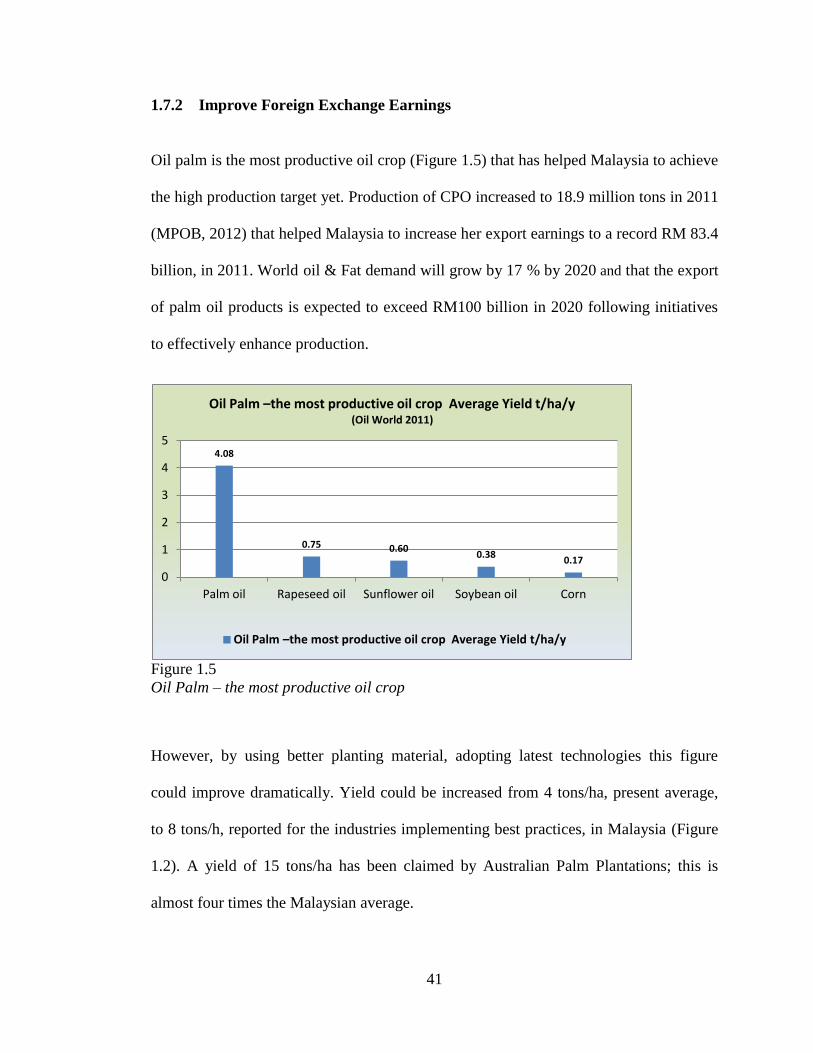
1.7.2 Improve Foreign Exchange Earnings
Oil palm is the most productive oil crop (Figure 1.5) that has helped Malaysia to achieve
the high production target yet. Production of CPO increased to 18.9 million tons in 2011
(MPOB, 2012) that helped Malaysia to increase her export earnings to a record RM 83.4
billion, in 2011. World oil & Fat demand will grow by 17 % by 2020 and that the export
of palm oil products is expected to exceed RM100 billion in 2020 following initiatives
to effectively enhance production.
Figure 1.5
Oil Palm – the most productive oil crop
However, by using better planting material, adopting latest technologies this figure
could improve dramatically. Yield could be increased from 4 tons/ha, present average,
to 8 tons/h, reported for the industries implementing best practices, in Malaysia (Figure
1.2). A yield of 15 tons/ha has been claimed by Australian Palm Plantations; this is
almost four times the Malaysian average.
4.08
0.75 0.60 0.38
0.17
0
1
2
3
4
5
Palm oil Rapeseed oil Sunflower oil Soybean oil Corn
Oil Palm –the most productive oil crop Average Yield t/ha/y (Oil World 2011)
Oil Palm –the most productive oil crop Average Yield t/ha/y
42
1.7.3 Improve Sustainability – triple bottom line
The concept of sustainability received worldwide recognition as a result of a report that
was published in 1987 by the World Commission on Environment and Development,
known as the Brundtland Commission, entitled "Our Common Future". The
commission, chaired by Norway's Prime Minister Gro Harlem Brundtland, developed
today's generally accepted definition of sustainability, stating that sustainable
development is "development that meets the needs of the present without compromising
the ability of future generations to meet their own needs." Basically, therefore, it is a
question of inter-generational equity. Sustainability demands that we pass on to our
children a world that is virtually no worse than the one we inherited. The private sector
is one step ahead of the public one in this respect. Sustainability must become a firmly
entrenched, mandatory component of all political and social decisions. This is the only
way to move on from theory to practice (Eisenberger, 2008).
The first United Nations Conference on Environment and Development (UNCED) held
in Rio de Janeiro focussed on the question of the relationship between environmental
and developmental goals. Both the Rio Declaration and, above all, Agenda 21 were
adopted at this conference. Agenda 21 is an action program for global sustainable
development that made the concept of sustainability a formal political principle. It was
now recognized that global environmental protection is only possible if economic and
social aspects are also taken into consideration. The EU formulated the three pillars of
sustainability at its Copenhagen Summit and with the Treaty of Amsterdam of 1997.
Known as the "three-pillar model of sustainability", the principle states that
sustainability not only comprises the natural heritage we pass on to the next generation
43
but also the economic achievements and social institutions of our society, such as
democratic political participation or peaceful conflict resolution. Sustainable
development thus rests on an ecological, an economic and a social pillar. If one of the
pillars gives way, the 'sustainability building' will collapse. As the result of the growing
pressure on the environment and increased scarcity of natural resources, sustainability is
increasingly understood so as to mean that the environment is not only on a par with the
other two pillars but also the basis of sustainability. Economic and social development
can only take place if fundamental ecological functions are secured. The triple bottom
line (TBL), also known as “people, planet, profit” or “the three pillars” of sustainability,
captures this expanded spectrum of values and criteria for measuring organizational and
societal success; economic, ecological, and social.
In the private sector, a commitment to CSR implies a commitment to some form of TBL
reporting. The concept of TBL demands that a company's responsibility be
to stakeholders rather than shareholders. In this case, "stakeholders" refers to anyone
who is influenced, either directly or indirectly, by the actions of the firm.
The oil palm is one of the richest sources of fat-soluble antioxidants such as carotenoids,
tocopherols, and tocotrienols; while much attention has been focussed on these fat-
soluble components, little emphasis has been given to the water-soluble components,
most of which are discarded during extraction of palm oil. For every ton of CPO
produced, mills’ generate 2.4 tons of POME which is currently considered industrial
waste and it requires extensive treatment before discharge. Though Malaysia enforces
stringent regulatory environmental standards, the challenge of converting such
agricultural / industrial waste to high value products has remained elusive until now.
44
1.7.4 Re-distribution of Wealth among Rural Population
Currently, Malaysia has about 18.55 million hectares of forest, compared to 4.5 million
hectares of land under oil palm. Oil palm covers 68% of agricultural land, the sector
employs 15 % of the workforce, 40% of palm planted acreage is by smallholders. As
stated earlier, palm oil currently contributes about 5-6% to Malaysian GDP and provides
employment for 1.4 million workers (direct employment of 570,000).
Oil palm cultivation has become a means to overcome rural poverty, FELDA managed
plantations provide employment for over 112,635 farmers. The land schemes are
provided with basic amenities such as piped water, electricity, communications, roads,
schools and health care, and offer further employment opportunities in these economic
activities. The New Economic Model (NEM) unveiled, recently, by the present
Malaysian government, will generate benefits for all Malaysians, irrespective of race
under its inclusive growth goal and approach. Agriculture is one of the six NKEAs that
are to be the engine of growth. This increase in income of rural Malaysians will help the
government to phase out the subsidies that are threatening the financial stability of the
country and help to meet its target of raising Malaysian ‘Gross National Income’ (GNI).
FELDA settlers’ income in 2008 was reported at RM 3865 / m (US$ 14,500/y)
compared to National Poverty Limit of RM 753 / m (US$ 2824/y). This has created
redistribution of wealth, peace, and stability in the country and has reduced migration
from the rural to the urban areas (Malaysian population is 70% urban and 30% rural).
45
1.7.5 Reduce Environmental Footprint – Green House Gases
Most industrialised countries have committed to significantly decrease GHG emissions
as a response to the challenge of climate change. The EU, as an example, aims to
decrease its GHG emissions by 20% from the level of 1990 by the year 2020. One
means of attaining this goal is by increasing the share of transport biofuels to 10%.
Thus, the markets of transport biofuels in the EU is expected to develop rapidly for the
next 10 years. Palm oil is becoming a more important raw material for transport
biofuels. Compared to other oil plants cultivated in Europe, palm oil has several
advantages such as remarkably higher annual oil yield and lower production costs.
Along with the rapidly increasing interest on palm oil use for transport fuels, serious
concern about the sustainability of palm oil production has also increased and has stirred
up new debates. However, palm oil industry is committed to guidelines of the RSPO
protocol. Based on Nikander’s (2008) study, the fossil carbon dioxide (CO2) emission
from palm oil mills is ‘19.77 gCO2e/MJbiofuel’, if emissions are allocated by mass. The
production of ‘NExBTL-diesel’ meets the EU requirement of 35 % GHG reduction with
palm oil.
The carbon footprint study carried out by Nikander (2008) stated that over 50% of life
cycle GHG emissions from the palm oil material chain arise from the raw material
processing in palm oil mill. Since palm oil is used as the main raw material for
‘NExBTL-diesel’, there is a need to focus on this product chain. To identify further life
cycle GHG reduction potential for palm oil-based diesel, this raw material processing
phase needs to be studied. It is the phase where the CPO is extracted from the fruit
bunches in a mill close to the oil palm plantation. Various studies on CPO milling point

46
to the high methane emission from POME treatment and the possibilities for GHG
reductions exist in mill co-product end-use as well (Schmidt, 2007; Yusoff & Hansen,
2007). Based on current typical industry practices for palm oil production in Malaysia,
using palm oil for bio-fuel applications renders an average net CO2 reduction of
approximately 60%. In other words, the CO2 emissions incurred in the palm oil supply
chain are only around 40% of the CO2 emissions generated by fossil fuels (Figure 1.6).
Figure 1.6
Carbon Dioxide (CO2) footprint of palm oil
Depending on production techniques, palm oil can reach even higher GHG savings of
between 80 and 90%, comparable with second generation bio-fuels. With further
improvements in yield and waste management, and by taking into account carbon
sequestration by the oil palm, this figure can be expected to go beyond 90% in the
future.
47
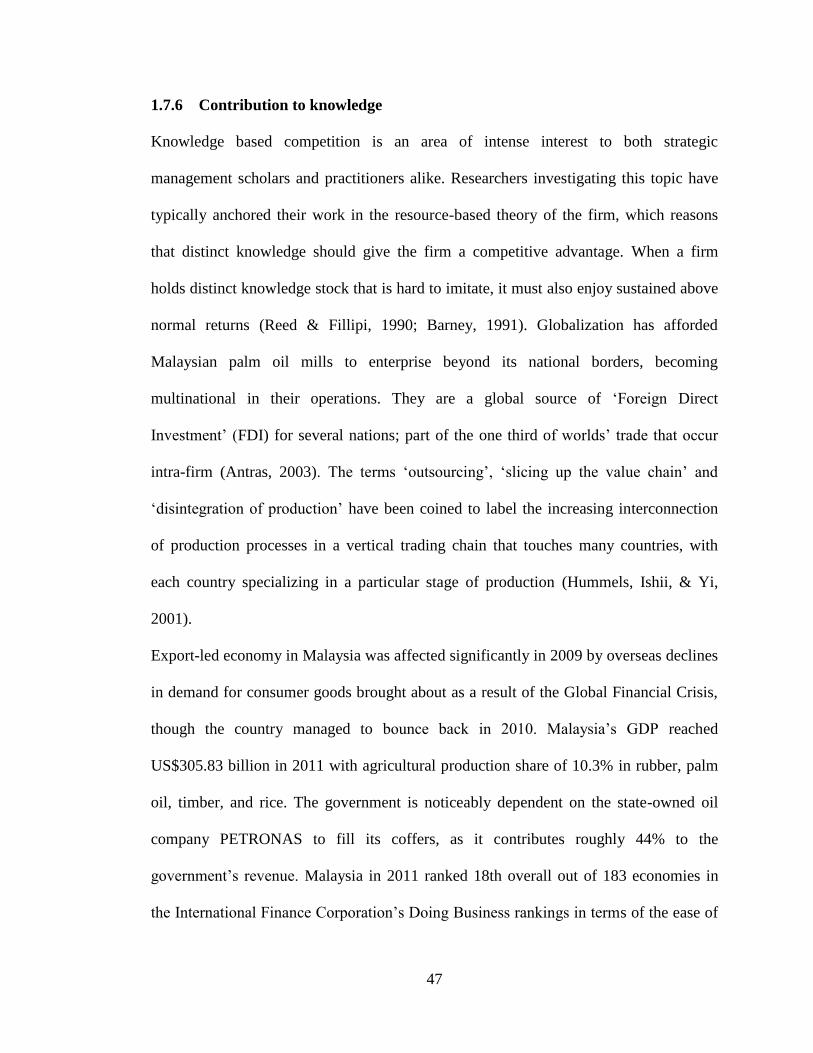
1.7.6 Contribution to knowledge
Knowledge based competition is an area of intense interest to both strategic
management scholars and practitioners alike. Researchers investigating this topic have
typically anchored their work in the resource-based theory of the firm, which reasons
that distinct knowledge should give the firm a competitive advantage. When a firm
holds distinct knowledge stock that is hard to imitate, it must also enjoy sustained above
normal returns (Reed & Fillipi, 1990; Barney, 1991). Globalization has afforded
Malaysian palm oil mills to enterprise beyond its national borders, becoming
multinational in their operations. They are a global source of ‘Foreign Direct
Investment’ (FDI) for several nations; part of the one third of worlds’ trade that occur
intra-firm (Antras, 2003). The terms ‘outsourcing’, ‘slicing up the value chain’ and
‘disintegration of production’ have been coined to label the increasing interconnection
of production processes in a vertical trading chain that touches many countries, with
each country specializing in a particular stage of production (Hummels, Ishii, & Yi,
2001).
Export-led economy in Malaysia was affected significantly in 2009 by overseas declines
in demand for consumer goods brought about as a result of the Global Financial Crisis,
though the country managed to bounce back in 2010. Malaysia’s GDP reached
US$305.83 billion in 2011 with agricultural production share of 10.3% in rubber, palm
oil, timber, and rice. The government is noticeably dependent on the state-owned oil
company PETRONAS to fill its coffers, as it contributes roughly 44% to the
government’s revenue. Malaysia in 2011 ranked 18th overall out of 183 economies in
the International Finance Corporation’s Doing Business rankings in terms of the ease of
48
doing business. For Malaysia to remain competitive, it is exigent that its resources are
utilized efficiently and effectively to produce goods and services. Effective planning,
implementation, and control of industrial production processes can ensure smooth and
efficient operations. Production management responsibilities include the traditional,
efficient and effective, use of “four M's”; men and women, machines, methods,
materials & money. Managers are expected to maintain an efficient production process
with a workforce that can readily adapt to new equipment and schedules. They may use
industrial engineering methods, such as time-and-motion studies, to design efficient
work methods. They are responsible for managing both physical (raw) materials and
information materials (paperwork or electronic documentation). Of their duties
involving money, inventory control is the most important. This involves tracking all
component parts, work in process, finished goods, packaging materials, and general
supplies. The production cycle requires that sales, financial, engineering, and planning
departments exchange information such as sales forecasts, inventory levels, and budgets,
until detailed production orders are dispatched by a production-control division.
Managers must also monitor operations to ensure that planned output levels, cost levels,
and quality objectives are met. Practitioners are obliged to make use of various modes
that Theory provides, through TPM and Lean concepts, to conduct manufacturing
operations efficiently and effectively.
This research study contributes to knowledge by identifying theory-practice gaps in
maintenance management performance in Malaysian palm oil mills pertaining to 4Ms
{man (labor), machines (equipment), methods (processes) materials (spares and
materials)}and offers realistic shop level solutions to bridge those gaps.
49
1.8 Thesis Organization
Chapter one elaborates on strategic importance of maintenance and TPM’s performance
indicator OEE. It discusses how measuring performance identifies gaps between current
and desired performance and affords solutions towards closing those gaps. It also
defines palm oil industry’s significance and its predicaments. Research scope, and
research questions and objectives are also elaborated.
Chapter two cites literature that qualifies history of maintenance management, its
strategies and performance measurement revolution. It accounts for Malaysian palm oil
industry’s scope, importance and challenges, sustainability and RSPO and TPM & OEE
via referencing a critical review and obstacles to their implementation. The chapter also
discusses ‘Scientific Management Theory’ (SMT), the underpinning theory for this
research, and theoretical framework.
Chapter three discusses research framework, model and methodology and gap between
theory and practice in maintenance management system at palm oil mills. It summarizes
data collecting issues and challenges, explains MMP Model and variables in this
research study and examines measuring instrument; its design, testing and validation.
Chapter four analyzes collection, enumeration, validity & reliability of data; critically
reviews maintenance inputs (labour, spare-parts, materials, & tools, and maintenance
contracted out); examines their correlation with OEE; and explains moderating variable,
maintenance strategy, TPM.
Chapter five presents conclusion, recommendations and contributions. It identifies
theory practice gaps in maintenance management performance at Malaysian palm oil

50
mills and defines shop-level solutions to bridge those gaps. Chapter also presents the
designs of generic, OEE calculating and maintenance daily service log template and
provides an e-maintenance system concept for power generating equipment in palm oil
mills.
51
CHAPTER TWO
2.0 LITERATURE REVIEW
2.1 Introduction
Most companies view production/operations as the sole customer of maintenance. The
end product consumer, however, is only viewed as a customer of maintenance when
equipment performance affects final product quality. This is the business environment in
which maintenance managers, through the maintenance function, contemplate to
improve equipment effectiveness and reliability. It is a recognised fact that maintenance
function is not just a cost center but a valuable business partner that can drive both
operating efficiencies and top-line growth. As organizations increase their investment in
capital intensive industries, the efficient and effective performance of maintenance
function offers a unique opportunity for reliable equipment performance leading to cost
savings and sustained profits. The maintenance organization’s management needs to be
transparent. To drive continuous improvement, corrective actions and remedies should
be apparent. Proper KPIs, such as OEE, should be used to assess maintenance
performance and to create transparency of the interdepartmental relationships; KPIs that
do not do this are useless and should be discarded.
The first part of the chapter defines the maintenance function, its history of
management, and maintenance strategies. It is followed by a review of the theory and
practice of measuring organizational performance; in particular maintenance
performance evaluation. The chapter, then, discusses Malaysian palm oil sectors’ scope,
importance and challenges. Subsequently, it elaborates underpinning theory, SMT, and
theoretical framework.
52
2.2 Scope of Maintenance Management
The manufacturing industry has experienced an unprecedented degree of change in the
last three decades, involving drastic changes in management approaches, product and
process technologies, customer expectations, supplier attitudes as well as competitive
behaviour (Ahuja, Khamba, & Choudhary, 2006). The changes in the current business
environment are characterized by intense competition on the supply side and heightened
volatility in customer requirements on the demand side. Increased customer demands,
generated by the process of constant change of the international and national
competitive environment, have affected the manufacturing organizations globally.
Confronted with stiff global competition, organizations are under great pressure to
enhance their competencies to create value for the customers and improve the cost
effectiveness of their operations on a continuous basis. Organizations that want to
survive in today's highly competitive business environment must address the need for
high quality, lower costs and more effective, swifter research and development (R&D)
(Gotoh, 1991; Hipkin & Cock, 2000). Moreover, need to attain shorter lead times,
shorter innovation times and reduced inventories have led to increasing demand on an
organization's preparedness, adaptability, versatility and flexibility (Schonberger, 1968;
Al-Najjar & Alsyouf, 2000). These changes have left their unmistakable mark on the
different facets of manufacturing organizations (Gomes, Yasin, & Lisboa, 2006).
Competitive pressures and changing production management paradigms, in recent years,
have increased the importance of reliable and consistent production equipment. The
equipment technology and development capabilities have become major factors that
53
demonstrate the strength of an organization and set it apart from others (Tsuchiya, 1992;
Schuman & Brent, 2005; Braglia, Carmignani, Frosolini, & Grassi, 2006).
With the trend to JIT production, lean, flexible and agile manufacturing, it is vital that
maintenance becomes integrated with corporate strategy to ensure equipment
availability, quality products, on-time deliveries and competitive pricing (Wireman,
1990; Luxhoj, Riis, & Thorsteinsson, 1997). Maintenance, being an important support
function in enterprise operations with significant investments in plants and machinery,
plays an important role in meeting this tall order. The inefficiencies in equipment
management have significant impact on organization's throughput, operating expense,
inventory, and profitability. As a result, managing equipment performance becomes a
challenging task for managers in manufacturing organizations; maintenance has thus
emerged as an essential core function in the manufacturing and processing industries.
The changing needs of physical assets and equipments over time have been putting
tremendous pressures on the enterprises to adapt proactive strategies for meeting the fast
changing requirements of the production systems (Teresko, 1992). The wave of change
has drastically transformed role of maintenance function in the organizations. The
competitiveness in world markets now drives the changes in how top management views
maintenance for growth and survival. It is evident from the literature that maintenance is
a strategic function, the impact of which influences almost all aspects of an
organisation's performance, including competitiveness (Madu, 2000), productivity
(Raouf, 1994), quality (Ben-Daya & Duffuaa, 1995) and safety (Holmgren, 2005). Thus,
improving the effectiveness of maintenance is crucial.
54
It is believed that what an organisation should measure depends on what it is trying to
achieve (Neely & Austin, 2002; Johnston & Pongatichat, 2008) and the continual
updating of relevant measures is viewed as essential (Bourne, Mills, Bicheno, Hamblin,
Wilcox, Neely, & Platts, 2000; Kuwaiti, 2004; Wouters & Sportel, 2005). In case of
palm oil mills, maintenance performance measurement is the focus of this research
study, that’s where the resources were deployed to get the pertinent data.
Several approaches have been proposed to evaluate maintenance performance in order
to improve its effectiveness (De Groote, 1995; Pintelon & Puyvelde, 1997; Dwight,
1999; Tsang, 1998; Tsang, Jardine, & Kolodny, 1999; Yam, Tse, Ling, & Fung, 2000;
Kutucuoglu, Hamali, Irani, & Sharp, 2001). Yet, the impact of some of these approaches
has been limited, because convincing top management of the necessity to implement
these approaches in their organisations is not easy when the results expected from the
improvement of the maintenance effectiveness, are not assessed in terms of financial
profit. This evaluation is difficult to realize, furthermore, because of the time-lag effect
characterizing the nature of maintenance, which is a support function of production and
operations (Pintelon & Puyvelde, 1997). In addition to the aforesaid constraints, there is
a lack of literature on scientific work evaluating the contribution of maintenance to an
organisation's profit creation (Oke, 2005). In order to avoid these problems and to
convince the top management, it is necessary to highlight these losses caused by the
ineffectiveness of maintenance management. However, to be able to recommend
necessary improvements to maintenance, it is not sufficient to demonstrate just the
negative impact of ineffective maintenance management on a company; it is also

55
essential to identify its causes and offer practical solutions. Section 2.3 elaborates on
definition of maintenance function as it is supported in literature.
2.3 The Maintenance Function
Maintenance has been defined as the combination of all the technical and administrative
actions, including supervision, intended to retain an item, or restore it to a state in which
it can perform a required function (IEC, 2006); whereas, maintenance management is
the process of directing maintenance organization effectively. The scope of maintenance
management should, therefore, cover every stage in the life cycle of technical systems
(plant, machinery, equipment, and facilities); specification, acquisition, planning,
operation, performance & evaluation, improvement, and disposal (Murray, Fletcher,
Kennedy, Kohler, Chambers, & Ledwidge, 1996).
Maintenance is considered as a process that monitors a technical system's capability to
deliver services, records problems for analysis, takes corrective/adaptive/perfective or
preventive actions, and confirms restored capability (Coetzee, 1998; Campbell &
Jardine, 2001; Soderholm et al., 2007; ISO, 2008; IEC, 2008). The purpose of the
maintenance process is to sustain the capability of a system to provide a service and
thereby achieve customer satisfaction (Liyanage & Kumar, 2003; Soderholm,
Holmgren, & Klefsjo¨, 2007; ISO, 2008; IEC, 2008).
A generic maintenance process consists of phases for management, support planning,
preparation, execution, assessment, and improvement (IEC, 2004). Hence, maintenance
is multidisciplinary and involves a wide range of actors, such as managers, process
56
owners, maintenance technicians, maintenance planners, and logistic managers.
Therefore, to be efficient and effective, the maintenance process should be horizontally
aligned with both the operation and modification processes and vertically aligned with
the requirements of external stakeholders (Liyanage & Kumar, 2003; Soderholm et al.,
2007).
The Maintenance Engineering Society of Australia (MESA) defines the maintenance
function as “the engineering decisions and associated actions necessary and sufficient
for the optimization of specified capability.” Capability in the MESA definition is the
ability to perform a specific action within a range of performance levels. The
characteristics of capability include function, capacity, rate, quality, responsiveness, and
degradation. When perceived in the wider context, the maintenance function is also
known as physical asset management (PAM), and should be well aligned with the
business strategies. Major maintenance strategies are discussed in section 2.5.
2.4 History of Maintenance Management
Prior to the early 1900s, maintenance was considered as a necessary evil. Technology
was not in a state of advanced development, there was no alternative for avoiding
failure, and the general attitude to maintenance was, “It costs what it costs.” With the
advent of technological changes and after the Second World War, maintenance came to
be considered as an important support function for operations, production, and
manufacturing. During 1950-1980, with the advent of techniques like preventive
maintenance and condition monitoring, the maintenance cost perception changed to: “It
can be planned and controlled.”
57
Therefore importance of the maintenance function has never been greater, due to its role
in maintaining and improving availability, performance efficiency, quality products, on-
time deliveries, the environment, safety requirements, and overall plant productivity
(Ahlmann, 1984; Al-Najjar, 1997; Riis & Thorsteinsson, 1997; Ahlmann, 1998; Mckone
& Wiess, 1998; Bevilacqua & Braglia, 2000; Al-Najjar & Alsyouf, 2003).
The approach to maintenance has changed dramatically over the last century (Blischke
& Murthy, 2000). Up to about 1940, maintenance was considered an unavoidable cost
and the only maintenance carried out was corrective maintenance (CM). Maintenance
was neither incorporated into the design of the system, nor was the impact of
maintenance on system and business performance duly recognized. The evolution of
operations research (OR) from its origin and applications during the Second World War
to its subsequent use in industry led to the widespread use of PM.
Since the 1950s, Operations and Reliability (O&R) models for maintenance have
appeared at an ever-increasing pace. These can be found in many books (Niebel, 1985;
Gertsbakh, 1997) and many review papers on the topic (Jardine & Buzzacot, 1985; Gits,
1986; Valdez-Flores & Feldman, 1989; Scarf, 1997; Cho & Parlar, 1991; Dekker,
Wildeman, & van der Duyn, 1997). These models deal with the effect of different
maintenance policies and optimal selection of the parameters of the policies. However,
the impact of maintenance actions on the business performance is not addressed.
In the 1970s, a more integrated approach to maintenance evolved in the government and
private sectors. New costly defence acquisitions by the US government required a Life
Cycle Costing (LCC) approach, with maintenance cost being a significant portion. The
close linkage between reliability (R) and maintainability (M) was recognized. The term
58
“R&M” became more widely used in defence-related systems. This concept was also
adopted by manufacturers and operators of civilian aircraft through the methodology of
RCM in the USA. In the RCM approach (Moubray, 1991) maintenance is carried out at
the component level and the maintenance effort for a component is a function of the
reliability of the component and the consequence of its failure under normal operation.
The approach uses failure mode effects analysis (FMEA) and to a large extent is
qualitative. At the same time, the Japanese evolved the concept of TPM in the context of
manufacturing (Tajiri & Gotoh, 1992). Here, maintenance is viewed in terms of its
impact on the manufacturing through its effect on equipment availability, production
rate and output quality. Lean Maintenance is another maintenance concept that takes its
lead from lean manufacturing. Lean Maintenance is a relatively new term, coined in the
last decade of the twentieth century, but the principles are well established in TPM. It
applies some new techniques to TPM concept, to render it a more structured
implementation path. Lean seeks to eliminate all forms of waste in the manufacturing
process including waste in maintenance.
Many changes in the internal environment of certain companies are taking place. These
changes include the increased use of mechanisation and automation of operations, such
as flexible manufacturing systems (FMS); robots; automatic warehousing systems;
automatic guided vehicles (AGVs); and the increasing trend of using the just-in-time
(JIT) and TQM philosophy (Yamashina, 1995; Luxhoj et al., 1997; Suito, 1998). These
changes tie up much invested capital. For example, companies within process industries
and chemical industries, such as oil mills, paper mills and refineries use extremely
expensive and fully automated production lines (Swanson, 2003). Furthermore, there is
59
increasing pressure to protect the ecological environment from the danger of harmful
industrial waste and pollution. Palm oil processing generates 2.4 tons of POME for
every ton of CPO produced. This is a large amount of waste that needs to be treated
before it is released to the environment. It also puts pressure on the palm oil mills that
the manufacturing plant should be used efficiently and effectively. The plant should
provide high quality products at a competitive price in addition to showing concern for
the environment and safety (Alsyouf, 2004). Furthermore, an increasing awareness of
maintenance and its influence on both industrial enterprises and society as a whole can
be recognised. Many researchers and practitioners have highlighted the total losses that
are caused by maintenance omission or ineffectiveness in maintenance (Ahlmann, 1984,
1998; Jardine, Fan, & Hong, 1996; Al-Najjar, 1997; Davies, 1998; Ljungberg, 1998;
Luce, 1999; Vineyard, Amoako-Gyampah, & Meredith, 2000; Holmberg, 2001).
Nevertheless, maintenance is still considered as a cost centre; 70 per cent of the
respondents of a survey conducted on 118 Swedish manufacturing companies
considered maintenance as a cost centre (Alsyouf, 2004). Furthermore, little research
has been done to highlight the impact of the maintenance function on overall plant
performance, i.e. productivity and profitability (Ahlmann, 1984&1998; Russell, 2001;
Kutucuoglu et al., 2001; Al-Najjar & Alsyouf, 2004). This lends an opportunity for the
research to be carried out for the palm oil sector. The following section briefly describes
various maintenance strategies which currently might be practiced by the industry.

60
2.5 Maintenance Strategies
In the highly competitive globalized scenario the maintenance function is being looked
on by manufacturing organizations as a potential source of cost savings and competitive
advantage. The effective integration of maintenance function with engineering and other
manufacturing functions in the organization can help to save extensive amounts of time,
money and other useful resources in dealing with reliability, availability, maintainability
and performance issues (Moubray, 2003). This has provided the impetus to the leading
organizations worldwide to adopt effective and efficient maintenance strategies such as
condition-based maintenance (CBM), RCM, TPM, over the traditional firefighting
reactive or breakdown maintenance (BDM) approaches (Sharma, Kumar, & Kumar,
2005). These maintenance strategies are discussed in the following sections.
2.5.1 Reactive or Breakdown Maintenance (BDM)
In reactive maintenance, which is also known as BDM, repairs are done to bring the
equipment back from failure stage to operational stage. It results in fluctuation in
production, higher down time and increase in the scrap and rework rate. Thus, the
ultimate effect is an increase in overall maintenance costs. No action is taken to detect
the onset or how to prevent frequent failures, which accounts for usually high
maintenance related costs. In a situation where customer demand exceeds supply and
profit margins are large, BDM is a feasible approach, as its main objective is to keep the
process running in order to maximize the availability. Traditionally, this type of strategy
was mainly practiced as an action-oriented or fire-fighting approach that solved
production problems. However, today stiff global competition and small profit margins
61
have forced maintenance managers to think and adapt cost effective and reliable
maintenance strategies (Pintelon & Gelders, 1992; Sheu & Krajewski, 1994). Kumar,
Antony, Singh, Tiwari and Perry (2006) impress upon the manufacturing organizations
to adapt lean and ‘Six Sigma’ (SS) principles, and business process improvement
strategies for achieving dramatic results in cost, quality and time by focusing on process
performance.
2.5.2 Preventive Maintenance (PM)
The main objective of carrying out PM is to reduce the frequent and sudden sporadic
failures by performing repairs, replacement, overhauling, lubrication, cleaning and
inspection at a specific predetermined interval of time say weekly, monthly, bi-monthly,
half-yearly or annually regardless of the condition of the equipment/component (Gits,
1992). Thus, PM reduces the probability of equipment breakdown by proper planning of
interval (age-based or calendar based), for carrying out PM tasks (Dekker, 1996). For
successful implementation of PM and assessment of the time for action, a decision
support system is required.
2.5.3 Condition Based Maintenance (CBM)
Predictive or CBM strategy reduces the probability of sudden sporadic failures with the
aid of diagnostics and timely intervention. Vibration-based maintenance (VBM)
involves periodic (VBMp) and continuous (VBMc) collection and interpretation of data,
which is based on deterministic and probabilistic models. Thus, it provides useful
information for diagnoses and prognoses. For instance, diagnostic equipments are used
to measure the physical conditions such as temperature, vibration, noise, corrosion, etc.
62
about the root cause(s) and failure mechanisms. Vibration technique is always preferred
in condition monitoring applied on rotating and reciprocating machines, but limitations
and deficiency in data coverage and quality reduces its effectiveness and accuracy
(Tsang, 1995; Yang, Liang, & Danyluk, 1999; Moubray, 2000). Nowadays, application
of CBM has become popular in process industries, such as paper mills, oil-refineries,
sugar mills and thermal power plants. In order to achieve an effective implementation of
“zero-failure” strategy the condition monitoring system helps to discover failure causes,
potential failures and mechanisms of failure. For instance, spectral analysis, one of the
most useful fault diagnostics tool, provides a basis for identification of failure
mechanisms, failure causes and failure modes in mechanical systems, such as rotating
and reciprocating machines.
2.5.4 Reliability Centered Maintenance (RCM)
Moubray (2000) defined RCM as a systematic approach used to optimize preventive and
predictive maintenance programs to increase equipment efficiency (uptime, performance
and quality) while targeting on minimizing the maintenance cost.
In RCM methodology the focus is on maintaining system function rather than restoring
equipment to an ideal condition. Earlier RCM methodology was restricted to the airline
and nuclear industries. But today it offers tremendous opportunities in areas such as
fossil power plants, oil-refineries, and other process industries. The primary objective of
RCM is to preserve system function. To attain this objective various failure modes that
cause functional failure are identified, then prioritized accordingly to reflect their
importance in system functioning and consequences of failure. Tools such as FMEA and

63
fault tree analysis (FTA) are used in RCM analysis. The process of RCM helps
determine the maintenance requirements of any asset and helps conduct analysis to
ensure the asset continues to perform the task without loss of function. It combines
several well-known risk-analysis tools and techniques such as FEMA and FTA that can
identify failure to identify problematic areas (Backlund & Akersten, 2003; Delzell &
Pithan, 1996; Fleming, 2006; Toomey, 2006).
2.5.5 Total Productive Maintenance (TPM)
TPM took root in the automobile industry and rapidly became part of the corporate
culture in companies such as Toyota, Nissan and Mazda as well as their suppliers such
as Nippondenso. It has also been introduced by other industries such as consumer
appliances, microelectronics, machine tools, plastics and many others.
Having introduced Preventive Maintenance, the process industries then began to
implement TPM. Since, there have been a few studies done in the area of TPM to
investigate the TPM relationship with manufacturing performance and business
performance, for instance: Brah & Chong (2004); Seth & Tripathi (2005); Tsarouhas,
2007; Ahuja & Khamba, 2007; Ahuja & Kumar, 2009; and Damiana & Ghirardo, 2010.
Moreover, some studies have been done that deal with the TPM implementation issues;
studies were related to the benchmarking of implementation practices to explore key
areas (Damiana & Ghirardo, 2010), identification of critical factors (Seth & Tripathi
(2005), strategies to support its implementation (Seng, Jantan & Ramayah, 2005), and
organization's inability to obviate resistance to change (Ahuja & Khamba, 2008b). The
relationship of TPM with business performance has also been addressed in some studies
(Bamber, Sharp & Hides, 1999; Cooke, 2000; Tsang & Chan, 2000; Jurice et al., 2006).
64
Initially, corporate TPM activities were limited to departments directly involved with
equipment such as production. However administrative and support departments, while
actively supporting TPM in production, are now applying TPM to enhance the
effectiveness of their own activities.
TPM as the name suggests consists of three words. Total signifies to consider every
aspect and involving everybody from top to bottom. Productive emphasises on trying to
do it while production goes on and minimize troubles for production. Maintenance
means keeping equipment autonomously by production operators in good condition;
repair, clean, grease, and accept to spend necessary time on it. Nakajima (1989), a major
contributor of TPM, has defined TPM as an innovative approach to maintenance that
optimizes equipment effectiveness, eliminates breakdowns, and promotes autonomous
maintenance by operators through day-to-day activities involving the total workforce.
According to Shirose (1995) an autonomous maintenance (AM) program is held with an
objective of accomplishing three purposes. First, to bring the production and
maintenance people together to accomplish a common goal that is to stabilise equipment
conditions and halt accelerated deterioration. Secondly, to help operators learn more
about their equipment functions, what common problems can occur and why, and how
those problems can be prevented by the early detection and treatment of abnormal
conditions. Thirdly, AM helps to prepare operators to be active partners with
maintenance and engineering personnel in improving overall performance and reliability
of equipment. TPM can be thought being integral to a World Class Manufacturing
Strategy that also involves JIT, TQM and employee involvement (McKone, Schroeder,
& Cua, 2001). There have been studies done in the area of TPM to investigate the TPM

65
relationship with manufacturing performance and business performance (Brah & Chong,
2004; Seth & Tripathi, 2005). In addition, some studies have also been done concerning
implementation issues of TPM related to the benchmarking of implementation practices
to explore: key areas (Ireland & Dale, 2001); and identification of critical factors
(Tsang, 2002). The relationship of TPM with business performance has also been
addressed in some studies (Bamber, Sharp & Hides, 1999; Cooke, 2000; Tsang & Chan,
2000). More importantly, Tsang and Chan (2000) revealed the importance of
management leadership, employee involvement, education and training, strategic
planning and communication for TPM in a high-precision machining company, located
in Pearl River Delta, China. Cooke (2000) also identified top management support,
alignment of management initiatives and change, employee training, autonomy to
employees and communication as important factors for the success of TPM in a
European context.
TPM is not a maintenance specific policy. It is a culture, a philosophy and a new attitude
toward maintenance. According to Chaneski (2002) TPM is a maintenance management
program with the objective of eliminating equipment downtime.
TPM describes a relationship between production and maintenance, for continuous
improvement of product quality, operational efficiency, capacity, assurance and safety
(Nakajima, 1988). It is an aggressive strategy that focuses on actually improving the
function and design of the production equipment (Swanson, 2001). TPM has been
accepted as the most promising strategy for improving maintenance performance in
order to succeed in a highly demanding market arena (Nakajima, 1988). Ahuja et al.

66
(2006), report that TPM implementation can significantly contribute towards
improvement in organizational behaviour in the manufacturing enterprises leading to
world class competitiveness. It is also considered to be an effective strategic
improvement initiative for improving quality in maintenance engineering activities
(Ollila & Malmipuro, 1999; Pramod, Devadasan, & Jagathy, 2007). There are three
ultimate goals of TPM; zero defects, zero accident, and zero breakdowns (Willmott,
1994; Noon, Jenkins, & Lucio, 2000).
TPM has been widely recognized as a strategic mechanism for improving manufacturing
performance by enhancing the effectiveness of production facilities (Dwyer, 1999;
Dossenbach, 2006). Wireman (1991) suggests that TPM is maintenance improvement
strategy that involves all employees in the organization and includes everyone from top
management to the line employee. It encompasses all departments including,
maintenance, operations, design engineering, project engineering, inventory and stores,
purchasing, accounting finances, and plant management. Strategic TPM implementation
programs have revealed a significant realisation of manufacturing performance
achievements leading to improved core competitiveness of organisations. TPM involves
everyone in the organisation, from top-level management to production mechanics, and
production support groups to outside suppliers (Ahuja & Khamba, 2008a, b). Nakajima
(1988) emphasizes that TPM comprises of a companywide equipment maintenance
program that covers the entire equipment life cycle and requires participation by every
employee. It is a production-driven improvement methodology that is designed to
optimise equipment reliability and ensure the efficient management of plant assets
(Robinson & Ginder, 1995). Another strategic outcome of TPM implementations is the
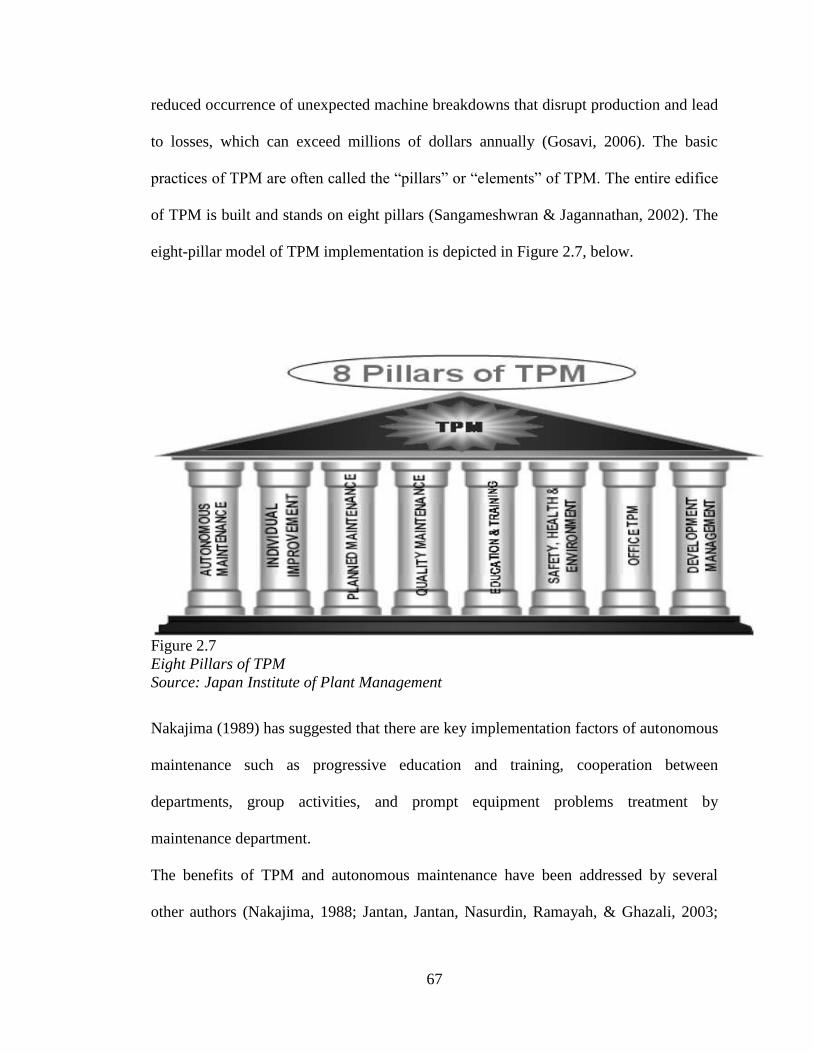
67
reduced occurrence of unexpected machine breakdowns that disrupt production and lead
to losses, which can exceed millions of dollars annually (Gosavi, 2006). The basic
practices of TPM are often called the “pillars” or “elements” of TPM. The entire edifice
of TPM is built and stands on eight pillars (Sangameshwran & Jagannathan, 2002). The
eight-pillar model of TPM implementation is depicted in Figure 2.7, below.
Figure 2.7
Eight Pillars of TPM
Source: Japan Institute of Plant Management
Nakajima (1989) has suggested that there are key implementation factors of autonomous
maintenance such as progressive education and training, cooperation between
departments, group activities, and prompt equipment problems treatment by
maintenance department.
The benefits of TPM and autonomous maintenance have been addressed by several
other authors (Nakajima, 1988; Jantan, Jantan, Nasurdin, Ramayah, & Ghazali, 2003;
68
Ahmed, Masjuki & Taha, 2005; Bamber,Sharp & Hides, 1999; Brah & Chong, 2004;
Cooke, 2000; McKone, Schroeder, & Cua, 2001; Seng Jantan & Ramayah, 2005).
I. Obstacles to TPM Implementation
It has been reported in the literature that TPM implementation is not an easy task
by any means. The failure of an organization to successfully implement a TPM
program has been attributed to the various obstacles including lack of
management support and understanding, lack of sufficient training, and failure to
allow sufficient time for the evolution (Bakerjan, 1994).
Another significant contributor for failure of TPM implementation program is
the organization's inability to obviate resistance to change. The resistance to
change takes a number of forms, that is, reluctance of individuals to change roles
(Riis et al., 1997; Cook, 2000), inability to create dissatisfaction with the present
situation (reason to change) (Maggard & Rhyne, 1992; Ireland & Dale, 2001),
and inability to change organizational roles and culture (Patterson, Kennedy, &
Fredendall, 1995; Lawrence, 1999). Moreover, Cook (2000) has attributed the
failure of TPM implementation program to the inability of management to
holistically implement the TPM practices at the workplace and highlights that
serious deviations have been observed between officially laid out TPM policies
and actual practices employed at workplace. Maintenance has been treated as an
unnecessary evil and seen as an uncontrollable black box in the operation and
development of manufacturing systems. Maintenance has been considered as a
low profile job with its scope limited to breakdown and preventive maintenance.
It has also been viewed as a reactive problem fixing and an operating expense to

69
be minimized (Tripathy, 2005; Seth & Tripathi, 2005). In another study, Ahmed
et al., (2005) observed that the level of maintenance practices in Malaysian’s
SMI is still low priority due to lack of understanding of the importance of
equipment in organizational performance, lack of technology and funding, and
training, etc. (Ahmed, Hassan, & Taha, 2005). Section 2.6 explains the evolution
of performance measurement.
2.6 Evolution of Performance Measurement
Performance measurement has its roots in early accounting systems. Johnson (1981)
quotes the Medici accounts as an excellent example of how a pre-industrial organisation
could maintain a good account of external transactions and stock without recourse to
higher-level techniques, such as cost accounting.
However, as industrial organisations developed, so did their needs for measures and
Johnson (1972) provides a detailed account of how current management accounting
developed in the USA between the 1850s and 1920s as industrial organisations moved
from piece-work to wages (Johnson, 1981), single to multiple operations (Johnson, 1975
& 1981), individual production plants to vertical integrated businesses (Johnson, 1975)
and individual businesses to multi-divisional firms (Johnson, 1978). As a result,
following the First World War, companies such as Du Pont, Sears, Roebuck, and
General Motors were starting to use sophisticated budgeting and management
accounting techniques (Chandler, 1962) such as standard costing, variance analysis,
flexible budgets, return on investment and other key management ratios. From these
beginnings, the use of budgets spread. A study showed that by 1941, 50% of well
70
established US companies were using budgetary control in one form or another (Holden,
Fish, & Smith, 1941) and by 1958, budgets appeared to be used for overall control of
company performance by 404 out of 424 companies (just over 95%) participating in the
study (Sord & Welsch, 1962).
However, between 1925 and the 1980s, there were no significant developments in
management accounting (Johnson & Kaplan, 1987) and by the 1980s traditional
accounting measures were being criticised as inappropriate for managing businesses of
the day. Criticism focused on the dysfunctional behaviour traditional accounting based
performance measures encouraged (Fry & Cox, 1989) especially when used
inappropriately (Miller & Vollmann, 1985; Johnson, 1992).
In particular, they were criticised for encouraging short-term decision making (Banks &
Wheelwright, 1979; Hayes & Garvin, 1982; Kaplan, 1984; and Pearson, 1985), their
inapplicability to modern manufacturing techniques (Turney & Anderson, 1989; Kaplan,
1984; and Kaplan, 1986) and the damage they were causing to business and, therefore,
the US economy (Hayes & Abernathy, 1980).
Traditional accounting based performance measures have been characterised as being
financially based, internally focused, backward looking and more concerned with local
departmental performance than with the overall health or performance of the business
(Johnson & Kaplan, 1987; Keegan, Eiler, & Jones, 1989; Neely et al., 1995; Olve, Roy,
& Wetter, 1999). As a consequence, in the late 1980s and early 1990s there was a great
interest in the development of more balanced performance measurement systems with
the creation of frameworks such as supportive performance measures matrix (Keegan et
al., 1989), the SMART pyramid (Fitzgerald & Moon, 1996), the Results/Determinants
71
Matrix (Fitzgerald et al., 1991; Fitzgerald & Moon, 1996) and the Balanced Scorecard
(Kaplan & Norton, 1992).
These frameworks overcame many of the shortcomings of traditional financially based
accounting systems. However, despite criticisms (Argenti, 1997), with the recent growth
of the concept of measuring the satisfaction of all the stakeholders (Ward, 1997; Doyle,
1994; Feurer & Chaharbaghi, 1995; Atkinson, Waterhouse, & Wells, 1997; Neely,
Adams, & Kennerley, 2002) new frameworks are still emerging such as the Performance
Prism (Neely et al., 2002). Otley (1998) points out those frameworks, on their own, are
not a complete solution. Frameworks do provide different perspectives for categorising
performance measures, allowing one to consider the balance between the demands on
the business. But, they do not tell a company what to measure (Neely, Mills, Gregory,
Richards, Platts, & Bourne, 1996) and there is no mechanism for specifying the
objectives which should be met (Ghalayini & Noble, 1996). Performance measurement
needs to be integrated into the management of the business (Lingle & Schiemann, 1996)
and there are now management processes developed to do just this.
2.7 The Performance Measurement Revolution
Maintenance, a support function of production, is an integral part of operations, which in
turn plays an important strategic role in business enterprise. So to appreciate the
importance of maintenance performance measurement, one has to understand the
broader concept of business performance measurement. What is it that makes the topic
so relevant to management today? After all, it has long been recognised that
performance measures are an integral part of the planning and control cycle (Barnard,
72
1962) and managers must have been planning and controlling the deployment of
resources since the first organisation was established. Indeed, Chandler (1977) argues
that most of the basic methods used to manage big businesses today were in place by
1910. In 1903, three Du Pont cousins consolidated their small enterprises with many
other small single-unit family firms. They then completely reorganised the American
explosives industry and installed an organisational structure that incorporated the “best
practice” of the day. The highly rational managers at Du Pont continued to perfect these
techniques, so that by 1910 that company was employing nearly all the basic methods
that are currently used in managing big business (Chandler, 1977).
Given that the “basic management techniques” have been used for so long and that
business performance measurement is undoubtedly one of these techniques, then surely
most organisations should have had well developed performance measurement systems
in place for many years by now. Even the most cursory examination of the academic and
practitioner literatures would confirm that this is not the case (Ashton, 1997;
Geanuracos & Meiklejohn, 1993; Kaplan, 1984; Neely, 1998; Neely et al., 1995).
Numerous authors discuss the problems with the performance measures used by
organisations today.
73
2.7.1 Financial Measures
Traditional financial measures are criticised because they:
i. Encourage short-termism, for example the delay of capital investment (Banks
& Wheelwright, 1979; Hayes & Abernathy, 1980).
ii. Lack strategic focus and fail to provide data on quality, responsiveness and
flexibility (Skinner, 1974).
iii. Encourage local optimisation, for example “manufacturing” inventory to
keep people and machines busy (Goldratt & Cox, 1986; Hall, 1983).
iv. Encourage managers to minimise the variances from standard rather than
seek to improve continually (Schmenner, 1988; Turney & Andersen, 1989).
v. Fail to provide information on what customers want and how competitors are
performing (Camp, 1989; Kaplan & Norton, 1992).
The same measures are criticised for being historically focused (Dixon, Nanni, &
Vollmann, 1990). Sales turnover, for example, simply reports what happened last week,
last month or last year, whereas most managers want predictive measures that indicate
what will happen next week, next month, or next year. However, with the advent of
sophisticated forecasting measures of consumer and production trends, managers can
now plan ahead to avoid surprises; the tools are out there that can be used to do just that.
Numerous managers suffer from data overload. Most firms have information systems
which generate at least some redundant performance reports. Comments such as “we
measure everything that walks and moves, but nothing that matters” are common. Yet

74
another problem with the performance measures used in many organisations is that they
are rarely integrated with one another or aligned to the business processes (Lynch &
Cross, 1991). Performance measures are also often poorly defined.
In 1951, GE established a “Measurement Project” which “was intended to develop
performance metrics that could be applied on a decentralised basis” (Meyer & Gupta,
1994). Johnson (1992) argues that “management by remote” control, i.e. managing by
the financials, only became popular after the 1950s, before which time senior managers
used the financial figures for planning, rather than control.
By the mid-1980s there were many vocal and well-respected critics of traditional
measures (Berliner & Brimson, 1988; Goldratt & Cox, 1986; Hiromoto, 1988;
Hopwood, 1984; Johnson & Kaplan, 1987; Miller & Vollmann, 1985; Richardson &
Gordon, 1980; Schmenner, 1988; Turney & Anderson, 1989). The question this raises,
however, is why now? What is it about managers in the late 1980s and early 1990s that
has made them so receptive to the message that their performance measurement systems
are obsolete? Why have these problems come to the fore today? Why have they captured
management’s attention? What sparked the performance measurement revolution? What
has been the impact of this revolution? Where and when will it end?
Between 1994 and 1996, according to the American Business Institute (ABI) database,
some 3,615 articles on performance measurement were published. This is equivalent to
one new article on business performance measurement appearing every five hours of
every working day. In 1996, new books on the subject appeared at a rate of one every
two weeks in the USA alone. Between 1950 and 1991, the membership of AIA
75
(American Institute of Accountants) and AICPA (American Institute of Certified Public
Accountants) grew from 16,062 to 301,410 - an increase of 1,877 per cent (Meyer &
Gupta, 1994).
Chartered financial analysts did not exist before 1963. Through 1971, about 3,000
financial analysts were chartered. From 1972 through 1981, some 3,800 more analysts
were chartered, but from 1982 through 1992 more than 8,200 new chartered financial
analysts were added (Meyer & Gupta, 1994).
2.7.2 Reasons for Redesigning Business Performance Measures
To be effective, every company has to redesign how it measures its business
performance. There are seven main reasons:
I. The changing nature of work - Traditional accounting systems allocate
overheads on the basis of direct labor. In the 1950s and 1960s this was
appropriate because direct labor often constituted in excess of 50% of the cost of
goods sold. By the 1980s, however, direct labor rarely constituted more than 5 or
10% of the cost of goods sold, because of the massive investments that had been
made in process automation. The net effect of this was that allocating overheads
on the basis of direct labor resulted in wildly erroneous product costs, which in
turn meant that managers made the wrong decisions (Kaplan, 1983; Schmenner,
1988). These arguments were so widely and vocally publicised that they resulted
in the development of alternative methods of product costing, most notably
activity-based costing and through-put accounting (Cooper, 1987a, b; Galloway
76
& Waldron, 1988a, b; 1989a, b). During the late 1980s and early 1990s, most of
the major consultancies were selling services based on these new methods of
costing. The associated marketing programs and the popularity of books such as
Johnson & Kaplan’s Relevance Lost meant that few in business could avoid
being exposed to the message. That, given today’s operating environment, the
assumptions underpinning the traditional methods of cost accounting were
fundamentally flawed.
II. Increasing competition - There can be little doubt that the level of competition
that firms face is increasing on a global basis. Businesses all around the world
are under continual pressure to reduce costs and enhance the value they deliver
to their customers. Manufacturing businesses, such as Toyota, have
revolutionised the way people think about operations through their search for
greater efficiency and effectiveness (Monden, 1993). The widespread acceptance
of so-called “Japanese manufacturing practices” demonstrate how successful
they have been, but the net effect is a continual rise in global performance
standards and customer expectations, which in turn lead to ever greater levels of
competition (Womack, Jones, & Roos, 1990).
In terms of performance measurement, these changes have had two impacts.
First, many organisations now seek actively to differentiate themselves from
their competitors in terms of quality of service, flexibility, customisation,
innovation and rapid response. They have been forced to do so because they now
find themselves competing in markets where value rather than cost is the primary
77
driver. Competing on the basis of non-financial factors means that these
organisations need information on how well they are performing across a broad
spectrum of dimensions. If a business bases its strategy around its ability to
customise products, then knowing whether it really is customising products, and
whether it is customising them rapidly and cheaply enough, is essential. The
traditional measures used to assess business performance simply do not provide
this insight. Hence businesses have been forced to change their measures
because they have changed their strategies. In doing so, many organisations have
realised one of the hidden benefits of matching measures and strategies - namely
that measures can encourage the implementation of strategy (Neely, Mills, Platts,
Gregory, & Richards, 1994). It is widely accepted that performance measures
influence behaviour. One only has to look at the academic obsession with
refereed journal papers to see evidence of this. Accepting Mintzberg’s (1978)
thesis that when an organisation realises that the strategy is a function of the
“pattern of decisions and actions” it takes, it then becomes clear that
appropriately designed performance measures can encourage the implementation
of strategy.
The second way in which the changing basis of competition has affected
business performance measurement is in the tendency for organisations to
downsize. Most organisations have achieved their downsizing goals by
eliminating middle management and “empowering” the remaining employees.
Anecdotal evidence suggests that empowering people can be very compelling,
but only if those people know the overall direction in which the business is
78
heading. Middle managers used to ensure that this was the case by translating
strategic plans into operational targets, monitoring progress and generally co-
ordinating the efforts and activities of their subordinates. Today, few
organisations find themselves with sufficient human capacity to operate in this
way. Hence they need new ways of communicating to their employees where the
business is heading. Business performance measures provide one such means of
communication.
III. Specific improvement initiatives - In response to increased competition,
numerous organisations have embarked upon specific improvement initiatives.
Some of these have come and gone, although most have been swept up into
generic themes, such as TQM, lean production, WCM. Few would dispute that,
of these, TQM has been one of the most pervasive. Open any undergraduate text
on this topic and you will find discussions of continuous improvement, Deming
(plan-do-check-act) cycles, statistical process control, Taguchi methods, and
quality costing. All of these tools and techniques have one thing in common.
They rely on performance measurement. The essence of continuous
improvement, for example, is to seek constantly ways in which products and
processes can be improved, so that greater value can be delivered to customers at
ever greater levels of efficiency. Before any organisation can determine what it
needs to improve, however, it has to establish where and why its current
performance falls short, hence the need for performance measures. Similar
arguments apply to statistical process control. Control charts provide a means of
checking whether processes, generally repetitive manufacturing processes, are
79
under control. That is whether the outputs they are producing vary only as much
as would be expected, given the norms of statistical variation. Answering this
question requires performance data to be collected. Without these data statistical
process control quite simply cannot be introduced. Of course, TQM is not the
only specific improvement initiative that has put performance measurement on
the agenda. The widespread business interest in benchmarking has been another
important driver. Xerox, largely through the efforts of Bob Camp, has been
particularly vocal on this topic (Camp, 1989). The rapid emergence of
benchmarking clubs and a number of high profile research studies (Andersen
Consulting, 1993, 1994; IBM Consulting & London Business School, 1993,
1994; Womack et al., 1990) have also heightened industrial interest. In essence,
however, benchmarking studies, especially those which compare performance
rather than practice, are effectively structured applications of business
performance measurement. Data, which summarise the performance of different
businesses, are gathered and compared. Performance gaps, performance
shortfalls, even performance advantages are identified. Such studies are valuable
precisely because they provide rich performance insights. Often these
performance insights result in organisations realising that they need to achieve
radical performance improvements merely to survive, let alone prosper. One
method for achieving these is business process re-engineering (Hammer &
Champy, 1993). Instead of seeking to optimise the efficiency of each operation
within each function, business process re-engineering calls for the horizontal
flows of information and materials to be considered holistically when seeking
80
performance improvements. This relies on a clear understanding of how the
outputs of one micro process impact upon the next micro process, which in turn
requires data to be fed back from the receiving process to the supplying process
(Slack, Chambers, Harland, Harrison, & Johnston, 1995). Few organisations
have measurement systems which allow this to happen, and rarely be the
traditional measures of business performance appropriate. Measures such as
labour utilisation, for example, might provide some insight into how efficiently a
process is running, but provide no indication of the impact the outputs of one
process have on the next process in terms of quality and time. One of the first
things organisations realise, when they begin to re-engineer their processes, is
that once they have done so they will have to re-engineer their measurement
systems.
IV. Changing organisational roles - The 1980s and 1990s have seen subtle changes
in organisational roles. Many of the most vocal critics of traditional performance
measurement systems have come from the academic accounting community. As
the force of their arguments has gathered strength, the professional accounting
associations have reacted. In the UK, both the Chartered Institute of
Management Accountants (CIMA) and the Institute of Chartered Accountants of
Scotland (ICAS) regularly organise conferences and workshops on non-financial
performance measurement. Both of these bodies encourage their members to
take a more active role in the development of balanced measurement systems,
arguing that the role of the management accountant is to provide the
management information necessary for running a business, rather than merely

81
the financial information required for external reporting. Human resource
managers and personnel managers are another group of business professionals
who are now taking a more active role in business performance measurement.
There appear to be three reasons for this. First, performance measures tend to be
integral to performance management systems - goal setting, measurement,
feedback and reward (IPM, 1992) and these generally fall within the remit of the
human resource function. Second, there is considerable debate as to whether
performance measures should be linked to reward - again an issue which
concerns human resources. Finally, many organisations have been through
substantial downsizing programs in recent years. One of the challenges these
organisations face is motivating the people who remain once the downsizing
program has been completed. There are several examples of firms using
performance measures to achieve this on the grounds that performance measures
help clarify performance expectations, which in turn allow more discretion to be
given to individuals as the boundaries within which they have to work become
more obvious.
V. Changing external demands - Organisations today are subject to a wide variety
of external demands, each of which has implications for business performance
measurement. Deregulation in the UK’s power generation, telecommunications
and water industries, for example, has resulted in the establishment of various
regulators. These regulators demand that the firms which fall under their
jurisdiction achieve certain performance standards and have the power to fine
those which fail to do so. To enable the regulators to assess whether the required
82
standards are being met, firms in each of these industries have to submit detailed
performance statistics on a regular basis. Businesses are being judged on
sustainability aspect of their performance; the triple bottom line – people, planet
and profit. Some customers today not only expect high levels of service, but also
expect firms to operate in specific ways. The extent to which a customer can
influence the way in which their supplier works is a function of many factors, a
key one being power. Ford, for example, used their power as a major purchaser
of automotive components, to demand that their accredited suppliers introduce a
scheme known as quality operating system (QOS). Basically, QOS is a
performance measurement process. Suppliers to Ford are expected to identify six
key business parameters, record the relevant data in a format approved by Ford
and submit the information to Ford on a monthly basis. When they introduced
the scheme, Ford declared that they expected all accredited suppliers to show
improvement in the majority of these parameters on an annual basis if they
wished to remain accredited. In many ways, QOS is simply an extension of the
various supplier accreditation schemes that came into being through the 1980s
and beyond. In the automotive industry, moves have been made to rationalise
these schemes as suppliers were being forced to achieve accreditation to slightly
different standards by each of their major customers. These accreditation
schemes were introduced for two reasons. First, to enable cost in the customer-
supplier relationship, especially that associated with multiple inspections, to be
reduced. Second, to help customers decide with which suppliers they should
concentrate their business, as they sought to rationalise their supply base. As
83
more and more organisations moved down this route, more and more suppliers
are being asked to submit themselves for audit, again a form of business
performance measurement. So once again external demands, i.e. those external
to the business, come into play, as organisations are forced to improve their
performance data in preparation for these audits.
VI. Power of information technology - The final driver in the performance
measurement revolution is undoubtedly the power of information technology
(IT). Not only has this made the capture and analysis of data far easier, but it has
also opened up new opportunities for data review and subsequent action. Indeed
the considerable effort that is being exerted by supermarkets on data mining is a
case in point. The electronic point-of-sale systems used in most supermarkets
provide an opportunity to monitor individual buying patterns and tailor discount
offers to them to encourage them to shop in particular stores. Of course IT plays
a role not only in data capture, but also in data analysis and presentation. There
has been a rapid growth in demand for management information systems and
executive information systems in recent years.
2.8 Who Needs to Monitor Maintenance Performance and Why?
Performance measurement is integral to business improvement; it is also well-
established in the literature on performance evaluation that the performance of an
organization should be appraised simultaneously, both in terms of its efficiency in
resource utilization process and effectiveness in realizing the pre-determined goals
(Mouzas, 2006; Asmild, Paradi, Reese, & Tam, 2007). This is because the overall
84
performance measure has been derived as the product of efficiency and effectiveness
measures, thereby neglecting either of these, provides an incomplete picture of the true
performance of an organization (Ho & Zhu, 2004; Ho, 2007).
Though, performance can be defined as an appropriate combination of efficiency and
effectiveness, there seems to be some inconsistency in the use of these terms in the
existing literature on the subject matter. For the managers, these terms might be
synonymous but each of these has their own distinct meaning.
While commenting on effectiveness, Keh, Chu, and Xu, (2006) observed that a measure
of effectiveness assesses the ability of an organization to attain its pre-determined goals
and objectives. Simply, an organization is effective to the degree to which it achieves its
goals (Asmild et al., 2007). In summation, effectiveness is the extent to which the policy
objectives of an organization are achieved. It is significant to note that though efficiency
and effectiveness are two mutually exclusive components of overall performance
measure yet they may influence each other. More specifically, effectiveness can be
affected by efficiency or can influence efficiency as well as have an impact on the
overall performance (Ozcan, 2008).
Revision to ISO 9004 came off the press in the last quarter of 2009. It is considerably
different from its predecessor; ISO 9004 exhibits’ the quality management principles
relating to continual improvement. The technical experts made bold efforts to address
market needs by producing a standard that would help organizations maintain and
improve their quality management systems over time. “Performance improvements” is a
great idea, but more potent question is “what is the value in improving performance?”
85
That answer is found in ISO 9004’s new title; “Managing for the sustained success of an
organization - A quality management approach.” It’s not good enough to achieve ISO
9001, proudly displaying the coveted certificate on the wall; to conform to the
requirements of ISO 9001, it’s important to maintain the quality management system
that has been established. It’s important to consistently fulfill requirements found in
multiple sub-clauses relating to establishing objectives (5.4.1), monitoring and
measuring product and processes (8.4), reviewing changes that could affect the quality
management system (5.6.3), and striving for continual improvement (8.5.1). The new
ISO 9004, particularly the annexes, is heavily inclined toward monitoring and
periodically assessing so that organisations can respond to change (ISO, 2009).
What gets measured gets done (Drucker, 1994); management requires performance
information to be able to control the maintenance process. Information should bear on
the state of the maintenance process and developments in it and the environment the
maintenance function operates in. It focuses on the effectiveness and efficiency of the
maintenance process, meaning its activities, organization and cooperation with other
organizational units. Here the authors discuss performance indicators for evaluation of
the maintenance activities only. Evaluation involves systematic, obdurate and
meticulous application of scientific methods to assess the strengths and weaknesses of
programs. It is a resource-intensive process; frequently requiring resources, such as,
evaluator expertise, labor, time and a sizeable budget (Rossi et al., 2004). Performance
measurement is needed on all of the three levels of control. In a practical situation this
means that performance indicators are needed by the maintenance manager, supervisors,
foremen, and engineers as well as planners. Performance indicators are a numeric value

86
for an aspect of a sub-process that isn’t influenced by related processes and is
representative as a measure for the effectiveness and/or efficiency of that aspect of the
sub-processes (Chemicals, 1991). The absolute value of such indicators compared to a
norm, to be chosen beforehand, or a trend in this value can be used to glean performance
levels.
2.8.1 Why Measure Maintenance Performance?
Maintenance is a supporting function in any organization, especially an industrial one. It
is part of the production process that transforms raw materials into final products.
Geraerds (1992) defines maintenances as the total of activities serving the purpose of
retaining the production units in or restoring them to the state considered necessary for
fulfillment of their production function. Traditionally, maintenance was mainly an
action-oriented function, the firefighters that solved production problems. Its objective
was to keep the process running, i.e. availability maximization. Little time was spent on
planning maintenance activities. This was called BDM or failure-based maintenance
(FBM), maintenance which will not be carried out until the event of failure (Geraerds,
1992). This strategy was feasible as long as customer demand exceeds supply and profit
margins were large. However, today we face global competition, small profit margins,
high safety awareness and strict environmental regulations. Maintenance management
tries to adapt to these changes by putting more emphasis on developing maintenance
concepts, i.e. the collection of rules that prescribe which maintenance activities have to
be performed and by what event these operations are initialized. Clearly, maintenance
management needs to analyze what maintenance operations need to be performed on
each item of equipment and how the maintenance needs to be initialized. The changes in

87
the organizational environment cause a need for maintenance managers to concentrate
on efficiency, safety and environmental concerns. Performance indicators are needed to
give maintenance management quantitative information on the extent to which these
goals are reached and what actions to take to improve its operations. There are means to
achieve maintenance control, so that maintenance costs can be reduced, productivity can
increase, safety of the process can be achieved and environmental regulations can be
fulfilled. These objectives of maintenance are omitted in the definition of maintenance
from a functional viewpoint, given by Geraerds (1992). The definition used by an
organization in the process industry includes most of these objectives explicitly
(Chemicals, 1991). All servicing activities are needed to ensure the availability of
capital equipment in an economical optimal way for the fulfillment of its designated
function. Maintenance in the discrete units manufacturing industry is different from that
in the process industry. These differences cause a need for the other specific
performance indicators, beyond the scope of this study. However, in the capital
intensive industries, production is generally on a continuous basis. Therefore,
availability of production equipment is even more important. This makes the
maintenance function an important part of such an organization, as well.

88
2.9 Description of the Maintenance Management Information System
Required to Measure Performance
Three levels of control can be distinguished, depending on the time horizon. At each
level certain decisions need to be made, for which performance indicators can be used.
The levels are:
2.9.1 Strategic Planning
Strategic planning is the decision-making process leading to the formulation of the
strategy of an organizational unit or the organization as such (Gits, 1991). In the
strategy, the objectives to be reached and the means with which to reach those
objectives are developed. For the maintenance function, the strategy is deduced from the
company strategy and the preferences of the production function. The selection or
statement from a maintenance point of view of the design requirements of production
units to be developed or purchased is considered to be made on this level. The LCC
theory, estimating all cost factors including maintenance during the life of the
production unit, can be used to support the selection or design decision.
2.9.2 Tactical Control
Tactical control consists of all decisions contributing to the policy making concerning
effective and efficient use of resources (Gits, 1991). This leads to categorization of
maintenance based on its urgency (time within which maintenance has to be performed)
and the influence that the production function has on scheduling of the maintenance
actions. On this level the capacity load per category is restricted; the volume flexibility
of the different capacities is limited as well as the work load of the maintenance

89
function. The decisions made in developing maintenance concepts for production units
are also considered on this level of control. These decisions include the efficiency of
different potentially effective maintenance rules or the selection of inspection
frequencies.
2.9.3 Operational Control
Operational control is the decision making process aimed at the effective and efficient
execution of specific activities. It concerns the short term allocations of maintenance
capacity to maintenance demand and results in work orders (Gits, 1991). Decisions
concerning to maintain now or later, maintain or replace, use contractors or work
overtime. This consideration concentrates on performance indicators that support
decisions at this level of control in the maintenance control system. Since data for
performance indicators originate from the maintenance management information system
(MMIS) used by the maintenance organization, they need to describe what they want the
MMIS to look like, if they want to glean useful performance information from it.
2.10 Maintenance Management Performance Evaluation
There are various key performance measuring tools being applied in the industry,
depending on the strategies adopted, however, TPM’s KPIs (Metrics) are described here,
in brief. For the purpose of this study, OEE has been described in detail. TPM seeks to
improve OEE, which is an important indicator, used to measure TPM. An overall 85-
95% of OEE is considered as world class and a benchmark for others (Blanchard, 1997;
McKone, Roger, & Kristy, 1999; Chand & Shirvani, 2000; Wireman, 2004).

90
2.10.1 Mean Time between Failures (MTBF)
The first metric for TPM is MTBF (Mean Time between Failures). This is measured by
machine, and for this metric, the larger number the better it is. This means that
breakdowns are less frequent, and that repair costs are lower. That can be measured as a
direct cost savings when compared on an annual or quarterly basis. Indirectly, less
downtime could mean more production output.
2.10.2 Mean Time to Repair (MTTR)
Mean Time to Repair (MTTR) is the second metric. For this metric, the smaller the
number the better it is. As TPM progresses, repairs are less serious and are quicker.
Tracking repair hours and showing an overall reduction is a direct cost savings. Another
cost savings is in avoiding expedite charges and added downtime by creating a spare
parts list and identify sources of critical components.
2.10.3 Percent Reactive Maintenance
The third metric is ‘Percent Reactive Maintenance’ (% Reactive). The smaller the
number the better it is. World class is 20% or less reactive and 80% preventive,
improvement, or scheduled maintenance. The best way to show direct cost savings for
this metric is when repairs that were previously outsourced can be done in-house
because of less reactive activity, and because of time spent improving maintenance
technicians' skills. Indirect benefits include using the same maintenance hours to speed
up machines or improve quality.
91
2.10.4 OEE and Maintenance Performance Evaluation
With the increasing awareness that maintenance not only ensures safety and track
performance, but also creates additional value in the business process, the Swedish Rail
Administration (Banverket, 2007) is treating maintenance as an integral part of the
business process, i.e. applying a holistic view of the infrastructure maintenance process
in order to fulfil customer requirements (Karlsson, 2005). Maintenance is an activity that
has a significant contribution in operation costs; approximately 30% of operation costs,
if the company is implementing an automated production system (Garg & Deshmukh,
2006). Therefore, measurement of maintenance performance has become an essential
element of the strategic thinking of assets owners and managers. Without any formal
measures of performance, it is difficult to plan, control, and improve the maintenance
process (Liyanage & Kumar, 2000).
Every factory attempts to be an effective, low cost producer. This effort is required in
today’s challenging environment when customers demand quality product at the best
value. Few factories attain and maintain high level productivity and low costs. Many of
these use a disciplined approach to identify the best improvements to make. They use
teams to eliminate the root problems that otherwise keep the factory from driving
towards continuously higher levels of effectiveness. In short, they have found the power
of OEE. World-Class manufacturing areas share two common characteristics. They are
data driven, and are led by synergistic multi-function leadership teams. Accurately
measuring and driving key success parameters that contribute to higher productivity for
92
both the area and the planet; OEE can help you better understand how well a
manufacturing area is performing, and identify what is limiting higher effectiveness.
Manufacturing systems are composed of equipment and machinery that combine to
transform materials and sub-assemblies into products that are either part for the next
step of manufacturing or finished goods. A significant amount of capital is often
invested to design, build, and implement a system so that products can be made
uniformly at a higher rate with minimal waste. Every business plan should include
projections about effectiveness of the proposed system and how well it will contribute to
the bottom line. The company should also be aware of the degree to which it is at risk if
the expected effectiveness is not attained and sustained.
Nearly every industry has multiple manufacturers, each competing for its share of the
market. Even a company with the best product may not stay in business if its expense
for getting the product to the customer is excessive, fierce competition usually exists.
Companies with the most effective factories will have the staying power to be the long-
term survivors. In short, factories are at the core of any manufacturing organization.
Staying in business requires building and maintaining effective factories.
At any given factory, a vast number of events occur simultaneously every workday. The
task of producing goods and maintaining equipment usually hold the central focus.
However, take a moment to think about all the activities which go on and how and when
they impact the manufacturing process. Decisions made in purchasing today set in
motion a timeline for each item ordered and used. How well a piece of equipment is
repaired today will influence some future runtime. In the spare parts warehouse, if a
93
bearing is accidently dropped on the floor today, and re-shelved for later use, the piece
of equipment that eventually uses it may have a shortened life. Approval or rejections of
various projects can affect overall operations for years to come. Hiring and training
decisions by human resources set the stage for subsequent events. In short, all the pieces
of a factory interlock; one event eventually affects all. Left on their own, all these
elements can create a chaotic, reactive environment full of surprises.
What makes the difference between world class manufacturers and the rest of the pack?
World-Class organizations have evolved from a factory of individuals to a factory of
coordinated teams working together with a common purpose. All areas have win-win
relationships with their interdependent areas, a relationship of interconnection. They
make certain that decisions are made correctly the first time. They balance production
and production compatibility appropriately. They are in control of the ‘big picture’; they
have engaged every one’s support in working toward a high level of excellence and
sustaining that position. The bottom line; they know where they are and where they are
going.
Having an effective factory is not the only requirement of a successful business. Many
other factors are also important. Which way is the economy going to move? Will the
competition cut prices? Is the product in demand? Will the product evolve into another?
What are the distribution channels for the product? Should the source of supply be in
one place or several? World-Class companies continually address these and other
questions as they shape and modify their business plans. World-Class companies are
known for another attribute. They are built around the concept that an affective factory
producing ‘good goods’ as needed to meet market demands is a valuable asset for any
94
company to have. This attribute is maintained both, short and long term. One of the
main metrics used to identify World-Class companies addresses how effectively
factories run their processes when scheduled to run. OEE is designed to provide this
number; yet most factories do not compute OEE or use it to set and maintain their
priorities (Hansen, 2001).
OEE is an index frequently used in the manufacturing industry to calculate the overall
equipment effectiveness of a production system or parts of it. The index itself was
presented as an overall metric in the TPM concept (Nakajima, 1988). OEE is an
aggregated productivity measure that takes into consideration the six big losses that
affect the productivity of equipment in production systems (Venkatesh, 2006).
Equipment failure, setup, and adjustments are related to the downtime and expressed in
terms of availability. Idling and minor stoppages, together with reduced speed, are
related to speed losses and expressed in terms of the performance rate. Finally, process
defects and reduced yield are related to defects and expressed in terms of the quality
rate. OEE itself multiplies the equipment's availability, performance rate, and quality
rate. The three factors involved in this calculation are independent of each other; i.e.
variations in one of the three factors will not affect the other two. Normally, OEE
figures can be found from 30-95% (Ljungberg, 1998; Ahlmann, 1995).
The definition varies among applications by different industries, and therefore it is
difficult to identify the ideal OEE figures as well as compare the OEE figures among
different companies (Jonsson & Lesshammar, 1999). Generally, availability is defined
as the ratio of the actual uptime and the intended uptime, the performance rate as the

95
ratio of the actual production time and the intended production time, and finally the
quality rate as the ratio of the good items produced and the total amount of produced
items. The availability and performance rate normally refer to the loading and operating
time (Nakajima, 1988) or the planned time and amount of production (De Groote, 1995).
Various aspects of OEE can be found in the literature. The availability metric is targeted
in these discussions. Some authors claim that the availability metric is influenced by
factors beyond the equipment itself, such as operators, facilities, the availability of input
materials, scheduling requirements and many more; i.e. the OEE metric reflects the
integrated equipment system and not the equipment itself (De Ron & Rooda, 2005,
2006). Others argue that the OEE metric does not take into consideration all the factors
that reduce the availability, such as the planned downtime and the lack of material and
labor (Ljungberg, 1998; Sheu, 2006). It is likely that the figure might be overstated and
the mill’s OEE would be higher than it genuinely is. Operators could also be tempted to
record ‘target’ figures. This means that if the operator is allowed to take 60 minutes to
set-up the mill equipment he or she may always take 60 minutes, or record 60 minutes,
even if it is less. It matters, if the mills do not find out the actual performance level of
their equipment, they may not utilize their equipment to its full potential and miss the
chance to improve OEE and performance of their investment.
2.11 Malaysian Palm Oil Industry: Scope, Importance & Challenges
2.11.1 Malaysian Palm Oil Industry and Palm Oil Mills
Oil Palm, a native of West and Central Africa, originally introduced to South East Asia
more than a century ago, is a miracle crop. It is prolific, perennial, provides forest cover
96
and requires only a marginal investment compared to other oilseed crops. It has an
unlimited future and is the most sought after oil for food, cosmetics and industrial uses.
The Malaysian Oil Palm industry has a long history of development and over the past 90
years from 1917 to 2007, it has achieved tremendous success and will continue to be one
of the main pillars of the Malaysian economy when projected over the next 100 years to
2107 (Wahid, Chan, & Masri, 2009).
The total oil palm planted areas showed a modest increase of 4.3% to 4.48 million
hectares in 2008. The national average FFB yield increased by 6% to 20.18 ton/ha/yr
compared to 19.03 t/ha/yr achieved in 2007; which is a record since 1994. In addition,
the expansion in matured area by 151534 hectare coupled with the improvements in the
national average OER to 20.18% also contributed to the higher CPO production. The
average oil yield/ha posted a 6.5% year-on-year increase to 3.7 t/ha, the highest since
1987. The production of CPKO also rose by 11.7% to 2.13 million tons (MPOC 2010).
Although palm oil area growth in Malaysia has been slowing, particularly in Peninsular
Malaysia, further expansion in area in the Malaysian Sabah and Sarawak provinces on
the island of Borneo are expected to increase. By contrast, the area planted with oil palm
in Indonesia has been growing fast in the past few years and has the potential to
continue expanding particularly in Kalimantan province in Borneo.
Translating oil palm areas into palm oil production volumes requires a forecast of future
palm oil yields. For this forecast Carter et al. (2007) provide a picture of what can be
expected in terms of palm oil production. As yields are much more volatile in Indonesia
than in Malaysia, the clear trend in Malaysian yields were used to estimate the yield
forecasts for both producers. Based on calculation, Malaysian palm oil yields have been
97
increasing by almost 0.03 tons (i.e. almost 30 kg) per year. This trend for Malaysia was
used and assumed that Indonesia will be able to increase yields from their current level
at this rate. Thus, the forecast with a continuation of the past trends in the growth in
yields, the global production of palm oil, with plantings responding to high prices,
would be expected to increase by 20 million tons from the level in 2005 to almost 54
million tons by 2012, with the two main players continuing to account for 88% of the
world output (Carter et al., 2007).
2.11.2 CPO Biodiesel Prospects
With crude oil prices soaring, vegetable oils are the new sources of energy. Palm oil,
compared to other vegetable oil (e.g. soybean, rapeseed) is a cheaper raw material for
biodiesel and is the most abundantly produced vegetable oil in the world
(Ramachandran, 2005). According to Basiron (2008a) biofuel and biodiesel demands are
changing the dynamics of the palm oil industry. EU is now the major user of vegetable
oils for fuels and is expected to remain so in the medium term due to its increased target
for biofuel usage. Therefore, the higher demand for vegetable oil for biodiesel in Europe
has contributed to increased supply pressure. Given the scenario in Europe and in the
US, it would be difficult for their domestic vegetable oils to provide the raw materials
needed. Therefore, the palm oil has to play the role in filling the supply gap for food and
other applications. Expectedly, more palm oil will be going to biofuel production
(Butler, 2008a). European governments are trying to promote the use of biofuel, notably
biodiesel derived from vegetable oils and ethanol that can be produced from grains,
sugar or biomass, to cut GHG emissions from fossil fuels (Ramachandran, 2005). As
such, the EU became the second largest importer of palm oil in 2008 just behind China,
98
almost exclusively on the basis of its use as a fuel. Industrial use of palm oil in the EU
2010 was estimated at 2.1 million tons, with about 1 million of that for fuel. This fuel
was mostly used for generating electricity in power plants rather than in automobiles or
trucks. This important development in the palm oil industry has prompted the dramatic
increase in production of biofuel from palm oil as well as the development of new
biofuel markets like the European Union (EU). As such, biofuel from palm oil are taking
on significant global importance as many countries seek to substitute the soaring price
of conventional oil and also cut GHG emissions. With high petroleum prices, palm oil as
an alternative source of fuel puts the palm oil industry in big global business (Smith,
2006). For Malaysia, being the leading producer and exporter of palm oil, catering to the
local and global demands for biofuel means increase in production and expansion to
new markets. Many analysts believe that biodiesel usage has the potential to become the
biggest component of growth in vegetable oils. This undoubtedly is a strong catalyst for
the palm oil industry to improve productivity to meet the growing demand. Certainly,
the growing palm oil industry has been an important source of foreign exchange and
employment in countries like Malaysia and Indonesia.
The investors, for the bio-diesel projects, included those from Italy and Singapore. The
German trains’ operator, ‘Prignitzer Eisenbahn Arriva AG’ is working with MPOB on
the use of oil palm biodiesel to run trains in Germany. According to reports, the trial run
in September 2005 had been promising and Prignitzer had ordered 100 tons more palm
biodiesel from Malaysia (POIC, 2009). In another development, Neste of Finland
opened its biodiesel plant in Singapore in 2011. The plant with annual capacity of
800,000 tons of biodiesel would be the worlds largest and a potential market for
99
Malaysian CPO. The government has issued 60 biodiesel manufacturing licences as of
February 2011. However, by the end of 2010, out of the 29 established plants with an
installed annual capacity of 3.37 million tons, only 10 were operational. Malaysia
produced only 170,000 tons of biodiesel in 2011 (MPOB, 2012).
Research results have shown that CPO can be used directly as a fuel for cars with
suitably modified engines. Palm oil is also used for non-food products important
applications such as diesel, engine lubricants, drilling mud, base for cosmetics, and
many more (Butler, 2006). A more detailed study on the material flow chain of palm oil-
based diesel production was conducted by Smith (2006). The material flow starts where
palm oil is cultivated in oil palm plantations, the harvested fresh fruit bunches delivered
to crude palm oil mill where CPO is extracted and finally delivered to a refinery where
‘NExBTL-diesel’ is produced through hydro-treatment process. The crude palm kernel
oil (CPKO) is not used in ‘NExBTL-production’ (Neste Oil, 2008).
MPOB is the premier government agency entrusted to serve the country’s palm oil
industry. Its main role is to promote and develop national objectives, policies and
priorities for the Malaysian palm oil industry. It was incorporated by an Act of
Parliament (Act 582) and established on May 1st. 2000, taking over, through a merger,
the functions of the Palm Oil Research Institute of Malaysia (PORIM) and the Palm Oil
Registration and Licensing Authority (PORLA). Ever since, MPOB has played an active
role in developing new technologies which have contributed to the advancement of the
Malaysian palm oil industry (Basri, Chan, & Basiron, 2002).
100
2.11.3 GAP and EU-RED
GAP, a framework for good agricultural practices, is a means of incorporating
Integrated Pest Management (IPM) and Integrated Crop Management (ICM) practices
within the framework of commercial agricultural production. Adoption of IPM/ICM is
regarded by EUREP members as essential for the long-term improvement and
sustainability of agricultural production. EUREP supports the principles of and
encourages the use of ‘Hazard Analysis Critical Control Points’ (HACCP). It is essential
that all organizations involved in the food production chain accept their share of the
tasks and responsibilities to ensure that GAP is fully implemented and supported. If
consumer confidence in fresh produce is to be maintained, such standards of good
agricultural practice must be adopted, and examples of poor practice must be eliminated
from the industry. To achieve these objectives the directive established, for each
member state, a mandatory national target for the overall share of energy from
renewable sources in gross final consumption of energy. This target was set on the basis
of the different starting points of the various countries. In order to ensure consistency in
transport fuel specifications and availability, the 10% target for the transport sector was
set at the same level for each member state. EU-RED Directive, exclusively for trade in
biofuels mainly pertaining to the sustainable criteria feedstock meant for EU’s energy
and transportation sector, established a set of sustainability criteria for biofuels and bio-
liquids. According to the directive, only biofuels and bio-liquids (including those
imported and/or obtained from raw materials cultivated outside the territory of the EU
Community) that fulfill these criteria can be taken into account for the following
purposes: Measuring compliance with the requirements of this Directive concerning
101
national targets; Measuring compliance with renewable energy obligations; and
Eligibility for financial support for the consumption of biofuels and bio-liquids. The
sustainability criteria established by the directive relate mainly to the following
environmental aspects/issues: Biodiversity; Protection of rare, threatened or endangered
species and ecosystems; and GHG emission savings (Ismail & Rossi, 2010).
Considering sustainability, it is important to distinguish between RSPO membership and
RSPO certification. RSPO certification is the approval given to palm oil produced on a
plantation that has been certified through a verification of the production process by a
certifying agency and the RSPO certified oil is traceable through the supply chain.
RSPO membership does not constitute an assured RSPO certification. The RSPO
certification process for palm oil mills has resulted in increased production costs with
upward trend of labor, maintenance and consumables mainly due to the environmental
compliance requirements; however, the palm oil so certified is in high demand and
easily marketable. In order to facilitate this process it is essential for palm oil industry to
adopt best practices in manufacturing and maintenance.
2.11.4 Palm Oil Production Process and Developments in Milling Technology
The following processes are merely described and do not discuss the different handling
techniques, problems and its effects associated in each process; e.g. bruising of fruits
during harvesting, contamination, rancidity and others.
I. Harvesting - As fruit ripen, FFBs are harvested using chisels or hooked knives
attached to long poles. Each tree must be visited every 10-15 days as bunches
ripen throughout the year. Harvesting involves the cutting of the bunch from the
102
tree and allowing it to fall to the ground by gravity. These fruit bunches (each
bunch weighing up to 25 kg) are then collected, put in containers and transported
by trucks to the factories (Poku, 2002); FFBs arriving in the factory are weighed
accordingly.
II. Threshing (removal of fruits from bunches) - The FFB consists of fruits
embedded in spikelets growing on a main stem. Manual threshing is achieved by
cutting the fruit-laden spikelets from the bunch stem with an axe or machete and
then separating the fruits from the spikelets by hand. Children and the elderly in
the village earn income as casual laborers performing this activity at the factory
site. In a mechanised system, a rotating drum or fixed drum equipped with rotary
beater bars, detach the fruit from bunches, leaving the spikelets on the stem
(Poku, 2002).
III. Sterilisation of bunches - Sterilisation or cooking means the use of high
temperature wet-heat treatment of loose fruits. Cooking normally uses hot water
while sterilisation uses pressurised steam. Cooking typically destroys oil-
splitting enzymes and arrests hydrolysis and auto-oxidation, weakens the fruit
stem and makes it easy to remove the fruits from bunches, helps to solidify
proteins in which the oil-bearing cells are microscopically dispersed, weakens
the pulp structure, softening it and making it easier to detach the fibrous material
and its contents during the digestion process and breaks down gums and resins.
IV. Crushing process - In this process, the palm fruit is passed through shredder
and pressing machine to separate oil from fibre and seeds (kernel).

103
V. Digestion of the fruit - Digestion is the process of releasing the palm oil in the
fruit through the rupture or breaking down of the oil-bearing cells. The digester
commonly used consists of a steam-heated cylindrical vessel fitted with a central
rotating shaft carrying a number of beater (stirring) arms. Through the action of
the rotating beater arms the fruit is pounded. Pounding, or digesting the fruit at
high temperature, helps to reduce the viscosity of the oil, destroys the fruits’
outer covering (exocarp), and completes the disruption of the oil cells already
begun in the sterilisation phase (Poku, 2002).
VI. Extracting the palm oil - There are two distinct methods of extracting oil from
the digested material. One system uses mechanical presses and is called the
“dry” method while the other called the “wet” method uses hot water to leach out
the oil.
In the “dry” method, the objective of the extraction is to squeeze the oil out of a
mixture of oil, moisture, fibre and nuts by applying mechanical pressure on the
digested mash. There are a large number of different types of presses but the
principle of operation is basically the same. The presses may be designed for
batch (small amounts of material operated upon for a time period) or continuous
operations (Poku, 2002). A unique feature of the oil palm is that it produces two
types of oil, palm oil from the flesh of the fruit, and palm kernel oil from the
seed or kernel. For every 10 tons of palm oil, about 1 ton of palm kernel oil is
also obtained. Several processing operations are used to produce the finished
palm oil that meets the users' requirements. The first step in processing is at the
mill, where CPO is extracted from the fruit (Poku, 2002).
104
VII. Kernel recovery - The residue from the press consists of a mixture of fibres and
palm nuts which are then sorted. The sorted fibres are covered and allowed to
heat by own internal exothermic reactions for about two or three days. The fibres
are then pressed in spindle press to recover second grade (technical) oil that is
used normally in soap-making. The nuts are usually dried and sold to other
operators who process them into palm kernel oil. Large-scale mills use the
recovered fibres and nutshells to fire the steam boilers. The superheated steam is
then used to drive turbines to generate electricity for the mill. For this reason it
makes economic sense to recover the fibres and to shell the palm nuts. In the
large-scale kernel recovery process, the nuts contained in the press cake are
separated from the fibres in a depericarper. They are then dried and cracked in
centrifugal crackers to release the kernels. The kernels are normally separated
from the shells using a combination of winnowing and hydro-cycloning. The
kernels are then dried in silos to a moisture content of about 7% before packing
(FAO, 2002).
VIII. Refining process - After the process of extraction, CPO goes through a refining
process to become refined oil. The refined oil will undergo a fat segregation
process to get refined palm oil. Finally, the refined palm olein which is a part of
fractionation process will be used in related industries (Poku, 2002).
IX. Oil storage - Palm oil is stored in large steel tanks at 31 to 40°C to keep it in
liquid form during bulk transport. The tank headspace is often flushed with
carbon dioxide to prevent oxidation. Higher temperatures are used during filling
105
and draining tanks. Maximum storage time is about 6 months at 31°C (Poku,
2002).
Carter et al. (2007) forecast that the future palm oil supply depends on the ability to
mechanise, the potential for improving yields and the scope for expanding the oil palm
areas in Malaysia and Indonesia, since ultimately they will determine the palm oil
supply for decades to come. Much of the technology used in a conventional palm oil
mill can be attributed to the comprehensive research carried out in Congo in the 1950s
as reported in the Mongana Report (1952-1955). The spectacular growth of the palm oil
industry in Malaysia since the 1960s did not lead to any significant advances in the
process used for extracting oil and kernels from fresh fruit bunches. There is increasing
awareness of the need for the palm oil industry in Malaysia to upgrade in order to
remain viable and competitive in the light of various new challenges including; more
stringent environmental regulations, labor shortage and competition from other palm oil
producing countries. Acute labor shortage has made the palm oil industry in Malaysia
highly dependent on migrant workers (Sivasothy, Basiron, Anhar, Ramli, Tan, &
Mohammad, 2006); automation in the milling and refining processes of palm oil could
help solve the labor shortage problem.
Progress in palm oil milling would have been difficult without central intervention. With
the help of Palm Oil Research Institute of Malaysia ( PORIM), new concepts could be
researched and experimented using central funds and the equipment manufacturers with
new designs or concepts were able to approach PORIM for joint evaluation trials
(Basiron & Chan, 2004). Developments of new technologies for oil extraction such as
Steam less palm oil extraction, new system for continuous sterilization of oil palm fresh
106
fruit bunches, Flottweg Drupalm Process, and new boiler technologies developed
through joint ventures with ‘Vyncke NV’ and ‘Ansaldo Volund A/S’ are reflective of
sound PORIM’s technical support to the industry (Schuchardt, Darnoko, Herawan,
Erwinsyah & Gurintno, 2001). However, milling operations of Palm Oil Industry need
to automate and, in addition, the palm oil industry needs to exploit the potential benefits
of maintenance function in order to enhance productivity.
Recent development in the palm oil milling sector involves new process for ‘continuous
sterilization’ in palm oil mills. Laboratory-scale pilot studies on a new process for
continuous sterilization demonstrated its technical and economic viability. A
commercial-scale system was subsequently built in the MPOB Palm Oil Mill
Technology Centre (POMTEC) in Labu, Negeri Sembilan. In the new process, the
closed-knit arrangement of the spikelets in bunches is first disrupted using a double-roll
crusher. The FFB are then heated using live steam at low pressure to facilitate
continuous processing. Continuous sterilization process provides the impetus for new
paradigms in the design and operation of palm oil mills. The use of technology that is
simple and uncomplicated ensures that the system is competitively priced. It eliminates
the use of sterilizer cages, rail tracks, overhead cranes, tippers, transfer carriages and
tractors and thereby facilitates the design and construction of mills having significantly
smaller footprints than conventional mills. It will lead to an overall improvements in the
design of mills, reduce the number of process operators, lower the operating and
maintenance costs, and simplify mill operation. Mills using the process can be more
easily supervised and automated. By avoiding the use of pressure vessels for
sterilization and cages and cranes for the handling of bunches, palm oil mills are made

107
safer for operators. The use of conveyors in place of cages also minimizes spillage of
fruits and oil, making mills cleaner (MPOC 2010).
A significant advantage of continuous sterilization over batch sterilization is that it
renders the palm oil milling process a continuous operation from start to finish, making
it cost-effective to automate the bunch handling operations. A plant-wide control system
can now be used to facilitate overall monitoring and control of the mill from a control
room. Mills should automate for the following three reasons: compelling issues such as
labor shortages, more stringent regulations, increasing environmental concerns and
escalating production costs; significant advances in automation technology in recent
years, spurred on by hardware and software developments in information and
communication technology (ICT); and continuous sterilization which makes palm oil
mill automation cost-effective. In order to improve efficiency of palm oil mills PORIM
introduced the milling certificate of competency (MCC), the scheme was started in 1984
by the Chemistry and Technology Division, of PORIM. The number of mills certified to
date, is 200.
As palm oil is a late comer to the oils and fats scene, the persistent efforts in promoting
its hygiene, technical and nutritional attributes have been successful in convincing many
new users that palm oil production is hygienic, its products versatile and consumption
wholesome, thereby opening up many new markets.
2.11.5 Sustainability and the Roundtable on Sustainable Palm Oil
The increasing global attention and concerns about the various environmental and social
impacts of palm oil production has raised the issue of sustainability. This is highlighted
by the recent criticisms and accusations to the industry over health, environmental and
108
social issues associated with palm oil production in developing countries particularly in
Malaysia and Indonesia (Oh, 2004). These include allegations that oil palm cultivation
had led to deforestation, pollution and social conflicts among other things. Industry
players have often characterised these issues as anti-palm oil smear campaigns but it is
clear that they cannot afford to ignore the fact that others are watching closely the
practices of the industry (Oh, 2004). However, with the growing palm oil demand and
consumption worldwide, large-scale palm oil production is now saddled with the very
fundamental question of “compatibility with sustainable development”. Oh (2004)
pointed clearly about the concerns that further expansion and larger scale of production
cannot go on for long if oil palm is grown purely to fatten the economic bottom line
without taking into account the long term needs of society and environment; the key
word is sustainability.
Malaysia has been an active member of RSPO with government agencies and private
companies like MPOA, FELDA, Golden Hope Plantation Bhd. and United Plantation
Bhd. taking important roles and positions in the organisation. In fact, MPOA and
Golden Hope were among the founding members of RSPO in 2004 while MPOA and
FELDA are current Executive Board members of RSPO. By November 2011, RSPO
comprised of 722 member companies from close to 50 countries around the world.
RSPO has three categories of membership. Ordinary Membership (OM) consists of the
main players in the palm oil supply chain, namely; the oil palm growers, processors and
traders, manufacturers of consumer goods, retailers, banks and investors, environmental
NGOs and social or developmental NGOs. The global production of CSPO reached 5
million tons in 2011, 10% of global palm oil production (RSPO, 2012).
109
With huge support from those in palm oil industries, this RSPO’s initiative on
principles and criteria is hopefully a progressive step towards sustainable palm oil
production (Tan, 2007). They have been described as the world's toughest standards for
sustainable agriculture production and have been variously adapted for other crops. No
public claims relating to sustainable palm oil production, to the RSPO P & C, can be
made without RSPO approved third party inspection.
As traditionally practiced in Southeast Asia, oil palm cultivation is responsible for
widespread deforestation (forest loss) particularly in leading palm oil producing
countries as Malaysia and Indonesia (Oh, 2004; Butler, 2007a). When the industry saw a
surge in planted area from the 1990s, the government in Malaysia has started to
intensify laws on the preservation of the environment, and such laws included the
Protection of Wildlife Act 1972 (Basiron, 2007). In the recent past, by subscribing to
RSPO, some producers have started to adopt the guidelines for environmentally
sustainable palm oil production. Another concrete example is the government’s ban on
the establishment of palm oil plantations in natural forests areas and peat lands (Butler,
2007b). To date, Malaysian oil palm cultivation takes place only over previously logged
land, and mainly on land converted from rubber, cocoa and coconut cultivation.
Additionally, the government has stopped the opening of new forest land for agriculture
since the 1990s (MPOC, 2007a). Other initiatives recently forwarded by the Malaysian
government, producers and owners include among others; comprehensive review of
environmental impacts of oil palm plantations, creation of riparian reserves along rivers
110
and oxbow lakes, establishment of wildlife corridors, and promotion of biological pest
control measures (Basiron, 2007).
Pride (2006) wrote that FELDA has been very active in providing support for the socio-
economic development of the many rural Malaysians whose livelihood depends on palm
oil. Various infrastructure facilities such as housing, roads, rural clinics, rural schools,
educational loan funds, transport systems among others, have been built and upgraded
through the years. Well-organised and well-managed over a long period of time,
plantations are the established centres of economic and social life of entire communities
in the rural heartlands of Malaysia today. The question of how effective the
implementation of those policies and regulations is another point of discussion.
However, there is a strong legislative framework that many companies in the industry
must abide by the "polluter pays principle" was adopted in Malaysia to assess the
amount of fee to operate the palm oil mill premises. The amount of effluent-related fee
payable to the Government was linked to the biochemical oxygen demand (BOD) load
of the effluent discharged either onto land, watercourse or both (Idris, 2003). Likewise,
all oil palm planters, including smallholders pay a windfall tax that took effect on 1st
July 2008 (Business Times, 2008).
2.11.6 Waste and Pollution from Palm Oil Production and Management
The two main wastes resulting from palm oil production in a mill are the solid and liquid
wastes. Solid wastes typically consist of PKS, mesocarp fruit fibres (MFF) and EFBs.
The liquid waste generated from the extraction of palm oil of wet process comes mainly
from oil room after separator or decanter. This liquid waste combined with the wastes
from steriliser condensate and cooling water is called POME (ADB, 2006). Air emission
111
from the oil palm mills are from the boilers and incinerators and are mainly gases with
particulates such as tar and soot droplets of 20-100 microns and a dust load of about
3000 to 4000 mg/nm. Incomplete combustion of the boiler and incinerator produce dark
smoke resulting from burning a mixture of solid waste fuels such as shells, fibres and
sometimes EFBs. These boiler fly ashes are also wastes and pose problems of disposal.
From the palm oil mills, according to the Asian Development Bank (ADB) study, the
impacts of palm oil processing activities to the environment are in the following (ADB,
2006): Biogas generated from the anaerobic digestion escapes into the atmosphere and
such biogas contains about 65% methane, which is one of the most potent GHG; the
incineration of EFBs emits particulates into the surrounding atmosphere; and
indiscriminate dumping of EFBs causes additional methane emission into the
atmosphere.
In terms of water pollution, illegal disposal of POME into waterways creates some
problems related to killing of life-forms in the water (Shirkie & Ji, 1983; Ahmad, Ismail,
& Bhatia, 2003). However, because of the strict current regulation and stringent
standard on effluent discharge imposed by the Malaysian Department of Environment,
nowadays, it is difficult to find a case of direct POME disposal into water bodies in
Malaysia. Even if such illegal practice exists, it is in terms of waste management, the
demand is generally driven by the government first and then by the private sector. The
government is typically responsible for policies and regulations that establish standards
for enforcement of waste management practices. The private sector is responsible for
productive use of technologies (ADB, 2006). The Malaysian experience in effluent
control in the palm oil industry demonstrates that a set of well designed environmental

112
policies can be very effective in controlling industrial pollution. The Malaysian
government’s efforts to reduce the effluent from palm oil industry have been
implemented through a licensing system, which mainly consists of effluent standards
and effluent charges. Progressively, stringent effluent standards were stated in the
government’s environmental quality regulations (Igwe & Onyegbado, 2007). Solid
wastes, mainly PKS and MF are used for in-house energy generation. PKS are used as a
source of fuel for the boilers. The fibres recovered from the nut/fibre separation stage
are good combustible materials and can be used as fuel to the boiler. The fibres
constitute the bulk of materials used to fire large boilers for generating superheated
steam to drive turbines for electrical power generation. Unfortunately, the shells contain
silicates that form scales in the boilers. Also, when too many shells are fed into the
furnace, it limits the amount of shells that can be utilised in the boilers. Residual shell is
disposed of as gravel for plantation roads maintenance. The application of shells for
road hardening has no impact to environment.
EFBs are partly dried in the sun and later used as fuel, if not incinerated or applied to the
fields. Some mills are further processing EFBs to recover the residual 2% oil and fibre
for sale as boiler fuel. Another economic use of EFBs is to return them to the plantation
as a mulch to enhance moisture retention and organic matter in the soil. On the other
hand, the ash recovered from the incinerated EFBs can also be sold or used as fertiliser
in the palm plantations (ADB, 2006). Boiler ash is recycled as fertiliser and factory floor
cleaning agent. The potash in the ashes reacts with the oil to form a weak potash soap
that is washed away with water. In the bid to achieve a zero discharge of the palm oil
mill, boiler fly ash has been used to reduce the BOD, TSS, and other contaminants from
113
POME before discharge. Boiler fly ash has also been used in the removal of heavy
metals from other industrial effluents (Igwe & Onyegbado, 2007).
Liquid waste treatment involves anaerobic fermentation followed by aerobic
fermentation in large ponds until the effluent quality is suitable for discharge. As
observed in some mills, the treated effluent can be used in the farm as manure and
source of water for irrigation. The sludge accumulating in the fermentation ponds is
periodically removed and transferred to the land. Some of the viable waste recovery
methods are listed as follows.
I. Use of palm oil waste for the production of thermal energy - EFBs and PKS
are wastes generated by the palm oil milling process at the rate of 23% and 7%
respectively from processed FFBs. PKS generated during the palm oil mill are
commonly used as a boiler fuel while EFBs are left to decay naturally in the
plantation. Since the ban imposed by the Malaysian government in 2000 on
open-air burning particularly in the palm oil industry, mills are facing the
challenge to dispose large amounts of waste. Nowadays, a common practice
consists of stock piling waste in the mill premises and eventually transport these
waste to the plantation sites to decay. EFBs biomass residues are abundant and
are combustible in the boiler. However, the fuel characteristics of EFB are poor
(low calorific value, high moisture, formation of clinkers), co-combustion of
PKS or other biomass might be required to improve the combustion process.
EFB is characterised by a low homogeneity and high moisture content that
entails technical sophistication in a project. The production of energy from EFBs
requires specific technological development which is not well developed yet in
114
Malaysia. However, according to Finpro (2001) at least one Malaysian company
Szetech Engineering Sdn. Bhd. manufactures equipment for pre-treatment of
EFBs prior to conventional boiler combustion. The major problems are linked to
the poor fuel characteristics of this biomass residue causing unstable
combustion. On the other hand, PKS is another waste generated by the palm oil
industry that is also used as a boiler fuel at the mills. The challenge that PKS
poses is on identification of some efficiency measures to the current system and
from that identify possible technological options that could improve the
processing of PKS. For example, considering the high calorific value of the PKS
the use of the excess shells as fuel for generating power or electricity in
gasification plants for villagers or palm oil mills could possibly be an option for
an optimum and efficient waste utilisation.
II. Methane recovery with energy production - POME is characterised by a very
high organic matter contents derived from the organic fractions of the palm oil
production process with an average BOD and COD level of 25,000 and 55,000
mg/L, respectively. POME is ranked among the strongest industrial wastewater
in terms of organic matter contents in the world, and the most significant because
of its large volume generated from the palm oil industry.
Typically, POME is treated in open lagoons before discharge. The anaerobic
decay of organic matter inside the lagoons is accompanied by the production of
biogas containing methane, usually released in the atmosphere in an uncontrolled
manner. The challenge for improvement in this respect is to improve the
collection efficiency, treatment and utilisation of methane for energy.
115
III. Co-composting of POME and EFBs - Green waste composting facility is the
treatment component of an agricultural management system for the biological
stabilisation of organic waste material from palm oil mills (i.e. EFBs, boiler ash,
POME, and decanter sludge). The main objective is to reduce the pollution
potential of organic agricultural waste to surface and ground water. The
challenge in this area is to find efficient technological options for better and
more efficient composting facilities and biogas collection and utilisation
technologies (e.g. for combustion, grid energy).
2.11.7 Clean Development Mechanism (CDM) projects
Palm oil mills are large generators of organic wastes that are often improperly managed
or under-valorised. For every ton of FFBs processed, about 20% of CPO is produced
leaving major waste streams. For an average mill capacity of approximately 200,000
tons per year, there is 160,000 tons of bio-waste generated; proper management of waste
is a key factor towards sustainability of the milling operations.
MF and PKS are often burned on-site in inefficient boilers for the production of process
steam and electricity; the other waste streams end up being dumped in the plantation
while POME is treated in anaerobic lagoons. Both activities result in the uncontrolled
released of large quantities of methane into the atmosphere. Details of the potential areas
for improvement are mentioned in the Kyoto accord: however, typical projects that are
potentially eligible as CDM project include; waste to thermal energy, methane recovery,
and co-composting (Kyoto Energy, 2008).
There are many opportunities that prevail in palm oil milling sector for a successful
implementation of a CDM project in a manner that is fully sustainable and with sound
116
financial returns (Krishnamurthy, 2008). According to Leong (2007) CDM projects have
been touted as good initiatives to boost sustainable development for Malaysia’s palm oil
industry. Besides combating global warming, palm oil mills can also gain competitive
advantages with CDM implementations by increasing the efficiency of their waste
management, benefitting from the transfer of technology, reducing cost and gaining
additional revenue stream from sales of Certified Emission Reduction (CERs). An
effective maintenance management, while contributing to reliable milling operations,
can undoubtedly contribute positively to achieve this goal. In Malaysia, several CDM
projects on palm oil sector are successfully implemented. Notably, the Biomass Energy
Plant at Lumut, Perak, was the first Malaysian project registered at the UNFCCC as a
CDM project (Rao, 2006).
2.11.8 Capitalizing on Palm Oil Sector Synergies
In today’s operating environment, both management and the operation of the oil palm
estates and crude palm oil mills need effective team work, fruitful synergy effect on
each other, cross-functional responsibility and accountability, inter personnel co-
operation and relationship, reduced bureaucracy and resources utilization to achieve
higher productivity and better quality product. Production costs have increased with
upward trend of labor, maintenance and consumables. Handling the situation of
increasing production costs and possibly lower commodity prices would be a challenge
for the palm oil industry.
Maintenance offers a scope of cost savings with; prolonged life cycle, tried and tested
technology, and design for reliability. There are savings derived from operating a
conventional and new CPO mill, identifying and reducing the high costs areas are
117
necessary. It has been generally agreed that there has been no significant change in the
overall processing technology and techniques for crude palm oil in the last 40 years.
Changes that have taken place so far are evolutionary rather than revolutionary (Basiron,
2000). When one looks objectively at the palm oil processing business today, it becomes
very obvious that all efforts for the future can be summed up in this phrase: “Lower cost
of production, higher productivity and better quality”. This is the key for the success or
failure of the industry (MPOB 2009).
Ismail et al. (2009) conducted a case study on “Implementation of preventive
maintenance program at a Malaysia Palm Oil Mill”; they elaborated on the effects of
Preventive Maintenance Program (PMP) implementation at a palm oil mill in Malaysia
but did not provide in depth analysis of the evaluation aspect of maintenance
management performance at the palm oil mill.
2.12 Underpinning Theory and Theoretical Framework
In the quest to improve manufacturing performance, with maintenance function at its
core, a number of broad-based operations management philosophies, e.g. TQM, JIT,
TPM, lean manufacturing (LM), theory of constraints (TOC), and more recently, six
sigma (SS) and supply chain management (SCM) have been proposed in the literature
and are being implemented in practice. It is widely held view that the successful
implementation of these philosophies requires systems thinking, functional integration,
and flatter organizational structures. From the operations perspective these practices
require managers to work on cross-functional implementation teams and participate in
cross-functional decision-making processes. To do so, managers need a common
118
language, the language of theory (Handfield & Melnyk, 1998). Areas, such as
marketing, finance, strategy, and organizational behaviour are well grounded in theory-
development methods but the need for theory-building, testing, and modification in
operations management (OM) has been widely recognized (Meredith, Raturi, Amoako-
Gyampaeh, & Kaplan, 1989; Flynn, Sakakibara, Schroeder, Bates, & Flynn, 1990;
Swamidass, 1991; McCutcheon & Meredith, 1993).
A number of attempts have been made to develop and propose theories and theory-like
principles of operations management. These attempts include trade-off theory (Skinner,
1969), the process-product matrix (Skinner, 1969), the customer-contact model (Chase
& Tansik, 1983), the TOC (Goldratt & Cox, 1984; Boyd & Gupta, 2004), the
cumulative theory (Ferdows & DeMeyer, 1990), the theory of production competence
(Cleveland, Schroeder, & Anderson, 1989; Vickery, 1991), priority management theory
(Westbrook, 1994), the theory of TQM (Flynn et al., 1994; Handfield & Melnyk, 1998)
the theory of swift and even flow, and the theory of performance frontiers (Schmenner
& Swink, 1998). This list is not exhaustive but rather an attempt to highlight major
initiatives undertaken in the academic OM literature. Schmenner and Swink (1998)
further suggested that these theories in operations management should be carefully
examined, refined and, if warranted, abandoned.
Maintenance management performance is a wide-ranging field in operations; its
evaluation is equally complex. Alkin (1990) eloquently states that “evaluation is a large,
but not unified theoretical area. No single theory specific to evaluation is available to
describe, explain and predict all types of evaluation activities”. Potter (2006) contends
119
that “evaluation is an eclectic and diverse field”. He argues that this diversity is reflected
in the body of literature around evaluation, as the literature, “draws on a number of
disciplines, which include management and organisational theory, policy analysis,
education, sociology, social anthropology, and social change”. There are several
theories, embedded in the aforesaid disciplines that seem to contribute to the
maintenance management performance. However, given the present day global
pressures on businesses, and in line with the theme of this study (maintenance
management that prides itself on continuous improvement, is efficient &effective, and is
sustainable); the scientific management theory (SMT) contributes profoundly to the
organisational performance, including operational performance, for competitiveness,
and sustainability. SMT is described in the following section.
2.12.1 Scientific Management Theory (SMT)
Fredrick W. Taylor first introduced SMT in 1911. The reliability centered process is
grounded in the work of Fredrick W. Taylor, scientific management theorist. Taylor
believed that minimizing unnecessary steps could result in efficient productivity.
According to Wren (2004), Taylor utilized time motion study to analyze and minimize
the number of redundant steps, thus increasing productivity and efficiency.
Management theory consists of applying quantitative management techniques to resolve
management and organizational challenges (Bowditch & Buono, 2005). This may
require that organizations evaluate their strategic perspectives, combined with planning
and forecasting to reach the organizational goals. Today, management science has
expanded to include management practices, JIT, Six Sigma, TQM, TPM, RCM, and
Continuous Improvement (CI) programs (Bowditch & Buono, 2005). TPM is a means to
120
improve the performance and condition of projects or manufacturing plants with the
assistance of repetitive maintenance activities (Sharma et al., 2005).
I. Overview and context - The core ideas of scientific management were
developed by Taylor in the 1880s and 1890s, and were first published in his
monographs ‘Shop Management (1903)’ (Taylor 1903), and the ‘Principles of
Scientific management (1911)’ (Taylor 1911). While working as a lathe operator
and foreman at Midvale Steel, Taylor noticed the natural differences in
productivity between workers, which were driven by various causes, including
differences in talent, intelligence, or motivations. He was one of the first people
to try to apply science to this application, that is, understanding why and how
these differences existed and how best practices could be analyzed and
synthesized, then propagated to the other workers via standardization of process
steps. He believed that decisions based upon tradition and rules of thumb should
be replaced by precise procedures developed after careful study of an individual
at work, including via time and motion studies, which would tend to discover or
synthesize the "one best way" to do any given task. Scientific management's
application was contingent on a high level of managerial control over employee
work practices. Scientific management is often called Taylorism, the terms are
often considered synonymous. A discerning view considers Taylorism as
the first form of scientific management, which was followed by new iterations.
Thus in today's management theory Taylorism is sometimes called (or
considered a subset of) the classical perspective (Gershon, 2001). Taylor's own
early names for his approach included "shop management" and "process
121
management". When Louis Brandeis popularized the term "scientific
management" in 1910 (Drury, 1915), Taylor recognized it as another good name
for the concept, and he used it himself in his 1911 monograph.
Scientific management is a variation on the theme of economic efficiency. It is a
late 19th and early 20th century instance of the larger recurring theme in human
life of increasing efficiency, decreasing waste, and using empirical methods to
decide what matters, rather than uncritically accepting pre-existing ideas of what
matters. Though there isn’t one single theory that encompasses all the aspects of
maintenance management, this author has opted in favour of SMT as it is a
chapter in a larger narrative that includes many ideas and fields, from the folk
wisdom of thrift to a profusion of applied-science successors, including time and
motion study, the efficiency movement, operations management, operations
research, industrial engineering, manufacturing engineering (maintenance was a
part of manufacturing back then), logistics, business process management,
business process reengineering, lean manufacturing, and six sigma. There is a
fluid continuum linking scientific management by that name with the later fields,
and there is often no mutual exclusiveness when discussing the details of any
one of these topics.
II. Scientific Management’s Legacy - Although the typical application of
scientific management was manufacturing, Taylor himself advocated scientific
management for all sorts of work, including the management of universities and
governments. Most of its themes are still important part of industrial
engineering and management today. These include analysis, synthesis, logic,

122
rationality, empiricism, work ethics, efficiency and elimination of waste,
standardization of best practices, the transformation of craft production into mass
production, and knowledge transfer between workers and from workers into
tools, processes, and documentation. Scientific management was one of the first
attempts to systematically treat management and process improvement as a
scientific problem. It was probably the first to do so in a "bottom-up" way, which
is a concept that remains useful even today, in concert with other concepts. Two
corollaries of this primacy are; one - that scientific management became famous,
and second - that it was merely the first iteration of a long-developing way of
thinking and much iteration that have come since. Nevertheless, common
elements unite them. With the advancement of statistical methods, quality
assurance and quality control could begin in the 1920s and 1930s. During the
1940s and 1950s, the body of knowledge for doing scientific management
evolved into operations management, operations research, and management
cybernetics. In the 1980s total quality management became widely popular, and
in the 1990s "re-engineering" went from a simple word to a mystique. Taylor’s
impact has been so great because he developed a concept of work design, work
measurement, production control and other functions, that completely changed
the nature of industry. Before scientific management, such departments as work
study, personnel, maintenance and quality control did not exist. What was more
his methods proved to be very successful. Today's Six Sigma and Lean
Manufacturing could be seen as new kinds of scientific management, although
their evolutionary distance from the original is so great that the comparison
123
might be misleading. In particular, Shigeo Shingo, one of the originators of the
Toyota Production System, believed that this system and Japanese management
culture in general, should be seen as a kind of scientific management; TPM is the
off shoot of Toyota Production Systems.
III. Other Contributors to the Scientific Management Theory:
Frank and Lillian Gilbreth (1868-1924, 1878-1972) – were associates of
Taylor. From their various studies the Gilbreths’ developed the laws of human
motion from which evolved the principles of motion economy. It was they who
coined the term “motion study” to cover their field of research and as a way of
distinguishing it from those involved in the “time study”; it is a technique that
they believed should always precede method study. This still holds true today.
Henry Laurence Gantt (1861 – 1919) – another well known pioneer in the
early days of scientific management was Henry Gantt. Gantt worked for Taylor
in the USA and is to be remembered for his humanising influence on
management, emphasising the conditions that have favourable psychological
effects in the worker. The Gantt chart for which he will also be remembered is a
visual display chart used for scheduling which is based on time, rather than
quantity, volume, or weight. From the Doctrines of Taylor and the Gilbreths’,
there followed rapid development in machinery and technology and with the
improvement of material, came the moving assembly line.
George Elton Mayo (1880-1949) – an Australian psychologist, sociologist, and
organisation theorist. Mayo is known as the founder of the Human Relations
Movement, and is known for his research including the Hawthorne Studies and
124
his book “The Human Problems of an Industrialized Civilization” (Mayo, 1933).
Mayo and his Harvard colleagues examined fatigue in their research for a
rational explanation to differences in performance at a Philadelphia textile mill.
These studies showed that motivation was outside the boundaries of the
systematic, logical and rational model of Taylor. What was found and has been
substantiated many times since is that people have multiple needs, feelings, and
personal goals that are not always consistent with the good job design, exact
standards, and performance measures obtained from traditional techniques and
approach.
Charles Eugène Bedaux (1887 – 1944) – another pioneering contributor to the
field of scientific management was Charles Bedaux. Although not embarking on
his career until after Taylor’s death, he was to have widespread influence, firstly
in the USA and later Europe. Bedaux introduced the concept of rating
assessment in timing work. Although crude and poorly received at first, his
system has been of great consequence to the subsequent development of work
study. He is also known for extending the range of techniques employed in work
study which included value analysis.
Peter Ferdinand Drucker (1909 – 2005) – Drucker saw Frederick Taylor as the
creator of knowledge management, because the aim of scientific management
was to produce knowledge about how to improve work processes. He was a
writer, management consultant, and self-described “social ecologist” (Drucker,
1992). His books and scholarly and popular articles explored how humans are
organized across the business, government and the non-profit sectors of society.
125
He is one of the best-known and most widely influential thinkers and writers on
the subject of management theory and practice. His writings have predicted
many of the major developments of the late twentieth century, including
privatization and decentralization, the rise of Japan to economic world power,
the decisive importance of marketing, and the emergence of the information
society with its necessity of lifelong learning (Byrne, 2005). In 1959, Drucker
coined the term “knowledge worker” and later in his life considered knowledge
work productivity to be the next frontier of management (Davenport, 2007).
Several ideas run through most of Drucker's writings:
i. Decentralization and simplification - Drucker discounted the command
and control model and asserted that companies work best when they are
decentralized. According to Drucker, corporations tend to produce too
many products, hire employees they don't need; when a better solution
would be outsourcing and expand into economic sectors that they tend to
avoid.
ii. Respect of the worker - Drucker believed that employees are assets and
not liabilities. He taught that knowledgeable workers are the essential
ingredients of the modern economy. Central to this philosophy is the
view that people are an organization's most valuable resource and that a
manager's job is to prepare and free people to perform (Drucker, Collins,
Kotler, Kouzes, Rodin, & Rangan, 2008).
126
iii. The need for “planned abandonment”: Businesses and governments have
a natural human tendency to cling to "yesterday's successes" rather than
seeing when they are no longer useful.
iv. A belief that taking action without thinking is the cause of every failure.
v. The need to manage business by balancing a variety of needs and goals,
rather than subordinating an institution to a single value (Drucker, 1954
&1992); this concept of management by objectives forms the keynote of
his 1954 landmark “The Practice of Management” (Drucker, 1954).
vi. A company's primary responsibility is to serve its customers; profit is not
the primary goal, but rather an essential condition for the company's
continued existence (Drucker, 1954).
vii. An organization should have a proper way of executing all its business
processes.
viii. A belief in the notion that great companies could stand among
humankind's noblest inventions (Drucker, 2008).
IV. Scientific Management Theory’s Criticism - Frederick Winslow Taylor is a
controversial figure in management history. His innovations in industrial
engineering, particularly in time and motion studies, paid off in dramatic
improvements in productivity. At the same time, he has been credited with
destroying the soul of work, of dehumanizing factories, making men into
automatons. Perhaps the key idea of scientific management and the one which
has drawn the most criticism was the concept of task allocation. Task allocation
is the concept that breaking task into smaller and smaller tasks allows the
127
determination of the optimum solution to the task. "The man in the planning
room, whose specialty is planning ahead, invariably finds that the work can be
done more economically by subdivision of the labor; each act of each mechanic,
for example, should be preceded by various preparatory acts done by other men."
The main argument against Taylor is this reductionist approach to work
dehumanizes the worker. The allocation of work, "specifying not only what is to
be done but how it is to be done and the exact time allowed for doing it" is seen
as leaving no scope for the individual worker to excel or think. This argument is
mainly due to later writing rather than Taylor's work. As Taylor stated "The task
is always so regulated that the man who is well suited to his job will thrive while
working at this rate during a long term of years and grow happier and more
prosperous, instead of being overworked". Taylor's concept of motivation left
something to be desired when compared to later ideas. His methods of
motivation started and finished at monetary incentives. While critical of the then
prevailing distinction of "us "and "them" between the workforce and employers
he tried to find a common ground between the working and managing classes
(Taylor, 1911). Applications of scientific management sometimes fail to account
for two inherent difficulties. Individuals are different from each other, the most
efficient way of working for one person may be inefficient for another and the
economic interests of workers and management are rarely identical. So both the
measurement processes and the retraining required by Taylor's methods are
frequently resented and sometimes sabotaged by the workforce. Taylor was so
immersed in the vast work immediately in front of him (getting the world to
128
understand and to implement scientific management's earliest phases) that he
failed to strategize about the next steps (sustainability of the system after the
early phases). Many other thinkers soon stepped forward to offer better ideas on
the roles that humans would play in mature industrial systems. James Hartness, a
fellow ASME member, published “The Human Factor in Works Management”
in 1912 (Hartness, 1912). Frank Gilbreth and Lillan Moller Gilbreth offered
alternatives to Taylorism. The human relations school of management evolved in
the 1930s. Some scholars, such as Harry Braverman (Braverman, 1998), insisted
that human relation did not replace Taylorism but rather that both approaches
were complementary. With Taylorism determining the actual organisation of the
work process and human relations helping to adapt the workers to the new
procedures. Today's efficiency-seeking methods, such as lean manufacturing,
include respect for workers and fulfillment of their needs as inherent parts of the
theory; it is only in flawed implementations that these methods make jobs
unpleasant.
Scientific management caused the strengthening of labor unions by giving
workers more to complain about than bad or greedy managers already gave
them. It also led to other pressures tending toward worker unhappiness, the
erosion of employment in developed economies via both off-shoring and
automation. Successors such as 'corporate reengineering' or ‘business process
reengineering’ brought into sight the distant goal of the eventual elimination of
industry's need for unskilled, and later, perhaps even most skilled human
workers in any form, all stemming from the roots laid by Taylorism recipe for
129
deconstructing a process. As the resultant commodification of work advances, no
skilled profession, even medicine, has proven to be immune from the efforts of
Taylorism successors, the 'reengineers', whose mandate often comes from
skewed motives among people referred to as ‘bean counters’; a term used for
incompetent managers.
Implementations of scientific management, often if not always, worked within
the implicit context of a particular technological moment and thus did not
account for the possibility of putting the "continuous" in “continuous
improvement process”. The notion of a "one best way" failed to add the coda,
"[… within the context of our current environment]"; it treated the context as
constant, which it effectively was in a short-term sense, rather than as variable,
which it always is in a long-term sense. Later methods such as lean
manufacturing corrected this oversight by including ongoing innovation as part
of their process and by recognizing the iterative nature of development.
V. Scientific Management in 21st Century - It is not difficult to find examples of
Scientific Management in the 21st Century; the car and computer manufacturing
plants, the work environments we go to everyday, the hospitals we are treated in
and even some of the restaurants we might eat in. Almost all of them function
more efficiently due to the application of Scientific Management. In fact, these
methods of working seem so commonplace and so logical to a citizen of the
modern world that it is almost impossible to accept that they were revolutionary
only 100 years ago. Although Scientific Management does play an important
role in the 21st century, it is necessary to note that this method of management
130
contains weaknesses that limit its influence in current work environments, and
consequently not all of its tenants are applicable to modern organizations.
Scientific Management is perhaps best seen as an evolutionary stage in
management ever developing history. Scientific Management was developed in
the first quarter of the 20th Century against the backdrop of Bethlehem Steel
plant. The backbone of this activity was his ‘Time And Motion Study’ (Dale,
1973). George Ritzer in his book “The McDonaldnization of Society” notes a
similar philosophy in a McDonald’s staff manual, it told operators precise
cooking times for all products and temperature settings for all equipment. It
specified that French fries be cut at nine-thirty-seconds thick, grill men were
instructed to put hamburgers down on the grill moving left to right, creating six
rows of six patties each (Ritzer, 2000). The antithesis of scientific management
is the human relations movement established by Elton Mayo. The model is based
on the research undertaken by Mayo at the Hawthorne electrical components
factory between 1927 and 1932. Mayo followed Taylor’s methods and was
attempting to measure the impact on productivity of improving the lighting
conditions within the factory. He followed Taylor’s scientific principles by
testing the changes against a control, a section of the factory with unchanged
lighting (Kelly, 1982). Scientific Management, however, is an incomplete
system. What is seen in both the Bethlehem Steel plant under Taylor’s
management in 1911, and in every McDonald’s restaurant in the World now is a
deskilling of labour. As jobs are broken down into their constituent elements,
and workers tasks are made easier, humans become little more than machines in

131
the chain. Their cognitive input is not required and their motions do little to
develop themselves. It is here that we touch upon the first problem Scientific
Management faces in the 21st Century. Higher levels of access to technology
and information as well as increased competition present another difficulty to
theory of Scientific Management being applied to organizations in the 21st
Century. Modern organizations process huge amounts of input and employees no
longer work in isolated units cut off from the organization at large, but are quite
literally connected to it. Satellite link-ups and the Internet provide organizations
with billions of bytes of information every day, enabling companies to work on a
global scale and within ever shortening time frames. Delivery times, information
gathering, data processing and manufacturing techniques are constantly
becoming more technologically advanced and efficient. Alongside this rapid
technological growth organizations are finding it increasingly important to react
quickly to developments that may affect their welfare. Managers recognize they
are unable to control all aspects of employee’s functions, as the sheer layers of
information factored into everyday decisions are so high that it is imperative
employees use their own initiative. High competition between organizations also
means that companies must react fast to maintain market positions. All of these
forces modern companies to maintain high levels of flexibility. Another
weakness in Scientific Management theory is that it can lead to workers
becoming too highly specialized therefore hindering their adaptability to new
situations. In the 21st Century employers not only want workers to be efficient
they must also exhibit flexibility. However, it can be reasoned that scientific
132
management is still a relevant concept for understanding contemporary work
organizations. Scientific management has proved it has a place in a post-
industrial economy and within work organizations, albeit in a hybrid form with
the human relations model. This is because scientific management allows a
company to control its workforce through a series of measures that guarantees
them the desired levels of productivity and efficiency. In spite of this guarantee,
the model, as Taylor prescribed it, also manages to alienate the workforce and
cause dissatisfaction due to the authoritarian structure of the role of management.
The human relations model adds a new dimension to scientific management as it
allows management to work on the same principles as Taylor approved, such as
time and motion studies, while also serving to fulfill employees’ social needs at
the same time. In conclusion, it can be seen that Scientific Management is still
very much a part of any organization in the 21st Century. Its strengths in creating
a divide between management functions and work functions have been employed
widely at all levels and in all industries. In addition its strengths in making
organizations efficient through replacement of ‘rules of thumb’ with scientific
fact has both insured its widespread application and ironically bred the
conditions that make it less applicable to modern organizations. Now that all
modern organizations work on a factual basis and all of them have managerial
and employee structures competition is controlled by other factors outside the
realms of Scientific Management. Modern organizations rank humanistic factors
such as employee initiative, loyalty and adaptability alongside efficiency. It is
perhaps then better to accept that as a complete theory Scientific Management is
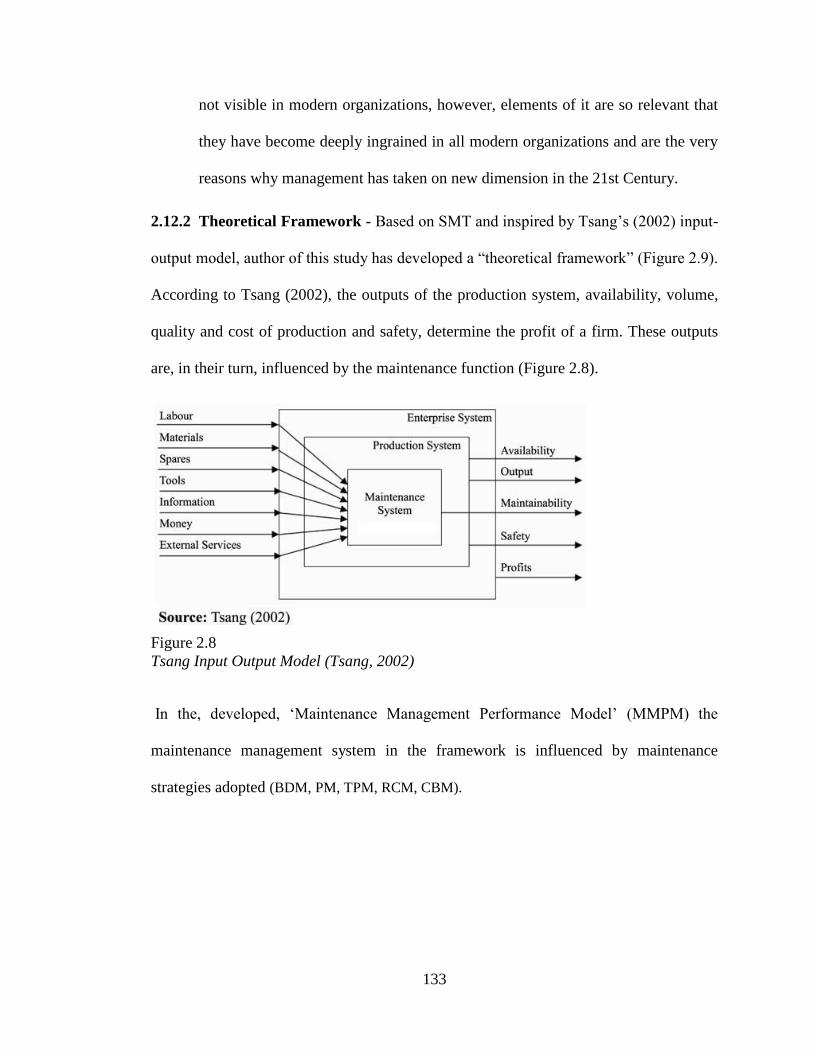
133
not visible in modern organizations, however, elements of it are so relevant that
they have become deeply ingrained in all modern organizations and are the very
reasons why management has taken on new dimension in the 21st Century.
2.12.2 Theoretical Framework - Based on SMT and inspired by Tsang’s (2002) input-
output model, author of this study has developed a “theoretical framework” (Figure 2.9).
According to Tsang (2002), the outputs of the production system, availability, volume,
quality and cost of production and safety, determine the profit of a firm. These outputs
are, in their turn, influenced by the maintenance function (Figure 2.8).
Figure 2.8
Tsang Input Output Model (Tsang, 2002)
In the, developed, ‘Maintenance Management Performance Model’ (MMPM) the
maintenance management system in the framework is influenced by maintenance
strategies adopted (BDM, PM, TPM, RCM, CBM).
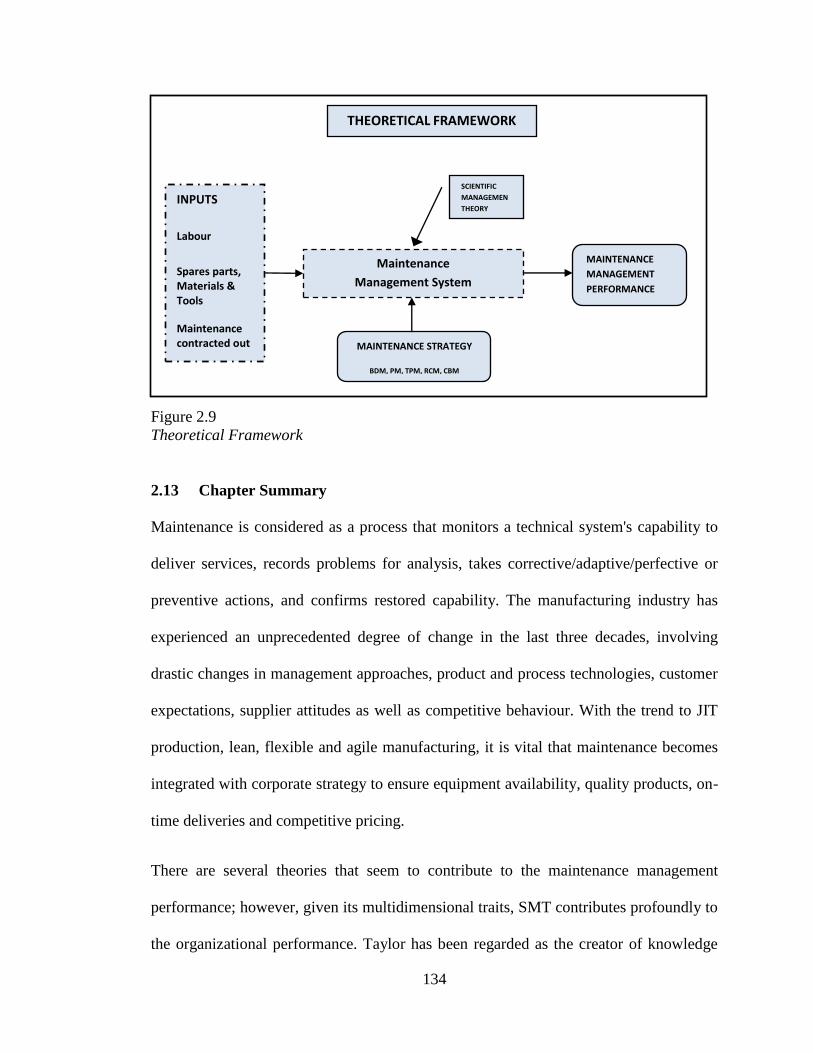
134
Figure 2.9
Theoretical Framework
2.13 Chapter Summary
Maintenance is considered as a process that monitors a technical system's capability to
deliver services, records problems for analysis, takes corrective/adaptive/perfective or
preventive actions, and confirms restored capability. The manufacturing industry has
experienced an unprecedented degree of change in the last three decades, involving
drastic changes in management approaches, product and process technologies, customer
expectations, supplier attitudes as well as competitive behaviour. With the trend to JIT
production, lean, flexible and agile manufacturing, it is vital that maintenance becomes
integrated with corporate strategy to ensure equipment availability, quality products, on-
time deliveries and competitive pricing.
There are several theories that seem to contribute to the maintenance management
performance; however, given its multidimensional traits, SMT contributes profoundly to
the organizational performance. Taylor has been regarded as the creator of knowledge
INPUTS
Labour
Spares parts, Materials & Tools
Maintenance contracted out
THEORETICAL FRAMEWORK
Maintenance
Management System
MAINTENANCE
MANAGEMENT
PERFORMANCE
MAINTENANCE STRATEGY
BDM, PM, TPM, RCM, CBM
SCIENTIFIC
MANAGEMEN
THEORY

135
management, because the aim of scientific managements was to produce knowledge
about how to improve work processes. Scientific Management is still a part of most of
organizations; it was one of earliest attempts to systematically treat management and
process improvement as a scientific problem. Today, task-oriented maximization of
work is pervasive in industry. Six Sigma and lean manufacturing are considered as new
kinds of scientific management; TPS and the Japanese management culture in general is
envisaged as a kind of scientific management, as well. Theoretical underpinnings,
models, and frameworks should be more practitioner friendly; only then one can
appreciate their relevance and employ them to produce results. The developed
theoretical framework draws on the ‘input-output’ concept put forward by Tsang (2002).
The maintenance system management in the theoretical framework is influenced by
SMT and maintenance strategies adopted.
Theory and practice knowledge gap is evinced in this research as the literature supports
the advantages that can be derived from efficient and effective use of maintenance
inputs (IV) namely: Labor; Spare-parts, material & tools; and maintenance contracted
out. Adopting appropriate maintenance strategy (MV), such as TPM, ensures better
performance of maintenance system evident in higher OEE figure. The practice side has
been analyzed in chapter four (4.5) to identify theory practice gaps. Maintenance system
management evaluation through measuring OEE is the core element of developed
research model. The process is facilitated by the research methodology using
triangulation for data validation and reliability.
136
CHAPTER THREE
3.0 METHODOLOGY
3.1 Introduction
Maintenance management is an integral part of production and operations. Operations
management literature advocates performance measurement as integral to business
improvement (Neely et al., 2001; Slack & Lewis, 2008). For nearly 30 years, the
performance measurement literature has focused on developing relevant, integrated,
balanced, strategic and improvement-oriented performance measurement systems
(Bititci et al., 2005). A plethora of frameworks has been developed that aim to provide a
balanced view of a business (Bititci, Carrie, & McDevitt, 1997; Cross & Lynch,
1988/1989; Fitzgerald, Johnston, Brignall, Silvestro, & Voss, 1991; Kaplan & Norton,
1992; Keegan et al., 1989; Neely et al., 2002). This body of literature has made practical
and theoretical contributions to performance measurement in private sector
organisations. Still, consensus has not been reached as to the metrics or frameworks that
can or should be used to evaluate private sector performance. Scholars advocate the
continual evolution of measurement metrics and some remain sceptical about the
longevity of any performance measurement system (Bititci, Turner, & Begemann, 2000;
Kennerley & Neely, 2002). The challenge of “designing” the ideal model to drive
maintenance activities has become a research topic and a fundamental question to reach
the effectiveness and efficiency of maintenance management and to fulfill enterprise
objectives. In the historical development of maintenance, diverse authors have proposed
what they consider the best practices, steps, sequences of activities or models to manage
this function. This chapter discusses the MMP Model and framework applied in this
137
research study, elaborates on its variables (IVs, MV & DV) and explains the
methodology applied.
3.2 Maintenance Optimisation Models
In this author’s view theoretical underpinnings, models, and frameworks should be more
practitioner friendly. Only then one can appreciate their relevance and utilize them to
produce results that meet the TBL of organisations, namely: People; Planet; and Profit.
This study bridges this gap by applying practitioner’s perspective to the evaluation of
maintenance management performance through the MMPM model and theoretical
framework developed by the author.
Maintenance optimization models can be both qualitative and quantitative. The former
includes techniques like TPM, RCM, etc. while the later incorporates various
deterministic / stochastic models like Markov Decision Process, and Bayesian models.
There has been a long journey of maintenance techniques evolution from CM in 1940 to
various OR models for maintenance as on today. A number of latest techniques have
been analyzed under this broad area. However, the first maintenance management
information system (MMIS) appeared in the 1980s due to the full recognition of
maintenance as an important business function. The same has now become an essential
component of any maintenance organization and thus merits investigation also under a
separate area. Similarly, various maintenance policies can also be classified as; age
replacement policy, periodic repair policy, failure limit policy, block repair policy and
many more. Each has different characteristics, advantages and disadvantages, and
requires extensive research.

138
The quantitative approach to maintenance optimization is covered in detail in the
literature with numerous papers in past two decades, starting in early ninety’s. Since the
1980s widespread mechanization and automation has reduced the number of production
personnel while capital employed in production equipment has increased manifold
(Dekker & Scarf, 1998). In general, maintenance optimization models cover four
aspects:
i. a description of a technical system, its function and importance
ii. a modeling of the deterioration of the system in time and possible
consequences for this system
iii. a description of the available information about the system and actions
open to management and
iv. an objective function and an optimization technique which helps in
finding the best balance
Dekker and Scarf (1998) also present another classification of these models as; age and
block replacement models, Markov decision models, and time delay models.
3.3 Constraints in Applying Optimisation Models
I. Gap between Theory and Practice - Maintenance optimization models are
difficult to understand and interpret. Many maintenance models have a stochastic
nature, which is not only difficult to grasp by technicians and managers, but also
difficult to interpret (the frequentist interpretation of probability is often
hampered by many interfering circumstances). For example, a Markov decision

139
model is far more difficult to understand and to interpret than a routing problem.
Education of engineers traditionally focuses on deterministic approaches, which
hampers effective use of reliability concepts. As maintenance is being underrated
compared to other disciplines, academic support is limited.
II. Companies are not interested in publications - Although many good ideas
have been developed in industry, only a small amount has appeared in scientific
literature. To have academics study industry problems, they have to be exposed
to them and to be rewarded if they solve them. Although academic freedom is a
great thing, it does not expose academics to tackle industrial problems. So,
companies should stimulate researchers by offering them problems and allowing
them to publish their results.
III. Many papers have been written for math purpose only - Mathematical
analysis and techniques, rather than solutions to real problems, have been central
in many papers on maintenance optimization models. Mathematical results on
the existence and structure of optimal policies (e.g. control limit policies),
however, are not appealing to practitioners. The structure of policies is generally
determined by the problem setting. It is astonishing how little attention is paid
either to make results worthwhile or understandable to practitioners, or to justify
models on real problems or to consider real problems. Operational Research and
Optimising Models have flourished only as a mathematical discipline with in
OR. The applications of the same have been very limited so far due to lack of
studies that have been published. It can be said that its impact on decision
making within a maintenance organization has so far been limited.
140
IV. Data Problem - Decision support systems are needed to optimise maintenance;
almost no maintenance optimisation model yields results which only require
simple calculations. To determine the optimal maintenance policy one either has
to use numerical integration or to solve sets of equations; except for some
specific cases for which graphical methods have been developed or analytical
solutions exist. An essential part of a maintenance optimization model is the
modelling of the deterioration and the occurrences of failures of a system in time
such a way that it is clear how both are influenced by the maintenance regime.
Maintenance actions will only be effective if they specifically address the most
relevant deterioration and failure mechanisms. Global statistics, like an average
failure rate, will therefore be inappropriate for most maintenance actions, and
apply only to complete replacements, which tend to be costly. Analysing data
without knowing the underlying failure mechanisms can lead to totally wrong
results (consider failures caused by wear out and by operator errors). Hence data
has to be collected under strict rules, defining failure and individual maintenance
actions precisely, using a well-defined system-component structuring and
indicating what events have happened on purpose. This is, however, not the case,
except perhaps in the airline industry. Maintenance information systems thus
mainly store accounting information on events and there is a wide concern about
the value and integrity of their data for engineering decision making. As
collecting data requires a lot of effort, one should concentrate on the most
relevant areas, which is a problem on its own. Data should be, current, relevant,
accurate and credible. Exceptions are the condition-monitoring programs, for

141
which dedicated manpower is usually available. An alternative is to make use of
the knowledge contained in the maintenance technicians. This, however, requires
a reformulation of most maintenance optimisation models since it is very
difficult to illicit probability distributions from people (Van, Dekker, Cook, &
Mazucchi, 2002). Another aspect one should realize is that under good
maintenance practices there are little failure data. If the failure occurs repeatedly,
one may either change the system design or its operation to prevent failure, with
the result that data collection has to start all over again. Apart from problem with
data on deterioration, one also has problems with cost data, especially with
respect to the indirect costs. It is easy to quantify direct maintenance costs, but
very difficult and sometimes subjective to quantify the benefits of maintenance.
In the case of maintenance for production equipment one has to value the
increase in reliability, availability, and efficiency.
V. Information Technology - It seems that a number of papers have been
published in this area since the year 2000. This sudden rise is due to the fact that
IT (both soft and hardware) is now becoming available at low cost and is rapidly
developing. However, limited work is directed towards developing an
operational decision support system.
VI. Problem Owner - More application will be seen if models are developed in
conjunction with the problem owner. Limited application is also attributed to
inadequate definition of a problem by its owners and lack of training in
education of engineers, which presently focuses on the design of systems and not
142
on maintenance. Engineers need to be taught economics of maintenance and
principles of optimization.
VII. Reliability Measures and Optimum Maintenance Policies - Presently, many
researchers are pursuing the development of various mathematical maintenance
models to estimate the reliability measures and determine the optimum
maintenance policies. However, these models may be useful to maintenance
engineers if they are capable of incorporating information about the repair and
maintenance strategy, the engineering management policies, the methods of
failure detection, and failure mechanisms. Justifying reasonableness of
assumptions, and the applicability of model in a given system environment that
can give greater confidence in estimates based on small numbers of production
data. No attempts have been made to integrate these quantitative approaches with
qualitative ones, like RCM, and TPM.
VIII. Maintenance comprises of multitude of different aspects - Maintenance is a
generic term referring to a variety of actions on all kinds of diverse technical
systems, deteriorating in various ways. Hence, it is not surprising that there is no
general model covering all possible cases. Despite the multitude of models, there
is little knowledge on which models are suited for which practical problems or
which types of data are really driving problems. Instead of publishing new
models one would be better of unifying existing models and critically reviewing
them on applicability and utility.
IX. Optimization is not always necessary - Maintenance models indicate in
principle the best decision given a certain problem and available information.
143
The value of such a procedure (i.e. the savings because of a better decision
making process) has to be balanced against the effort to apply the procedure and
to get the required data. In some problem instances the potential savings are just
too low to justify such sophisticated decision making. Furthermore, optimisation
often results in a lowering of the indirect costs, from which other parts of the
organisation, like operations, benefit, but not maintenance itself. Since this type
of savings is less tangible, it is also less convincing to higher management.
X. Optimisation models often focus on the wrong type of maintenance - Finally,
an often heard complaint is that optimisation models focus too much on the
wrong type of maintenance i.e. that is planned revisions and overhauls. Although
this type of maintenance was advocated in the 1950s and 1960s to prevent
failures, it did not always prove to be effective. Efforts from manufacturers (e.g.
design failures) have further decreased the need for this type of maintenance.
Furthermore, condition based maintenance has replaced another part. Note that
this complaint refers to the type of maintenance and not to the optimisation
models. It is true, however, that a large part of optimisation models focus on
planned maintenance, though not always on revisions, but also on replacements
and inspections; the reason is that in planning optimisation methods have a well
established role. Condition based maintenance depends upon a measurable
quantity which gives information about the actual state of systems. If there is
such a quantity, it will very likely provide better information than time or run-
hours can offer as prognostic variable and hence it will form a better basis for
maintenance. Yet, such a condition quantity may be expensive to measure and
144
may relate to some future modes only. Furthermore, many of the condition
indicators available so far (like vibration level), have a short-term prediction
capacity only, which does not leave much room to save on costs by planning
maintenance on appropriate moments.
XI. Future Prospects -Despite all the constraints mentioned above, there is scope
for maintenance optimization, because of two main reasons; the technological
push and the economic necessity. Firstly, computers are becoming affordable by
the day, not only in terms of computing power, but also with respect to clever
registration devices. Integration of information systems implies that data on
deterioration may be obtained from process monitoring systems. Furthermore,
new developments in software technology enable better software development,
with more intelligence embedded devices, in a shorter time span. Optimisation
models are so far the only way in which scientifically justified statements on
maintenance can be made. Secondly, it is widely accepted that the amount of
capital invested in technical systems will keep growing. Due to increased
demands on performance of these systems (quality, reliability, and safety)
spending on maintenance is likely to grow as well, a trend which is visible in
many companies. Contracting out maintenance also increases the need for higher
quality of decision making. Maintenance optimization models, embedded in
decision support systems provide an objective and quantitative way of decision
making, especially since it allows us to evaluate the economic consequences of
decisions. As maintenance optimisation models are the only approach which
combines reliability with economics in a quantitative way, they are in fact
145
nothing more than the extensions of basic economic methods to justify
maintenance. It is their role in structuring of the decision process (pointing at
which information is essential), the possibility to reduce uncertainty by
investigating ‘what if’ scenarios and the better insight into the effects of
decisions across maintenance and production areas, which yields most benefits
(Dekker, 1996).
3.4 Model and Framework applied in this study
In order to remain competitive in today's highly challenging and rapidly changing
business environment, a keen understanding of the intricate dynamics of the production
facility is required to be able to manage the organizational resources effectively to meet
the organization's sustainability efforts. The success in highly challenging contemporary
manufacturing scenario depends on the implementation of multiple complimentary and
proven strategies. The author has developed a maintenance management performance
evaluation model (MMPM) that draws on the ‘input-output’ concept put forward by
Tsang (2002) and uses OEE, TPM’s KPI, for maintenance evaluation (Figure 3. 9).
3.4.1 Spread of TPM
In today’s global economy, the survival of companies depends on their ability to rapidly
innovate and improve. As a result, an increasing search is on for methods and processes
that drive improvements in quality, costs and productivity. In today’s fast changing
marketplace, slow, steady improvements in manufacturing operations will not guarantee
146
profitability or survival. Companies must improve at a faster rate than their competition
if they are to become or remain leaders in their industry.
Western products, practices and methods were long considered the best in the world.
This perception is constantly changing as a result of new competition and economic
pressures. Arrogance or self assurance has devastated specific sectors of western
manufacturing base. For example, the Japanese now own the consumer electronics
industry. Changes in the automotive industry are well documented, and for the first time
Western dominated industry such as computers and aviation are facing serious
challenges by foreign competitors. Other companies and cultures have proven they can
compete successfully in the world marketplace with western manufacturing. To confront
this challenge, enlightened company leaders are benchmarking their organizations’
performance and improvement processes against domestic and international
competitors. TPM is a complex, long term process which must be sold to the workforce
as a legitimate improvement methodology. For TPM to succeed in any industry, both
management and the workforce must address issues strategically while operating in an
environment of trust and organization. The improvement process must be recognized as
benefiting both the company and the workers. The ultimate responsibility for success or
failure of the TPM process rests more with management than the plant floor employees.
Performance target must always be dynamic, not static. If a company sets goals and
measures to reach performance levels of their best in class competitor in two years, they
will lag behind, since their competition will have improved over that same period of
time. To be the best in class, a company must leap-frog its competition by setting goals
beyond where their competition is projected to be. Likewise, in TPM, employee
147
involvement is a necessary part of the TPM process; the goal is to tap into the expertise
and creative capabilities of the entire plant or facility through the use of small group
activities. The total involvement of plant personnel generates pride and job satisfaction
as well as financial gains for the organization. TPM requires employees to take a more
active role in decision making and to accept responsibility for the plant and its physical
condition. They have a heightened role in defining their job content, along with work
systems and procedures. The intent of TPM is that each employee takes pride in their
equipment and all efforts must be directed towards the plant’s objectives. For example,
JIPM recommends that management adopt the theme of “My Plant” to increase the level
of autonomous maintenance.
TPM improvement methods and activities are also being adopted in product
development and sales department. This trend underlines the increasing tendency to
consider production processes and equipment at the product development stage in an
effort to simplify production, improve quality assurance and enhance and reduce the
start-up period for new production. These issues are of particular concern most
especially in the process industries today as product diversification continuous and
product life cycle shortens. Interest in TPM outside Japan has also expanded throughout
the recent years. Many companies in the United States, Europe, Asia and South America
are planning to or are now actively pursuing TPM.
3.4.2 Why TPM is so popular?
There are three main reasons why TPM has spread so rapidly throughout Japanese
industry and why companies outside Japan are becoming interested; it guarantees
148
dramatic results, visibly transforms the work place, and raises the level of knowledge
and skill in production and maintenance workers.
Companies practicing TPM invariably achieve astounding results, particularly in
reducing equipment break downs, minimizing idling and minor stoppages (‘chokotei’ in
Japanese), and lessening quality defects and claims boost in productivity, trimming
labor costs, shrinking inventory, cutting accidents and promoting employees morale as
shown by the increase in improvement suggestions. Through TPM, a filthy, rusty plant
covered with oil, mist and grease, leaking fluids and silt powders can be reborn as a
pleasant, safe working environment. Customers and other visitors are impressed by
these changes and their confidence in their products increases. As TPM activities begin
to yield concrete results which is improving the working environment, minimizing
breakdowns, improving quality, reducing set-up and change over times and so on;
workers become motivated, involvement increases and improvement suggestions
proliferate. People begin to think TPM as part of their day to day jobs making TPM a
way of life for all people. TPM helps operators understand their equipment and widens
the range of maintenance and other tasks they can handle. It enables them to make new
discoveries, acquire fresh knowledge and enjoy new experiences. It strengthens
motivation, engenders interest in their work and concern for equipment and fosters the
desire to maintain equipment in top peak condition. McKone et al. (2001) show that
there is a significant and positive indirect relationship between TPM and manufacturing
performance through JIT practices. Ireland and Dale (2001) discuss study of TPM in
three companies. These companies had followed Nakajima's seven steps of autonomous
maintenance. Das (2001) presents a case study where TPM is implemented in a step-by-
149
step manner and also develops some parameters for measuring the effectiveness of
TPM. Gupta et al. (2001a, b) address basics of TPM and its key issue, OEE. Finlow-
Bates, et al. (2002) show that in order to implement TPM successfully, three strong
tools i.e. “ seven simple tools of TQM”, four thinking models of “Kepner-Tregoe” and
“Root cause analysis” are to be navigated as all three are complementary to each other.
Hansson, Backlund and Lycke (2003) put forward the importance of top management
leadership to focus on strategic planning, training and education, monitoring and
evaluation, empowerment, and information and communication in increasing the
successful implementation of not only TPM but TQM and RCM as well. Shamsuddin,
Hassan and Zahari (2005) argue that TPM can go beyond maintenance and may
encompass a host of business functions within an organization.
3.4.3 TPM and OEE
In today’s competitive economy, the survival of companies depends on their ability to
briskly innovate and improve. As a result, an increasing search is on for methods and
processes that drive improvements in quality, costs and productivity. They are adopting
and adapting best in class manufacturing practices and improvement processes. As part
of these benchmarking efforts TPM has been identified as a best in class manufacturing
improvement process (Robinson & Ginder, 1995). From generic perspective, TPM can
be defined in terms of OEE which in turn can be considered a combination of the
operation maintenance, equipment management and available resources (Chan, Lau, Ip,
Chan & Kong, 2005). The term “Total Productive Maintenance” was first used in the
late 1960’s by Nippondenso, a supplier of electrical parts to Toyota (Robinson &
Ginder, 1995). TPM has also been defined as a plant improvement methodology which
150
enables continuous and rapid improvement of the manufacturing process through the use
of employee involvement, employee empowerment and closed looped measurements of
results (Robinson & Ginder, 1995).
In an industry, ideally, equipment should operate 100% of the time at maximum
capacity giving an output of 100% good quality product. However, this seldom happens
because there are losses which occur in a real life situation that differentiate between the
actual and the ideal performance. OEE needs to be measured in every organization that
is committed to eliminate equipment or process related wastes through implementing
TPM along other initiatives such as LM, Operational Excellence, and WCM.
OEE is a formula used in the manufacturing industry to calculate the overall equipment
effectiveness of a branch or complete production system; formula was presented as an
overall metric in the TPM concept (Nakajima, 1988). OEE is a crucial measure in TPM
that reports on how well equipment is running. It factors three elements; the time the
machine is actually running, the quantity of products the machine is turning out, and the
quantity of good output - into a single combined score. It directly addresses those, the
operators, who are best positioned to track and improve the effectiveness of the
equipment. OEE helps define basic concepts and provides a systematic explanation to
the operators as to how OEE should be applied to maximize a piece of equipment's
productivity and recognize the signs when its efficiency is being compromised.
It is essential to realise the importance of optimising OEE. That is equipment
availability, actual output compared to standard, and the quality level of the output; and
how to improve equipment OEE through reducing breakdowns and minor stoppages,
restoring efficiency, and eliminating quality defects. Equipped with the knowledge and

151
training, the operators should be able to identify opportunities for TPM in their
company, and apply a range of tools & techniques for improving OEE. This will also
help them to develop a pro-active strategy for optimising the effectiveness of production
equipment.
3.4.4 Data Collecting Issues and Challenges
Collecting the data from operators on the performance factor is not always a reliable
measure. If the mill decides to settle on manual data collection there is a hereditary
problem in that; manual forms are often filled in at the end of shift and may not reflect
the truth of what is happening. This is not because there is an inherent dishonesty in
machine operators. The problem is that ‘remembering’ what happened in terms of set up
time, run time and downtime including the reasons is subject to the ‘witness effect’. This
means that you may get several witnesses to a crime but it is unlikely that they will all
describe the suspect precisely and the same!
The longer the time between the event and the recording, the greater the inaccuracy you
will get. Some companies may insist that the data is recorded at the end of the job or at
the end of the shift, some even at the end of the week. This method will entirely
compromise the factor that contributes to the OEE figure. It is likely that the figure will
be overstated and the mill’s OEE will be higher than it genuinely is. There will also be a
danger that the figures recorded will also be the ‘target’ figures. This means that if the
operator is allowed to take 20 minutes to set-up a machine he or she may always take 20
minutes, or record 20 minutes, even if it is less. It matters, of course, if the mills are not
finding out the truth they may not be revealing the hidden capacity that may be utilized
152
to improve the performance (and the OEE) of their investment. In some palm oil mills,
for example OEE can appear improved by actions such as purchasing oversize
equipment, providing redundant supporting systems, and increasing the frequency of
overhauls. Investment in higher installed mill capacity and purchase of redundant
standby critical equipment, such as spare ‘boilers’, ‘presses’, ‘decanters’, and turbines
are some of the examples that compensate for their operational inefficiencies.
Some may suggest that collecting data manually as the events happen may be the
answer, but the reality is that any manual method would actually also impair the OEE
figure simply through the act of collecting it. The solution is that the recording of all the
factors needs to be automatic or as unobtrusive as possible. Proper sensors installed
strategically can provide the data required. This can be addressed by installing a simple
‘heartbeat’ sensor to monitor if the machine is running or not and at what speed. In the
event of the machine stopping, the operator simply has to record the reason for the stop
through a scan of a barcode. This ease of use will provide the mill with ‘machine truth’.
This is the starting point to not only implementing OEE measurement but gaining the
power to improve it.
Maintenance daily service log, similar to the one designed by this author’ template
shown in Figure 5.20, recordings can also be used to cross check the down times.
Self contained more sophisticated sensing devices are available, that can report what is
happening at the machine in near real-time. It gives instant insight to the machine
performance at a job, shift and machine level. A critical element of the sensing devices
is a light emitting diodes (LED) text display that is located near the machine to provide
feedback on performance to the operator. The nature of the feedback relating to current
153
production rate, if the machine is running or idle, the current OEE and other vital signs
gives them the information required to help them run the machine in a more efficient
manner. Most operators welcome the objective measurement and feedback from the
LED, and that motivates them to achieve greater efficiencies. Importantly, the user
interface for the person managing the plant is very intuitive and reveals through
meaningful representation of the data what can be improved. Data thus collected can be
triangulated; individual machine or a production line downtime recorded in maintenance
daily logs should enumerate with the downtime recorded in the production operational
availability logs. Any discrepancies observed would direct to non-maintenance related
losses such as operator errors encountered due to incompetent machine operators.
Collection of data for calculating OEE for individual machines or equipment can also be
done through daily production logs; it can be computed to obtain operational history of
critical machines and equipment on daily, weekly, monthly, or annual basis for
comparison and improvement. There is a variety of maintenance and production
management software available that can be utilized to maintain downtime and repair
history of the machines & equipment as well as complete production lines through
organized maintenance daily service log and work order management system support. A
Malaysian developed computer maintenance management system (CMMS) software
“CWORKS” is adequate for most manufacturing operations including palm oil mill
applications; there is also a free version of ‘CWORKS’ available. Work Order (WO)
management system is an integral part of CMMS and helps to build up operational
history of the critical machines and equipment; it helps to track various costs pertaining
to specific assets such as cost of labor, and parts.
154
3.4.5 OEE Calculation, explained
OEE is an accumulated production measure that takes into deliberation, as stated earlier,
the six big losses affecting the productivity of equipment in production systems.
Equipment failure, setup, and adjustments are related to the downtime and expressed in
terms of availability. Idling and minor stoppages, together with reduced speed, are
related to speed losses and expressed in terms of the performance rate. Finally, process
defects and reduced yield are related to defects and expressed in terms of the quality
rate. Three main factors that make up the OEE calculation; Availability, Performance,
and Quality are expressed as a percentage and are multiplied together to give a single
OEE figure, also expressed as a percentage. OEE template designed by the author
(Figure 5.19) depicts a generic daily production log & OEE for an individual mill. Three
factors involved in this calculation are independent of each other; i.e. variations in one
of the three factors will not affect the other two. Normally, OEE figures can be found
from 30-95 per cent (Ljungberg, 1998; Ahlmann, 1995; Wireman, 2004).
The point of the final calculation is that it gives a single figure to measure, and then
compares OEE. Therefore factory may, on a single machine perhaps, compare the OEE
between jobs. This will allow business to see which jobs run well and which ones do
not. One can then take corrective action, may compare shifts and gain an insight to
whether one shift performs better than another or investigate the underlying reasons and
take action to improve the OEE.
Businesses may compare machines within, or across several plants and may even
compare different manufacturing plants where they make similar product and
understand underlying reasons why one may have a better OEE than another, and then

155
take corrective action. Ultimately, if the data is available, businesses may compare their
OEE to that of their competitors or industry’s best and put plans in place to reach the
best in-class. Like best practice initiatives businesses may look at industries that have
similar characteristics to their own and then try to emulate practices that improve their
OEE to the levels they can sustain.
Though data for this is readily available through production logs and financial
statements that most palm oil mills maintain through some sort of manual or
computerized generic spreadsheets, dummy figures have been used here to illustrate
OEE calculations. Let’s take a look at each factor in turn.
I. Availability - The calculation for availability is simply the actual production
time, including set up, out of the planned production time. Time that is lost
due to downtime through machine failure, lack of input materials, lack of
operator(s), as a series of examples; will be set against the calculation.
Therefore the actual consumed time divided by the available time will give a
figure, expressed as a percentage that is a factor that contributes to the
overall OEE calculation. The availability rate is the time the equipment is
really running, versus the time it could have been running (Figure 5.19).
II. Performance - the next factor, performance, is in theory very simple. It is
the actual achieved run rate against the ideal run rate for the machine. Often
the machine ideal or optimum run rate may be the figure published by the
machine manufacturer. However, it is well known that the ideal run rate may

156
be affected by the situation of machine, heat, cold product running through
and so on. Purists would still refer to the published run rate while others may
suggest that expected performance may necessarily be degraded by the
nature of the product going through it. In a situation where the same product,
with no expected variability, passing through the machine, such as a line in a
bottling plant or CPO production line, one would expect the ideal run rate to
remain constant and therefore variances may easily be identified. However, if
looked at another example, such as a machine used in packaging carton
manufacture, then the machine performance can be degraded by the size of
the input product or the number of slots and folds or the quality of the
material. In this situation one may wish to measure the performance against
the degraded expected run time rather than, or maybe as well as, the ideal run
rate. Performance rate is the quantity produced during the running time,
versus the potential quantity, given the designed speed of the equipment
(Figure 5.19).
Majority of palm oil mills that belong to first and second generation mills
(mills established in 1960s’ and 1980s’ respectively) do not run their
equipment on variable speeds. The whole manufacturing line runs at one
speed; it is either running or not running, there is no slow or fast run mode in
the process line. However, provision has been made for the ones who do run
on variable speed and it is reflected in the ‘performance rate’ calculations.
157
III. Quality - this is simply a measure of good product divided by the total
product; for the job, shift, day, or week. (Figure 5.19).
The quality rate is percentage of good parts out of total produced sometimes
called “yield”. In case of palm oil mills it is the CPO produced; within spec
and out of spec.
3.4.6 OEE - To arrive at OEE; simply multiply the figures together; dummy figures,
in the following calculation, have been taken for illustration only (Figure 5.19).
For ease of use and interpretation at the shop level, all the information is negotiated,
using simple calculations, through linked spreadsheet cells containing readily available
data. OEE figure thus obtained can be improved upon. In terms of Availability mills can
look at activities that reduce unplanned downtime; this may be putting engineers on call,
making sure mills have critical spares, input products (raw materials) do not run out, and
that the operator is ‘available’. Performance may be addressed, dependent perhaps on
the machine and industry, by good maintenance routines to maintain speed, or in a
degraded environment, redesign of product if necessary to achieve the planned or ideal
run speed. Quality of course can be addressed, perhaps, by improved maintenance
routines or improved quality of raw materials, amongst others. There will be debate
within organizations about what should actually be within the overall factors and there
are flexible interpretations of this. One may think that agreeing about an OEE initiative
and the measures is a complex task and depending on one’s organization it may well be;
however, it is the smaller of the challenges one will face.

158
3.4.7 Maintenance Management Performance Model (MMPM) Explained
Figure 3.10 depicts the maintenance model that has been derived from the theoretical
framework discussed earlier (2.12.2). Inputs are being fed into the maintenance
management system; these inputs are the independent variable. Independent variable
comprises of three sub-IVs: Labor; Spares-parts, Materials, & Tools; and Maintenance
Contracted out. These inputs vary in size and quality, depending on the corporate policy
being followed and the resources available to the organization.
Maintenance management, the core function of production and operations, is influenced
by the “moderator variable”, the maintenance strategy. Organizations may have one or
more of the following strategies implemented; BDM, PM, TPM, CBM and RCM. An
appropriate and effective maintenance strategy will ensure reliable production
equipment- reflective of the effective performance of the maintenance management
system. This in turn will provide the quality product that the ‘Enterprise’ will sell in
order to obtain profit. The goal of the organizations is to operate the business that is
profitable and sustainable. Maintenance Management Performance is the dependent
variable; it will be measured using TPM’s key performance indicator, OEE.
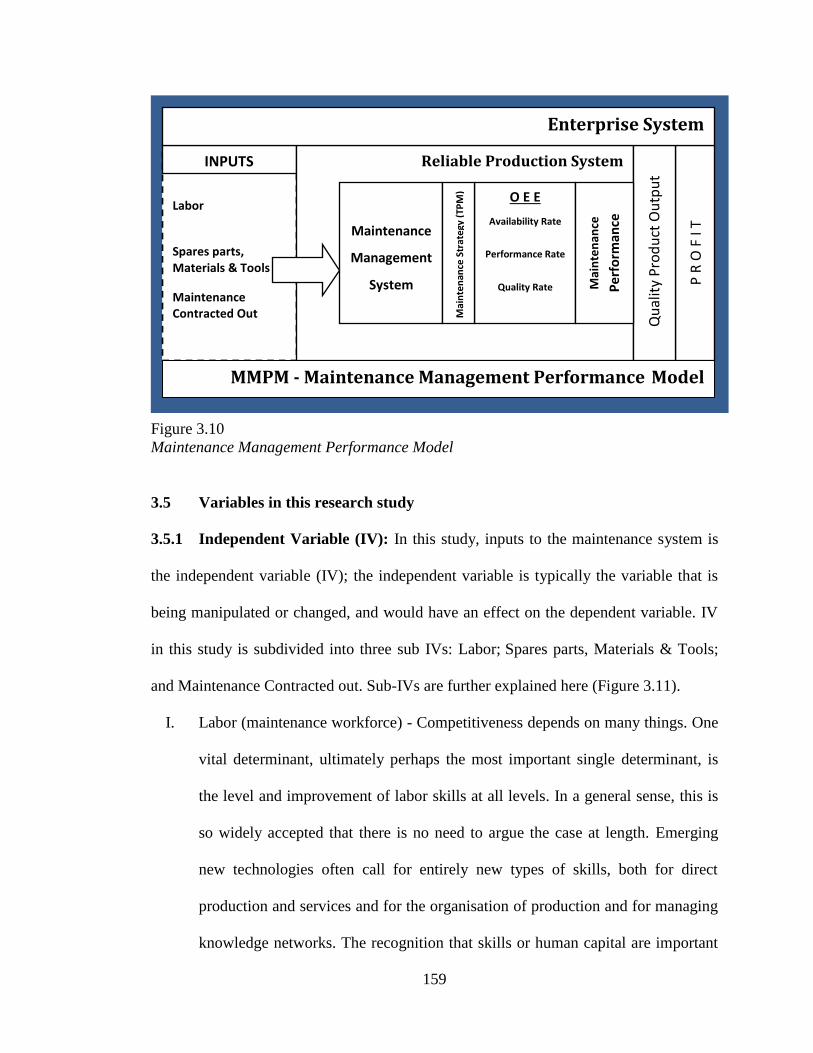
159
Figure 3.10
Maintenance Management Performance Model
3.5 Variables in this research study
3.5.1 Independent Variable (IV): In this study, inputs to the maintenance system is
the independent variable (IV); the independent variable is typically the variable that is
being manipulated or changed, and would have an effect on the dependent variable. IV
in this study is subdivided into three sub IVs: Labor; Spares parts, Materials & Tools;
and Maintenance Contracted out. Sub-IVs are further explained here (Figure 3.11).
I. Labor (maintenance workforce) - Competitiveness depends on many things. One
vital determinant, ultimately perhaps the most important single determinant, is
the level and improvement of labor skills at all levels. In a general sense, this is
so widely accepted that there is no need to argue the case at length. Emerging
new technologies often call for entirely new types of skills, both for direct
production and services and for the organisation of production and for managing
knowledge networks. The recognition that skills or human capital are important
Labor
Spares parts, Materials & Tools
Maintenance Contracted Out
INPUTS Reliable Production System
P R
O F
I T
Qu
alit
y P
rod
uct
Ou
tpu
t
Maintenance
Management
System
O E E
Availability Rate
Performance Rate
Quality Rate
Mai
nte
nan
ce S
trat
egy
(TP
M)
Mai
nte
nan
ce
Pe
rfo
rman
ce
Enterprise System
MMPM - Maintenance Management Performance Model
160
to comparative advantage is of long standing; however, there is a new burst on
interest in its role in economic growth and competitiveness. The new
technological paradigm calls for more skills, for higher levels of skill and for
different kinds of skill. The reasons for these trends are obvious. The pace and
ubiquity of technical progress means that all activities have to improve their
technologies, and so the skills needed to operate them, if they are to compete.
With the liberalization of trade and investment, even non-traded activities are
increasingly exposed to international competition, and have to improve their
competitive base to survive and grow. The need for increased skills rises with the
level of development.
Labor specialization - Trade specialization is a characteristic of traditional
maintenance organizations, the drawbacks of which have been highlighted
earlier. Where the work requires special skills and where the workload can be
made relatively smooth, it is appropriate to adopt trade specialization. However,
it is more usual to find maintenance work that requires a range of skills, although
one skill is usually predominant. In such cases, inter-trade flexibility is of
paramount importance. This can be achieved by developing a multi-skilled
workforce. However, making the transition from a highly specialized structure to
a flexible one is often a lengthy and expensive process because of the investment
in training and the installation of the new structure. Apart from introducing inter-
trade flexibility within the maintenance workforce, there is another emerging
trend in maintenance management; amalgamating the roles of plant operator and
first-line maintainer. The operator-maintainer is trained both to operate the plant
161
and do first-line maintenance across all the traditional trades. An advanced form
of this approach is autonomous maintenance, a key element of TPM (Nakajima,
1988). Autonomous maintenance fosters a sense of plant ownership by
developing the operator-maintainer to be involved in continuous improvement.
Campbell (1995) classifies the commonly used measures of maintenance
performance measures of cost performance; e.g. operations and maintenance
labor and material costs. Labor comprises of the workforce, how well trained and
equipped they are for the job.
Training and Development - Empowerment will degenerate into abandonment if
employees fail to get the right tools, training on their use and support in their
implementation. Educational resources, which can include technical consultation
as well as training, must be available and accessible to employees with identified
needs. For instance, the specialists of maintenance department are called upon to
upgrade operators to operator-maintainers in TPM, or external consultants are
hired to train members of the contract-negotiation team and the contract-
management team for outsourcing of maintenance work. However, the training
should not be limited to transfer of technical skills and knowledge needed for
optimal task performance. It should also cover generic matters like the business
imperatives peculiar to the organization (what determines the value of its product
and services to customers), problem-solving techniques, team dynamics and
facilitation skills. The additional training for managers’ addresses issues such as
the new roles (leader, communicator, coach, resource providers) they perform in
162
the change programs, and the new management behaviours that will align efforts
and foment commitment towards organizational goals.
II. Spares parts, Materials & Tools include: Spare parts, how well is spare parts
inventories stocked to meet maintenance demand. Materials include
consumables such as welding rods, chemicals for the water treatment, or steel for
fabrication, and many more. Tools include hand tools, power tools, specific
equipment such as weld sets, portable lathes, band saws, grinders, pipe benders,
electric diagnostic meters, and many more. In most cases, these measures are
tracked because the organization has always used them, other organizations are
using them or the required data are easy to collect. These are diagnostic
measures (Simons, 1995) that determine whether the maintenance function
remains in control or compares favourably with its counterparts elsewhere within
or outside the organization. Thus, they are selected largely to support operational
control and benchmarking of performance. They are furthermore characterised as
being backward looking and introspective, with a strong bias on financial and
process-related measures. This type of unbalanced measures would encourage
dysfunctional behaviours such as cutting back investment in operator training
and equipment design modifications to achieve cost reduction in the short term.
However, the potential recurring savings that can be realized from reliability and
maintenance improvement are missed and committing to longer than necessary
turnaround time for major overhauls to produce good results in schedule
compliance. Obviously, these commonly used performance measures are often
inappropriate for determining the contribution of maintenance to the business
163
success of the organization. To achieve that purpose, the performance measures
must be linked to the adopted strategy of the maintenance function. In some
cases, data on labor cost includes the cost of tools and equipment provided to the
maintenance personnel to do their job. The widely used performance measures
were developed on the premises of the scientific management movement
pioneered by Frederick Taylor about a century ago, a period when demand far
exceeded supply, the operating environment was very stable, and labor intensive
operations were the norm. The conventional wisdom of management which
evolved from such a background is characterised by a preoccupation with
maximizing the utilization of resources. Thus, in assessing maintenance
performance, various efficiency indicators (such as equipment availability and
labor utilization) and financial measures (such as repair and preventive
maintenance costs) are routinely tracked.
III. Maintenance contracted out: Prior to starting the outsourcing program the
company should objectively evaluate its actual situation with respect to some
critical issues. Maintenance staff should adequately review internal structure,
processes and management procedures, personnel capabilities and their
responsiveness to changes and innovations. A definite picture of the overall
ability to manage the outsourcing program could be drawn and company's
readiness to outsource maintenance activities could be somehow quantified. The
choice of the activities to be externalised represents another important decision
to be faced at the very early stages of the outsourcing program. Generally, “non-
core” competencies are all good candidates for outsourcing, being standard, well
164
defined and repetitive activities (such as, repair of generic and common
equipments, electrical and electronic parts and plant overhauls). Besides, many
of them are adequately performed by a growing number of specialized suppliers
available in the marketplace, with interesting costs and quality rates. In this case,
the risk of losing expertise and know-how is minimal while, on the other hand,
in-house maintenance personnel can concentrate on critical and valuable
technical topics (Dunn, 2009). To maximise the potential advantages and to
minimise the risks deriving from the adoption of outsourcing policies, an
extremely important role is covered by the selection of the right supplier. It is,
therefore, necessary to develop the selection criteria and the benchmarking
activities to evaluate and analyse their capabilities including geographical
position (i.e. local presence), the perceived quality of goods and services,
contractor flexibility, technical excellence, plant-specific know-how and
experience, and competitive low price. These are some good examples of
performance factors that may be used to this end (Choi & Hartley, 1996). It is
crucial to obtain a sustained spirit of co-operation and mutual understanding that
benefits both parties. The most successful outsourcing arrangements are those in
which the supplier brings a “partnership philosophy” to the alliance (Judenberg,
1994). Of particular importance will be the explicit consideration of risk at
various key points in the contracting process, and the identification of
appropriate strategies for managing those risks. The specification of requirement
during the tendering process will need to be carefully considered. In particular,
for those contracts involving large-scale outsourcing of most maintenance
165
functions, there will be a demand to ensure that the requirements specification is
outcome-based, rather than input-based. In other words, the specification will
need to detail what is to be achieved from the contract, not how it is to be
achieved, or what inputs will be required for its achievement.
3.5.2 Moderating Variable (MV) - In this study, “maintenance strategy” is
the moderating variable; moderating variable is the one that affects the
direction and/or strength of the relation between an independent or predictor
variable and a dependent or criterion variable. Several maintenance strategies are
being applied in the industry, namely; BDM, PM, TPM, RCM, and CBM.
3.5.3 Dependent Variable (DV) - Dependent variable is a variable in a logical
or mathematical expression whose value depends on the independent variable;
"if f(x) = y, y is the dependent variable". In this study “maintenance management
performance” is the dependent variable; dependent variable is the observed result
of the independent variable (Figure 3.11).
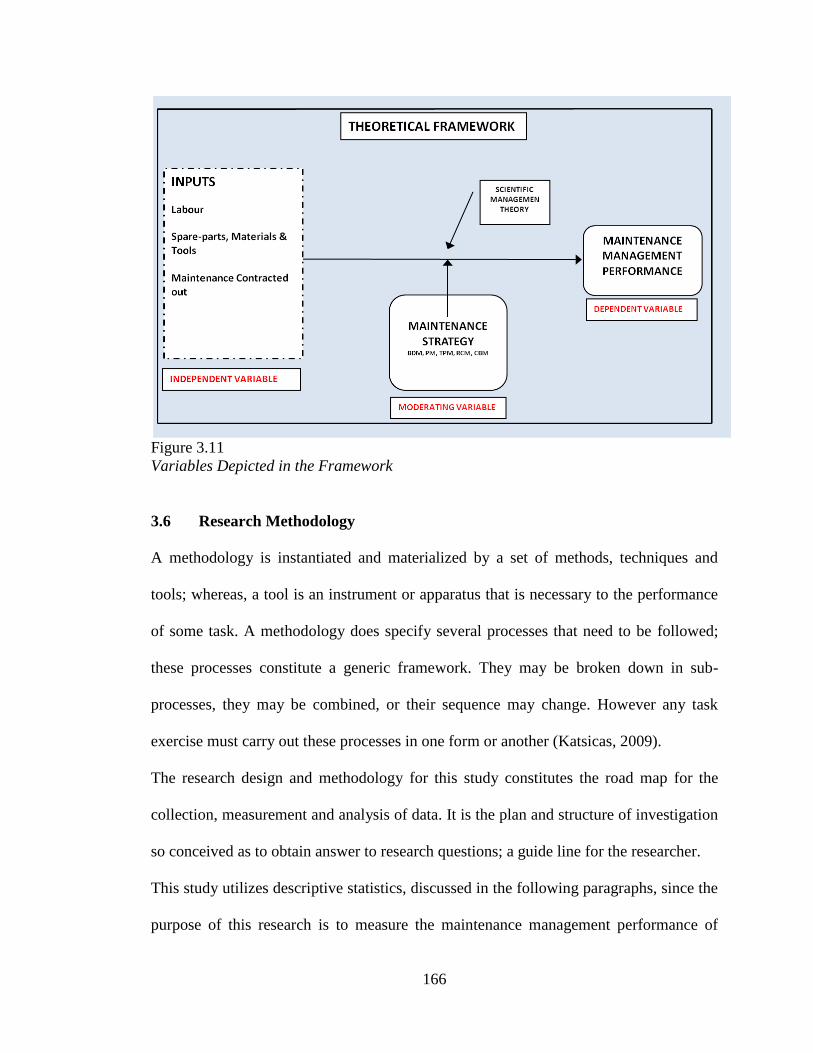
166
Figure 3.11
Variables Depicted in the Framework
3.6 Research Methodology
A methodology is instantiated and materialized by a set of methods, techniques and
tools; whereas, a tool is an instrument or apparatus that is necessary to the performance
of some task. A methodology does specify several processes that need to be followed;
these processes constitute a generic framework. They may be broken down in sub-
processes, they may be combined, or their sequence may change. However any task
exercise must carry out these processes in one form or another (Katsicas, 2009).
The research design and methodology for this study constitutes the road map for the
collection, measurement and analysis of data. It is the plan and structure of investigation
so conceived as to obtain answer to research questions; a guide line for the researcher.
This study utilizes descriptive statistics, discussed in the following paragraphs, since the
purpose of this research is to measure the maintenance management performance of
167
palm oil mills; the target population of this study. Measurement serves the researcher as
a numerical report of observations. In some respects, measurement can be considered a
special “language” for reporting observations numerically. Measurement bridges the gap
between what a researcher reports as an observation of a variable in the real world and
what has been defined as a variable in a statistical model. A graphic depiction of the
methodology is given in Figure 3.12.
3.6.1 Indexes of Population and Sample Design
Indexes of populations: it is rarely feasible to observe and measure an entire population.
What is done, instead, is to measure some portion (sample) that is taken as the
representative of a population. However, anticipating a lower response rate due lack of
CSR culture prevalent in Malaysian industries (MIM, 2009), survey questionnaire was
mailed to entire palm oil mills population, all 373 of them supposed to be in operation
out of the total 434 registered according to MPOB, 2010, list.
Descriptive statistics, applied in this study, provides a basis for calculating such indexes
as the mean, median, mode, and standard deviation; given these indexes, the researcher
then applied statistics to generalise these indexes as to how they apply to the entire
population.
The researcher compiled a complete list of the entire palm oil mills population; official
master list on compact disc was obtained from the MPOB and verified against the listed
companies in MPOC data base.

168
Figure 3.12
Graphic depiction of Methodology
3.6.2 Measuring Instrument – Design, Testing, and Validation
An Instrument – in statistics, is a tool used to collect measures of the research variables.
Variable is an observable characteristic of an object or event that can be described
according to some well-defined classification or measurement scheme that is likely to
change or vary, subject to variation; changeable.
169
There are three main variables that constitute the design of this study. Independent
variable is a variable whose values are independent of changes in the values of other
variables; “Inputs” to the maintenance function is the independent variable (IV), further
classified into three sub-IVs. Moderating variable is characterized statistically that
affects the direction and/or strength of the relation between dependent and independent
variables; “maintenance strategy” is the moderator variable (MV). Dependent variable is
an observed variable in an experiment or study whose changes are determined by the
presence or degree of one or more independent variables; "maintenance management
performance” is the dependent variable (DV).
3.6.3 Measuring Instrument: Survey Questionnaire
A questionnaire is a research instrument consisting of a series of questions and other
prompts for the purpose of gathering information from respondents. An effective
questionnaire should include “Questions” that are reliable when they elicit the same
response at different times, or with different respondents, when the levels of functioning
and related circumstances are the same. Data collection instruments should always be
tested, a small investment in resources on testing can save a large amount of resources if
errors are detected. Systematic errors, if undetected, can make the data collection
activity unfit for the purposes it was meant to serve. Thorough testing minimises non-
sampling errors. Additionally, testing provides management information useful for
planning the conduct of any data collection undertaking. A complete testing strategy
involves the following two components: Pre-testing, the investigation of possible data
quality concerns and the identification of ways to minimise identified sources of non-
170
sampling error; Field testing (or pilot testing) - systematic testing on a set of respondents
to isolate potential bias and sampling errors.
The questionnaires for this research study strike a balance between simplicity and
sufficient detail to enable reasonably well informed managers to systematically assess
the strategic contribution of their own operations, overall and in detail. Two types of
questionnaire were designed for the data collection. One was meant for the private mills
operating in individual capacity (Appendix-A) and the other catered to head offices of
the multi-mill operations (Appendix-B). Some of the problems with the questionnaire
were anticipated such as the design of the questionnaire could be criticized, terminology
could be seen problematic for some respondents leading to ambiguous responses, and
there may be some respondents who do not fully understand the questionnaire.
However, as middle managers and management students who had been exposed to,
widely in use, maintenance strategies – such as PM and TPM, they ought to have a good
understanding of the terminology used. There may be some respondents who do not
have an adequate level of knowledge of operations to be able to answer appropriately.
However, the author provided easy to understand questions to respondents in order for
them to answer the questionnaire as explicitly as possible. Calls for more empirical
research in operations management have led to an upsurge in the use of questionnaire-
based survey methodologies over the last decade (Filippini, 1997; Scudder & Hill, 1998;
Malhotra & Grover, 1998) and this is now the most commonly used methodology in
empirical operations management research. Considerable care was taken to make the
questionnaire, simple and suitable, for the Malaysian audience. The questionnaire was
reviewed, modified and approved on three separate occasions by mill managers and mill

171
maintenance engineers. This was done in exclusive visit to three palm oil mills during
the pilot study; list of the mill participants is given in Appendix-E. Particular attention
was given to the facts that questionnaire is not too long and questions are not
cumbersome to answer. Mill will impart with voluntarily the information solicited,
without risk of compromising their commercial confidentiality; and solicited
information is relevant to the research goals. The cover letter that was sent to mills
(Appendix-C) and the head offices (Appendix-D) contained a non-disclosure agreement
to ensure confidentiality of the data collected.
Questionnaire cover page contains information about the research title, researcher,
supervisors, and the non-disclosure agreement. The questionnaire is divided in the
following two parts. Part one solicits background information of the responding
organisation and respondent, and its maintenance department. Part two comprises of 11
strategically selected questions that solicit data on Maintenance Inputs, CPO Production,
mill hours worked & hours of downtime and POME Generated & Treated. This data
was collected for the ‘Financial Year 2010’ and utilized to calculate overall OEE for
CPO overall extraction process, for complete palm oil mill sector and assessment of
POME disposal practices under sustainability regulations.
During validation of the list of palm oil mills it was established that only 15% of the
total palm oil mills had valid email address. Considering this, a direct mail survey was
selected to collect data from the palm oil mills, mail survey was deemed as the most
appropriate method for data collection (Salant & Dillman, 1994; Mangione, 1995).
172
The questionnaire was mailed to palm oil mills in a two-week period using the
Malaysian Postal Service starting 7th
. July 2011. The participants were asked to answer
all questions objectively and to reply by regular mail through the addressed and postage
paid envelop provided. Most of the replies were received by the end of August 2011;
however, the last reply was received at the end of January of 2012. After receiving each
reply, it was immediately entered into a computer database along with the returned
letters.
3.6.4 Primary Data Collection and Validation
Primary Data collected through the survey questionnaire was entered in an excel
spreadsheet (Appendix-G) under four subheads of: Mill’s general information 2010;
Mill’s maintenance inputs 2010; Mill’s outputs 2010; and Mill’s downtime 2010.
Validation of the primary data was done through triangulation (4.2.1). Triangulation is a
powerful technique that facilitates validation of data through cross verification from
more than two sources. In particular, it refers to the application and combination of
several research methodologies in the study of the same phenomenon (Bogdan &
Biklen, 2006). It can be employed in both quantitative (validation) and qualitative
(inquiry) studies and it becomes an alternative to traditional criteria like reliability and
validity. Altrichter et al. (2008) contend that triangulation "gives a more detailed and
balanced picture of the situation." While, according to O’Donoghue and Punch (2003)
triangulation is a “method of cross-checking data from multiple sources to search for
regularities in the research data.
173
Denzin (2006) identified four basic types of triangulation: Data triangulation - involves
time, space, and persons; Investigator triangulation - involves multiple researchers in an
investigation; Theory triangulation - involves using more than one theoretical scheme in
the interpretation of the phenomenon; and Methodological triangulation - involves using
more than one method to gather data, such as interviews, observations, emails, phone
calls, questionnaires, and documents.
The purpose of triangulation in research is to increase the credibility and validity of the
results. This is the most widely practiced validation tool in the industry, worldwide.
Operations management is provided with data from several sources that sometimes have
competing interests such as maintenance, production, quality assurance, and sales. Each
department, to some extent, has a tendency to skew the data to their eminence.
3.7 Chapter Summary
Primary Data was collected through the survey questionnaire and, for reliability and
validation, triangulation was applied. The purpose of triangulation is to increase the
credibility and validity of the results. This is the most widely practiced validation tool in
the industry, worldwide. The chapter also discusses variables. ‘Inputs’ to the
maintenance system is the independent variable (IV) which is divided into three sub
IVs: Labor; Spares parts, Materials & Tools; and Maintenance Contracted out.
Maintenance strategy is the moderating variable (MV) and maintenance performance is
the DV. Descriptive statistics, applied in this study, provides a basis for calculating such
indexes as the mean, median, mode, and standard deviation; these indexes, have been
used to generalise as to how they apply to the entire population. Correlation tests were
carried out using SPSS and added to the analysis.
174
Maintenance comprises of multitude of divergent prospective, and given the constraints,
optimization is not always necessary. The developed maintenance management
evaluation model draws on the ‘input-output’ concept put forward by Tsang (2002) and
uses OEE, TPM’s KPI, for maintenance evaluation. OEE is a formula used in the
manufacturing industry to calculate the overall equipment effectiveness of a branch or
complete production system; formula was presented as an overall metric in the TPM
concept. OEE is a crucial measure in TPM that reports on how well equipment is
running. Collection of data for calculating OEE for individual machines or equipment
can also be done through daily production logs; it can be computed to obtain operational
history of critical machines and equipment on daily, weekly, monthly, or annual basis
for comparison and improvement. For ease of use and interpretation at the shop level, all
the information is negotiated, using simple calculations, through linked spreadsheet cells
containing readily available data. OEE figure thus obtained could be improved upon.
TPM and its KPI ‘OEE’ has been determined as a best in class manufacturing
improvement tools and the proposed ‘MMPM’ model offers a pragmatic elucidation for
performance measurement and improvement.
175
CHAPTER FOUR
4.0 RESULTS AND DISCUSSION
4.1 Introduction
Data analysis is a process of inspecting, cleaning, transforming, and modeling data with
the goal of highlighting usefulness of research results, suggesting conclusions, and
supporting decision making. Data analysis has multiple facets and approaches,
encompassing diverse techniques under a variety of names, in different business,
technology, physical science, and social science domains. Data integration is a precursor
to data analysis, and data analysis is closely linked to data visualization and data
dissemination. Data integration involves combining data residing in different sources
and providing users with a unified view of these data (Lenzerini, 2002). According to
Lane (2006) this process becomes significant in a variety of situations and appears with
increasing frequency as the volume and the need to share existing data explodes, it has
become the focus of extensive theoretical work and in management circles, people
frequently refer to data integration as Enterprise Information Integration (EII).
Data visualization is the study of the visual representation of data, meaning; information
which has been abstracted in some schematic form, including attributes or variables for
the units of information (Friendly, 2008). The main goal of data visualization is to
communicate information clearly and effectively through graphical means. It doesn’t
mean that data visualization needs to look boring to be functional or extremely
sophisticated to look beautiful. To convey ideas effectively, both aesthetic form and
functionality need to go hand in hand, providing insights into a rather sparse and

176
complex data set by communicating its key-aspects in a more intuitive way. Yet
designers often fail to achieve a balance between design and function, creating gorgeous
data visualizations which fail to serve their main purpose; to communicate information
(Friedman, 2008). Data visualization is closely related to Information graphics,
Information Visualization, Scientific Visualization, and Statistical Graphics. In the new
millennium data visualization has become active area of research, teaching and
development. It has united the field of scientific and information visualization (Post et
al., 2002). Applying aforesaid analyzing tools, this chapter validates data and calculates
the central tendency of IV and DV. It also quantifies the inefficiency cost of the milling
sector by analyzing OEE, OER, and yield. The chapter also discusses the role of
moderator, maintenance strategy (TPM), and POME generation and treatment in the
palm oil milling sector.
4.2 Data Collection and Enumeration
Given the fact that only 15% of the total palm oil mills had valid email address, and
considering other options and constrains (i.e. mail survey, phone survey, face-to-face
survey and internet survey), a direct mail survey was sent to all the palm oil mills. The
mailing list consisted of contact information of 373 operating companies out of the 434
listed with MPOB, spread throughout Malaysia. 41 usable responses were received, 38
by mail and three by email. None of the 20 head offices contacted for survey responded.
The questionnaires sent to 15 companies were returned to the sender due to wrong
mailing addresses, listed. Three companies called in that they were not willing to
participate in the survey, and five companies returned the survey unfilled. This led to
177
response rate of 11% as expected for a direct mail survey (Erdos & Morgan, 1983). 41
respondents are adequate as 30 is the minimum number of respondents required to do
just basic quantitative statistical analysis (O’Leary, 2004). It is worth noting that a CSR
survey was sent out to 2000 companies by the MIM in 2009; of the 2000 to whom the
survey was sent, only 110 responded. The low response rate of 5.5% is reflective of
Malaysian Companies’ lack of interest and respect for CSR activities. Primary data
information received through the respondent surveys was entered in the Excel
spreadsheet under four subheads with the following information under each subhead:
i. Mill’s general information: name of the mill; year started production; approved
FFB processing capacity tons/h; maintenance personnel employed; maintenance
strategy adopted by the mill; and equipment contracted out for maintenance
ii. Mill’s maintenance inputs, cost in Ringgits, 2010: Labor (maintenance
workforce); spares, materials, & tools; and maintenance work contracted out
iii. Mill’s production outputs, in tons, in 2010: FFB processed; CPO produced (in
spec); out of spec CPO and slush oil produced; and mill effluent (POME)
produced and treated
iv. Mill’s uptime 2010: total mill hours worked; and mill’s total downtime
For privacy of the mills, their names have been omitted from all the tables provided in
this thesis. Prior to the start of data analysis process, the preliminary data was checked
for normality, information was triangulated; compared to the data collected through pilot
study on three mills. 87.8% of the respondents belong to SMEs; classified according to
FFB processing capacity, under 60 tons/h fall under SMEs (MPOB, 2010). Data for
178
these subheads was tabulated from the primary information recorded in Excel
spreadsheet, through simple calculations entered in linked cells (Appendix-G).
4.2.1 Data Validity and Reliability
Mills’ Data collected through survey questionnaire was validated by triangulation:
i. Data reported by mills in the survey regarding hours worked, FFB processed,
and CPO produced, in the financial year 2010, comes from the financial
statements that mill submit to their head offices for profit and loss calculations;
the records are factual, valid, and reliable.
ii. Mean OER calculated using respondents’ data comes to 0.2044 (20.44%). This
figure concedes with the of average OER industry figure reported by MPOB
(2010) further validating the primary data provided by the mills.
iii. Data of hours worked by the mills conforms to CPO produced at the calculated
OER and affirms its reliability.
179
4.2.2 Data adaptations: presumptions conceived from the survey (appendix-
E&G)
i. An hour daily added for set-up & adjustment; boiler start-up and other
adjustments, 1/2 hour per shift added for minor stops – availability.
ii. Mills worked two, 8-hour shifts, 6 days a week, 50 weeks per year.
iii. First hour CPO production treated below spec and accounted towards quality
rate.
iv. Unfilled information was supplied with average figures to keep continuity in
calculations.
v. For per ton cost of Sub-IVs for a ton of CPO good quality CPO was taken into
account.
vi. FFB processing capacity adjusted where the actual running capacity was
dissimilar.
vii. Below spec CPO for the year include 300 hours of production plus reported
slush oil recovered.
viii. POME figures were reversed where POME treated figures were more than
POME produced.
ix. Missing data was calculated at the average cost per ton of CPO produced.
Information for analysis and interpretation through SPSS regarding three sub-IVs, MV,
and DV, was further processed. In this Excel spreadsheet informative data was
computed to arrive at per ton cost of CPO for three sub-IVs: Labor (maintenance
workforce); spares, materials & tools; and maintenance work contracted out. Data was
also computed to calculate OEE (DV) through simple calculations applied in linked cells
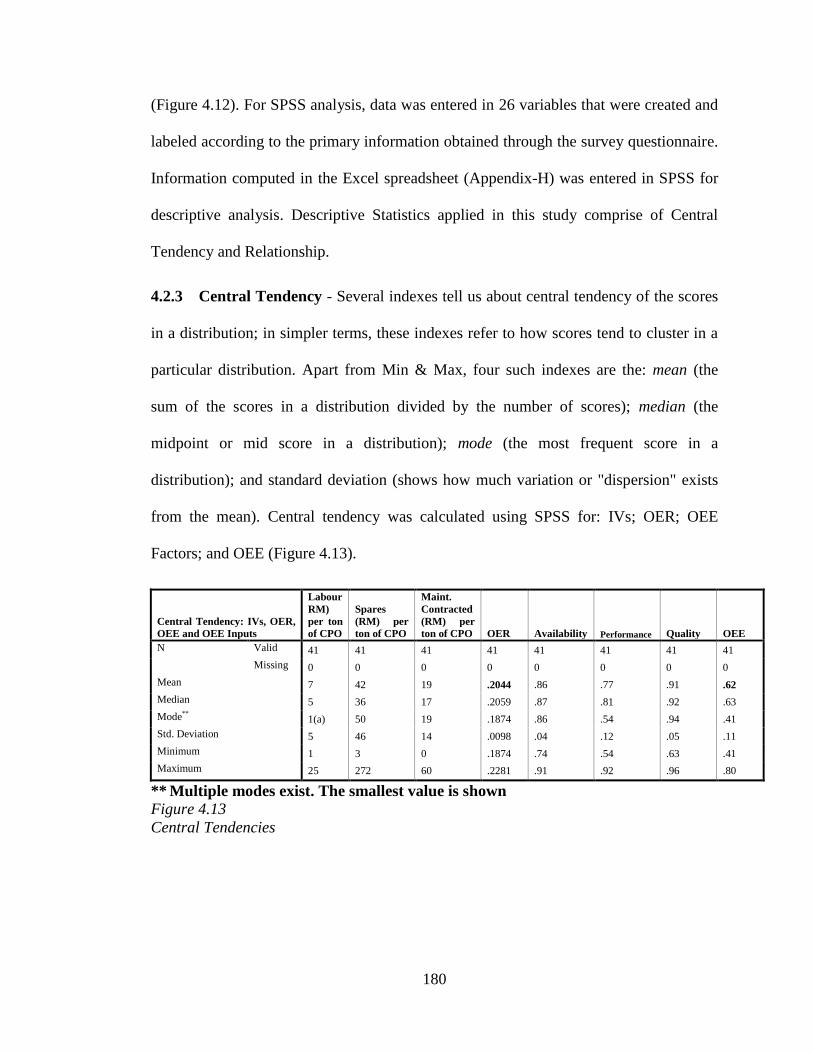
180
(Figure 4.12). For SPSS analysis, data was entered in 26 variables that were created and
labeled according to the primary information obtained through the survey questionnaire.
Information computed in the Excel spreadsheet (Appendix-H) was entered in SPSS for
descriptive analysis. Descriptive Statistics applied in this study comprise of Central
Tendency and Relationship.
4.2.3 Central Tendency - Several indexes tell us about central tendency of the scores
in a distribution; in simpler terms, these indexes refer to how scores tend to cluster in a
particular distribution. Apart from Min & Max, four such indexes are the: mean (the
sum of the scores in a distribution divided by the number of scores); median (the
midpoint or mid score in a distribution); mode (the most frequent score in a
distribution); and standard deviation (shows how much variation or "dispersion" exists
from the mean). Central tendency was calculated using SPSS for: IVs; OER; OEE
Factors; and OEE (Figure 4.13).
Central Tendency: IVs, OER,
OEE and OEE Inputs
Labour
RM)
per ton
of CPO
Spares
(RM) per
ton of CPO
Maint.
Contracted
(RM) per
ton of CPO OER Availability Performance Quality OEE
N Valid 41 41 41 41 41 41 41 41
Missing 0 0 0 0 0 0 0 0
Mean 7 42 19 .2044 .86 .77 .91 .62
Median 5 36 17 .2059 .87 .81 .92 .63
Mode** 1(a) 50 19 .1874 .86 .54 .94 .41
Std. Deviation 5 46 14 .0098 .04 .12 .05 .11
Minimum 1 3 0 .1874 .74 .54 .63 .41
Maximum 25 272 60 .2281 .91 .92 .96 .80
** Multiple modes exist. The smallest value is shown
Figure 4.13
Central Tendencies
181
4.3 OEE – the Dependent Variable (DV)
The foremost research objective of this study was to evaluate performance of
maintenance management system at the Malaysian palm oil mills, by measuring OEE. In
today's highly competitive environment maintenance, quality, and productivity are
essentially related components and are integral operational elements for a modern,
sustainable, and profitable production system. Suitable maintenance policy and strategy
leads towards improving equipment reliability and maintainability, and maximizes OEE
(i.e. zero breakdowns, zero accident, and zero defects); it raises productivity and
contributes to better quality output as detailed in section 1.2.5. Continuous
manufacturing systems used within the palm oil milling industry involve different
machines, equipment, and processes that are arranged in a sequence of operations in
order to manufacture the product - CPO. The palm oil industry is generally categorized
as capital-intensive industry and, because of high capital investment, the utilization of
equipment as effectively as possible is of high priority. As evidenced by literature, the
idea of linking maintenance quality and productivity together and finding analytical
and/or mathematical relationship among them is perhaps at its early stage, at present
(Ben-Daya & Duffuaa, 1995; Jambekar, 2000; Alsyouf, 2007); however, there is
literature support to demonstrate that a one to one relationship between the two
components has been viewed in a number of sources (Ben-Daya & Duffuaa, 1995;
Jambekar, 2000; Alsyouf, 2007; Lee, Beruvides, & Chiu, 2007; Helms, 1996). Ben-
Daya and Duffuaa (1995) highlighted and proposed conceptual approaches for linking
and modeling the relationship between maintenance and quality and Alsyouf
(2007) proposed a conceptual model that links maintenance, productivity and
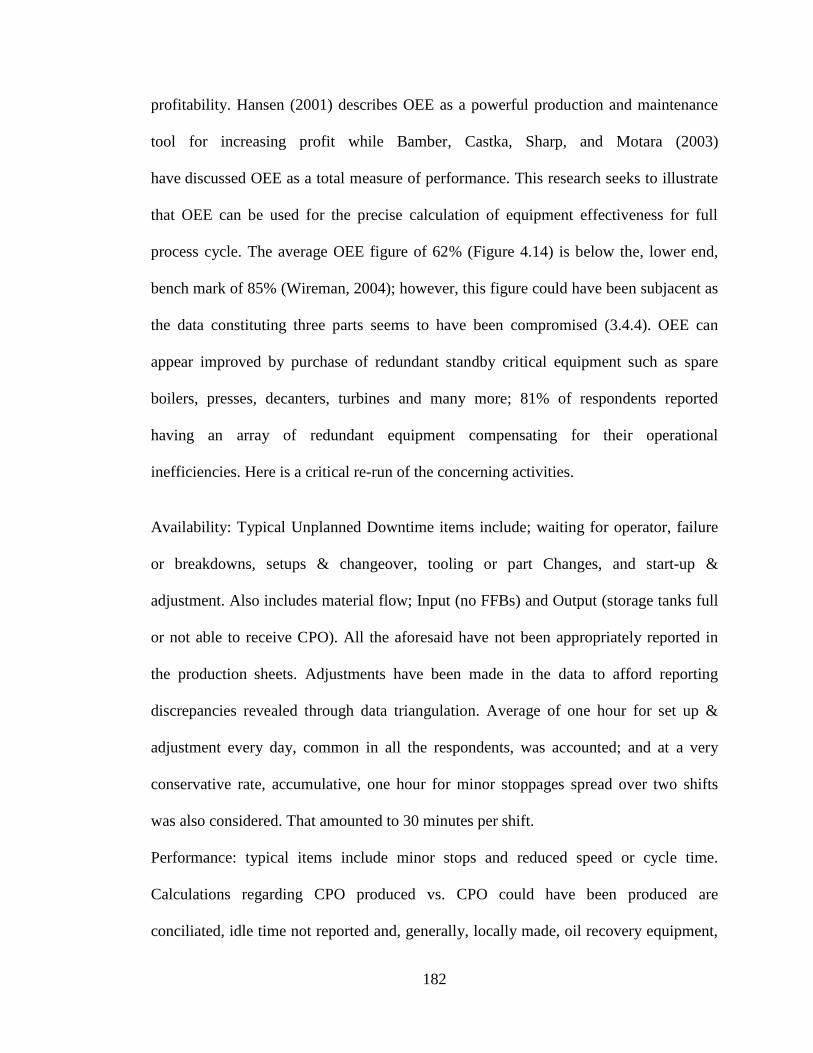
182
profitability. Hansen (2001) describes OEE as a powerful production and maintenance
tool for increasing profit while Bamber, Castka, Sharp, and Motara (2003)
have discussed OEE as a total measure of performance. This research seeks to illustrate
that OEE can be used for the precise calculation of equipment effectiveness for full
process cycle. The average OEE figure of 62% (Figure 4.14) is below the, lower end,
bench mark of 85% (Wireman, 2004); however, this figure could have been subjacent as
the data constituting three parts seems to have been compromised (3.4.4). OEE can
appear improved by purchase of redundant standby critical equipment such as spare
boilers, presses, decanters, turbines and many more; 81% of respondents reported
having an array of redundant equipment compensating for their operational
inefficiencies. Here is a critical re-run of the concerning activities.
Availability: Typical Unplanned Downtime items include; waiting for operator, failure
or breakdowns, setups & changeover, tooling or part Changes, and start-up &
adjustment. Also includes material flow; Input (no FFBs) and Output (storage tanks full
or not able to receive CPO). All the aforesaid have not been appropriately reported in
the production sheets. Adjustments have been made in the data to afford reporting
discrepancies revealed through data triangulation. Average of one hour for set up &
adjustment every day, common in all the respondents, was accounted; and at a very
conservative rate, accumulative, one hour for minor stoppages spread over two shifts
was also considered. That amounted to 30 minutes per shift.
Performance: typical items include minor stops and reduced speed or cycle time.
Calculations regarding CPO produced vs. CPO could have been produced are
conciliated, idle time not reported and, generally, locally made, oil recovery equipment,

183
such as presses and vibrating screens, is not efficient as oil recovery rate is poor,
averaging under 20%, compared to 30% of mills with best practices (MPOB, 2010).
More over 2 – 4% CPO ends up in EFB and POME. Reduced speed or cycle time was
not being recorded by any of the responding mills. The one speed mill line ran
continuously, with or without FFB supply.
Quality: CPO produced in the first hour of mill process is usually out of spec due to
excessive moisture and other contaminations while the line is adjusted. However, mills
have the tendency to pour the low quality CPO in the main storage tanks where it gets
mixed with the rest of the day’s production. Only 10% of the respondents reported on
this account, separately. However, Low grade oil, slush oil, recovered from POME
ponds, was reported by 41% of the respondents; the remainder might be incited to
release it with the POME into dug channels, leading to adjacent open lands. Mills were
not ready to disclose the sales figures. The author had no access to the sales figures of
the mills, hence, there was no way to find out if the CPO sold by mills earned them the
best market price for in-spec CPO, as low quality is bound to bring them low price.
However, to satisfy share holders and pacify regulators, mills can get away with it by
blaming it on the market fluctuations; nevertheless, data is compromised.
4.3.1 Data Collecting Issues and Challenges - Theory and Practice Gap
Collecting the data from operators on the performance factor is not always a reliable
measure, explained at length in section 3.4.4. Pilot study and main data triangulation
revealed that most of the mills settle on manual data collection. There is a hereditary
problem in that. Manual forms are often filled in at the end of shift that may not reflect
the truth of what actually happened. The longer the time between the event and the

184
recording the greater is the chance of inaccuracy in data collected. Some companies
recorded the downtime data at the end of the job, some at the end of the shift, and some
even at the end of the week. The aforesaid methods could potentially compromise the
figures that contribute to OEE. Pilot study and data triangulation revealed that most
mills do not record or report minor stoppages of equipment (none of the respondents’
recorded minor stoppages). That distorts the down time figure and skew OEE figure
towards better efficiency.
To resolve the problems of data collection the recording of all the factors needs to be
automated or achieved as unobtrusively as possible. Proper sensors installed
strategically can provide the data required. This can be addressed by installing a simple
‘heartbeat’ sensor to monitor if the machine is running or not and at what speed. In the
event of the machine stopping, the operator simply has to record the reason for the stop
through a scan of a barcode. This ease of use will provide the mill with ‘machine truth’.
185
Figure 4.14
OEE: mean and standard deviations
Mills should adopt best practices including a participative and social process is in place.
There is a widespread understanding of the maintenance role in OEE, maintenance
strategy is widely communicated, momentum of change must be maintained, and the
support infrastructure must be in line with the adopted strategy. This is the starting point
to not only implementing OEE measurement but gaining the power to improve it.
Maintenance daily service log (Figure 5.20) recordings can be used to cross check the
down times. Some organizations may be instigated to misconstrue their OEE figures by
using any of the following channels; log the breakdowns as planned maintenance, use an
186
easy performance standard, measure the best machine or line and quote that figure, or
set arbitrary targets and achieve them through the above.
4.3.2 OEE: Cautions for using and Issues to be considered
Based on the wide spread and diverse understanding and use of OEE, there are several
cautions to be considered regarding its use:
i. Calculated OEE is not valid for comparing or benchmarking different assets,
equipment, or processes. OEE is a relative indicator of a specific single asset or
process effectiveness compared to itself over a period of time. However, OEE
can be used to compare alike equipment in similar situations producing matching
products or output.
ii. A calculated OEE percentage assumes that all equipment-related losses are
equally important and that any improvement in OEE is a positive improvement
for the business. This generally may not be the case. For example, the calculated
OEE percentage does not consider that a one percent improvement in quality
may have a bigger impact on the business than does a one percent improvement
in availability. Also, in the OEE calculation, three different units of measure are
erroneously considered as the same; chronological time, units per time, and
counts of units produced and are converted to percentages for comparison. OEE
percentages can actually improve while actual quality losses increase
significantly. OEE percentages can actually decline while output improves;
efficiency and quality losses are reduced and the same planned output is
generated in less time thereby lowering the “availability” percentage, three shifts
of output in two shifts.

187
iii. The only reason to measure and analyse anything is to improve it. If one is not
going to use the whole improvement cycle there is no point in measuring OEE. It
tells management nothing which they do not already know. At a gross level all
OEE tells the organisation as to how much a product it made compared to how
much could have been made. Averaging OEE’s over whole plants, sometimes,
hides issues. OEE is more effective improvement tool for use in specific
improvement projects. The biggest misuse of OEE is to use it to compare
different processes, plants or machines. It is an improvement measure for
organisations who want to improve their equipment performance.
iv. Given the lack of agreement on OEE definition between recognized OEE experts
and years of use and misuse, acceptance of a single OEE definition within
business and industry is unlikely.
v. Comparable or similar metrics: The metrics of Asset Utilization (AU); Overall
Plant Effectiveness (OPE) for petro-chemical process industries; and Total
Equipment Effectiveness Performance (TEEP) are derivations of the original
OEE metric
vi. Lack of agreement on the definition of “Availability” as 24 hours, seven days,
scheduled time, or actual running time (utilization).
vii. The “Overall” nature of OEE is not all encompassing. Provided reliable data is
available, other related metrics that should be considered include; operating and
maintenance costs, RONA, MTBF, MTTR, and utilization.
188
4.4 Palm Oil Milling Sector ‘Inefficiency Cost’ Quantified
4.4.1 OEE
The computed average figure of 62% was measured against the world class industry
benchmark of 85% (Wireman, 2004) for further analysis to compute annual industry
losses and cost of this milling process inefficiency to the palm oil sector. There is a gap
of 23% (85-62%). Malaysian CPO production is 18.9 million tons/year at an OEE of
62% this translates into 304,839 tons of CPO for 1% of OEE. For the gap of 23% the
figure is, staggering, 7,011,290 tons CPO per year worth RM 22.44 billion, at prevailing
rate of CPO per ton of MR 3200 (Figure 4.15).
4.4.2 Yield
Bridging the yield gap between national average of 4 tons/ha, and 8 tons/ha of mills with
best practices, has the potential to produce an additional 18.9 million tons of CPO worth
over RM 60.48 billion (Figure 4.14). It would be equivalent to RM 83.4 billion in export
earnings.
4.4.3 OER
Mean figure afforded by the survey data for oil recovery is low, averaging 20%;
whereas OER of mills with best practices is 30% (MPOB, 2010). If the palm oil mills
can bridge this gap and improve their OER by 10%, they would be able to earn an
additional RM 30.24 billion per year (Figure 4.15). Total recoverable potential cost due
to the inefficiencies of Malaysian palm oil milling sector amounts to RM 114.556 billion
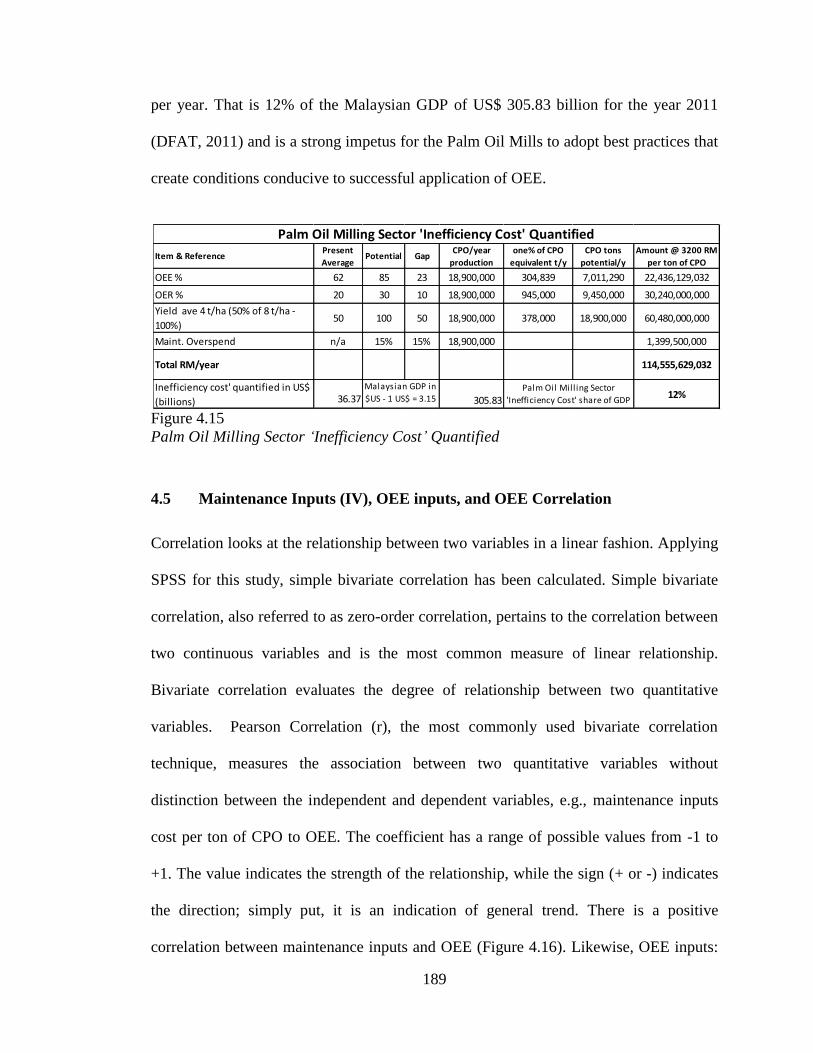
189
per year. That is 12% of the Malaysian GDP of US$ 305.83 billion for the year 2011
(DFAT, 2011) and is a strong impetus for the Palm Oil Mills to adopt best practices that
create conditions conducive to successful application of OEE.
Figure 4.15
Palm Oil Milling Sector ‘Inefficiency Cost’ Quantified
4.5 Maintenance Inputs (IV), OEE inputs, and OEE Correlation
Correlation looks at the relationship between two variables in a linear fashion. Applying
SPSS for this study, simple bivariate correlation has been calculated. Simple bivariate
correlation, also referred to as zero-order correlation, pertains to the correlation between
two continuous variables and is the most common measure of linear relationship.
Bivariate correlation evaluates the degree of relationship between two quantitative
variables. Pearson Correlation (r), the most commonly used bivariate correlation
technique, measures the association between two quantitative variables without
distinction between the independent and dependent variables, e.g., maintenance inputs
cost per ton of CPO to OEE. The coefficient has a range of possible values from -1 to
+1. The value indicates the strength of the relationship, while the sign (+ or -) indicates
the direction; simply put, it is an indication of general trend. There is a positive
correlation between maintenance inputs and OEE (Figure 4.16). Likewise, OEE inputs:
Item & ReferencePresent
Average Potential Gap
CPO/year
production
one% of CPO
equivalent t/y
CPO tons
potential/y
Amount @ 3200 RM
per ton of CPO
OEE % 62 85 23 18,900,000 304,839 7,011,290 22,436,129,032
OER % 20 30 10 18,900,000 945,000 9,450,000 30,240,000,000
Yield ave 4 t/ha (50% of 8 t/ha -
100%)50 100 50 18,900,000 378,000 18,900,000 60,480,000,000
Maint. Overspend n/a 15% 15% 18,900,000 1,399,500,000
Total RM/year 114,555,629,032
Inefficiency cost' quantified in US$
(billions) 36.37 305.8312%
Palm Oil Milling Sector 'Inefficiency Cost' Quantified
Malaysian GDP in
$US - 1 US$ = 3.15
RM
Palm Oil Mill ing Sector
'Inefficiency Cost' share of GDP

190
availability and performance; have a significant positive correlation with OEE - KPI for
measuring DV (Figure 4.17).
Correlations Maintenance Inputs OEE
Maintenance
Inputs
Pearson Correlation 1 .055
Sig. (2-tailed) .734
N 41 41
OEE Pearson Correlation .055 1
Sig. (2-tailed) .734
N 41 41
Figure 4.16
Maintenance Inputs and OEE Correlations
Correlations Availability Performance Quality OEE
Availability Pearson Correlation 1 .194 .222 .506(**)
Sig. (2-tailed) .225 .162 .001
N 41 41 41 41
Performance Pearson Correlation .194 1 .240 .941(**)
Sig. (2-tailed) .225 .131 .000
N 41 41 41 41
Quality Pearson Correlation .222 .240 1 .295
Sig. (2-tailed) .162 .131 .061
N 41 41 41 41
OEE Pearson Correlation .506(**) .941(**) .295 1
Sig. (2-tailed)
.001 .000 .061
N 41 41 41 41
** Correlation is significant at the 0.01 level (2-tailed).
Figure 4.17
OEE Inputs and OEE Correlations
191
4.5.1 Labor in Theory and Practice: an analytical discourse
Labor is the next frontier in overall manufacturing performance; Labor represents the
human factor in producing the goods and services of an economy, detailed in section
3.5.1 (I). Manufacturers know the problem well that the next critical manufacturing
element to optimize in today’s demand-driven world is Overall Labor Efficiency (OLE).
During the past decade, manufacturers poured attention and resources into supply chain
improvements as a way to increase competitiveness and profitability. It was a successful
strategy, but now it’s hitting the law of diminishing returns, manufacturing is now in the
quest to move to the next level of performance. For many manufacturing executives,
dealing with a changing workforce, competing with offshore manufacturing, and
maintaining profitability are factors of corporate survival. These goals will be achieved
only if they can optimize their workforce performance. Optimizing workforce
performance requires new insight. Companies ought to establish methods of quantifying,
diagnosing, and ultimately predicting the performance of their workforce; one of the
most important and highly variable elements of manufacturing. That insight can be
provided by OLE. Simply put, OLE is the analysis of the cumulative effect three
workforce factors have on productive output; Availability, Performance, and Quality.
OLE is the key to understanding the effect the workforce has on manufacturing
performance and, most important, it provides a platform that helps diagnose and predict
that performance.
Skilled labor specialization: Skill is a measure of a worker's expertise, specialization,
wages, and supervisory capacity. Skilled workers are generally more trained, higher

192
paid, and have more responsibilities than unskilled workers. Education and training are
important factors in increasing skill levels. The shift from unskilled to skilled labour can
be attributed to increasing the efficiency of humans through investment in knowledge,
technology, and trade; the effects of globalization also play a role in affecting the
relative demand of skilled labor. TPM’s autonomous maintenance emphasizes the role
of operators as first line maintainers. Operators can make or break maintenance
effectiveness. Without interrupting their production work, operators can easily prevent
breakdowns, predict failures and prolong equipment life if they become more intimately
familiar with the machinery they run every day. But to do this, they must become highly
equipment-conscious, and that can require some intense training. They must know what
to do to keep machines in normal operating condition. They must be taught how, when
and what to lubricate, as well as the best methods for monitoring vital signs and
recording abnormalities. Involving operators in routine care and maintenance of critical
plant assets offers three major benefits: firstly it reduces maintenance labor cost, the
proximity of the operator to the asset greatly reduces or eliminates travel time and
waiting; secondly it increases the availability of the highly skilled maintenance
workforce for those maintenance activities requiring specialized talent, rebuilds and
overhauls; and thirdly it banishes the "we-they" syndrome so prevalent in many plants.
Maintenance and production must function as an integrated team. The eventual reason
for autonomous maintenance is simply to save money and improve profitability.
Operators are typically under used and have the time to perform these lower-skilled
tasks. Transferring these tasks to operating teams improves the payback on the
193
burdened, sunk cost of the production workforce, and permits more effective use of the
maintenance crafts (Mobley, 2011).
Deming, the quality guru behind the ‘theory of profound knowledge’, believed that
every worker has nearly unlimited potential if placed in an environment that adequately
supports, educates, and nurtures senses of pride and responsibility. Deming's ideas of
hard work, sincerity, decency, and personal responsibility, forever changed the world of
management. In the resulting company, workers better understand their jobs, the specific
tasks and techniques as well as their higher value. Thus stimulated and empowered, they
perform better (Haller, 1993).
Drucker, a business thinker, and an enormous contributor to the SMT, professed ‘respect
of the worker’: he believed that employees are assets and not liabilities and that
knowledgeable worker are the essential ingredients of the modern economy. Central to
this philosophy is the view that people are an organization's most valuable resource and
that management's job is to prepare and free people to perform (Drucker et al., 2008).
I. Equitable Compensation and Rewards – To be able to attract competent
skilled labor force, companies have to adequately and equitably compensate
them. Compensation includes topics in regard to wage and/or salary program
structures and benefits, and is payment to employees in return for their
contribution to the organization, that is, for doing their job. The most common
forms of compensation are wages, salaries, and benefits. Poverty is one of the
social concerns in Malaysia. One of the factors that cause poverty is employment
with very low wages. The Malaysian government has not set the minimum wage,
yet, which keeps wages in low skill sectors very low. According to a World
194
Bank report, about 34% of Malaysians earn wages below RM700 per month,
which is below the Malaysian poverty line benchmark of RM720, majority of the
palm plantation and mill workers fall under this category. Nevertheless, Ministry
of Human Resources has organized Minimum Wage Laboratory Exercise with
the collaboration of World Bank on 8 to 14 February 2011, and prior to that
National Minimum Wage Workshop on 4 August 2010. In addition, the
government has established a National Wage Consultation Council, which will
determine the rate and mechanism of minimum wage. With the commitment
from the government, the deliberation now will be on the mechanism and
quantum of minimum wage. However, nothing has materialized yet. Programs
aimed at the employees of the enterprises are widespread, and often come in the
form of education and training in HES. Provisions of education grants are
common among the larger companies. Bursa Malaysia found in a survey that
measures aimed at employees is the CSR aspect with the highest priority among
listed companies. This can in particular be attributed to HES-related measures
(White-Paper 2010).
Money isn't everything, but there's no question that compensation is tied to job
satisfaction. At a minimum, compensation has to be equitable, both within your
organization and as compared to the industry as a whole. As a starting point,
businesses should benchmark their salary and wage rates to make sure that they
are at or above industry averages. Health benefits, time off policies and other
compensation packages should be reviewed periodically in order to ensure they
stack up to the competition. Businesses should conduct 360 degree surveys and
195
ask employees if they believe that their pay plans, bonuses and other financial
incentives were fairly managed. Labor productivity is correlated with the better
performance as measured by OEE. Satisfied labor force learns fast, is more
creative, optimistic and better motivated; bolstered with team spirit they fix
problems instead of complaining about them. Per ton CPO cost of labor was
correlated and it showed a positive correlation with OEE. The positive
correlation simply indicates that higher labor cost per ton of CPO produced is a
contributing factor to higher OEE. However, there is no, industry wide, set
benchmark of labor cost per ton CPO produced available to which these data
figures can be compared for efficiency. Mills, nevertheless, can set up their own
bench marks to follow for improvement.
Compensation is usually provided as base pay and/or variable pay. Base pay is
based on the role in the organization and the market for the expertise required
conducting that role. Variable pay is based on the performance of the person, and
may include incentive or bonus plans of pay. Major function of human resources
and talent management is getting the best employees. Regardless of the nature of
the organization, it must identify the most important roles in the organization and
then recruit, orient, train and organize people to effectively perform those roles.
It should then concentrate on their compensation, benefits, training and
development, and a safe and equitable work environment. Assessment of the
prevailing labor market reveals that a lot needs to be desired. Skilled labor is not
compensated as its counterparts in the west, wages are low comparatively and
the working environment is less than ideal in many cases.
196
However, the author, during the pilot survey for this study visited several
private, palm oil mills in Malaysian peninsula and observed that CSR is not a
priority for the mills. It was observed that there is a noticeable gap between the
theoretical working conditions of the skilled labor and the shop floor reality.
Mills were generally, dark, smoky, slippery - muddy floors, ill equipped, and the
mill’s manufacturing equipment was half buried in palm fruit bunch debris. In
certain cases, they resembled 19th
century industrial organizations. General
working environment of the mills operations revealed immensely under paid
maintenance skilled labor working, without safety protective gear, in
incongruous dingy workshops. Lack of respect for the workers was noticeable all
around; the atmosphere seemed to impinge on ‘master-slave’ consociation.
Culture of safety, environmental consciousness and labor welfare was not
evident. Most of the mills visited, were far from the best management practices,
so vigorously proclaimed by the MPOB. During one of the interviews with the
mill engineer, the author was taken aback to know that there were illiterate
skilled workers working in the mills as well. Workforce and management
seemed world apart; ‘we-they’ syndrome was evident all over the place. Mills
had the same ‘we-they’ attitude towards MPOB and MPOC; they commented
that both these entities are not in touch with the mills and that the mills did not
see them as partners, one could almost sense resentment. In fact, some of them
commented that all that MPOB and MPOC were interested in is collecting the
‘levy’ palm oil cess money to help them keep their cushy jobs. They added that
197
mills have not benefited from these organizations to the extent of the annual cess
paid (RM 200 million). Nothing meaningful has come back to the mills, in the
form of milling innovation, or equipment improvement. So, bottom line, they did
not want to cooperate for any surveys etc., and they did not seem to care. It did
not come as a surprise to this author that in a CSR survey conducted by MIM,
out of the 2000 only 110 companies responded.
II. Addressing the Social Impact of the Crisis - The crisis-induced changes in
employment, income, and prices not only directly affect households’ current
standards of living but they also have a major impact on household investment in
human development. While it is not difficult to observe the direct and often
immediate adverse social impact of the crisis, little is known about their indirect
and long-term impact on the country’s human development and social capital
potential which are increasingly acknowledged in developing economies as a
critical factor for sustainable development. As a result of the economic
meltdown, Malaysia’s unemployment resulted in 500,000 unemployed persons
in 2009. The rise in unemployment and lower incomes are the main channels
through which the social impact of the crisis has been transmitted. Against the
above backdrop, it is expected then that the incidence of poverty levels rose
(MIER, 2009).
Malaysian Institute of Economic Research (MIER) has highlighted skilled labor
shortage as one of the main factors behind Malaysia’s slower economic growth
forecast for 2011-2012 on account of ongoing structural weaknesses in Malaysia.
One of the most crucial structural weakness is the labor market, specifically,

198
skilled labor market; this impedes FDI flow to Malaysia. Growth forecast for
2011 was downgraded from 6.8% to 5.2%; Malaysia should focus on attracting
FDI through operations that requires skilled labor.
Government Interventions may influence the skilled labor market through such
actions as paying unemployment insurance benefits, setting the minimum wage,
raising or lowering business and income taxes, and establishing rules under
which labor unions operate. It also can undertake special programs to create jobs
temporarily when unemployment is unusually high.
However, employers in Malaysia are often frustrated by issues relating to
Malaysia’s skilled labor pool and government’s unpredictable labor and
immigration policies. The country has long been plagued with an acute shortage
of skilled, local labor, as the labor force only numbers 11.63 million,
supplemented with a foreign labor pool of 2 million legal workers and an
estimated 800,000 illegal immigrants. Aggregate numbers on the legal work
force in Malaysia are slightly worrying, as their productivity growth is low
(3.3%) compared to that of China’s (8.7%), which is the highest globally and has
risen steadily. Nevertheless, Malaysia has advantage over China, its low turnover
(5%) and wage inflation (5.5%).
Enterprises in Malaysia can expect to retain their employees longer and motivate
them with more stable and equitable wage increases and comprehensive
compensation packages. Prevailing compensation packages paid to Malaysian
skilled workers are considerably subjacent compared to other countries, e.g.
Singapore or Canada. In addition to this sustained labor shortage, it’s the state’s
199
fluctuating policies on immigration and labor that have led many companies,
local and foreign alike, to relocate their businesses outside of Malaysia. The
government has at various times cracked down severely on illegal workers. In
2006, Malaysia saw periodic raids from government task forces attempting to
flush out illegal immigrants. One factory alone was found to be employing
around 1,500 illegal immigrants. Government reportedly performs
approximately 16,000 canings per year, many of which are on illegal migrants
working in Malaysia’s manufacturing, agricultural and services sectors. The law
also stipulates caning as the maximum punishment for an employer who hires
illegal workers, though an offending employer has yet to receive the brutal
lashing.
III. Corporate Social Responsibility Framework - In accordance with
international trends, the focus on CSR in Malaysia has increased in recent years.
Though several companies have CSR programs that go back many years, in
some cases decades, it has in recent years been possible to identify an increased
awareness of the issue. Malaysian government's increasing focus on CSR has
resulted in the development of new frameworks for implementation of CSR
initiatives for the country's businesses. However, inadequate reporting of
implementation is a problem as stated CSR policies are not necessarily followed
in practice. Global Reporting Initiative (GRI) reports that very few companies
report their activity according to the organization's policies and that these reports
often are deficient (White-Paper, 2010). Reports on environmental breaches,

200
workers human rights infringements, and ethical abominations are often
compromised.
IV. Working and Human Rights - Malaysia has ratified five of the International
Labour Organization’s (ILO) core conventions. The following three conventions
are not ratified: Freedom of Association and the Right to Organize; Abolition of
Forced Labour; and Abolition of Discrimination on the Basis of Occupation.
There are many restrictions in connection with the right to organize, both in
legislation and in practice. In principle, workers have the right to strike, but also
in this area there are restrictions. Discrimination of women in employment is
prohibited by law, but women are inadequately represented in jobs with
decision-making authority. Child labor is not widespread, but occurs among
small family firms. Forced labor is prohibited by law, but does occur, often in
connection with illegal employment and trafficking. Malaysia has ratified the
UN Human Rights Conventions no. 8 and 11, which deal with the ‘Elimination
of Discrimination against Women’, and Children's Rights, respectively. The
country has, however, opposed ratifying conventions such as: Abolition of all
Forms of Racial Discrimination; Clause on Economic, Social and Cultural
Rights; Clause on Civil and Political Rights; and Combating Torture and Other
Forms of Inhuman Punishment. The authorities' commitment to safeguarding
human rights in some areas may be questioned (White-Paper, 2010).
Disconsolate employees are definitely not good for business. They tend to
deliver poor service and poor results, and are unlikely to feel committed to
company objectives or motivated to go the extra mile. They also create missed

201
opportunities, which can undermine the success of an organization. Companies
have several options that can result in increasing employee satisfaction. Every
business, large or small, has a great deal to gain from investing in employee
satisfaction. Even more important, a satisfied staff will be much more motivated
to put in the extra effort required to make the company more productive and
profitable. Content employees can dramatically reduce attrition rates and lower
the associated hiring and training costs. While businesses can invest in a wide
variety of formal (and often inexpensive) initiatives to boost job satisfaction, the
most powerful tool is one that costs nothing at all, good management.
Management team should view every employee as a valuable individual worthy
of respect for his or her time, talent and opinions and strive to understand each
individual's unique needs and motivational triggers. To have satisfied employees,
companies have to hire people who fit not just the job, but the company and its
culture.
V. Training and Development - the opportunity to learn new skills is a highly
sought-after benefit, particularly among engineers, scientists and other
knowledge workers. Providing formal training and informal shared learning
experiences creates an environment that keeps the most talented people excited
about their careers. Personnel budgets should include item for training, and just
as importantly, ensure that the budget gets spent. At the same time, businesses
should ensure that expectations are consistent and equitable; discrimination in
dispensing these benefits fosters discontent. It is beneficial to provide sincere,
202
timely praise for accomplishments that merit recognition; often, praise is either
never given out or given for every little task so that it becomes a cliché.
VI. Skilled Labor and Future Developments in Manufacturing: In October 2009,
Wichita, Kansas (USA) based Spirit Aero Systems Inc., the world's largest
independent supplier of commercial airplane assemblies and components,
opened its 242,000 sq ft aerospace manufacturing and design facility adjacent to
Kuala Lumpur's Sultan Abdul Aziz Shah Airport in Subang, adding lift to
Malaysia's aerospace industry. Spirit Aero Systems Malaysia will occupy a
central role in the development of the Malaysian aerospace industry as a whole,
and is strategically located at the centre of the Malaysia International Aerospace
Centre (MIAC). UPECA Technologies is a Tier 1 Boeing and Airbus parts
supplier to Spirit Aero Systems; and there will be several others requiring a
stable and available work force, a long-term strategy for successful operations.
Manufacturing organizations, such as Spirit Aero Systems, usually, have in-
house facility to train their skilled labor for maintenance reliability and
operations. However, they rely on the local labor market, local technical
institutes in particular, to provide them with, educated and semi-trained,
technical graduates, that they can further train according to their specific needs
of operation and equipment maintenance. They run their own apprenticeship
programs for training workers as there is a gap between what schools turn out
and what industry demands. The Malaysian aerospace industry has recorded
11% growth each year from 2004 to 2008, expanding by as much as 14% in
2009, despite the global economic slowdown. However, the industry faces a
203
shortage of skilled personnel, especially licensed aircraft-maintenance engineers.
Malaysia would need another 16,000 such skilled personnel by 2015; industry
now employs about 51,000 people nationwide. The Economic Planning Unit in
the Prime Minister’s department is coordinating with the various aviation
companies and government agencies to help address the problem. Spirit's entry
into the Malaysia aerospace market may be behind the government's realization
that far more workers will soon be required by the sector, especially if more
suppliers, like Spirit and UPECA, see the opportunity to succeed in Malaysia.
That prompted the establishment of the Universiti Kuala Lumpur Malaysian
Institute of Aviation Technology program in Dengkil, Selangor (MIDA, 2011).
Migration of Skilled Labor – Professionals “Brain Drain”: In addition to
shortages in skilled & low skilled labor, Malaysia’s labor force also suffers from
a sustained “brain drain,” as talented and highly-skilled professionals have been
lured overseas by seemingly better job opportunities. The number of Malaysian
migrants rose by more than 100-fold in a 45 year period (1965-2010); from
9,576 Malaysian in 1960 to 1,489,168 in 2005 according to the World Bank.
From March 2008 to August 2009 alone, an exodus of 304,358 Malaysians did
little to help the growth of the nation’s economy, as the majority of those who
left were professionals. An important trait of the labor market is the mobility of
the workers that it constitutes. In theory, people in Malaysia can move anywhere
to find or train for a new job. This mobility is important when employers match
skills to job openings. In practice, however, people may be unwilling to move
204
where the jobs are located, unwilling or unable to get training for a new career,
or governments’ predisposed policies may inhibit their mobility or
employability. In these cases, the mobility in the labor market and the output of
the economy slows down as people remain unemployed and jobs go unfilled.
Intrusive government policies may also provide impetus to the skilled labor force
to migrate, eliciting a “brain drain”.
The newly established ‘Talent Corporation Malaysia’ (TalentCorp) under the
Prime Minister’s office will create programs and incentives to encourage the
country’s nationals engaged in key sectors and professions to return home. The
International migration of skilled persons has assumed increased importance in
recent years reflecting the impact of globalization, revival of growth in the world
economy and the explosive growth in information and communications
technology. The international mobility of highly skilled workers is likely to
increase in the future. Adding to it is; better wages and employment conditions,
faster and cheaper transportation, faster and cheaper information, expansion of
global labor markets, shortage of highly educated workers in the information-age
economies, the ageing of the workforce in developed economies, and just-in-
time demand from industries eager to get on the front of technology curves.
Globalization is linking together labor markets creating labor flows spanning
global cities that are rooted in hierarchies of labor demand. A number of
developed countries have recently liberalized their policies to some extent for the
admission of highly skilled workers. This demand is largely met by developing
countries, triggering an exodus of their skilled personnel. While some amount of
205
mobility is obviously necessary if developing countries are to integrate into the
global economy, a large outflow of skilled persons poses the threat of a “brain
drain” and can adversely impact local growth and development (ILO paper,
2010).
More recently, during the global economic recession in 2009, the government
enacted a complete ban on new hires of foreign employees in the manufacturing
and services sectors, which was subsequently lifted. Investors are currently
waiting on legislation proposed in June of 2011 to offer amnesty to the existing
illegal workers in Malaysia, thereby increasing the legal labor pool. For the state,
the dramatic move will raise much-needed tax revenues, improve national
security, reduce human trafficking, and most importantly, attract more foreign
investment. Naturally, this proposal has faced staunch opposition from Malay
nationalists, whose interests lay with the rights of local workers. Nonetheless,
until a decision is made official, employers should be cautious in knowingly
hiring illegal migrants. Malaysia’s ardent goal to become a high-income nation
by 2020 portends very well for foreign investors in the region. Despite losing
competitiveness, particularly in low-wage manufacturing, to neighboring
countries, the government’s New Economic Transformation Plan indicates a
much more inviting investment climate in Malaysia than one might have found
in the past. As is the case with China, Malaysia’s state-led push into high tech
industries and emerging manufacturing sectors offer investors a wide range of
incentives that are sure to improve the profitability, inducement, and ease of
doing business in Malaysia. However, corruption in Malaysia, in general, is an
206
encumbrance on its socio-economic policies and impedes FDI in Malaysia.
Fighting corruption is a responsibility that should be shared amongst all parties
and not directed according to a particular race, religion, culture, age or economic
group. The fight against corruption should not be based on ‘who’ the person is,
and must be pursued regardless of the stature of the individual; failure can bring
about severe and dire consequences to the future generations (MACC, 2011).
4.5.2 Spare-parts, Material, and Tools – Sub IV
Spare parts refer to the parts requirements for keeping owned equipment in healthy
operating condition by meeting repair and replacement needs imposed by breakdown,
preventive and predictive maintenance. The spare part management function is critical
from an operational perspective especially in asset intensive industries such as
refineries, chemical plants, paper mills, and oil mills as well as organisations owning
and operating costly assets such as airlines, and logistic companies. Spare parts, in
manufacturing, also include consumables such as; lubricating oils, touch up paints,
cleansing agents, grinding & cutting discs, chemicals & neutralizers, industrial gases
and many more. Maintenance Tools & Equipment are often lumped with spare parts.
Apart from hand and power tools, they also include specific equipment such as, bearing
installation kits, portable weld sets, portable magnetic base lathes, portable band saws,
portable surface grinders, hydraulic pipe & conduit benders, diagnostic multi meters,
safety test meters, safety gear and many more. Maintenance, Repair & Overhaul (MRO)
spare parts are different from production parts whose demand is production dependent
and is predictable, easier to forecast because of more predictable movement patterns and
207
are typically input or output of a production process (such as water softening chemicals
for boiler water supply or weld tips in weld assembly robots).
The exigency of spare parts management in manufacturing and service operations
cannot be underrated. Given the determinants like demand, unpredictability, part
substitution, and tight control on spare parts inventory coupled with high service level
expectations. It is imperative to accurately forecast spare part requirement and to
optimize on inventory; it warrants significant decision support. Historically, the standard
philosophy regarding MRO in many Maintenance organizations was that high inventory
levels and large numbers of SKUs must be maintained on site in order to ensure that
equipment could be serviced and repaired on a moment’s notice. The actual cost to
support this environment is very high but rarely is the total costs associated directly to
this decision are considered exclusively and reviewed. Traditionally the perceived cost
is deemed acceptable due to the concerns voiced by Maintenance and Operations for the
need to have the necessary MRO materials and assets on hand at all times (Timme &
Christine, 2003). Proper planning and control of spare parts inventory is a critical
component of an effective asset management program. If the right parts are not on hand
when needed for routine maintenance or repairs, downtime is prolonged. If too many
parts are on hand, the enterprise absorbs excessive costs and the overhead of carrying
the inventory.
I. Spare Parts Management & Equipment Reliability - Spare Parts Management
dispensing an organized maintenance storeroom is one of the key processes
which support effective maintenance planning and scheduling, and equipment
reliability improvement. Improved materials and spare parts management will
208
free up time for maintenance planners, maintenance supervisors, and hourly
maintenance personnel. It is not unusual to see an average of 20-30% of
maintenance crafts peoples’ time to be used for finding parts and material
(Evans, 2008). The reliability and availability of industrial plants represents a
critical aspect in many modern manufacturing and service organisations.
Increased efficiency of production plants requires the minimisation of machines
downtime. Spare parts availability and its prompt accessibility is among the
major factors leading to a reduction of the protraction of downtime when a
breakdown occurs. Thus, a logical approach to solving the issue of spare parts
availability lies in preserving requisite sizes of inventories of spare parts for
immediate disposition whenever needed. On the other hand, stocking is limited
by space and cost. For these reasons, designing the reserve of spare parts in an
optimal way represents a critical and important task for every parts inventory
manager.
There are many aspects that must be considered when reviewing any MRO
materials and asset management program. In those organizations where
Purchasing and Materials management are not directly involved or empowered
to impact the management and direction of these programs, significant
opportunities exist for cost reductions and process improvements. Many times
the responsibility for selecting items to be stocked, replenished, maintained and
disposed off, is the responsibility of departments other than Material Planning or
Management. The question that is commonly raised regarding the management
of assets and MRO by Maintenance and Operations is, “why shouldn’t those
209
departments that use and require these materials also order, stock, repair, and
maintain these materials?” The fact is that many companies effectively “carve
out” several of the fiscal duties and responsibilities from the Materials and
Purchasing Management function, and make it the direct responsibility of
Maintenance and Operations. The issue is not whether the required repairs and
services are performed, but rather how can this process be managed and
performed at the same or higher service level at a lower cost. The other major
problem is increasing the awareness of why the change is necessary and
implementing the change inside the organization is critical, once opportunities
have been identified (Timme & Christine, 2003).
Apart from new generation turbines and decanters whose maintenance is usually
outsourced, most of the critical equipment in palm oil mills is low-tech. It does
not warrant a finer spare parts management system that might be essential for,
say, an automotive plant, as most of the mills still operate equipment that was
designed in 1950’s and 1960’s (Sivasothy et al., 2006). Given this level of
sophistication, the classical ABC model is adequate to manage spare parts
inventory in palm oil mills. The use of classification schemes as a spare parts
management tool represents a popular approach in industrial world. ABC
classification according to the Pareto's principle is the most well known and used
classification scheme to manage the spare parts inventory management
problems. A criticality classification of spare parts is generally based on
administrative efficiency considerations, such as inventory costs, and usage rates
derived from historical data of the company. The modern production planning
210
software packages, such as ERP, are able to obtain similar analyses easily and
with a reduced time consuming operation. Based on these analyses, oversized
inventories, obsolescence aspects or stock-out problems for the different items
are recognised.
Besides being the central hub for maintenance, the storeroom also provides
functions that are absolutely critical to the maintenance operation. These
functions are so important that when the storeroom is operating in a best
practices mode, the rest of the maintenance operation can excel. Put another
way, if the storeroom is run improperly (such as poor inventory accuracy, parts
unavailable when needed due to poor replenishment and procurement practices)
the rest of the maintenance operation will not achieve high service levels of
equipment availability and reliability. The Storeroom is a service provider and
should be managed exclusively with that objective in mind.
Mill visits conducted during the pilot study revealed that most second generation
mills (mills established in 1980s) do neither have a dedicated spare-parts
inventory controller nor a separate spare-parts store room area. Parts were stored
all over the mill shop floor area, including the maintenance shop. None of the
mills had computerised inventory management system in place and spare part
inventory purchase solely depended on the mill manager’s decision; most mill
managers held the portfolio of operations director for that matter. Range of
spare-parts, material, and tools cost, per ton of CPO produced, was spread out;
from a low of RM3 to a high of RM272. There is no figure available, from
MPOC or literature on palm oil milling, to bench mark the collected data, in this
211
regard. However, there is ample room for improvement and financial gains as
evidenced in the cited literature. Performance of the spare-parts store room
should be gauged, and improvements afforded through self-set targets.
Improvement in spare-parts cost per ton of CPO produced provides a reasonable
impetus to commence this undertaking. As none of the respondents practiced
TPM in its entirety or similar maintenance strategy, they are missing out on the
improvements and savings that can be achieved by adopting such ‘waste
reducing’ maintenance strategies. This is one important area that warrants further
research in palm oil mills. Maintenance storeroom is, primarily, a service
provider to production and operations, following sections construe how it should
be managed.
II. The Maintenance Storeroom: Key to Efficient Maintenance Operation
The Storeroom as Service Provider - If one follows the flow of technicians and
materials in a typical maintenance operation, a common pattern emerges. In
general, there is a central hub and the spokes of a wheel; where the hub is the
storeroom, and the spokes are the paths to the equipment or machinery in the
facility or site that are undergoing maintenance. The number of work centers on
the site multiplies the actual material flow. This correlation illustrates the crucial
role of the maintenance storeroom; to provide parts quickly when needed. This
function places the storeroom in the position of a service provider, with the rest
of the maintenance organization (and by extension, manufacturing operations) as
the customers. Perhaps one of the main integrants of success for a service
provider, besides fundamentally delivering what is promised, is to manage
212
expectations of the customers. This is done in a deliberate way through various
forms of communications so that not only does the customer understand what
service they will receive, they also understand how the service will be
performed. In the maintenance world, there is an implied expectation of parts
availability. For many parts, that expectation can be easily met. But for some
classifications of parts, that expectation is unrealistic either due to cost of the
part, reliability profile (MTBF and MTTR), or other characteristics of the part.
Those responsible for maintenance and the storeroom must communicate to the
facilities and operations organizations the reasonable expectations of service
from the storeroom. These expectations of parts availability are the result of
analyzing the impact on downtime, the likelihood of failure, and the carrying
costs of the parts. Ideally, the time to decide on whether parts should be stocked
is when new equipment is placed in-service. Manufacturing and the parts
suppliers can work with maintenance in recommending the spare parts to stock
as the new equipment is being purchased. Thereafter, maintenance can use
historical usage data in deciding adequate inventory levels, or even to
discontinue carrying certain items. In a larger maintenance and parts
organization, a parts inventory planner is the decision maker when it comes to
the stocking level, timing of re-orders, and replenishment trigger levels of a part
(York, 2003).
III. The Importance of Inventory Accuracy - One of the critical success factors for
the storeroom is achieving a high level of inventory accuracy. Accurate
inventory is defined as the correct part and the correct quantity physically in a
213
storeroom location being the same as that shown on the inventory control system
or CMMS. Minor variances between actual and system counts are tolerated, such
as with nuts and bolts. However, if the part, quantity, or location is not correct
when matched against the system, then that location is counted as an “error” for
purposes of tabulating inventory accuracy. The consequences of inaccurate
inventory include: high risk of an stock-out condition as parts will not be ordered
on-time; parts will be flagged for re-ordering by the system even if not needed;
maintenance technicians and machine operators will lose confidence in the
inventory control system or CMMS, and benefits from using other functionality
in the system will be lost; and encourage proliferation of bench stock (stock held
on the floor or in cabinets/shelves outside the storeroom). It is critical that not
only the storeroom operators understand the importance of inventory accuracy,
maintenance technicians, maintenance planners, operations personnel, and plant
management also understands the importance of inventory accuracy since these
groups will be impacted adversely by inaccuracy of inventory. Achieving high
levels of inventory accuracy requires recording of: all parts receipts against
purchase orders or outside repair orders; receipts of parts returned to the
storeroom that were previously issued to a work order but not actually used;
parts serial numbers, lots, or other important information at the time of receipt;
parts put away in locations; all parts issued to a work order, employee number,
or other account; and routine and accurate cycle counts.
IV. Storeroom Organization for Productivity - The storeroom is like any other
business area when it comes to productive operation, the area must be organized

214
in a physical sense. The parts storage area is sized and equipped aptly for the
types and volumes of parts to be handled by maintenance. Lighting in the area
must be sufficient to permit counting of parts in the aisles, whether for parts
issue to a work order or for cycle counting and the area must be free of debris
and clutter in the aisles to permit personnel quick access to the locations. The
locations must be labelled so that time searching for parts is minimized.
Stepladders, stools, and carts must be parked in an area that is out of the main
flow. The area needs to be physically separated from the main plant, either by
walls or with a secured cage; this separation is to discourage theft and to enforce
recording of parts receipts / issues for inventory accuracy purposes. Monitored
controlled access procedures must be in-place for normal business hours and
after-hours needs for parts; and there are distinct work elements within the
storeroom, and they should be combined into jobs that make the most productive
use of staff’s time. Combining too many different work elements into a job is
counterproductive and should be avoided.
V. Slotting Inventory Correctly - Slotting of inventory is the assigning of a part to
a location based on the part’s movement, amount of inventory to hold on-hand,
and physical characteristics (such as size and weight). Real productivity savings
in the storeroom can be gained from the correct slotting of parts. Parts that are
slow movers should be stored near the back of the storeroom, and fast movers
near the front of the storeroom for quicker access. For example, a motor that is a
critical spare and needed once a year should be slotted in the rear of the
storeroom, while filters and gaskets that may be needed for frequent preventive

215
maintenance tasks should be located near the front of the storeroom. There are
many different storage and retrieval methods that can be employed to handle
parts, each can be befitting depending on the volumes and characteristics of the
parts. For example, dense storage narrow aisle man-up vehicles may be
appropriate for either heavy parts on shelves, or for small parts on shelves. Other
alternatives for parts storage in the storeroom include a vertical lift module,
which is a vertical carousel. The distinct feature of this technology is that it
provides for parts coming to the operator, significantly reducing travel time to
locate parts; common in automotive plants for stamping presses.
The less mechanized (but still very efficient) options for parts storage and
slotting include case flow lanes, static shelves, and small parts bins. No matter
which storage technology is chosen, the important issue is that parts history must
be analyzed to determine the movement. There will be different payback points
for each alternative as labo r and productivity savings offsets the capital
investment.
Finally, another common element of slotting, regardless of which storage and
retrieval methods or technology used, is that each location is unique and is
referenced in the inventory control system or CMMS. Using unique locations
enables the use of an automatic identification system to streamline parts
handling. The introduction of automatic identification (auto ID), using barcode
technology into the storeroom has resulted in a significant contribution to
storeroom productivity, inventory accuracy, and error elimination. Whether for
216
parts put away, parts picking, or cycle counting, using auto ID is now a best
practice.
VI. Preventive Maintenance (PM) Kit Building - One of the functions of the
storeroom is to provide parts, tools, and supplies for the technicians to perform
preventive maintenance tasks. As a way to level out the storeroom workload and
provide better service (higher availability of parts) to the technicians, the
storeroom can build PM kits in advance of the scheduled PM time. This requires
access to the PM schedule by the storeroom, and a way to track and hold parts
inventory prior to issuing them to the PM work order.
One of the ways to do this is to use a mobile cart with multiple kitting bins
(locations) on-board. The parts listed on the PM work order are picked from the
storage locations, and are placed into one of the kit bins. These kit bin locations
are an extension of the static storage locations, and the inventory control system
or CMMS will track these kit bin locations with a “staged” status. When picking
is completed, the entire cart is moved to a kitting hold area, and scanned into the
hold location. When a PM is scheduled for work, the technician presents the PM
work order to the storeroom. The system will show that the inventory has already
been picked is in the kitting hold location. The kitting bin can be scanned to the
work order, and the technician can take the PM kit to the job. The entire process
of retrieving the parts for the PM, from the technician’s perspective, is very fast.
In the event that an emergency work order situation arises, and the only part in
stock has been picked to the kit bin, the system can locate the part and remove
the part from the PM kit through a move transaction.

217
VII. Parts Transactions - Parts receipts should be recorded to offset either a
purchase order or a work order for outside services, while parts issues should be
used to tie a part to a work order, technician identification, or an account code.
Failure to record these transactions will waste the efforts set forth at increasing
storeroom efficiency, productivity, and accuracy. The maintenance organization
must embrace the inventory control system or CMMS, use the transactions that
are provided, and view it as the tool to a successful operation. In many
storerooms, the discipline of entering these transactions breaks down under the
pressures of the day, especially if there are emergencies that need to be
addressed. Also, there can be a culture of “take what you need” that can
undermine the efforts of increasing inventory accuracy and accountability.
Management, through education, effort, and enforcement, can overcome these
obstacles; cultural change is an ongoing process and not a one-time program.
VIII. Measures and KPIs - There are several measures and KPIs to gauge
performance of storeroom operation, the major indicators are: Inventory
accuracy (cycle count adjustment / total cycle counts); Percentage of stock-outs
(number of stock-outs / total parts issues); Percentage of inactive inventory
(parts inactive in the past year / total parts); and Parts to labor ratio (parts
inventory value / maintenance labor cost). When measures and indicators are
recorded over time, these become a benchmark for the organization. Continuous
improvement efforts can then be launched to improve upon these standards, with
the desired result of cost reduction and higher productivity. Without tracking
performance, it is not possible for the storeroom to know whether improvements
218
have indeed been worth the effort. JIT inventory management have only a
limited ability to assist the efficiency of the maintenance process. Issues such as
just-in-case inventory management are far more important. This has
implications not only within the area of operations, but throughout the entire
supply chain. Often the improvement of a supply chain is based on “how we
buy,” the probabilistic nature of asset maintenance means also that we need to be
thinking about “why we buy” (Mather, 2008).
4.5.3 Maintenance Contracted Out
Briefly, maintenance outsourcing can be defined as a “managed process of transferring
activities to be performed by others” and its main advantage is conceptually based on
two strategic pillars. The use of domestic resources mainly for the core competencies of
the company, and the outsourcing of all other (support) activities that are not considered
strategic necessities and/or whenever the company does not possess the adequate
competencies and skills (Campbell, 1995). Unfortunately, single cost-based decision
processes remain the most used approaches by maintenance managers for making
outsourcing decisions (Lyly-Yrjänäinen, Lahikainen, & Paranko, 2004). The cost
dimension may be sufficient if maintenance is strictly considered a support functional
cost center. However, following the new maintenance strategies such as TPM, and if
maintenance is considered a stand-alone business unit, different approaches are
necessary. Organisations need to realise, there is no single position regarding
maintenance outsourcing that is correct for all. Nevertheless, there is enormous value in
retaining core maintenance competencies in capital intensive industries by developing in
house maintenance expertise on equipment that is vital to their manufacturing process.
219
To successfully support physical assets, a high level of knowledge and skill needs to be
present, along a strong sense of ownership for the performance of the assets. To have an
environment that enunciates positive thinking and induces continuous improvement
process into the way things are done, it is imperative to look at the pros and cons of
maintenance outsourcing before making a decision. Many companies believe that the
value of outsourcing prevails in bringing process, technology, and practices to their
plant. In reality, most outsourcing organisations do not have a true understanding of the
concepts of proactive, predictive, and condition based maintenance. Successful
companies that invest in sustainable growth appreciate the strategic impact maintenance
can have on their business and are prepared to invest in their own people; not incite
encumbrance to a third party. While, in some situations, a business case may exist to
outsource; examples might include lack of sufficient in-house skilled trades, nature of
the equipment is highly specialized such as turbines, where an external organisation has
the expertise and it is not cost effective to build it internally, nature of the equipment
that requires maintenance is highly cyclical with extended periods of low maintenance
demand, or the size of the facility is too small to justify the investment.
I. Outsourcing - there are two key strategic issues that determine the option
between outsourced and internally provided services. The first factor is the
potential for achieving a sustainable competitive edge by performing the work
internally. If management perceives that excellence in performing certain
maintenance services can be done cheaper, better or in a timelier manner and
will enhance the company’s competitiveness, such services should be carried out
internally. The second factor is the degree of strategic vulnerability if the work is
220
outsourced. If there is insufficient depth in the market, an overly powerful
supplier can hold the company hostage. On the other hand, if the individual
suppliers are too weak, they may not be able to supply quality and innovative
services as good as the buyer could by performing the work internally (Quinn &
Hilmer, 1994). Knowledge is another important dimension that affects
vulnerability. It is extremely risky to outsource work when the company does not
have the competence either to assess or monitor suppliers, or when it lacks the
expertise to negotiate a sound contract. The caveat that companies should not
outsource those activities that are crucial elements of their core competencies is
often not heeded when outsourcing decisions are driven by cost-cutting and
headcount-reduction criteria. As a result, control of activities critical to
establishing the company’s competitive advantage can be inadvertently ceded to
suppliers. Another common misconception in making outsourcing decisions is to
regard “core competencies” as “things that we do best”. This equivocation is
damaging as it encourages management to outsource activities with which it is
having problems. If the company has difficulty in managing an internal supplier,
it probably cannot communicate its requirements adequately to the external
supplier. Thus, internal problems are traded with more sticky problems of
dealing with external suppliers. It will be even more devastating if the
problematic activity over which the company relinquishes control is a critical
link in its current or future value-creation process. When an external supplier
offers a significant cost-saving deal on the company’s core activities,
management should refrain from outsourcing them. Instead, the internal service
221
provider should be challenged to improve its cost-effectiveness, using the
supplier’s offer as a benchmark of performance. Furthermore, one should not
rule out the possibility that the supplier may be using a “loss-leader” tactic
(Vindevogel, Dirk, & Wets, 2005) and enticing with favourable offer to the
client might turn out to be a snare down the road. In terms of maintenance
outsourcing, however, a set of additional potential and attractive benefits can be
achieved. Such as to increase labour productivity, reduce maintenance costs,
focus of in-house personnel on “core” activities, improve environmental
performance, obtain specialist skills not available in house, and improve work
quality. Nonetheless, outsourcing also involves a set of drawbacks that must be
taken into account by the customer that include: loss of control and loss of a
learning source, because an internal activity is externalised; loss of knowledge of
the plant; possible dependencies on the supplier; variations in the quality of the
product given to the customer; and problems among personnel, since they lose
their functions. Magnitude of these benefits and risks, however, depends on the
qualifications of the supplier and on the type of outsourcing contract negotiated.
The idea of outsourcing is to achieve the optimal performance within a company
and a supply chain. Outsourcing decisions, therefore, require life cycle analysis
of anticipated changes concerning all relevant costs, including indirect ones, to
avoid undesired surprises.
II. Life Cycle Costing (LCC): is an approach which aims at producing
comprehensive cost information for decision makers by estimating the costs
incurring in the future and by monitoring the costs during the life cycle. Despite

222
the fact that at least one of the main objectives of outsourcing is to reach cost
reductions, also in a longer term, the systematic utilization of cost management
in outsourcing is quite rare. As a result, companies do not generally know the
full financial effects of outsourcing. This, however, becomes increasingly
important as the outsourcing trend continues. LCC is a tool that can be used
when the outsourcing decision is being made. LCC is well aligned with
outsourcing objectives of long term cost reductions; it seeks to identify long term
costs. LCC communicates the costs as time-dependent variables; outsourcing of
an activity may be cost effective at one point of the life cycle but ineffective at
another point. These kinds of assessments are not possible without cost
information on a life cycle basis. The management of fragmenting value chains
requires relevant and comprehensive cost information that often extends the
boundaries of a single firm. If companies fail to sufficiently track their own cost,
which is often the case, they will face serious problems in evaluating the
economical effects of outsourcing and new value chain designs (Sievänen,
Suomala, & Paranko, 2001). There has also been an interest towards
outsourcing of the ownership of individual assets or the whole process (Markeset
& Kumar 2004). Suppliers of machines and equipment nowadays provide
different services to their customers in addition to pure products during a
product’s whole life cycle, which generates a need to examine the cost effects of
the changes in business from the supplier’s point of view (Laine, Ojala, &
Paranko, 2004). The range of these strategic alliances and the type of contracts
negotiated can vary from simple parts availability programs or ‘Operating Plant

223
Service Agreements (OPSA)’ to ‘Long Term Programs (LTP)’ with risks sharing
elements and the value based payment methods.
It must be stated that the outsourcing of certain functions or services should not
be considered as the equivalent of granted success. Strategic factors that can
ensure a higher possibility of success in the process of moving from a centralised
maintenance management to the outsourcing of certain services can be identified
in the: strategic analysis evaluating feasibility of the entire project on the basis of
the existing corporate constraints; assessment of those activities that should be
managed in outsourcing and the selection of the service providers for their
realisation; and acquiring managerial capabilities for monitoring and evaluating
service provider and customer relationship (Embleton & Wright, 1998).
With almost 19 million tons of CPO production capacity per year, the oil palm
mills, at five times the rate of CPO production, potentially generate 95 million
tons of biomass available for power generation (MPOC, 2012). The primary
objective of every palm oil mill that owns a power plant is to install and to
operate their plant in a most cost-effective way in order to maximize their profits
while ensuring a reliable power supply for their operations. Besides the
investment costs for construction, the life cycle costs need to minimize; one of
the major such cost involves operation and maintenance cost that cumulates in
course of operation period of the power plant. Cost reduction by outsourcing of
Operation and Maintenance (O&M) activities is one opportunity to meet such
requirements.
224
III. Business Case for Outsourcing: Power generation equipment in Malaysian
palm oil mills makes a good business case for outsourcing its maintenance.
Factors that contribute to this decision are:
i. Remoteness of mills: most of the mills are deep in land and operate away
from the national grid, still need un-interrupted and reliable power
supply.
ii. Lack of in-house skilled workforce: power generating equipment is
complex and highly specialized; qualified technicians are needed for the
job to guarantee reliable and effective power generating equipment
maintenance.
iii. Abundant free boiler fuel: 95 million tons of biomass is available to be
used as fertilizer or boiler fuel, making steam production process
economical.
iv. Worldwide rising cost of the energy production demands that mills do
not load the national grid; surplus power could be sold back to national
grid.
v. Most palm oil mills having over capacity or standby, redundant, power
generating equipment; boilers and turbines.
vi. Aging power generating equipment needs to be replaced with efficient
ones.
vii. Malaysian government is offering various incentives to facilitate the
change.
Older power generating units are no longer considered effective for reliable and
efficient power supply (Wan, Mahanim, Zulkifli, & Mori, 2010). When considering
replacement of old power generating equipment, palm oil mills should consider the
High-Pressure Boilers with Backpressure Turbine for Cost-Effective Power
Generation, recommended by the US department of energy – Country Malaysia
(USDOE, 2006).
225
A wide range of service products from the simple supply of spares to integrated asset
management is offered. Due to the recent market developments, the focus is now,
more and more on LTS products. The scope of such LTS products can vary
according to customer demands. To optimize customer’s benefit and to minimize
customer’s risk in the project several service products are being offered by the
OEMs. A service package of O&M products can be customized as to meet
customer’s specific needs. Comprehensive maintenance programs for Steam
Turbine, Power Train or for the whole Plant can be provided. Regarding power
generation, a preferred approach is to outsource all of the steps, giving controls over
the development of equipment maintenance strategies to the contractor. In this
instance, the contract must be structured around the achievement of desired
outcomes in terms of equipment performance, with the contractor being given
latitude to achieve this to the best of his ability. It is of great importance to a power
plant owner to be informed about the concept of how the fleet experience of an
OEM/O&M contractor is introduced and available to his power plant.
73% of the survey respondents reported the equipment whose maintenance was
outsourced: 77% of these mills outsourced their power generating equipment,
primarily turbines and boilers, while 27% contracted out maintenance for decanters.
e-maintenance concept has the potential to make the process of maintenance
management of power generating equipment cost affective and, considerably, more
efficient and reliable; this author has designed a conceptual model for e-maintenance
of power generating equipment in palm oil mills, detailed in chapter five (5.4.3).

226
Data for this sub IV showed a strong positive correlation to OEE; indicating
efficiency in reliable power supply bolstered OEE.
4.6 Moderator – Maintenance Strategy; TPM
For a definition it is a linear causal relationship in which the variable X (maintenance
inputs - IV), is presumed to cause the variable Y (OEE-DV). A moderator variable MV
(maintenance strategy) is a variable that alters the strength of the causal relationship. A
moderation analysis is an exercise of external validity in that the question is how
universal is the causal effect; maintenance strategy is not mediating in this respect.
Another way to think about this issue is that a moderator variable is one that influences
the strength of a relationship between two other variables, and a mediator variable is one
that explains the relationship between the two other variables. The reader might consult
papers by Kraemer, Stice, Kazdin, Offord and Kupfer (2001) for a related but somewhat
different approach to defining and testing of moderators. Frazier, Tix, and Barron (2004)
provide a good introduction to the topic of moderation. Maintenance strategy is the
moderator in this research. All the respondents reported PM as primary strategy
practiced by the mills; 20% of the respondents also reported practicing TPM along PM.
Follow up revealed that none of the respondents who claimed practicing TPM, did
actually practice the strategy in full. All six of TPM elements are integral and
complementary; any one element, removed from its partners will compromise its
objective (4.6.1). As most of the mills followed, least effective, BDM and sporadic PM

227
maintenance strategies, the moderating affect was minimal as shown by the poor rate of
OEE.
4.6.1 TPM
TPM has been identified as a best in class manufacturing improvement process that has
allowed manufacturing industries to greatly increase their levels of profitability and
productivity. TPM has allowed these companies to focus on the efficiency of their
production processes; it challenges the view that maintenance is no more than a function
that operates in the background and only appears when needed. The objective of TPM is
to generate a sense of joint responsibility between supervision, operators and
maintenance workers, not simply to keep machines running smoothly, but also to extend
and optimise their performance overall. The results are proving to be remarkable. This
synopsises TPM’s role in moderating; maintenance inputs are used efficiently and
effectively to minimise waste and maximise return on investment.
The six key elements of TPM include: Improving equipment effectiveness by targeting
the major losses; Involving operators in the daily, routine maintenance of their
equipment; Improving maintenance efficiency and effectiveness; Training for everyone
involved; Life-cycle equipment management and maintenance prevention design; and
Winning with teamwork focused on common goals. The result of these six elements
working together to improve equipment performance and reliability is TPM in a
nutshell. No one element, removed from its partners, can create the effects achievable by
this strategy, nor will any combination missing even one element. The six elements are
interrelated and designed to support each other. It is perhaps the lack of this
228
comprehensive approach that has resulted in 50% of TPM initiatives being abandoned
since it was introduced to U.S. in 1986 (Williamson, 2001).
4.6.2 Four Rules of Toyota Production System: The logic behind TPM can be
grasped more easily by having an understanding of the Toyota Production System, the
tradition behind it. But, until recently, a working definition of the Toyota Production
System has been hard to pin down. This is because the Toyota Production System is the
accumulated result of a trial and error process over the course of five decades and has
never been written down. Fortunately, two Harvard researchers, H. Kent Bowen and
Steven Spear, spent four years studying this system, and have published their findings.
In their article "Decoding the DNA of the Toyota Production System," the authors
isolate the following four rules that govern the system: All work shall be highly
specified as to content, sequence, timing, and outcome; Every customer-supplier
connection must be direct, and there must be an unambiguous yes-no way to send
requests and receive responses; The pathway for every product and service must be
simple and direct; and Any improvement must be made in accordance with the scientific
method, under the guidance of a teacher, at the lowest possible level in the organization
(Bowen & Spear, 1999).
The first three rules illustrate the actual processes of TPM and what roles each person
involved in maintenance must play. The fourth rule expands this structure to comment
on how to solve problems and improve overall performance. With that in mind, the first
rule, "all work shall be highly specified as to content, sequence, timing, and outcome",
dictates that anything done to maintain and improve equipment must be documented in
229
procedures that every employee follows. This documentation should include detailed
information on the parts used, labor hours involved, descriptions of the problems that
arose, the estimated root causes of the problems and the corrective measures taken to
solve the problem. It also means that maintenance work is governed by planned
maintenance routines and that frequent joint production/maintenance planning and status
meetings are scheduled to keep efforts focused.
The second rule, "every customer-supplier connection must be direct, and there must be
an unambiguous yes-no way to send requests and receive responses", means that proper
maintenance tools, parts, and supplies be made available, as they are needed. It also
means that spare parts are adequately maintained and that maintenance requests are sent
and acknowledged promptly. Visual systems and signals can be used to eliminate long
drawn-out explanations and reading. Lastly, when proper repairs or improvements are
made, those who requested them should sign off on them.
The third rule, which states that the "pathway for every product and service must be
simple and direct" requires every equipment operator to know exactly where to go for
help with an equipment problem. By extension, this means that every maintenance
person knows on what equipment he is qualified to work and where he or she can get
help when a problem exceeds their expertise. Finally, this rule necessitates that the
documentation for specific equipment remain accessible to those who need it.
The fourth rule, "any improvement must be made in accordance with the scientific
method, under the guidance of a teacher, at the lowest possible level in the organization"
indicates that data should be collected, analyzed, and made available to make the
230
improvements more efficient and effective. Additionally, informed people closest to the
problem should work out possible solutions and conduct experiments to determine the
workability of their solutions. Applying the logic of this rule also requires that formally
experienced and trained problem solvers lead improvement effort and that changes are
made in the equipment and supporting work processes and people are trained in the new
methods.
As one can see, a great amount of discipline is required in the workplace to sustain the
application of TPM strategies. Fields as diverse as aircraft assembly, petroleum
exploration and even racecar equipment maintenance have successfully put TPM
strategies into use, their only commonality being the high degree of discipline that each
of these callings demand. The four rules described above define the disciplined
approach that TPM requires to produce the optimum results. Implementing TPM means
striving toward a vision of the ideal manufacturing situation, a vision that encompasses:
zero; breakdowns, abnormalities, defects, and accidents. These three main categories of
equipment-related losses; downtime, speed loss, and defect or quality loss, are also the
main ingredients for determining OEE.
Ahmed, Hassan, and Taha (2005) in a case study of a Malaysian electronic company
conclude that TPM improves equipment efficiency and effectiveness, reduces cycle
time, inventory, customer complaints and enhances productivity. A survey of Malaysian
SMEs revealed that TPM implementation has a positive and significant effect on
organizational performance (Jantan, Nasurdin, Ramayah, & Ghazali, 2003). Companies
that adopt TPM are seeing 50% reductions in breakdowns, 70% reductions in lost
231
production, 50-90% reduction in set-ups and adjustments, 25-40% increase in capacity,
50% increase in labor productivity and 60% reduction in costs per maintenance unit
(Koelsch, 1993). Palm oil mills are missing out on this opportunity. By adopting TPM
as business wide strategy mills could, substantially, add to their bottom line, profits.
Though the economic role of the moderator is established in theory as evidenced in the
literature (2.5.5), this role could not be discussed or analyzed at length as all the
responding mills practiced, strategies of 1960’s, BDM supplemented by sporadic PM;
none of the respondents practiced TPM in its entirety.
4.7 POME Generated and POME Treated
19.50% and 24.40% respondents reported “0” POME produced and POME treated,
respectively. 80.50% of the respondents reported generating POME; 72% of the POME
generated was reported as treated by the respondents. During the pilot test it was
revealed that most of the second generation mills do not have a credible system of
recording POME generation and treatment, this operation does not seem to be tightly
regulated. Quantity of POME produced is measured using crude devices, such as
“tipping barrels” and the number count data is not monitored properly, resulting in
“speculative” or “Environment Protection Department (EPD) required” figure to be
reported. Treatment methods are primitive and lack monitoring. 19.50% respondents
reported having “0” POME generated, while the pilot study revealed that on average 60-
65% of the FFB tonnage processed ends up as POME, due to the same amount of steam
injected into the process (MPOC, 2010). This compromised data credibility and
constrained the author from consequential analysis.
232
4.8 Practical Implications
This research study highlights the contributions of maintenance function to ensure
enhanced equipment reliability, thereby affecting improvements in the manufacturing
system performance. This study also highlights the implications of ineffectiveness of
maintenance management in palm oil mills, which may be implemented in palm oil
mills sector to improve their performance in Malaysia and in other parts of the world.
The research study identifies maintenance-related losses, sets up targets regarding
maintenance performance improvements and developed guidelines for achieving
enhanced manufacturing system performance through strategic maintenance initiatives
in the palm oil mills. These guidelines can also be important to all concerned with
maintenance and safety in various manufacturing enterprises. This model is generic in
nature and can be applied to other industries as well.
4.9 Chapter Summary
Data analysis is a process of inspecting, cleaning, transforming, and modeling data with
the goal of highlighting useful, suggesting conclusions, and supporting decision making.
41 usable responses were received, in response to direct mail survey sent to 373
Malaysian companies in operation out of the 434 registered with MPOB; 87.8% of the
respondents belong to SMEs. Mills’ Data collected through survey questionnaire was
validated by triangulation. Central tendency was calculated using SPSS for; IVs, OER,
OEE Factors, and OEE. The average OEE figure of 62% is below the, lower end, bench
mark of 85%. Oil recovery rate is poor, averaging 20%, compared to 30% of mills with
best practices. Total recoverable potential cost due to the inefficiencies of maintenance
233
management system in Malaysian palm oil milling sector amounts to RM 114.56 billion
per year; that is 12% of the 2011 Malaysian GDP of 305.83 billion US$. Though the
Malaysian palm oil sector commands a healthy market share in global palm oil
production and trade, the data analysis shows that there is a considerable room for
improvement in the following segments. OEE of the ‘Palm Oil Milling’ sector is
considerably lower compared to the benchmark of world performers. Average OER is
50% lower than the industry players who have best practices; small holding plantations
are poor performers; overall land is underutilized; and considering the resources at the
disposal of palm oil sector, their contribution to GDP is low.
234
CHAPTER FIVE
5.0 CONCLUSION AND RECOMMENDATION
5.1 Introduction
Strategic maintenance management provides the avenue for continuous improvement.
Following sections of this chapter critically discuss the implications of the theoretical
and regulatory pressures and conclude the research findings pertaining to maintenance
management performance in Malaysian palm oil mills. Research objectives were all
actualized, except concerning POME. Performance of maintenance management system
at Malaysian palm oil mills was evaluated by measuring OEE; process of producing
CPO was assessed in palm oil mills while IV and DV were analysed in detail. Cost
savings in maintenance management system were identified and quantified. Theory-
practice gaps were identified for three sub-IVs (Labor, Spare-Materials’, &
Outsourcing), MV (Strategy-TPM), and DV (OEE). Contribution to Knowledge,
research findings, and research accomplishments are also included and elaborated on, in
this chapter. POME (mill effluent) generated by the CPO processing was evaluated for
its generation and disposal practices but could not be analysed due lacking credible data.
DV – IV relationship and MV affect, is summarised in the following sections.
5.2 OEE
Average OEE figure of 62% arrived at in the final analysis is low compared to the world
bench mark of 85% (Wireman, 2004); however, this could be treated as a starting point
for improvement. This research study examines the importance of maintenance
management performance evaluation, determines the effectiveness of OEE as a primary
235
performance metric and explains its three main factors that make up the calculation
process in the context of Malaysian palm oil mills; availability, performance, and
quality. OEE is embodied in the first of the original ‘Pillars of TPM’; it guides all TPM
activities and measures the results of these loss-focused activities. This use of OEE
evolved into the current Focused Improvement Pillar, one of eight TPM Pillars
(Nakajima, 1989). The goal of measuring OEE is to improve the effectiveness and
reliability of equipment. Since equipment effectiveness affects shop floor employees
more than any other group, it is appropriate for them to be involved in tracking OEE and
in planning and implementing equipment improvements to reduce lost effectiveness.
Collecting the data for OEE will teach the operator about the equipment, focus the
operator’s attention on the losses, and grow a feeling of ownership of the equipment.
The shift supervisor or line manager is often the one who receives the daily operating
data from the operator and process it to develop information about the OEE. Working
hands on with the data give the supervisor/manager basic facts and figures on the
equipment, help the supervisor/manager give appropriate feedback to the operators and
others involved in equipment improvement, and allow the supervisor to keep
management informed about equipment status and improvement results.
OEE breaks the performance of a manufacturing unit into three separate but measurable
components; Availability, Performance, and Quality. Each component points to an
aspect of the process that can be targeted for improvement. OEE may be applied to any
individual Work Center, or rolled up to Department or Plant levels. It is an important
measure of efficiency and improvements and improved OEE has a direct positive effect
on the profits; by understanding it and improving it, businesses are getting a greater

236
ROI. This tool also allows for drilling down for very specific analysis, such as a
particular product or Part Number, Shift, or any of several other parameters. It also gives
businesses a valid comparative measurement across their own plant, across sites, and
potentially against their competitors.
Maintenance system management performance involves much more than measuring
performance of physical assets. The process that delivers asset performance in support
of existing business operations and contributing to long term success of the organisation
must be managed as well. Capital intensive industries, such as palm oil mills, need to
address the issue as a matter of strategic importance and measure maintenance
performance holistically using tried and tested maintenance strategies such as TPM.
Nakajima (1989) provides the roadmap for making the paradigm shift in managing
maintenance function. To improve OEE, organisations need to better manage inputs, the
contributing factors that influence OEE; labor, spare-parts & materials, and outsourced
maintenance. What make an organisation tick are the hearts and minds of its people.
When people have shared objectives aligned with those of the organisation, action plans
are clearly communicated to those responsible for implementation. Work is structured to
achieve fast response and minimise loss and efforts are reinforced by support systems.
These people (who may include external partners such as suppliers and external service
providers) will have the inherent motivation to make maintenance performance
excellence a reality. Performance measurement is a hallmark of strategic maintenance
management performance. However, the performance measures being tracked will only
provide useful information for guiding management decisions and shaping desirable
behaviour if they are linked to the adopted maintenance strategy. Following sections
237
cover the three sub-IVs; labor, spare-parts, material & tools, and maintenance
outsourced. These sub-IVs allocated as maintenance inputs are to be managed efficiently
and effectively in order to maximise output.
5.3 Labor; Spare-parts, Material, & Tools; and Outsourced Maintenance
5.3.1 Labor: Malaysian Skilled Labor Market
Demand for skilled labor in Malaysia is going to rise considerably. There is a noticeable
gap on the supply side as such it is crucial that all the major players that shape the
skilled labor market including Government, businesses, training institutions, and
communities should collaborate and come up with an overall master strategy to meet
this challenge. To attain that goal Malaysia has to show significant improvement to
overcome deficiencies detailed in section 4.5.1. Here are some recommendations:
i. Malaysia could establish long-term apprenticeship programs, based on Canadian
model, and guidelines of Malaysian Qualification Agency (MQA), to train
apprentices, and add them to skill labor pool. This will indubitably help
businesses to meet their demand of skilled labor. Government of Malaysia, in its
budget speech of 2011, indicated to set up a “Talent Corporation” in early 2012
to inhibit the country’s growing “brain drain” that is impeding its vision of
turning Malaysia into a high-income nation by 2020 (MIER, 2011). This is a step
in the right direction, however, much depends on implementation of the policies;
slogans and billboards won’t work to solve the problems, concrete actions are
needed.
238
Skilled labor wages in Malaysia are lower than other neighboring Southeast
Asian countries and considerably lower than those in the United States and
Canada; average pay of a skilled licensed technician in Canada is $34 per hour,
compared to $3 per hour in Malaysia; besides wages, working environment
needs to be improved dramatically. When it comes to safety, health, worker’s
rights, Malaysia falls short compared to the developed countries. Adverse
government policies may also provide impetus to the skilled labor force to
migrate, eliciting a “brain drain”.
ii. Investors are currently waiting on legislation proposed in June of 2011 to offer
amnesty to the existing illegal workers in Malaysia, thereby increasing the legal
labor pool. For the state, the dramatic move will raise much-needed tax
revenues, improve national security, reduce human trafficking, and most
importantly, attract more foreign investment.
iii. CSR is not a priority for Malaysian companies. Though Malaysian government
insists on compliance and expects transparency and accountability in corporate
governance while Malaysian government itself falls short on both these accounts
(White-Paper, 2010). It is time to revisit the corporate and civil governance
structure to meet the demands of 21st century; an approach that makes
governance in both these areas fair, consistent, credible, transparent, and
accountable.
Just eight years remain before Vision 2020, Malaysia's blueprint for achieving fully
industrialized status, is to take effect. The net result is a need to transform Malaysia's
labor profile from one of non-skilled and semi-skilled to a highly skilled and
239
professional work force. This then is the challenge for the country to maintain a
significant supply of highly skilled people. Malaysia is a diverse, multicultural society
with a growing economy. Multinational firms who establish operations in Malaysia may
encounter some difficulty, initially, in finding qualified professionals to staff their
operations and it might be necessary, to import staff from elsewhere; however,
government efforts are in place to increase the availability of highly skilled human
resources in the country, and educational efforts continue to increase skill levels. With
average salary levels in the “middle of the pack” of Asia’s emerging economies,
Malaysia can represent an intriguing base of operations for multinational firms.
Competitiveness of an economy depends on many things; perhaps the most important
single determinant is the level and improvement of workforce skills at all levels.
5.3.2 Spare parts Inventory Management
As evidenced by research findings, lack of proper store room facilities in palm oil mills
has contributed to the inefficiency of CPO production process, confirmed by low OEE.
The spare parts inventories management in industrial plants represents a very complex
problem due to the difficulties concerning data collection, the number of factors to be
considered, and the large amount of the items involved. To dispense efficient and
effective services it needs to focus on the best practices of spare parts management. In
order to accomplish best practices the maintenance store room ought to adopt the idea
that the storeroom is a service provider, organize the storeroom and staff for efficiency,
ensure inventory accuracy, perform routine and daily cycle counting as part of the
storeroom duties, properly slot parts depending on part volume and characteristics, and
240
use auto ID and/or barcodes to streamline data entry and reduce errors. Build PM kits in
advance to enable quick PM of equipment; record all parts moves, receipts, and issues
on time; and create, track, and use measurements and KPIs. As each company is unique,
so too are the storerooms; different storerooms will require their own combination of
solutions. Details of the process have been provided in section 4.5.2. When the
storeroom operates in a best practices mode, then it is easy to see productivity gains not
only in the storeroom, but also throughout the organization.
5.3.3 Outsourcing Maintenance: Power Generating Equipment in Malaysian Palm Oil
Mills
As the research results reveal, the present maintenance system for the power generating
equipment, besides being burdened with transaction costs, is costing the mills in
overcapacity and redundant equipment (turbines & boilers), individual mill’s spare-parts
inventory cost and additional labor costs.
Power generation markets deregulation prompted by rapid depletion of fossil fuel
reserves as well as climate change and the push towards renewable energy sources, in
particular biomass fuels, is impelling changes in the behavior of power producers.
Increasing competition has caused power plants to switch from traditional time-based
maintenance strategies to those based on a plant’s operating condition. As competitive
power production becomes standard operation procedure, the quality of power a
company produces becomes the measure of its success. To achieve these demands cost
reduction and technical innovation programs are implemented in power generation
process. Furthermore according to the actual market conditions a higher flexibility in
operating and maintaining the plants is necessary. The decision concerning the
maintenance outsourcing was traditionally executed using cost-based decision models.
241
However, the dramatic change in the way maintenance function is viewed has
challenged the validity of this approach. Outsourcing of maintenance of power
generating equipment in palm oil mills offers a viable solution, as today, maintenance
outsourcing decision is analysed in a different way, taking into account complex and
extended sets of (tangible and/or intangible) strategic factors, detailed in section 4.5.3
(III). Palm oil mill managers need to be persuaded to bring in the outsourcing of palm
oil mill power generating equipment into 21st century through the use of e-maintenance
and IT based hardware & software tools available, using the Knowledge and experience
of the OEM&OM service providers. This, besides helping the Malaysian government to
achieve their MDGs, will ensure a reliable, flexible, and cost effective power supply to
the palm oil milling sector for years to come.
5.4 Contribution to Knowledge
5.4.1 Identified Theory and Practice Knowledge Gap in Malaysian Palm Oil
Mills’ Maintenance System Management (Research Objective #5)
i. Maintenance Strategy
Theory: TPM has been identified as a best in class manufacturing improvement
process that has allowed manufacturing industries to greatly increase their levels
of profitability and productivity; result shows there is a significant and positive
indirect relationship between TPM and manufacturing performance through JIT
practices (McKone et al., 2001).
242
Practice: BDM and PM were the only two strategies practiced by the survey
respondents. Low OEE figure affirms the poor performance in palm oil mills as
the TPM and OEE are not part of the maintenance strategy.
ii. OEE
Theory: OEE breaks the performance of a manufacturing unit into three separate
but measurable components; Availability, Performance, and Quality. Each
component points to an aspect of the process that can be targeted for
improvement. It is an aggregated productivity measure that takes into
consideration the six big losses that affect the productivity of equipment in
production systems (Venkatesh, 2006). TPM helps to raise the OEE value by
supplying a structure to facilitate the assessment of losses, and subsequently
giving priority to dealing with the more serious offenders (Eti et al., 2004).
Practice: None of the mills that participated in pilot study practiced TPM and did
not measure OEE. 20% of the survey respondents, who reported practicing TPM,
did not actually practice TPM in its entirety. OEE can appear improved by
actions such as purchasing oversize equipment, providing redundant supporting
systems, and increasing the frequency of overhauls. Investment in higher
installed mill capacity, purchase of redundant standby critical equipment such as
spare ‘boilers’, ‘presses’, ‘decanters’, and turbines can also distort OEE. 81% of
respondents reported having an array of redundant equipment compensating for
their operational inefficiencies, including all that reported practicing TPM.
243
iii. Labor
Theory: Respect of the worker; employees are assets and not liabilities,
knowledgeable workers are the essential ingredients of the modern economy,
people are an organization's most valuable resource, and that a manager's job is
both to prepare people to perform and give them freedom to do so. Workers
need to be provided with healthy, non-discriminatory work environment,
equitable compensation, training & development and above all respect (Drucker
et al., 2008).
Practice: Following ILO conventions are not ratified: Freedom of Association
and the Right to Organize; Abolition of Forced Labour; and Abolition of
Discrimination on the Basis of Occupation. Reports on environmental breaches,
workers human rights infringements, and ethical abominations are often
compromised. Malaysian government has not set the minimum wage, yet, about
34% of Malaysians earn wages below RM700 per month, which is below the
Malaysian poverty line benchmark of RM720. Majority of the palm plantation
workers fall under this category. Prevailing compensation packages paid to
Malaysian skilled workers are considerably subjacent compared to other
countries, e.g. Singapore or Canada.
iv. Spare-parts, material & tools
Theory: Maintenance store room is a service provider, if it is run improperly
(such as poor inventory accuracy, parts unavailable when needed due to poor
244
replenishment and procurement practices) the rest of the maintenance operation
will not achieve high service levels of equipment availability and reliability
(York, 2003).
Practice: Pilot study revealed that most second generation mills neither have a
dedicated spare-part inventory controller nor a separate spare-parts store room
area. Parts were stored all over the mill, including the maintenance shop area.
None of the mills had computerised inventory management system in place and
spare part inventory purchase solely depended on the mill managers’ decision.
Range of spare-parts, material, and tools cost, per ton of CPO produced, was
spread out; from a low of RM3 to a high of RM272. There is no figure available,
from MPOC or literature on palm oil milling, to bench mark the collected data,
in this regard (Figure 4.12)
v. Maintenance contracted out
Theory: Power generation equipment in Malaysian palm oil mills makes a good
business case for outsourcing its maintenance, primarily, due to lack of in-house
skilled workforce: power generating equipment is complex and highly
specialized (4.5.3-III); older power generating units are no longer considered
effective for reliable and efficient power supply (Wan et al., 2010).
Practice: Most of the mills have outsourced maintenance for their power
generating equipment; however, there is a room for improvement. The author
has suggested an “e-maintenance concept for power generating equipment in
Malaysian palm oil mills” 5.4.3
245
5.4.2 Modified ‘Input-Output Model for the Enterprise System’
The author has modified Tsang’s ‘Input-output model for the enterprise system (Tsang,
2002). The modified model, MMPM, exalts practitioner’s perspective (Figure 3.10). To
ensure a reliable production system, it incorporates role of maintenance strategy that
compliments maintenance function’s performance by improving OEE through its three
key inputs; Availability, Performance, and Quality (3.4.7).
5.4.3 e-maintenance network concept for ‘Power Generating Equipment in
Malaysian Palm Oil Mills’
Malaysia generated 95 million tons of biomass available for power generation in 2011
(MPOC, 2012). Malaysian government’s renewable energy efforts promote the biomass
power generation and co-generation in the palm oil mills with the aim to reduce GHG
emissions, promote growth of power generation and co-generation, and reduce barriers
that have hindered the adoption of biomass power generation and cogeneration
technologies. Though the private maintenance service providers active in the Malaysian
power generating market are providing this service, to some extent, their traditional way
of handling the maintenance business, based on the transactional and price oriented
business models, is not aligned to the new market requirements. To bridge the gap of
policy and practice, the author recommends to introduce a generic, e-maintenance
network concept for maintaining ‘Power Generating Equipment’ in palm oil mills.
e-maintenance is an emerging field in the maintenance management of expensive
equipment such as turbines. CBM program for turbines would be very useful, based on
remote sensing PdM techniques, such as vibration analysis and thermography, readings
to be taken by embedded sensors that are satellite linked to remote data collection and
246
analysis centers. Data so collected will determine the maintenance management
priorities, avoiding premature and disastrous failures. Inventories can be located at
strategic points to service vide clientele and the companies do not need to have spare –
redundant turbines. Utilizing intelligent condition monitoring strategies and a
supervisory on-line diagnostic system, the system will manage comprehensive on-line
data acquisition; internet data transmission systems, task-related data analysis and an
expert background knowledge base at, strategically located, Remote Power Generation
Diagnostic Center (RPGDC).This will enable detailed diagnosis of the actual plant
condition for the power plant and its key components. New approach will help reduce
the transactional costs by establishing strategic alliances between the service suppliers
on the one side and the palm oil mills on the other.
RPGDC is an essential part of the e-maintenance network that will enable operators to
minimize the LCC of power plants and at the same time maximize the output of
electrical energy. The drive to reduce LCC results among other things in the reduction
of staff and labor costs, whereas the desire to maximize electrical output requires raising
the availability, reliability and efficiency of the plant. The Power Plants covered under a
long term service contract can be connected via satellite to the RPGDC established in
strategic locations. The RPGDC has access to the data monitored continuously at the
power plant for all important operation values such as temperatures, vibrations,
operation hours, turbine start-up curves, and performance curves. Qualified and well
experienced personnel monitor the data in RPGDC and analyze these values with the
objective to determine the actual conditions of systems and installed components, and
evaluate the power plant performance. If needed, the RPGDC has direct access to
247
specialised OEM engineering know-how consultancy through specialists for Generator
or Steam turbine. In case of detected abnormal trends, events or trips, recommendations
for predictive maintenance actions can be given; The RPGDC is one of the important
features for early detection and prevention of damages. A concept diagram showing the
Flow of data between RPGDC, power generating equipment, field service centers, and
supplier’s remote power diagnostic centers, is shown in Figure 5.18.
RPGDC will be a modular built system to monitor, analyze and diagnose the complete
turbine island. The advanced service product will be equipped with sophisticated remote
expert diagnostic system, a foundation, for condition based maintenance strategies and
optimization of the plant operations. The recommendations of RPGDC will form the
basis for further operations, repairs and/or modernization of customer’s equipment.
RPGDC services will be established on national level with links to the global service
centre of service suppliers. Its services will not be limited to a specific supplier but
applicable to all kinds of power generating equipment including steam turbines and
generators. MPOB and MPOC can take a leading role to get the palm oil mills involved
and be instrumental in establishing this institution.
The goal of RPGDC would be to diagnose the operation of the turbine island for
purpose of early detection of abnormal operating conditions. Hardware failures and
instrumentation malfunctions may lead to abnormal conditions. Detection of these
conditions would result in optimized operation, higher availability, and improved
turbine island efficiency. This service will benefit operations by mitigating running of
nominal conditions. It will also provide the original manufacturers’ key information that
can be used to further improve products and services such as increases in hardware life
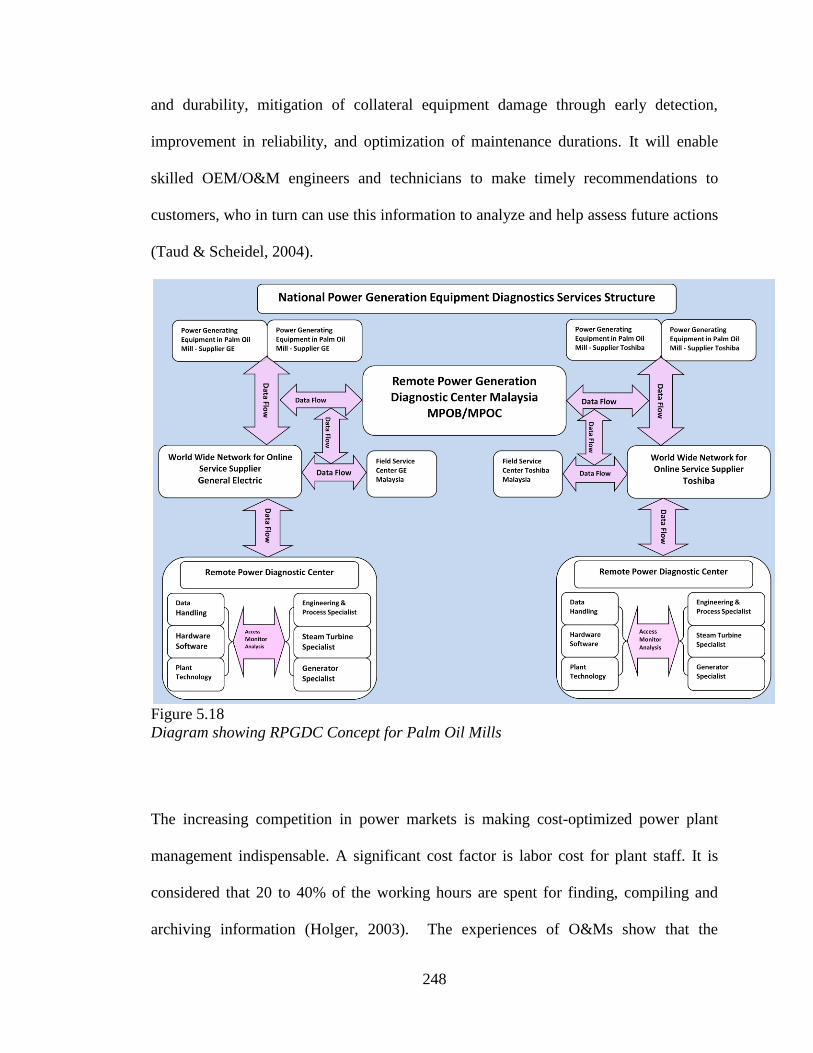
248
and durability, mitigation of collateral equipment damage through early detection,
improvement in reliability, and optimization of maintenance durations. It will enable
skilled OEM/O&M engineers and technicians to make timely recommendations to
customers, who in turn can use this information to analyze and help assess future actions
(Taud & Scheidel, 2004).
Figure 5.18
Diagram showing RPGDC Concept for Palm Oil Mills
The increasing competition in power markets is making cost-optimized power plant
management indispensable. A significant cost factor is labor cost for plant staff. It is
considered that 20 to 40% of the working hours are spent for finding, compiling and
archiving information (Holger, 2003). The experiences of O&Ms show that the
249
workload for information management can be limited to about 10% of the daily working
hours, with the help of IT solutions readily available for CMMS. The functions offered
should be in line with standard power plant practices (i.e. extensive adaptation is not
necessary), and special needs can be readily integrated as required. The system is
delivered in a reconfigured form with power-plant specific catalogues which consider
the fleet experiences also derived from utilizing the fleet data storage collected through
applied OEM and O&M systems. The system offers its users a 3 in 1 solution covering
operation, maintenance and administration processes; from fault detection, through
permit to work establishment up to spares cost control and inventory management that
reduces the downtime for major overhauls. An important parameter to measure the
stability of processes at a power plant is the downtime for major overhauls (Taud &
Scheidel, 2004).
O&M Contracts with world leaders in turbine manufacturing brings experience of O&M
of that organization, long term maintenance contracts experience, and a knowledge
network sharing all relevant technical information through their home based back office.
The knowhow of the customer together with the O&M contractor’s experience ensures
maximum long term asset protection. The contribution of the customer is the knowhow
in regard to the regional power production requirements, and the long term experience in
the local market pertaining to the power plant ownership. On the other hand, worldwide
long term O&M experience is brought in by companies like GE, Siemens, Toshiba,
Westinghouse, and many more. These synergy contributions from both parties allow a
quicker interpretation of the O&M procedures and installation of the emanating
engineering and administration processes.
250
5.5 Research Findings
i. Research Objective #1 : To evaluate performance of maintenance management
system at the Malaysian palm oil mills by measuring OEE
The average OEE figure of 62% as shown in Figure: 4.6 is below the 85%
benchmark (Wireman, 2004), however, this figure could have been subjacent as
the data constituting three parts seems to have been compromised (3.4.5). OEE
can appear improved by purchase of redundant standby critical equipment, such
as spare ‘boilers’, ‘presses’, ‘decanters’, and turbines; 81% of respondents
reported having an array of redundant equipment compensating for their
operational inefficiencies (4.3).
ii. Research Objective #2: To evaluate palm oil milling process performance of
producing CPO
Performance – typical items include: Minor stops; reduced speed or cycle time.
Calculations regarding CPO produced vs. CPO could have been produced, are
conciliated, idle time not reported and, generally, locally made, oil recovery
equipment, such as presses and vibrating screens, is not efficient as oil recovery
rate is poor, averaging under 20%, compared to 30% of mills with best practices
(MPOB, 2010) while 2 – 4% CPO ends up in EFB and POME. Reduced speed or
cycle time was not being recorded by any of the responding mills; the one speed
mill line ran continuously, with or without FFB supply (4.3). There is a positive
correlation between maintenance inputs and OEE (Figure 4.16). Likewise OEE
251
inputs: availability and performance have a significant positive correlation with
OEE - KPI for measuring DV (4.5 & Figure 4.17).
iii. Research Objective #3: To identify and quantify cost savings in the maintenance
management system of palm oil mills by benchmarking palm oil mill’s OEE
with world class performers
With the total assets of Malaysian palm oil sector quoted (MPOC, 2010) at RM
93.3 billion; at 15% benefits recoverable rate, palm oil milling estimated at 10%
of the sector, can potentially recover RM 1.4 billion (1.3.6).
Malaysian CPO production is 18.9 million tons/year at an OEE of 62%: this
translates into 304,839 tons of CPO for 1% of OEE; for the gap of 23%, the
figure is, astounding, 7,011,290 tons CPO per year, worth RM 22.44 billion, at
prevailing rate of CPO per ton of RM 3200 (Figure 4.14). In addition, bridging
the gap between national average of 4 tons/ha, and 8 tons/ha - the output of mills
with best practices, has the potential to produce an additional 18.9 million tons
of CPO worth over RM 60.48 billion; RM 83.4 billion in export earnings (4.4).
iv. Research Objective #4: To identify and quantify POME generated during palm
oil processing and evaluate disposal practices for sustainability and
environmental impact
19.50% and 24.40% respondents reported “0” POME produced and POME
treated, respectively. 80.50% of the respondents reported generating POME,
72% of the POME generated was reported as treated by the respondents. During
the pilot test it was revealed that most of the second generation mills do not have

252
a credible system of recording POME generation and treatment. This operation
does not seem to be tightly regulated. Quantity of POME produced is measured
using crude devices, such as “tipping barrels” and the number count data is not
monitored properly, resulting in “speculative” or EPD required” figure to be
reported. Treatment methods are primitive and lack monitoring. 19.50%
respondents report having “0” POME generated, while the pilot study revealed
that on average 60-65% of the FFB tonnage processed ends up as POME, due to
the same amount of steam injected into the process (MPOC, 2010). This
compromised data credibility and constrained the author from consequential
analysis (4.7).

253
5.6 Research Accomplishments
i. Offered realistic, shop level solutions to bridge the theory-practice gaps in
maintenance inputs (IVs): Labor; Spare-parts, material & tools; Maintenance
Outsourcing; and OEE (DV).
ii. Designed a generic OEE calculating template (Figure 5.19) for palm oil mills
that, with minor modifications, can be adopted by other manufacturing
organisations to benchmark their performance; identify gaps for improvement
and thereby plan actions to improve processes. Divergence identified between
current and desired performance by wielding OEE template would succor to
bridge this gap (initial gap as pointed out in MPOB, 2010, presentation) is to
double the CPO output from 4 to 8 tons/ha; improve OER from 20% to 30%, and
the potential to double the foreign exchange earnings of palm oil, from present
level of RM 83.4 billion per year.
Figure 5.19
Individual Mill Daily Production Log & OEE Template
1 2 3 4 5 6 7 8 9 10 11 12 13 14 15 16 17 18
Date
Tim
e in
Sh
ift
Bre
aks
& L
un
ch
Sch
ed
ule
d
Mai
nte
nan
ce T
ime
Me
eti
ngs
etc
. N
on
Pro
du
ctio
n T
ime
Setu
p &
Ad
just
me
nts
Min
or
Sto
pp
age
s
Bre
akd
ow
ns
Spe
ed
Lo
ss
Tim
e M
ill a
vaila
ble
for
op
era
tio
n
Ne
t Ti
me
Mill
Wo
rke
d
FFB
Pro
cess
ed
(To
ns)
Tota
l Pro
du
ctio
n o
f
CP
O (
Ton
s)
Ou
t o
f Sp
ec
CP
O &
Slu
sh o
il re
cove
ry
Ava
ilab
ility
Rat
e
Pe
rfo
rman
ce R
ate
Qu
alit
y R
ate
O E
E =
Ava
ilab
ility
x
Pe
rfo
rman
ce x
Qu
alit
y R
ate
19-Sep 480 45 60 10 10 10 30 30 365 315 131.25 23.44 2.75 0.86 0.81 0.88 0.62
20-Sep 480 45 10 5 8 15 20 40 420 377 157.08 26.68 2.50 0.90 0.92 0.91 0.75
21-Sep 480 45 30 15 9 9 25 20 390 347 144.58 25.89 2.95 0.89 0.90 0.89 0.71
22-Sep 480 45 20 5 11 12 30 35 410 357 148.75 25.49 3.00 0.87 0.88 0.88 0.68
23-Sep 480 45 15 10 8 8 35 25 410 359 149.58 26.44 3.25 0.88 0.92 0.88 0.70
Individual Mill DAILY PRODUCTION LOG & OEE (Time in minutes) September 2011

254
iii. Designed a generic maintenance daily service log pro-forma (Figure 5.20) for
use in the Malaysian palm oil mills to record daily maintenance activities and to
develop repair history of the equipment for informed decisions regarding repair
or replacement. With minor modifications, the template may easily be adopted
by other manufacturing organisations.
Figure 5.20
Maintenance Daily Service Log Template
iv. Introduced an e-maintenance concept for power generating equipment of palm
oil mills; a complete frame work for establishing an e-maintenance system has
been entailed in section 5.4.3 with a graphic sketch (Figure 5.18) depicting the
links between different units and the flow of information among them.
v. Several recommendations have been made for the future research that will be
enormously beneficial to the palm oil sector and, hence, for the Malaysian
economy (5.8 & 5.10).
1 2 3 4 5 6 7 8 9 10 11 12
2011
Tim
e o
f Se
rvic
e
Cal
l
Init
ial R
ep
ort
Equ
ipm
en
t D
eta
il
(Ass
et
#)
Tech
nic
ian
atte
nd
ing
call
(Em
plo
yee
#)
Actual Diagnosis and
repair details
Tim
e E
qu
ipm
en
t
Up
an
d R
un
nin
g
Tim
e t
ake
n t
o
rep
air
(min
ute
s)
Equ
ipm
en
t
Do
wn
tim
e
Wo
rk O
rde
r #
issu
ed
fo
r la
ter
rep
airs
En
tere
d in
CM
MS
Remarks
Sep-19 10:30
FFB conv.
Stopped #001 Ben #113
Motor # 25 limit
switch was off
adjusted bracket 11:00 20 30 #001 Y
New Bracket
needed - order
material
Sep-19 10:45
Steril izer #A FFB
not soft to spec #004-A Zul #125
low steam pressure
replaced damaged
door seal 11:45 45 60 #002 Y
Used last door
seal - please order
3 Goodyear brand
Sep-19 11:30
Flue gases alarm
is on #012
Abdul
#045
ID fan load switch
tripped - lubed
bearing to run it 11:45 10 20 #003 Y
Motor bearings
shot new needed
WO#003 issued
Sep-19 14:00
Vibrating Screen
off #008-B
Chen
#096
Safety Switch
damaged 14:55 45 60 #004 Y
replaced last
switch in stock -
Please order 2
Sep-19 15:30 Decanter is noisy #007-C
Ravi
#049
Anchor bolts were
loose - tightened 15:50 15 15 #005 Y
WO#005 issued
for New bolts with
lock washers
Maintenance Daily Service Log (Template)
255
5.7 Generalization
i. None of the respondent palm oil mills are developing a maintenance
performance management system that is clearly driven by business goals of their
organisation since the mills surveyed are using BDM and PM as maintenance
strategy. However, this is not linked to the performance.
ii. Performance measures are not indentified through structured and participative
process.
iii. Strategic dimensions of asset management, such as maintenance service delivery
options, acquisition, improvement, replacement, and disposal of physical assets
are considered outside the scope of maintenance function in most of the mills;
hence, performance in these aspects are often not tracked.
iv. Maintenance performance measures that relate to drivers of future performance
improvement, innovation, organisational culture, employees capabilities are
limited in use in mill’s management systems.
v. Performance measure in common use is primarily confined to concerns of
production and operations management: production rate; oil extraction rate;
equipment availability; faults & breakdowns; and costs of human resources
(workforce). Soft measures that relate to customer, employee, environment, and
sustainability are hard to find in any of the mills.
vi. The alignment of maintenance at different levels of the organization is a
common blind spot in maintenance management performance. This can be a
serious issue for companies with large maintenance departments.

256
vii. Mills do not have a reward and recognition system that has a clear link with the
maintenance performance function; shop floor employees are not highly
regarded as assets and thus not well trained, rewarded, respected or appreciated.
viii. Sophisticated critical equipment, such as turbines, decanters, was outsourced for
maintenance, by most mills.
ix. Lack of awareness among upper management that maintenance excellence has
direct effect on organisations performance – sustainable profits.
x. Allocating of resources for maintenance is typically made through the operating
budget. Managers therefore regard it as an expense; not an investment to prevent
loss of service to customer and to ensure fast recovery of failed assets. Managers
concentrate on near term issues, improving profits and reduction of maintenance
cost.
xi. Visit to three, second generation, mills in the pilot study showed maintenance,
production, and shop floor employees lack; safety conditions (no safety gear),
general outlook (shabbily dressed), inadequate pay, lack of respect, subdued
boss-employee relationship, no safety or fire prevention procedures apparent, no
verifiable accident records kept on site.
xii. Most maintenance managers are engineers by training; they tend to hold the view
that problems have conceptual and theoretical solutions that can be implemented
in the real world. They tend to fit the humans to technology rather than the other
way around; an appropriate way for operations and technology interface.
xiii. CSR is not a priority in most mills, reporting figures are compromised; data
provided to the regulating authorities is not credible. Palm Oil milling sector
257
needs to address the needs of all the stakeholders. The rapid introduction of new
technology requires significant input from the suppliers and outside experts.
Trusts, shared interest, collaboration for mutual benefits, are the essentials of
partnership relationship; they are also the integrants of successful technology
transfer. The adoption of a fair process embodying the three mutually reinforcing
principles of: engagement (participation); explanation (open communication);
and expectation clarity, is the key to drive out fear, earn the trust of those
affected, and most importantly, to achieve alignment of goals to make changes
happen (Kim & Mauborgne, 1997). Participation in learning to understand
(analysis), discovering what to change (design), and in organizing to succeed
(implement), is empowerment. Anything less is not likely to be as effective
(Taylor & Felten, 1993).
xiv. Recycling of EFB is taken by 90% of the mills as dumping the EFBs in
plantations. Only 10% of the respondents actually recycled EFB for value added
products. Out of the 22% EFBs, 2% CPO is recovered and the fiber is processed
into coir and sold for downstream industries. It is being marketed for RM 28/ton
and the remaining crude fibre left is used as fuel for the boiler. A rough
calculation for the amount not being recovered is RM 60 million per year; it is
almost 30% of the annual cess money being collected from the mills (MPOA,
2011).

258
5.8 Recommendations for the Malaysian Palm Oil Milling Sector
i. It is essential that ‘Benchmarks’ be created for: oil recovery rate; per ton of CPO
cost of inputs (labor; spare-parts, material, & tools; maintenance outsourced);
energy consumed; steam consumed; mill effluent produced; and management.
ii. Trades training for the skilled labor force, with Mills’ input, should be organised
by the MPOB and MPOC. A proper trade’s certification process should be part
of the training structure. Canadian system of apprenticeship, training, and
certification could serve as good model to adopt.
iii. Mills could use the templates of, maintenance daily log, and OEE, for
calculations to garner equipment repair history and plan accordingly for
improvements (Figure 5.19, 20).
iv. With the help of OEMs, an indigenous industry for manufacturing turbines and
decanters is developed to ensure a reliable supply of this equipment to the
industry; vital for the stability and self sufficiency of palm oil milling sector.
v. To help qualify for RSPO certification POME generation recording, by the mills,
be automated. Simple inexpensive and sealed flow meters can be installed, that
will bring credibility to mill effluent generation reporting and help regulate the
process.
vi. CWORKS, a Malaysian Software for CMMS, is available; it can easily serve the
needs of palm oil mills, and other manufacturing SMIs, to manage assets
including machinery, equipment, and buildings etc. The software is very
affordable considering price and technical post sales support. However, for
starters, a free version is also available (CWORKS, 2011). MPOB could

259
persuade the mills to use CWORKS; it will facilitate their R&D and regulatory
duties.
vii. MPOB need to improve their relations with palm oil mills. Mills perceive “us-
they” syndrome is prevalent, and that the Malaysian Government’s taxation
policies and MPOB’s regulatory practices are discriminatory. This, somewhat
hostile, relationship is not conducive to the future development of palm oil
sector. Latest row between MPOB and the Mills was evident at the Round Table
Conference (RT 9), held in Sabah, Borneo; the news has been covered in the
local media, at length MPOB’s relations with their Indonesian counterparts are
also strained; MPOB has been accused of non conciliatory and arrogant attitude
that is detrimental to the regional palm oil sustainable development, almost
fringing a ‘turf war’ syndrome (Star, 2011).
5.9 Research Limitations
i. This study did not examine the impact of maintenance management
ineffectiveness on safety, health and the environment.
ii. Credible and verifiable data was not available for mill effluent generation and
treatment; hence, neither the figures quoted in the literature could be verified,
nor was sustainability analysis done.
260
5.10 Future Research Recommendations
I. Best Management Practices in Palm Oil Mills -Benchmarks for Productivity
Benchmarking is an objective and analytical technique that compares a firm’s
business processes with those of other companies that achieved recognition for
excellence for a specific process or function. The goal is to identify and profile
another organisation that achieved radical improvements, which significantly
impacted their bottom line or reputation. Benchmarking is simply the process of
measuring the performance of one's company against the best in the same or
another industry, (Stevenson, 1996). Though benchmarks are moving targets,
nevertheless, organisations need them in order to gauge their performance by
comparing their own to the best in the industry. It is imperative for Palm oil
sector to provide bench marks for the following inputs required per ton of CPO
produced namely: FFB processed: OER; Energy consumed; Steam consumed;
Management cost; Direct Labor cost; Maintenance Labor cost; Spare-parts,
Material, & Tools cost; Outsourced Maintenance cost; Overheads cost; and Mill
Effluent (POME) produced.
II. Equipment-level Maintenance Optimization: Retirement Planning and
Asset Disposal Cost
Optimal retirement/replacement management is an important part of asset
management as minimizing LCC is an important objective espoused by several
organisations, which aims at reducing long term investment / maintenance costs.
Effective retirement / replacement plan will reduce failures. However, extensive
studies of the impact of replacement plan toward equipment reliability and
economic cost should be conducted. Most of the prime movers being used in the
261
industry, such as motors, are of obsolete old British design; they are like
‘dinosaurs’ of the breed. Over designed and extremely inefficient; they have long
been replaced in the Western world with more energy efficient and sleek design
motors. It is time these prime movers are phased out from the palm oil mills, in a
progressively planned way, in order to make the industry efficient and
sustainable in the long run.
III. Dormant Small Holding Plantations & Senile Palms
A term used for those plantations that are hardly productive, are small in size and
tree height is at a stage that is hard to reach for the fruit; on top of that the
owners, small farm holders, have no resources to revive these micro plantations
through replanting using best management practices. Boarded up homes along
the interior roads in western Malaysia evinces the abandonment of many of such
farms whose owners have moved away in search of better prospects. The author
visited one such farm in Perak state; this 20 plus hectare farm, comprised of
several small parcels of two or more hectares, scattered across an area of three
square kilometres. Owner had passed away and the sons were not interested in
the business; one of the married daughters, who lived close, had contracted out
the entire fruit pick up and sale operation at a meager price of RM 30 thousand
per year. A properly maintained 20 hectare micro plantation, at 8 tons/ha, could
produce160 tons per year of FFB; at the prevailing price of RM 640 per ton
worth RM 102,400. This is not an uncommon phenomenon that can be seen
throughout the interior of western peninsula. A research study needs to be
initiated in order to identify the opportunity cost of dormant plantations that are

262
dragging down the performance of small farmers’ plantations. The potential
recovery that can be made by reviving this segment of palm oil sector holds a
substantial potential of income generation for small palm oil plantation holdings.
Other areas that could prompt a research are; availability of senile palms and
evaluating the potential, and socio-economic prospects of replanting the area
where senile palms have been harvested.
Senile palms and small holding plantations constitute 40% share of small
holdings in the oil palm plantations (MPOB, 2010); 50 % according to some
estimates, are covered with senile palms waiting to be felled. At 136 palms per
hectare for the 900 thousand hectares of unproductive small holding area, this
amounts to over 122 million senile palms to be felled. The process of felling and
replanting the senile palms could generate economic activities. Senile palms
could be processed into low-end lumber, furniture, provide raw material for
plywood & chipboards, or could be sold as logs. Replanting will provide
business to palm nurseries and equipment manufacturers while creating jobs for
businesses and workforce. In addition, replanting of the area with better species
will enhance the output of these cash starved plantations; accrued social benefits
will be an added bonus.
263
5.11 Chapter Summary
This research exalts practitioner’s perspective and has determined that SMT axioms and
TPM principles are not being applied to optimize productivity in palm oil mills. In order
to ensure competitiveness and sustainability of its palm oil industry in the 21st century,
it is obligatory for Malaysia to adopt best management practices in processing,
manufacturing and maintenance that will improve yield, and Oil Extraction Rate. This
research study demonstrates how efficient and effective maintenance management
offers, besides cost savings, a wide scope of improvements for the palm oil industry that
could help it to be competitive in the long run. The main contributions of this research
study are: Identified theory and practice gaps pertinent to maintenance management in
palm oil mills; Provided shop-level solutions to bridge those gaps; Modified ‘Input-
Output Model for the Enterprise System’; Designed a generic OEE calculating template
and maintenance daily service log pro-forma for use in the Malaysian palm oil mills;
and provided guidelines for establishing an e-maintenance system for power generating
equipment in palm oil mills.
OEE and Lean have several key factors in common, but perhaps the most important is
the concept of elimination of waste. OEE is attractive to managers as it produces a
numeric metric that can be understood in an instant; it points to the pockets of
inefficiencies in equipment operation and processes. OEE facilitates ambitious goal-
setting, it is easily understood by equipment operators and its visual displays assist in
recognition of exceptional performance by individuals. Suggested shop level solutions
to bridge the theory-practice gaps in maintenance inputs and OEE can be applied to the
palm oil milling sector. Use of the designed OEE and daily service log templates can

264
help to make the palm oil milling process efficient and effective. The introduced
e-maintenance concept for power generating equipment can ensure competitive
uninterrupted quality power supply to the palm oil milling sector. Outsourcing of
maintenance of power generating equipment in palm oil mills offers a viable solution to
the Malaysian government to achieve their Millennium Development Goals and will
ensure a reliable, flexible, and cost effective power supply to the palm oil milling sector
for years to come. Research findings provide impetus to the palm oil mills to adopt best
practices in the milling sector. Future research recommendations have the potential to
provide sustainable better earnings for the palm oil sector.
265
REFERENCES
Achabal, D. D., Heineke, J. M., & McJntyre, S. H. (1984). Issues and perspectives on
retail productivity. Journal of Retailing, 60(3), 107-127.
Adam, G., & Bode, A. (2000). Ferndiagnose und Teleservicesystem für GUD-
Kraftwerke, VDI-Bericht Nr. 1566. Düsseldorf, Germany: VDI-Verlag.
Ahlmann, H. (1984). Maintenance effectiveness and economic models in the
terotechnology concept. Maintenance Management International, 4, 131-139.
Ahlmann, H. (1995). Maintenance research and development program. Sweden: UTC.
Ahlmann, H. (1998). The economic significance of maintenance in industrial
enterprises. Sweden: Lund Institute of Technology, Lund University.
Ahmad, A. L., Ismail, S., & Bhatia, S. (2003). Water recycling from palm oil mill
effluent (POME) using membrane technology. Desalination 157, 87-95.
Ahmed, S., Masjuki, H., & Taha, Z. (2005). TPM can go beyond maintenance: excerpt
from a case implementation. Journal of Quality in Maintenance Engineering,
11(1), 19-42.
Ahuja, I. P. S., Khamba, J. S., & Choudhary, R. (2006). Improved organizational
behavior through strategic total productive maintenance implementation,
IMECE2006-15783. Proceedings of the 2006 ASME International Mechanical
Engineering Congress and Exposition (IMECE), Chicago, Illinois, November 5-
10, 1-8.
Ahuja, I. P. S., & Khamba, J. S. (2007). An evaluation of TPM implementation
initiatives in an Indian manufacturing enterprise. Journal of Quality in
Maintenance Engineering, 13(4), 338-52.
Ahuja, I. P. S., & Khamba, J. S. (2008a). Total productive maintenance – Literature
review and directions. International Journal of Quality and Reliability
Management, 25(7), 709-756.
Ahuja, I. P. S., & Khamba, J. S. (2008b). An evaluation of TPM initiatives in Indian
industry for enhanced manufacturing performance. International Journal of
Quality and Reliability Management, 25(2), 147-172.
Ahuja, I. P. S., & Kumar, P. (2009). A case study of TPM implementation at precision
tube mill. Journal of Quality in Maintenance Engineering, 15(3), 241-258.
Alkin, M. C. (1990). Debates on evaluation. Thousand Oaks, CA: Sage. Publications
Inc.
Al-Najjar, B., & Alsyouf, I. (2003). Selecting the most efficient maintenance approach
using fuzzy multiple criteria decision making. International Journal of Production
Economics, 84(1), 85-100.
Al-Najjar, B., & Alsyouf, I. (2004). Enhancing a company’s profitability and
competitiveness using integrated vibration-based maintenance: A case study.
European Journal of Operational Research, 157(3), 643-657.
Al-Najjar, B. (1997). Condition-based maintenance: Selection and improvement of a
cost-effective vibration-based policy in rolling element bearings. Unpublished
doctoral dissertation, Lund Institute of Technology, Lund University, Sweden.
Al-Najjar, B., & Alsyouf, I. (2000). Improving effectiveness of manufacturing systems
using total quality maintenance. Integrated Manufacturing Systems, 11(4), 267-
276.
266
Alsyouf, I. (2004). Cost effective maintenance for competitive advantages. Published
doctoral dissertation (Terotechnology), School of Industrial Engineering, Växjö
University Press, Acta Wexionensia, Växjö.
Alsyouf, I. (2007). The role of maintenance in improving companies’ productivity and
profitability. International Journal of Production Economics, 105(1), 70-78.
Altrichter, H., Feldman, A., Posch, P., & Somekh, B. (2008). Teachers investigate their
work: An introduction to action research across the professions (2nd ed.).
London: Routledge, p. 147.
Andersen Consulting (1993). The lean enterprise benchmarking project. London:
Andersen Consulting.
Andersen Consulting (1994). World-wide manufacturing competitiveness study – The
second lean enterprise report. London: Andersen Consulting.
Antras P. (2003). Firms, contracts, and trade structure. Quarterly Journal of Economics
118(4), 1375-1418.
APEC (2011). Towards seamless Asia-pacific Economy, New Straits Times. Retrieved
December 31, 2011, from http://www.nst.com.my/
APOC (2010). American Palm Oil Council, Palm Oil development and performance in
Malaysia, MPOB & APOC Presentation to USITC Washington DC, Feb. 3, 2010
Argenti, J. (1997). Stakeholders: The case against. Long Range Planning, 30(3), 442-
445.
Ashayeri, J. (2007). Development of computer-aided maintenance resources planning
(CAMRP): A case of multiple CNC machining centers. Robotics and Computer-
Integrated Manufacturing, 23(6), 614-623.
Ashton, C. (1997). Strategic performance measurement. London: Business Intelligence
Ltd.
Asian Development Bank (ADB) (2006). Technology overview – Palm oil waste
management. Retrieved December 31, 2011, from http://www.adb.org/
Documents/Reports/Consultant/ 36557.
Asmild, M., Paradi, J. C., Reese, D. N., & Tam, F. (2007). Measuring overall efficiency
and effectiveness using DEA. European Journal of Operational Research, 178(1),
305-321.
Atkinson, A. A., Waterhouse, J. H., & Wells, R. B. (1997). A stakeholder approach to
strategic performance measurement. Sloan Management Review, 38(3), 25-37.
Backlund, F., & Akersten, P. A. (2003). RCM introduction: Process and requirements
management aspects. Journal of Quality in Maintenance Engineering, 9(3), 250-
264.
Bakerjan, R. (1994). Tool and manufacturing Engineers’ handbook: Continuous
improvement (4th ed.). NJ: ASME.
Bamber, C. J., Sharp, J. M., & Hides, M. T. (1999). Factors affecting successful
implementation of total productive maintenance: A UK manufacturing case study
perspective. Journal of Quality Engineering, 5(3), 162-181.
Bamber, C., Castka, P., Sharp, J., & Motara, Y. (2003). Cross-functional team working
for overall equipment effectiveness. Journal of Quality in Maintenance
Engineering, 9(3), 223-239.
Banks, R. L., & Wheelwright, S. C. (1979). Operations versus strategy – Trading
tomorrow for today. Harvard Business Review, May/June, 112-120.

267
Banverket (2007). Annual report 2006. Retrieved December 31, 2011, from http://
publikationswebbutik.vv.se/upload/5856/100194_banverkets_annual_report_2006
Barnard, C. I. (1962). The functions of the executive. Cambridge, MA: Harvard
University Press.
Barney, J. (1992). Integrating organisational behaviour and strategy formulation
research: A resource-based analysis. In P. Shrivastava, A. Huff, & J. Dutton
(Eds.), Advances in strategic management, Volume 8. Greenwich, CT: JAI Press,
39-62.
Basiron, Y. (2000). Advances in palm oil technology, Volume 1. Malaysia: MPOB, 234-
245.
Basiron, Y. (2007). Palm oil production through sustainable plantations. European
Journal of Lipid Science and Technology 109, 289-295.
Basiron, Y. (2008a). Malaysian palm oil: Dynamics and prospects. A plenary
presentation at the Malaysia-India Palm Oil Trade Fair and Seminar, Mumbai,
India.
Basiron, Y. (2008b). Creating fine balance for development, food, security and
environmental sustainability. Palm Oil Blog. Retrieved July 13, 2011, from
http://www.ceopalmoil.com/
Basiron, Y., & Chan, K. W. (2004). The role of R&D strategies in food safety, GAP,
DMP and GDP in the Malaysian palm oil industry. Paper presented at the
EUREPGAP ASIA 2004 Conference, Kuala Lumpur, Malaysia, 17.
Basiron, Y., & Chan, K. W. (2008). Sustainability reporting in the oil palm industry. In
S. Gurmit, K. H. Lim, L. Teo, & K. W. Chan (Eds.), Sustainable production of
palm oil – A Malaysian perspective, Kuala Lumpur: Malaysian Palm Oil
Association, 109-132.
Basri, M. W., Chan, K. W., & Basiron Y. (2002). Advances in research and
development for the sustainability of the oil palm industry in Malaysia. Keynote
paper delivered at the Agriculture, Biotechnology and Novel oil Crops (ABNO)
Module of the International Oils and Fats Congress, organised by the Malaysian
Oil Scientists and Technologists Association (MOSTA), 7-10 October 2002, pp.
19.
Ben-Daya, M., & Duffuaa, S. O. (1995). Maintenance and quality: The missing link.
Journal of Quality in Maintenance Engineering, 1(1), 20-26.
Berliner, C., & Brimson, J. A. (1988). Cost management for today’s advanced
manufacturing: The CAM-I conceptual design. Boston, MA: Harvard Business
School Press.
Bernama (2010). www.bernama.com. Retrieved July 13, 2011, from http://www.palm
oilhq.com/PalmOilNews/malaysias-felda-gets-sustainability-certification-report/
Bevilacqua, M., & Braglia, M. (2000). The analytic hierarchy process applied to
maintenance strategy selection. Reliability Engineering and System Safety, 70, 71-
83.
Bititci, U. S., Carrie, A. S., & McDevitt, L. (1997). Integrated performance
measurement systems: A development guide. International Journal of Operations
and Production Management, 17(5), 522-534.
268
Bititci, U. S., Turner, T., & Begemann, C. (2000). Dynamics of performance
measurement systems. International Journal of Operations and Production
Management, 20(6), 692-704.
Bititci, U. S., Mendibil, K., Martinez, V., & Albores, P. (2005). Measuring and
managing performance in extended enterprises. International Journal of
Operations and Production Management, 25(4), 333-353.
Blanchard, B. S. (1997). An enhanced approach for implementing total productive
maintenance in the manufacturing environment. Journal of Quality in
Maintenance Engineering, 3(2), 69-80.
Blischke, W. R., & Murthy, D. N. P. (2000). Reliability. New York, NY: John Wiley
and Sons.
Bogdan, R. C., & Biklen, S. K. (2006). Qualitative research in education: An
introduction to theory and methods (5th
ed.). Boston: Allyn and Bacon.
Bourne, M. C. S., Mills, J. F., Bicheno, J., Hamblin, D. J., Wilcox, M., Neely, A. D., &
Platts, K. W. (2000). Performance measurement system design: Testing a process
approach in manufacturing companies. International Journal of Business
Performance Measurement, 1(2), 154-170.
Bowditch, J., & Buono, A. (2005). A Primer on Organizational Behavior. Hoboken, NJ:
John Wiley and Sons.
Bowen & Spear (1999). Decoding the DNA of the Toyota Production System. Harvard
Business Review, September-October.
Boyd, L. H., & Gupta, M. C. (2004). Constraints management: what is the theory?
International Journal of Operations and Production Management, 24(4), 350-371.
Braglia, M., Carmignani, G., Frosolini, M., & Grassi, A. (2006). AHP-based evaluation
of CMMS software. Journal of Manufacturing Technology Management, 17(5),
585-602.
Brah, S. A., & Chong, W. K. (2004). Relationship between total productive maintenance
and performance. International Journal of Production Research, 42(12), 2383-
2401.
Braven, H. (1998). Labour and monopoly capital: The degradation of work in the
twentieth century. New York, NY, USA: Republication by Monthly Review Press,
ISBN 0853459401.
Bruce, K. (2006). Henry S. Dennison, Elton Mayo, and human relations historiography.
Management and Organizational History, 1, 177-199.
Business Times (2008). Malaysian palm oil growers to pay windfall tax. Business
Times, June 6, 2008. Retrieved August 16, 2011, from http://www.btimes.com.my
Butler, R. A. (2006). Why is palm oil replacing tropical rainforests? Why are biofuels
fuelling deforestation? Mongabay News, April 25, 2006. Retrieved August 16,
2011, from http://news.mongbay.com.
Butler, R. A. (2007a). Eco-friendly palm oil could help alleviate poverty in Indonesia
palm oil is not a failure as a biofuel. Mongabay News, April 3, 2007. Retrieved
August 16, 2011, from http://news.mongabay.com/2007/0403-oil_palm.html
Butler, R. A. (2007b). Palm oil doesn’t have to be bad for the environment. Mongabay
News, April 4, 2007. Retrieved August 16, 2011, from http://news.mongabay.com/
2007/0404-oil_palm.html
Byrne, D. (2005). Social exclusion. Maidenhead: Open University Press

269
Camp, R. C. (1989). Benchmarking – The search for industry best practices that lead to
superior performance. Milwaukee, WI: ASQS Quality Press.
Campbell, J. D. (1995). Uptime: Strategies for excellence in maintenance management.
Portland, OR: Productivity Press.
Campbell, J. D., & Jardine, A. K. S. (2001). Maintenance excellence: Optimizing
equipment life-cycle decisions. New York, NY: Marcel Dekker.
Carter, C., Finley, W., Fry, J., Jackson D., & Willis, L. (2007). Palm oil markets and
future supply. European Journal of Lipid Science and Technology, 109, 307-314.
Chan, F. T. S., Lau, H. C. W., Ip, R. W. L., Chan, H. K., & Kong, S. (2005).
Implementation of total productive maintenance: A case study. International
Journal of Production Economic, 95, 71-94.
Chand, G., & Shirvani, B. (2000). Implementation of TPM in cellular manufacturing.
Journal of Material Processing Technology, 103, 149-154.
Chandler, A. D. (1977). The visible hand - Managerial revolution in American business.
Boston, MA: Harvard University Press.
Chandler, A. D. (1962). Strategy and structure: Chapters in the history of the industrial
enterprise. Cambridge, MA: Harvard University Press.
Chaneski, W. S. (2002). Total productive maintenance – An effective technique.
Modern Machine Shop, 75(2), 46-48.
Chemicals X, NV. (1991). Some aspects of measuring maintenance performance in the
process industry. Journal of Quality in Maintenance Engineering, 4(1), 6 – 11.
Cho, D., & Parlar, M. (1991). A survey of maintenance models for multi-unit systems.
European Journal of Operations Research, 51, 1-23.
Choi, T. Y., & Hartley, J. L. (1996). An exploration of supplier selection practices
across the supply chain. Journal of Operations Management, 14(4), 333-343.
Cleveland, G., Schroeder, R. G., & Anderson, J. C. (1989). A theory of production
competence. Decision Sciences, 20(4), 655-668.
Coetzee, J. (1998). Maintenance. Hatfield: Maintenance Publishers.
Cooke, F. L. (2000). Implementing TPM in plant maintenance: Some organisational
barriers. International Journal of Quality and Reliability Management, 17(9),
1003-1016.
Cooper, R. (1987a, b). The two-stage procedure in cost accounting: Part 1. Journal of
Cost Management, 39-51.
Cox, J. F., Blackstone, J. H., & Schleier, J. G. (2003). Managing operations: A focus on
excellence. Great Barrington, MA: North River Press.
Cross, K. F., & Lynch, R. L. (1988/89). The SMART way to sustain and define success.
National Productivity Review, 8(1), 23-33.
CWORKS (2011). Retrieved January 31, 2012, from http://www.cworks.com.my/
cw_download.asp
Dale, E. (1973). Management, theory, and practice. McGraw-Hill Publication, NY.
Damiana, C., & Ghirardo, G. (2010). Maintenance management in Italian manufacturing
firms. Journal of Quality in Maintenance Engineering, 16(2), 156-180.
Das, D. (2001). Total predictive maintenance: A comprehensive tool for achieving
excellence in operational systems. Industrial Engineering Journal, 30(10), 15-23.
Davenport, T. H. (2007). Thinking for a living: How to get better performances and
results from knowledge workers. New York, NY: Harvard Business School Press.

270
Davies, A. (1998). Handbook of condition monitoring: Techniques and methodology.
London: Chapman & Hall.
De Groot, P. (1995). Maintenance performance analysis: A practical approach. Journal
of Quality in Maintenance Engineering, 1(2), 4-24.
De Jong, E. (1997). Maintenance practices in small to medium sized manufacturing
enterprises (SMEs). Monash University, Australia: National Key Centre for
Advanced Materials Technology.
De Ron, A. J., & Rooda, J. E. (2005). Equipment effectiveness: OEE revisited. IEEE
Transactions on Semiconductor Manufacturing, 18(1), 190-196.
De Ron, A. J., & Rooda, J. E. (2006). OEE and equipment effectiveness: An evaluation.
International Journal of Production Research, 44(23), 4987-5003.
Dekker, R., & Scarf, P. A. (1998). On the impact of optimization models in maintenance
decision making: The state of the art. Reliability Engineering and System Safety,
60(2), 111-119.
Dekker, R., Wildeman, R. E., & van der Duyn Schouten, F. A. (1997). Review of multi-
component models with economic dependence. Zor/Mathematical Methods of
Operations Research, 45, 411-435.
Dekker, R. (1996). Applications of maintenance optimization models: A review and
analysis. Reliability Engineering and System Safety, 51, 229-240.
Delzell, J., & Pithan, J. (1996). RCM process yields surprising results. Power
Engineering, 100(11).
Denzin, N. (2006). Sociological methods: A sourcebook (5th ed.). NY: McGraw-Hill.
ISBN 9780-202308401.
DFAT (2011). Retrieved January 31, 2012, from http://www.dfat.gov.au/geo/fs/
mlay.pdf
DiStefanso, R. S. (2005). Elevating maintenance and reliability practices – The
financial business case, 1-13. Soutbury, CT: Management Resources Group Inc.
Dixon, J. R., Nanni, A. J., Jr., & Vollmann, T. E. (1990). The new performance
challenge: Measuring operations for world-class competition. Homewood, IL:
Business One Irwin.
Dossenbach, T. (2006). Implementing total productive maintenance: A successful TPM
program will help you eliminate defects, machine breakdowns and accidents.
Wood and Wood Products, 111(2), 29-32.
Doyle, P. (1994). Setting business objectives and measuring performance. Journal of
General Management, Winter, 20(2), 1-19.
Dunn, S. (2009). Retrieved July 13, 2011, from http://www.plantmaintenance.com/
articles/outsourcing_crit_issues.pdf
Drucker, P. F. (1954). The Practice of Management. New York: HarperCollins, pp. 62-
63.
Drucker, P. (1977). An introductory view of management. New York, NY: Harper
College Press.
Drucker, P. F. (1992). Managing for the Future. Oxford: Butterworth-Heinemann, p.
299.
Drucker, P. F., (1994). The theory of business, Harvard Business Review, September-
October.

271
Drucker, P. F., Collins, J., Kotler, P., Kouzes, J., Rodin, J., Rangan, V. K., et al.
(2008). The five most important questions you will ever ask about your
organization, p. xix. Retrieved July 13, 2011, from http://info.emeraldinsight.com/
drucker/index.htm
Drury, H. B. (1915). Scientific management: A history and criticism. New York, NY:
Columbia University.
DuBrin, A. J. (2007). Human relations interpersonal job-oriented skills (9th ed.). New
Jersey: Pearson Prentice Hall.
Dwight, R. (1999). Searching for real maintenance performance measures. Journal of
Quality in Maintenance Engineering, 5(3), 258-275.
Dwyer, J. (1999). More than a maintenance technique. Works Management, 52(9), 15-
16.
Eisenberger, M.-L. (2008). Goethe-Institute e. V., Online Editorial Team. Retrieved
August 27, 2011, retrievable from: http://www.goethe.de/ins/de/enindex.htm/
online-redaktion
Embleton, P. R., & Wright, P. C. (1998). A practical guide to successful outsourcing.
Empowerment in Organizations, 6(3), 94-106.
Erdos, P. L., & Morgan, A. J. (1983). Professional mail surveys. Melbourne, FL:
Krieger Publishing Co.
Erl, T. (2006). Service-oriented architecture: concepts, technologies, and design. Upper
Saddle River, NJ: Pearson Education.
Eti, M. C., Ogaji, S. O. T., & Probert, S. D. (2004). Implementing total productive
maintenance in Nigerian manufacturing industries. Applied Energy, 79, 385-401.
EUREPGAP (n.d.). Retrieved July 13, 2011, from http://www.eurep.org
Evans, M. (2008). MRO spares optimization. Kuala Lumpur: Marcus Evans Malaysia.
FAO (2002). Small scale palm oil processing in Africa. FAO Agricultural Services
Bulletin, 148, 1-56.
Ferdows, K., & DeMeyer, A. (1990). Lasting improvements in manufacturing
performance: In search of a new theory. Journal of Operations Management, 9(2),
168-184.
Feurer, R., & Chaharbaghi, K. (1995). Performance measurement in strategic change.
Benchmarking for Quality, Management, and Technology, 2(2), 64-83.
Filippini, R. (1997). Operations management research: Some reflections on evolution,
models and empirical studies, International Journal of Operations and Production
Management, 17(7), 655-670.
Finlow-Bates, T., Visser, B., & Finlow-Bates, C. (2002). An integrated approach to
problem solving: linking K-T, TQM and RCA to TPM. The TQM Magazine,
12(4), 284-289.
Finpro (2001). Bio Asia II, loppuraportti, Thaimaa ja Malesia. Retrieved July 13, 2011,
from http://www.doria.fi/bitstream/handle/10024/45293/isbn9789522147585.pdf?
sequence=1
Fitzgerald, L., Johnston, R., Brignall, T. J., Silvestro, R., & Voss, C. (1991).
Performance measurement in service businesses. London: The Chartered Institute
of Management Accountants.
Fitzgerald, L., & Moon, P. (1996). Performance measurement in service industries:
Making it work. London: The Chartered Institute of Management Accountants.

272
Fleming, S. A. (2006). FAA’s proposed plan for implementing a reliability centered
maintenance process for air traffic control equipment: GAO-07-81R. GAO
Reports, 1-16.
Flynn, B. B., Sakakibara, S., Schroeder, R. G., Bates, K. A., & Flynn, E. J. (1990).
Empirical research methods in operations management. Journal of Operations
Management, 9(2), 250-284.
Flynn, B. B., Schroeder, R. G., & Sakakibara, S. (1994). A framework for quality
management research and an associated measurement instrument. Journal of
Operations Management, 11(4), 339-366.
Frazier, P. A., Tix, A. P., & Barron, K. E. (2004). Testing moderator and mediator
effects in counseling psychology research. Journal of Counseling Psychology, 51,
115-134.
FRBD (2011). Federal Reserve Bank of Dallas, Public Affairs Department, Retrieved
July 13, 2011, from http://www.dallasfed.org/
Friedman, V. (2008). Data visualization and info-graphics in: Graphics. Monday
Inspiration, January 14.
Friendly, M. (2008). Milestones in the history of thematic cartography, statistical
graphics, and data visualization. Retrieved July 13, 2011, from http://www.
datavis.ca/gallery/
Fry, T. D., & Cox, J. F. (1989). Manufacturing performance: Local versus global
measures. Production and Inventory Management Journal, 2nd Quarter, 52-56.
Galloway, D., & Waldron, D. (1989, a). Throughput accounting part 3 – A better way to
control labour costs. Management Accounting, 32-41.
Galloway, D., & Waldron, D. (1988, b). Throughput accounting part 1 – The need for a
new language for manufacturing. Management Accounting, 34-35.
Gardiner, S. C., & Blackstone, J. H., Jr. (1994). The evolution of the theory of
constraints. Industrial Management, May/June, 13-16.
Garg, A., & Deshmukh, S. G. (2006). Maintenance management: Literature review and
directions. Journal of Quality in Maintenance Engineering, 12(3), 205-238.
Gasperz, V. (2003). Sistem Manajemen Kinerja Terintegrasi: Balanced Scorecard
dengan Six Sigma untuk Organisasi Bisnis dan Pemerintah. Jakarta: PT Gramedia
Pustaka Utama.
Geanuracos, J., & Meiklejohn, I. (1993). Performance measurement: The new agenda.
London: Business Intelligence.
Geraerds, W. M. S. (1992). The EUT maintenance model. International Journal of
Production Economics, 24, 209-216.
Gershon, R. (2001). Telecommunications management: Industry structures and
planning strategies. Mahwah, NJ, USA: Lawrence Erlbaum Associates.
Gertsbakh, I. B. (1997). Models of preventive maintenance. North Holland, Amsterdam.
Retrieved July 13, 2011, from http://ieeexplore.ieee.org/xpl/freeabs_all.jsp?
arnumber=5970578
Ghalayini, A. M., & Noble, J. S. (1996). The changing basis of performance
measurement. International Journal of Operations and Production Management,
16(8), 63-80.
Gits, C. W. (1986). On the maintenance concepts for technical system: II. Literature
review. Maintenance Management International, 6, 96-181.
273
Gits, C. (1991). Maintenance concept and control, in maintenance and logistics:
Towards integrated control (in Dutch). Samson/Nive: Eindhoven University of
Technology, 181-215.
Gits, C. (1992). Design of maintenance concepts. International Journal of Production
Economics, 24(3), 217-226.
Goldratt, E. M., & Cox, J. (1986). The goal: Beating the competition. Hounslow:
Creative Output Books.
Goldratt, E. M., & Cox, J. (1984). The Goal. Croton-on-Hudson, NY: North River Press.
Gomes, C. F., Yasin, M. M., & Lisboa, J. V. (2006). Performance measurement
practices in manufacturing firms: An empirical investigation. Journal of
Manufacturing Technology Management, 17(2), 144-167.
Gosavi, A. (2006). A risk-sensitive approach to total productive
maintenance. Automatica, 42(8), 1321-1330.
Gotoh, F. (1991). Equipment planning for TPM. Portland, OR: Productivity Press Inc.
Gupta, D., Gunalay, Y., & Srinivasan, M. M. (2001a). The relationship between
preventive maintenance and manufacturing system performance. European
Journal of Operational Research, 132(1), 146-162.
Gupta, R. C., Sonwalker, J., & Chitale, A. K. (2001b). Overall equipment effectiveness
through total productive maintenance. Prestige Journal of Management and
Research, 5(1), 61-72.
Hall, R. W. (1983). Zero inventories. Homewood, IL: Dow-Jones Irwin.
Haller, H. S. (1993). Managing with profound knowledge: A management process based
on the Deming management theory. Cleveland, OH: Harold S. Haller &
Company.
Handfield, R. B., & Melnyk, S. A. (1998). The scientific theory-building process: A
primer using the case of TQM. Journal of Operations Management, 16(4), 321-339.
Hansen, R. C. (2001). Overall equipment effectiveness – A powerful tool for increased
profits. New York, NY: Industrial Press Inc.
Hansson, J., Backlund, F., & Lycke, L. (2003). Managing commitment: Increasing the
odds for successful implementation of TQM, TPM or RCM. International Journal
of Quality and Reliability Management, 20(9), 993-1008.
Hammer, M., & Champy, J. (1993). Re-engineering the corporation: A manifesto for
business revolution. London: Nicholas Brealey.
Hammer, M., & Stanton, S. A. (1995). The Reengineering Revolution. New York:
Harper Business.
Hayes, R. H., & Wheelwright, S. C. (1979). Link manufacturing process and the product
life cycle. Harvard Business Review, 57(1), 133-140.
Hayes, R. H., & Abernathy, W. J. (1980). Managing our way to economic
decline. Harvard Business Review, 62, 67-101.
Helms, M. M. (1996). Perspectives on quality and productivity for competitive
advantage. The TQM Magazine, 8(3), 5-10.
Hipkin, I. B., & Cock, C. D. (2000). TQM and BPR: Lessons for maintenance
management. Omega – The International Journal of Management Science, 28(3),
277-292.
Hiromoto, T. (1988). Another hidden edge: Japanese management accounting. Harvard
Business Review, 22-26.
274
Ho, C. T. (2007). Performance measurement using data envelopment analysis and
financial statement analysis. International Journal of Operational Research, 2(1),
26-38.
Ho, C. T., & Zhu, D. S. (2004). Performance measurement of Taiwan’s commercial
banks. International Journal of Productivity and Performance Management,
53(5), 425-433.
Holden, P. E., Fish, L. S., & Smith, H. L. (1941). Top management organization and
control: A research study of the management policies and practices of thirty
leading industrial corporations. California/London: Stanford University Press.
Holger, I. (2003). Customized operation and maintenance for fossil power plants.
Germany: Siemens AG, Power Generation.
Holmberg, K. (2001). Competitive reliability 1996-2000, Technology Programme
Report 5/2001, Final Report. Helsinki: National Technology Agency.
Holmgren, M. (2005). Maintenance-related losses at the Swedish Rail. Journal of
Quality in Maintenance Engineering, 11(1), 5-18.
Hopwood, A. G. (1984). Accounting and human behaviour. Englewood Cliffs, NJ:
Prentice-Hall.
Hum, S. H., & Leow, L. H. (1996). Strategic manufacturing effectiveness: An empirical
study based on the Hayes-Wheelwright framework. International Journal of
Operations and Production Management, 16(4), 4-18.
Hummels D., Ishii J., & Yi, K. (2001). The nature and growth of vertical specialization
in world trade. Journal of International Economics, 54(1), 75-96.
IBM Consulting and London Business School (1993). Made in Britain - the true state of
Britain’s manufacturing industry. London: IBM Consulting and London Business
School.
IBM Consulting and London Business School (1994). Made in Europe - a Four Nations
Best Practice Study. London: IBM Consulting and London Business School.
Idris, Z. (2003). Effluent related fee in the palm oil industry of Malaysia. Document
submitted to ESCAP Virtual Conference. Available at: http://www.unescap.org/
drpad/vc/conference/ bg_my_14_erf.htm
IEC (2004). 60300 (3-14): Dependability management – Part 3-14: Application guide –
Maintenance and maintenance support. Geneva: International Electro-technical
Commission.
IEC (2006). Application guide – Maintenance and maintenance support. Geneva:
International Electro-technical Commission.
Igwe, J. C., & Onyegbado, C. C. (2007). A review of palm oil mill effluent water
treatment. Global Journal of Environmental Research, 1(2), 54-62.
IPM (1992). Performance management in the UK – An analysis of the issues. London:
IPS/IMS.
Ireland, F., & Dale, B.G. (2001). A study of total productive maintenance
implementation. Journal of Quality in Maintenance Engineering, 7(3), 183-191.
ISO/IEC (2008). 15288: Systems and software engineering – System life cycle
processes. Geneva: International Organization for Standardization and
International Electro-Technical Commission.
ISO (2009). Retrieved July 13, 2011, from http://www.iso.org/iso/pressrelease.htm?
refid=Ref1263
275
Ismail, A. R., Ismail, R., Zulkifli, R., Makhtar, N. K., & Deros, B. M. (2009). A study
on implementation of preventive maintenance programme at Malaysia palm oil
mill. European Journal of Scientific Research, 29(1), 126-135.
Ismail, M., & Rossi, A. (2010). A compilation of bio-energy sustainability initiatives.
Rome: Food and Agriculture Organization of the UN (FAO).
Jambekar, A. B. (2000). A systems thinking perspective of maintenance, operations, and
process quality. Journal of Quality in Maintenance Engineering, 6(2), 123-132.
Jantan, M., Nasurdin, A. M., Ramayah, T., & Ghazali, A. S. (2003). Total Productive
Maintenance and organizational performance: A preliminary study. Jurnal
Ekonomi dan Bisnis, 2(3), 337-356.
Jardine, A. K. S., & Buzacott, J. A. (1985). Equipment reliability and maintenance.
European Journal of Operations Research, 19, 96-285.
Jardine, A., Fan, Z., & Hong, Y. (1996). Enhancing system reliability through
maintenance decision making systems. IEEE International Conference
Proceedings, Journal of Quality in Maintenance Engineering, 12(2), 133 – 149.
Johnson, H. T. (1975). Management accounting in an early integrated industrial: E. I. du
Pont de Nemours Powder Company, 1903-1912. Business History Review,
XLIV(2, Summer), 184-204.
Johnson, H. T. (1981). Towards an understanding of nineteenth century cost accounting.
The Accounting Review, LVI(3, Winter), 510-518.
Johnson, H. T. (1972). Early cost accounting for internal management control: Lyman
Mills in the 1850s. Business History Review, XLVI(4, Winter), 466-474.
Johnson, H. T., & Kaplan, R. S. (1987). Relevance lost: The rise and fall of management
accounting. Boston, MA: Harvard Business School Press.
Johnson, H. T. (1978). Management accounting in an early multidivisional organization:
General Motors in the 1920s. Business History Review, LII(4, July), 490-517.
Johnson, H. T. (1992). Relevance regained. New York, NY: The Free Press.
Johnston, R., & Pongatichat, P. (2008). Managing the tension between performance
measurement and strategy: Coping strategies. International Journal of Operations
and Production Management, 28(10), 941-967.
Jonsson, P., & Lesshammar, M. (1999). Evaluation and improvement of manufacturing
performance measurement systems – The role of OEE. International Journal of
Operations and Production Management, 19(1), 55-78.
Judenberg, J. (1994). Applications maintenance outsourcing an alternative to total
outsourcing. Journal of Information Systems Management, 11(Fall), 34-38.
Juric, Z., Sanchez, A. I., & Goti, A. (2006). Money-based overall equipment
effectiveness. Hydrocarbon Processing, (International edition), 85(5), 43-45.
Kaplan, R. S. (1983). Measuring manufacturing performance: A new challenge for
managerial accounting research. Accounting Review, 58(4), 686-703.
Kaplan, R. S. (1984). The evolution of management accounting. The Accounting
Review, 59(3), 390-418.
Kaplan, R. S. (1984). Yesterday’s accounting undermines production. Harvard Business
Review, 62, 95-101.
Kaplan, R. S., & Norton, D. P. (1992). The balanced scorecard – Measures that drive
performance. Harvard Business Review, 70(1), 71-79.
276
Kaplan, R. S. (1986). Accounting lag: The obsolescence of cost accounting systems.
California Management Review, 18(2), 174-199.
Karlsson, V. (2005). An overall view of maintenance. European Railway Review, 11(3),
11-17.
Katsicas, S. K. (2009). Computer and Information Security Handbook. Amsterdam, NL:
Morgan Kaufmann Publications Elsevier Inc.
Keegan, D. P., Eiler, R. G., & Jones, C. R. (1989). Are your performance measures
obsolete? Management Accounting USA, 45-50.
Keh, H. T., Chu, S., & Xu, J. (2006). Efficiency, effectiveness, and productivity of
marketing in services. European Journal of Operational Research, 170(1), 265-
276.
Kelly, J. (1982). Scientific management, job redesign, and work performance. New
York, NY: Academic Press.
Kennerley, M., & Neely, A. (2002). A framework of the factors affecting the evolution
of performance measurement systems. International Journal of Operations and
Production Management, 22(11), 1222-1245.
Kennerly, M., & Neely, A. (2003). Measuring performance in a changing business
environment. International Journal of Operation and Production Management,
23(2), 213-229.
Killichi, M. (2006). Operational flexibility for steam turbines based on service contracts
with diagnostics tools, Power Gen Europe 2006 Cologne, Ref. 306. Germany:
Siemens Power Generation.
Kim, W. C., & Mauborgne, R. (1997). Fair process: Managing in knowledge economy.
Harvard Business Review, 75(4), 65-75.
Koelsch, J. R. (1993). A dose of TPM: Downtime needn’t be a bitter pill. Manufacturing
Engineering, 72 (2), 63-66.
Kraemer, H. C., Stice, E., Kazdin, A., Offord, D., & Kupfer, D. (2001). How do risk
factors work together? Moderators, mediators, independent, overlapping, and
proxy risk factors. American Journal of Psychiatry, 158, 848-856.
Krishnamurthy P. (2008). CDM in the oil palm sector. Retrieved December 29, 2011,
from http://www.kyotoenergy.net/content.php?langue=english&cle_menus
Kumar, M., Antony, J., Singh, R. K., Tiwari, M. K., & Perry, D. (2006). Implementing
the Lean Sigma framework in an Indian SME: A case study. Production Planning
and Control, 17(4), 407-423.
Kutucuoglu, K., Hamali, J., Irani, Z., & Sharp, J. (2001). A framework for managing
maintenance using performance measurement systems. International Journal of
Operations and Production Management, 21(1/2), 173-194.
Kutucuoglu, K. Y., Hamali, J., & Sharp, J. M. (2002). Enabling BPR in maintenance
through a performance measurement system framework. The International
Journal of Flexible Manufacturing Systems, 14(1), 33-52.
Kuwaiti, M. E. (2004). Performance measurement process: Definition and ownership.
International Journal of Operations and Production Management, 24(1), 55-78.
Kyoto Energy (2008). CDM opportunities in the palm oil industry. Retrieved April 11,
2011, from http://www.kyotoenergy.net/cdm%20palm%20oil%20industry.html
277
Lane, F. (2006). IDC: World created 161 billion gigs of data in 2006. Retrieved
December 20, 2011, from http://business.newsfactor.com/story.xhtml?story_id=
013000F26JUS
Laine, T., Ojala, M., & Paranko, J. (2004). Expanding forward in the value chain?
Earnings logics of service products. Paper presented at the 13th International
Working Seminar on Production Economics, IGLS, Austria.
Lawrence, J. J. (1999). Use of mathematical modelling to give your TPM
implementation effort an extra boost. Journal of Quality in Maintenance
Engineering, 5(1), 62-69.
Lee, W.-R., Beruvides, M. G., & Chiu, Y. D. (2007). A study on the quality-
productivity relationship and its verification in manufacturing industries,
Engineering Economist. Retrieved August 16, 2011, from http://findarticles.com/
p/articles/mi_6713/is_2_52/ai_n29359095/pg_6/
Lenzerini, M., (2002). Data integration: A theoretical perspective. PODS, 233-246.
Lingle, J. H., & Schiemann, W. A. (1996). From balanced scorecard to strategy gauge:
Is measurement worth it? Management Review, (March), 56-62.
Liyanage, J. P., & Kumar, U. (2000). Measuring maintenance process performance
using the balanced scorecard. Proceedings of 15th European Maintenance
Conference (Euromaintenance 2000), Gothenburg, March 7-9, 25-32.
Liyanage, J. P., & Kumar, U. (2003). Towards a value-based view on operations and
maintenance performance management. Journal of Quality in Maintenance
Engineering, 9(4), 333-350.
Ljungberg, O. (1998). Measurement of overall equipment effectiveness as a basis for
TPM activities. International Journal of Operations and Production Management,
18(5), 495-507.
Lonsdale, C., & Cox, A. (1998). Outsourcing: A business guide to risk management
tools and technique. Boston, USA: Earlsgate Press.
Luce, S. (1999). Choice criteria in conditional preventive maintenance: Short paper.
Mechanical Systems and Signal Processing, 13(1), 163-168.
Luxhoj, J. T., Riis, J. O., & Thorsteinsson, U. (1997). Trends and perspectives in
industrial maintenance management. Journal of Manufacturing Systems, 16(6),
437-453.
Lyly-Yrjänäinen, J., Lahikainen, T., & Paranko, J. (2004). Cost effect of component
commonality: Pros and cons of an innovation. Paper presented at the Thirteenth
International Working Seminar on Production Economics, Congress Igls,
Igls/Innsbruck.
Lynch, R. L., & Cross, K. F. (1991). Measure up – The essential guide to measuring
business performance. London: Mandarin.
MACC (2010, 2011). Malaysian Anti-Corruption Commission: Annual reports.
Retrieved April 11, 2012, from http://www.sprm.gov.my/
Madu, C. N. (2000). Competing through maintenance strategies. International Journal
of Quality and Reliability Maintenance, 17(9), 937-948.
Maggard, B. N., & Rhyne, D. M. (1992). Total productive maintenance: A timely
integration of production and maintenance. Production and Inventory
Management Journal, 33(4), 6-10.
278
Malhotra, M. K., & Grover, V. (1998). An assessment of survey research in POM: From
constructs to theory. Journal of Operations Management, 16, 407-425.
Markeset, T., & Kumar, U. (2004). Dimensioning of product support: Issues, challenges,
and opportunities. Paper presented at the Reliability and Maintainability – RAMS
Symposium.
Mather, D. (2008). Asset resource planning. New York, NY: Industrial Press Inc.
Mayo, E. (1933 & 2001). The human problems of an industrial civilization: Early
sociology of management and organizations. Vancouver, BC, Canada: Routledge.
McCutcheon, D. M., & Meredith, J. R. (1993). Conducting case study research in
operations management. Journal of Operations Management, 11(3), 239-256.
McKone, K., & Wiess, E. (1998). TPM: Planned and autonomous maintenance:
Bridging the gap between practice and research. Production and Operations
Management, 7(4), 335-351.
McKone, K. E., Roger, G. S., & Kristy, O. C. (1999). Total productive maintenance: A
contextual view. Journal of Operations Management, 17(2), 123-144.
McKone, K. E., Schroeder, R. G., & Cua, K. O. (2001). The impact of total productive
maintenance practices on manufacturing performance. Journal of Operations
Management, 19(1), 39-58.
Meredith, J. R., Raturi, A., Amoako-Gyampaeh, K., & Kaplan, B. (1989). Alternative
research paradigms in operations. Journal of Operations Management, 8(4), 297-
326.
Meyer, M. W., & Gupta, V. (1994). The performance paradox. In B. M. Straw, & L. L.
Cummings (Eds.), Research in organizational behaviour. Greenwich, CT: JAL
Press.
MIDA (2011). Investment profile Malaysia, prepared under the auspices of the
Malaysian Investment Development Authority. Retrieved December 31, 2011,
from www.mida.gov.my
MIER (2009, 2010, 2011). Malaysian Institute of Economic Research (MIER) –
Outlook for 2012. Retrieved December 31, 2011, from http://www.mier.org.my/
outlook/
Miller, J. G., & Vollmann, T. E. (1985). The hidden factory. Harvard Business Review,
September/October, 142-150.
MIM (2009). Malaysian Institute of Management. Retrieved April 11, 2011, from http://
www.mim.org.my/
Mintzberg, H. (1978). Patterns in strategy formulation. Management Science, 24(9),
934-948.
Mishra, P. R., Anand, D., & Kodali, R. (2006). Development of a framework for world-
class maintenance systems. Journal of Advanced Manufacturing Systems, 5(2),
141-165.
Mishra, R. P., Anand, G., & Kodali, R. (2007). An AHP model for quantification of
benefits of world-class maintenance systems. International Journal of Industrial
and Systems Engineering, 2(2), 166-194.
Mobley, K. R. (2011). Business Excellence and Reliability, Life Cycle Engineering in
Charleston, S. C. E. Retrieved December 19, 2011, from http://www.lce.com/
R_Keith_Mobleys_Introduction_to_Reflections_on_Excellence_383-item.html
279
Monden, Y. (1993). Toyota production system: An integrated approach to just-in-time.
Norcross, GA: Industrial Engineering and Management Press.
Mongana Report (1955). MONGANA Report, Volume 1 and 2: Coopérative des
Producteurs et exportateurs de l’huile de palme du Congo Belge.
Moubray, J. (1991). Reliability centered maintenance. Oxford: Butterworth and
Heinemann.
Moubray, J. (2000). FLM to select suitable maintenance strategy in process industries
using MISO model. Journal of Quality in Maintenance Engineering, 11(4), 359-
374
Moubray, J. (2003). 21st century maintenance organization: Part I – The asset
management model, Maintenance Technology. Barrington, IL: Applied
Technology Publications.
Mouzas, S. (2006). Efficiency versus effectiveness in business networks. Journal of
Business Research, 59(10/11), 1124-1132.
MPOA (2011). Retrieved December 31, 2011, from http://www.mpoa.org.my/v2/index.
php
MPOB (2004b). Palm Oil Update. January 2004. 24. MPOB, Bangi, 63 pp. Retrieved
from: http://mpob.gov.my/en/component/content/article/114/404-group-members
MPOB (2005). Retrieved July 13, 2011, from http://www.mpob.org.my
Malaysia Palm Oil Council (MPOC) (2007a). Sustainable palm oil – for profit, people
and the planet. Retrieved July 13, 2011, from http://www.malaysiapalmoil.org/
life/practices.asp.
MPOB (2008). Review of the Malaysian palm oil industry. MPOB, Bangi. Retrieved
July 13, 2011, from http://mpob.gov.my/en/component/content/article/114/404-
group-members
MPOB (2008, 2009, 2010). Retrieved July 13, 2011, from http://www.mpob.org.my
Malaysian Palm Oil Council (MPOC) (2010). The palm oil. Retrieved July 13, 2011,
from http://www.mpoc.org.my/main_palmoil_01.asp.
Murray, M., Fletcher, K., Kennedy, J., Kohler, P., Chambers, J., & Ledwidge, T. (1996).
Capability assurance: A generic model of maintenance. Proceedings of 2nd
International Conference of Maintenance Societies, Melbourne, Australia 1-5.
Nakajima, S. (1988). Introduction to total productive maintenance (TPM). Cambridge,
MA: Productivity Press.
Nakajima, S. (1989). TPM development program: Implementing total productive
maintenance. Portland, OR: Productivity Press.
Neely, A., & Austin, R. (2002). Measuring performance: the operations perspective. In
A. Neely (Ed.), Business performance measurement. Cambridge: Cambridge
University Press.
Neely, A., Gregory, M., & Plats, K. (1995). Realizing strategy through measurement.
International Journal of Operations and Production Management, 14(3), 140-153.
Neely, A., Adams, C., & Crowe, P. (2001). The performance prism in practice.
Measuring Business Excellence, 5(2), 6-11.
Neely, A., Adams, C., & Kennerley, M. (2002). The performance prism. Englewood
Cliffs, NJ: Prentice-Hall.

280
Neely, A. D., Mills, J., Platts, K. Gregory, M., & Richards, H. (1994). Realising strategy
through measurement. International Journal of Operations and Production
Management, 14(3), 140-152.
Neely, A. D. (1998). Measuring business performance: Why, what and how. London:
The Economist Books.
Neely, A. D., Mills, J. F., Gregory, M. J., Richards, A. H., Platts, K. W., & Bourne, M.
C. S. (1996). Getting the measure of your business. London: Findlay.
Neste Oil (2008). NExBTL diesel, raw materials. Retrieved August 16, 2011, from
http://www.nesteoil.com/
Niebel, B. (1985). Engineering maintenance management. New York, NY: Marcel
Dekker.
Nikander, S. (2008). Greenhouse gas and energy intensity of product chain: Case
transport fuel. Unpublished Master thesis. Helsinki University of Technology,
Finland.
Noon, M., Jenkins, S., & Lucio, M. M. (2000). FADS, techniques and control: The
competing agendas of TPM and Tecax at the Royal Mail (UK). Journal of
Management Studies, 37(4), 499-519.
O’Donoghue, T., & Punch K. (2003). Qualitative educational research in action: Doing
and reflecting. Vancouver, BC, Canada: Routledge, p.78.
O’Leary, Z. (2004). The essential guide to doing research. Thousand Oaks, CA: SAGA
Publications Limited.
Oh, E. (2004). Sustainable palm oil production. The Star Online, Bizweek (November
20, 2004), 1-4.
Oke, S.A. (2005). An analytical model for the optimisation of maintenance profitability.
International Journal of Productivity and Performance Management, 54(2), 113-
136.
Ollila, A., & Malmipuro, M. (1999). Maintenance has a role in quality. The TQM
Magazine, 11(1), 17-21.
Olve, N., Roy, J., & Wetter, M. (1999). Performance drivers: A practical guide to using
the balanced scorecard. UK: John Wiley and Sons.
OPIEJ (2002). Oil Palm Industry Economic Journal, 2(2).
Otley, D. (1998). Performance management, a framework for management accounting
research. Management Accounting Research Group Conference, Aston,
Birmingham, September.
Ozcan, Y. A. (2008). Health care benchmarking and performance evaluation: An
assessment using data envelopment analysis (DEA). New York, NY: Springer
Science+ Business Media.
Palm Oil Industrial Cluster (POIC) (2008). Malaysian palm oil biodiesel export market.
Retrieved February 22, 2011, from http://www.etawau.com.
Panapanaan, P., Helin, T., Kujanpää, M., Soukka, R., Heinimö, J., & Linnanen, L.
(2009). Sustainability of palm oil production and opportunities for Finnish
technology and know-how transfer, Research Report 1. Lappeenranta, Finland:
LUT Energy, Lappeenranta University of Technology.
Patterson, J. W., Kennedy, W. J., & Fredendall, L. D. (1995). Total productive
maintenance is not for this company. Production and Inventory Management
Journal, 36(2), 61-64.
281
Patterson, J. W., Fredendall, D. L., Kennedy, W. J., & McGee, A. (1996). Adapting total
productive maintenance to Asten, Inc. Production and Inventory Management
Journal, 37(4), 32-37.
Pearson, G. J. (1985). The strategic discount, John Wiley and Sons. The Theory of the
Business. Harvard Business Review, September-October, 119-128.
Pintelon, L., & Gelders, L. (1992). Maintenance management decision making.
European Journal of Operational Research, 58, 301-317.
Pintelon, L., & Puyvelde, F. V. (1997). Maintenance performance reporting systems:
Some experiences. Journal of Quality in Maintenance Engineering, 3(1), 4-15.
Pintelon, L., Gelders, L., & VanPuyvelde, F. (2000). Maintenance management.
Leuven: Uitgeverij Acco.
Pintelon, L., Pinjala, S. K., Vereecke, A. (2006). Evaluating the effectiveness of
maintenance strategies. Journal of Quality in Maintenance Engineering, 12(1), 7-
20.
Poku, K. (2002). Small-scale palm oil processing in Africa, FAO Agriculture Services
Bulletin 148. Retrieved May 1, 2011, from http://www.fao.org/docrep/005/
Y4355E/y4355e00.htm
Post, F. H., Nielson, G. N., & Bonneau, G. P. (2002). Data visualization: The state of
the art. Proceedings of the 4th Dagstuhl Seminar on Scientific Visualization,
Research paper TU delft, 2002.
Potter, C. (2006). Psychology and the art of program evaluation. South African Journal
of Psychology, 36(1), 82-102.
Pride, D. (2006). Oil palm land schemes alleviating rural poverty, Palm Oil Truth
Foundation. Retrieved March 18, 2011, from http://www.palmoiltruthfoundation
.com
Pramod, V. R., Devadasan, S. R., & Jagathy Raj, V. P. (2007). Receptivity analysis of
TPM among internal customers. International Journal of Technology, Policy, and
Management, 7(1), 75-88.
Quinn, J. B., & Hilmer, F. G. (1994). Strategic outsourcing. Sloan Management Review,
35, 43-55.
Rao, T. (2006). Successful CDM projects in Malaysia. Kuala Lumpur, Malaysia: Danish
Management Group.
Ramachandran, H. (2005). Biodiesel set to ignite palm oil’s prospects press release for
business times. Malaysia: National Economic Action Council.
Raouf, A. (1994). Improving capital productivity through maintenance. International
Journal of Operations and Production Management, 14(7), 44-52.
Ravishankar, G., Burczak, C., & Vore, R. D. (1992). Competitive manufacturing
through total productive maintenance, Semiconductor Manufacturing Science
Symposium (ISMSS 1992), IEEE/SEMI International, 15-16 June, 85-89.
Reed, R., & DeFillippi, R. J. (1990). Causal ambiguity, barriers to imitation, and
sustainable competitive advantage. Academy of Management Review, 15(1), 88-
102.
Rhyne, D. M. (1990). Total plant performance advantages through total productive
maintenance. Journal of Applied Sciences, 5(5), 938-951, 2005.
Richardson, P. R., & Gordon, J. R. M. (1980). Measuring total manufacturing
performance. Sloan Management Review, Winter, 47-58.
282
Riis, J. T., & Thorsteinsson, U. (1997). A situational maintenance model. International
Journal of Quality and Reliability Management, 14(4), 349-366.
Ritzer, G. (2000). The McDonaldization of society (3rd ed.). Thousand Oaks, CA: Sage
Publications Inc.
Robinson, C. J., & Ginder, A. P. (1995). Implementing TPM: The North American
experience. Portland, OR: Productivity Inc.
Rossi, P. H., Lipsey, M. W., & Freeman, H. E. (2004). Evaluation: A systematic
approach (7th ed.). Thousand Oaks: Sage.
Round Table on Sustainable Palm Oil FACT SHEET (2012), pp. 3-4, retrieved from:
http://www.rspo.org/sites/default/files/RSPOFACTSHEETFINALRT91.pdf
Russell, C. (2001). Shovel maintenance gains from improved designs. Tools and
Techniques, 106(8), S7.
Sangameshwran, P., & Jagannathan, R. (2002). Eight pillars of TPM. Indian
Management, 11, 36-37.
Scarf, P. S. (1997). On the application of mathematical models to maintenance.
European Journal of Operations Research, 63, 493-506.
Schmenner, R. W. (1988). Escaping the black holes of cost accounting. Business
Horizons, January-February, 66-72.
Schmenner, R. W., & Swink, M. L. (1998). On theory in operations management.
Journal of Operations Management, 17(1), 97-113.
Schmidt, J. (2007). Life cycle assessment of rapeseed oil and palm oil. Unpublished
PhD dissertation, Ålborg University, Denmark.
Schönberger, L. (1986). World class manufacturing: The lessons of simplicity applied.
New York, NY: The Free Press.
Schuchardt, F., Darnoko, D., Herawan, T., Erwinsyah, & Gurintno, P. (2001). Use of
empty fruit bunch from oil palm for compost production and waste water drying.
Workshop on the Environment of Oil Palm, 19-20 June 2001. Medan, Indonesia.
Schuman, C. A., & Brent, A. C. (2005). Asset life cycle management: Towards
improving physical asset performance in the process industry. International
Journal of Operations and Production Management, 25(6), 566-579.
Scudder, G. D., & Hill, C. A. (1998) A review and classification of empirical research in
operations management. Journal of Operations Management 16, 91-101.
Seng, O. Y., Jantan, M., & Ramayah, T. (2005). Implementing total productive
maintenance (TPM) in Malaysian manufacturing organization: An operational
strategy study. The ICFAI Journal of Operations Management, IV(2), 53-62.
Seth, D., & Tripathi, D. (2005). Relationship between TQM and TPM implementation
factors and business performance of manufacturing industry in Indian context.
International Journal of Quality and Reliability Management, 22(2/3), 256-277.
Shamsuddin, A., Hassan, M. H., & Zahari, T. (2005). TPM can go beyond maintenance:
Excerpt from a case implementation. Journal of Quality in Maintenance
Engineering, 11(1), 19-42.
Shamsuddin, A., Hassan, M. H., & Zahari, T. (2004). State of implementation of TPM
in SMIs Malaysia. Journal of Quality in Maintenance Engineering, 10(2), 93-106.
Sharma, R. K., Kumar, D., & Kumar, P. (2005). FLM to select suitable maintenance
strategy in process industries using MISO model. Journal of Quality in
Maintenance Engineering, 11(4), 359-374.
283
Shirose, K. (1995). TPM team guide. Portland, OR: Productivity Press.
Sheu, C., & Krajewski, L. J. (1994). A decision model for corrective maintenance.
International Journal of Production Research, 32(6), 1365-1382.
Sheu, D. D. (2006). Overall input efficiency and total equipment efficiency. IEEE
Transactions on Semiconductor Manufacturing, 19(4), 496-501.
Shirkie, R., & Ji, S. C. (1983). Oil upon the waters: Palm oil wastes in Malaysia.
Ottawa, Canada: IDRC Publication.
Simeh, M. A., & Kamarudin, M. F. (2009). An overview of Malaysian palm oil market
share in selected markets. Oil Palm Industry Economic Journal, 9(1)/2009.
Sievänen, M., Suomala, P., & Paranko, J. (2001). Activity-based costing and product
profitability. Paper presented at the 5th International Seminar on Manufacturing
Accounting Research, Pisa, Italy.
Sivasothy, K., Basiron, Y., Anhar, S., Ramli, T., Tan, H., & Mohammad, S. (2006).
Continuous sterilization: The new paradigm for modernizing palm oil milling.
Journal of Oil Palm Research, (Special Issue - April 2006), 144-152.
Smith, G. (2006). Palm oil: Deforestation diesel, Wren Media and the New
Agriculturalist. Retrieved March 17, 2011, from http://www.new-ag.info/06-
6/focuson/focuson6.html.
Skinner, W. (1969). Manufacturing – missing link in corporate strategy. Harvard
Business Review, 47(3), 136-145.
Skinner, W. (1974). The decline, fall, and renewal of manufacturing. Industrial
Engineering, 32-38.
Slack, N., & Lewis, M. (2008). Operations strategy. Harlow: Pearson Education Ltd.
Slack, N., Chambers, S., Harland, C., Harrison, A., & Johnston, R. (1995). Operations
management. London: Pitman.
SME News (2010). Retrieved April 11, 2011, from http://www.malaysiasme.com.my/
index.php/SME-News
Söderholm, P., Holmgren, M., & Klefsjö, B. (2007). A process view of maintenance and
its stakeholders. Journal of Quality in Maintenance Engineering, 13(1), 19-32.
Sord, B. H., & Welsch, G. A. (1962). A survey of management planning and control
practices. New York, NY: Controllership Foundation.
Star (2011). Retrieved November 22, 2011 from http://biz.thestar.com.my/news/story
.asp?file=/2011/11/22/
Stevenson, W. (1996). Productions/Operations Management (5th ed.). Scarborough,
Canada: Irwin Publishing Company.
Suito, K. (1998). Total productivity management. Work Study, 47(4), 117-127.
Swamidass, P. M. (1991). Empirical science: New frontier in operations management
research. Academy of Management Review, 16(4), 793-814.
Swanson, L. (2001). Linking maintenance strategies to performance. International
Journal of Production Economics, 70(3), 237-244.
Swanson, L. (2003). An information-processing model of maintenance management.
International Journal of Production Economics, 83(1), 45-64.
Tan, K. T. (2007). Palm oil: Addressing issues and towards sustainable development,
Renew Sustain Energy Review. doi:10.1016/j.rser.2007.10.001.
284
Taneja, S., Pryor, M. G., & Toombs, L. A. (2011). Frederick W. Taylor’s scientific
management principles: Relevance and validity. Journal of Applied Management
and Entrepreneurship, 16(3), 60-78.
Taneja, S., Pryor, M. G., Humpheries, J. H., & Toombs, L. A. (2011). Where are the
new organization theories? Evolution, development and theoretical debate.
International Journal of Management, 28(3), 959-978.
Tajiri, M., & Gotoh, F. (1992). TPM implementation. New York, NY: McGraw-Hill.
Taud, R., & Scheidel M. (2004). Use and experience with gas turbine on-line
diagnostics. Barcelona, Spain: Power Gen Europe.
Taylor, F. W. (1903). Shop management. New York, NY: Harper & Brothers.
Taylor, F. W. (1911). The principles of scientific management. New York, NY: Harper
& Brothers.
Taylor, J. C., & Felten, D. F. (1993). Performance by design: Socio-technical systems in
North America. Englewood Cliffs, NJ: Prentice Hall.
Teoh, C. H. (2002). The palm oil industry in Malaysia – From seed to frying pan.
Selangor, Malaysia: WWF-Switzerland.
Teresko, J. (1992). Time bomb or profit center? Industry Week, 241(3), 52-57.
Tripathi, D. (2005). Influence of experience and collaboration on effectiveness of
quality management practices: The case of Indian manufacturing. International
Journal of Productivity and Performance Management, 54(1), 23-33.
Thomas, R. (2005). Reliability practices – Dofasco document. Ontario, Canada: Ivara
Corporation.
Timme, S. G., & Christine, T. (2003). The real cost of holding inventory. Supply Chain
Management Review, (July/August), 31-37.
Toomey, G. (2006). Harnessing the power of maintenance. Power Engineering, 110(3),
42-49.
Tsang, A. (1995). Condition-based maintenance: Tools and decision making. Journal of
Quality in Maintenance Engineering, 1(3), 3-17.
Tsang, H. C. A. (1998). A strategic approach to managing maintenance performance.
Journal of Quality in Maintenance Engineering, 4(2), 87-94.
Tsang, A. H. C., Jardine, A. K. S., & Kolodny, H. (1999). Measuring maintenance
performance: A holistic approach. International Journal of Operations and
Production Management, 19(7), 691-715.
Tsang, A. H. C., & Chan, P. K. (2000). TPM implementation in China: A case study.
International Journal of Quality and Reliability Management, 17(2), 144-157.
Tsang, H. C. A. (2002). Strategic dimensions of maintenance management. Journal of
Quality in Maintenance Engineering, 8(1), 7-39.
Tsarouhas, P. (2007). Implementation of total productive maintenance in food industry:
A case study. Journal of Quality in Maintenance Engineering, 13(1), 5-18.
Tsuchiya, S. (1992). Quality maintenance: Zero defects through equipment
management. Portland, OR: Productivity Press.
Turney, P. B. B., & Anderson, B. (1989). Accounting for continuous improvement.
Sloan Management Review, (Winter), 37-47.
USDOE/GO-102006-2267 (2006). Industrial Technologies Program Energy Efficiency
and Renewable Energy, U.S. Department of Energy Washington, DC 20585-0121.
Retrieved April 11, 2011, from www.eere.energy.gov/industry
285
United States Department of Agriculture (USDA) (2007). Commodity intelligence
report 2008. Retrieved April 11, 2011, from http://www.pecad.fas.usda.gov/
highlights/2007/12/Indonesia_palmoil/
United States Department of Agriculture (USDA) (2010). Indonesia: palm oil
production prospects continue to grow. Retrieved December 29, 2011, from
http://www.pecad.fas.usda.gov/highlights/2010/12/Indonesia_palmoil/
Valdez-Flores, C., & Feldman, R. M. (1989). A survey of preventive maintenance
models for stochastically deteriorating single unit systems. Naval Research
Logistics Quarterly, 36, 46-419.
Van Noortwijk, J. A., Dekker, R., Cook, R. M., & Mazucchi, T. A. (2002). On the use
of expert opinion for maintenance optimization, IEEE Transactions on Reliability,
41(1992), 427-432.
Venkatesh, J. (2006). An introduction to total productive maintenance. Malaysia Labour
Review 2009, 3(2), 47-62.
Vickery, S. K. (1991). A theory of production competence revisited. Decision Sciences,
22(3), 635-643.
Vindevogel, B., Dirk V. P., & Wets, G. (2005). Why promotion strategies based on
market basket analysis do not work? Expert Systems with Applications, 28(3),
583-590.
Vineyard, M., Amoako-Gyampah, K., & Meredith, J. (2000). An evaluation of
maintenance policies for flexible manufacturing systems: A case study.
International Journal of Operations and Production Management, 20(4), 409-426.
Wahid, M. B., Chan Kook Weng, C. K., & Masri, R. (2009). Palm oil: Nature’s gift to
Malaysia and Malaysia’s gift to the world oil palm industry, Economic Journal,
9(1)/2009.
Ward, P. (1997). Investing in tomorrow’s company, The Foundation for Performance
Measurement UK Meeting, 12 March, International Journal Business
Performance Management, 5(1), 1-24.
Waeyenbergh, G., & Pintelon, L. (2002). A framework for maintenance concept
development. International Journal of Production Economics, 77(3), 299-313.
Watson, K. J., Blackstone, J. H., & Gardiner, S. C. (2007). The evolution of a
management philosophy: The theory of constraints. Journal of Operations
Management, 25(2), 387-402.
Wan Asma, I., Mahanim, S., Zulkifli, H., Othman S., & Mori, Y. (2010). Malaysian Oil
Palm Biomass Regional Workshop on UNEP/DTIE/IETC, 2-5 March 2010, Osaka,
Japan. Retrieved April 2011, from http://gec.jp/gec/en/Activities/FY2009/ietc/
wab/wab_day2-3.pdf
Weber, A., & Thomas, R. (2005). Measuring and managing the maintenance function,
reliability practices Dofasco. Ontario, Canada: Ivara Corporation.
Westbrook, R. (1994). Priority management: a new theory for operations management.
International Journal of Operations and Production Management, 14(6), 4-24.
White-Paper (2010). Corporate Social Responsibility Report, Embassy of Norway in KL,
Malaysia. Retrieved June 3, 2011, from http://www.norway.org.my/News_and_
events/Business/Bedriftenes-Samfunnsansvar/
Willmott, P. (1994). Total quality with teeth. The TQM Magazine, 6(4), 48-50.
286
Williamson, R. M. (2001). TPM: An often misunderstood equipment improvement
strategy, Maintenance Technology Magazine. Retrieved June 20, 2011, from
http://www.mtonline.com/current/04-00tpm2.html
Wireman, T. (1990). World class maintenance management. New York, NY: Industrial
Press.
Wireman, T. (1991). Total productive maintenance: An American approach. New York,
NY: Industrial Press.
Wireman, T. (2003). Benchmarking best practices in maintenance management. New
York, NY: Industrial Press.
Wireman, T. (2004). Benchmarking best practices in maintenance management
Performance. New York, NY: Industrial Press.
Womack, J. P., Jones, D. T., & Roos, D. (1990). The machine that changed the world.
New York, NY: Rawson Associates.
Wouters, M., & Sportel, M. (2005). The role of existing measures in developing and
implementing performance measurement systems. International Journal of
Operations and Production Management, 25(11), 1062-1082.
Wren, D. A. (2004). The evolution of management thought (5th ed.). New York: John
Wiley and Sons.
Wu, H., Liu, Y., Ding, Y., & Liu, F. (2004). Methods to reduce direct maintenance cost
for commercial aircraft. Aircraft Engineering and Aerospace Technology, 76(1),
118.
Yam, R. C. M., Tse, P., Ling, L., & Fung, F. (2000). Enhancement of maintenance
management through benchmarking. Journal of Quality in Maintenance
Engineering, 6(4), 224-240.
Yamashina, H. (1995). Japanese manufacturing strategy and the role of total productive
maintenance. Journal of Quality in Maintenance Engineering, 1(1), 27-38.
Yang, Y., Liang, S., & Danyluk, S. (1999). Application of a specialized capacitance
probe in bearing diagnosis. Wear, 225(2), 1215-1221.
York C. (2003). Paper Presented at IMC-2003 the 18th International Maintenance
Conference, Netexpress Inc., York, PA. Retrieved on 28 August 2010 from http://
www.reliabilityweb.com/art04/zeiler.pdf
Yusoff, S., & Hansen, S. (2007). Feasibility study of performing a life cycle assessment
on crude palm oil production in Malaysia. International Journal of Life Cycle
Assessment 12(1), 50-58.

287
Appendix - A
SURVEY QUESTIONNAIRE for Malaysian palm oil mills (Part One)
Mill: Name, Address, Phone, Email: _______________________________________________________________________________________________
Contact Person’s Name, Position: _______________________________________________________________________________________________
Mill’s Capacity (FFB t/h) – Approved Capacity: _________ Installed Capacity: _______Year mill started: _________
Shift Structure: Days/week ___ Shifts/day ___ Hours/shift ____ Breaks/shift ___ Planned maintenance/shift ______
Maintenance Department Information - please put ‘X’ in the applicable box
Maintenance workforce fulltime: Skilled ___________Semi-skilled _________ Planner (in office) _____________
Maintenance strategy practiced at your mill (Legend in foot note): BDM PM TPM RCM CBM
EFB - Do you recycle your empty fruit bunches: Yes No Does your mill operates on single line or more: ___
Name mill equipment that is contracted out for preventive maintenance (PM): _____________________________
Name equipment that you have extra as ‘stand by’ for emergency use, such as turbine, boiler, Vibrating Screens, Separator, Press & Digester, etc: _______________________________________________________________________________________________
Part Two - Historical data collection: This part is to provide data on Maintenance Inputs for the ‘Financial Year
2010’ and will be utilized: To calculate overall equipment effectiveness (OEE) for the ‘Crude Palm Oil’ (CPO) overall
extraction process, for complete ‘Palm Oil Mill Sector; and assessment of POME disposal practices under
Department of Environment regulations.
Figures on Maintenance yearly Inputs (Cost in Ringgits), CPO Production (Tons), Equipment Downtime
(Hours), and Mill Effluent (POME) Generated & Treated (Tons) - Figures for the Financial Year 2010
# Input Category Description Figures for the Financial Year 2010
1 Labour - Maintenance Workforce only (cost in Ringgits)
2 Spares parts, Materials & Tools (cost in Ringgits)
3 Maintenance Work Contracted out (cost in Ringgits)
4 FFB Processed in the year 2010 (Tons)
5 CPO Produced in the year 2010 (Tons)
6 Out of spec CPO sold at Discount rate in 2010 (Tons)
7 Slush oil produced in the year 2010 (Tons)
8 Total Mill Hours Worked in the year 2010
9 Total Mill Down Time in hours in the year 2010
10 Mill Effluent (POME) produced in the year 2010 (Tons)
11 Mill Effluent (POME) treated in the year 2010 (Tons)
Comments: _____________________________________________________________________________
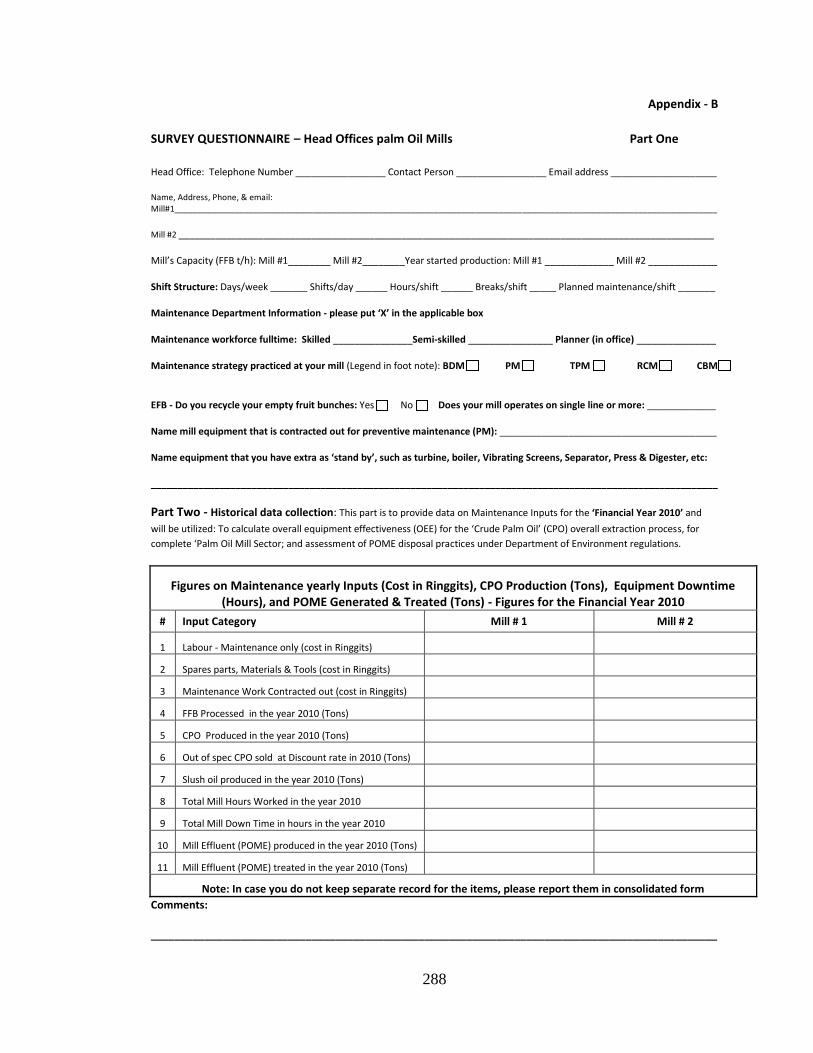
288
Appendix - B
SURVEY QUESTIONNAIRE – Head Offices palm Oil Mills Part One
Head Office: Telephone Number _________________ Contact Person _________________ Email address ____________________
Name, Address, Phone, & email: Mill#1_____________________________________________________________________________________________________________________
Mill #2 _____________________________________________________________________________________________________
Mill’s Capacity (FFB t/h): Mill #1________ Mill #2________Year started production: Mill #1 _____________ Mill #2 _____________
Shift Structure: Days/week _______ Shifts/day ______ Hours/shift ______ Breaks/shift _____ Planned maintenance/shift _______
Maintenance Department Information - please put ‘X’ in the applicable box
Maintenance workforce fulltime: Skilled _______________Semi-skilled ________________ Planner (in office) _______________
Maintenance strategy practiced at your mill (Legend in foot note): BDM PM TPM RCM CBM
EFB - Do you recycle your empty fruit bunches: Yes No Does your mill operates on single line or more: _____________
Name mill equipment that is contracted out for preventive maintenance (PM): _________________________________________
Name equipment that you have extra as ‘stand by’, such as turbine, boiler, Vibrating Screens, Separator, Press & Digester, etc:
___________________________________________________________________________________________________________
Part Two - Historical data collection: This part is to provide data on Maintenance Inputs for the ‘Financial Year 2010’ and
will be utilized: To calculate overall equipment effectiveness (OEE) for the ‘Crude Palm Oil’ (CPO) overall extraction process, for
complete ‘Palm Oil Mill Sector; and assessment of POME disposal practices under Department of Environment regulations.
Figures on Maintenance yearly Inputs (Cost in Ringgits), CPO Production (Tons), Equipment Downtime (Hours), and POME Generated & Treated (Tons) - Figures for the Financial Year 2010
# Input Category Mill # 1 Mill # 2
1 Labour - Maintenance only (cost in Ringgits)
2 Spares parts, Materials & Tools (cost in Ringgits)
3 Maintenance Work Contracted out (cost in Ringgits)
4 FFB Processed in the year 2010 (Tons)
5 CPO Produced in the year 2010 (Tons)
6 Out of spec CPO sold at Discount rate in 2010 (Tons)
7 Slush oil produced in the year 2010 (Tons)
8 Total Mill Hours Worked in the year 2010
9 Total Mill Down Time in hours in the year 2010
10 Mill Effluent (POME) produced in the year 2010 (Tons)
11 Mill Effluent (POME) treated in the year 2010 (Tons)
Note: In case you do not keep separate record for the items, please report them in consolidated form
Comments:
_______________________________________________________________________________________________
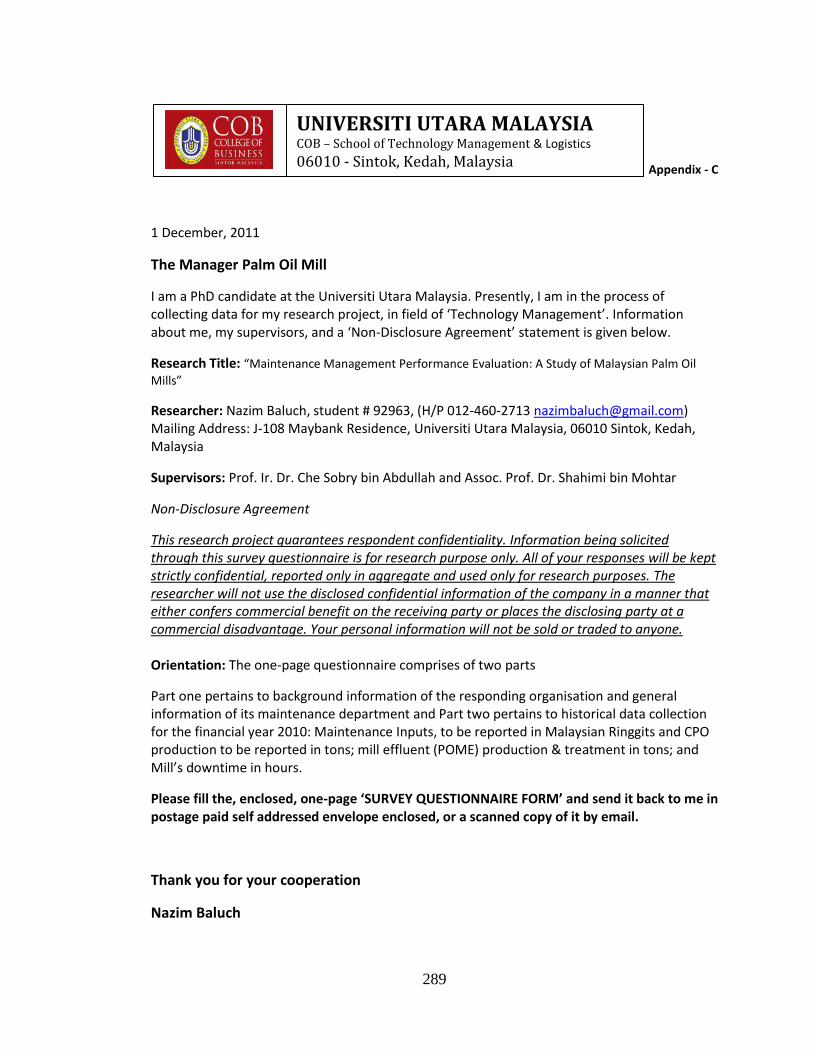
289
Appendix - C
1 December, 2011
The Manager Palm Oil Mill
I am a PhD candidate at the Universiti Utara Malaysia. Presently, I am in the process of collecting data for my research project, in field of ‘Technology Management’. Information about me, my supervisors, and a ‘Non-Disclosure Agreement’ statement is given below.
Research Title: “Maintenance Management Performance Evaluation: A Study of Malaysian Palm Oil
Mills”
Researcher: Nazim Baluch, student # 92963, (H/P 012-460-2713 [email protected]) Mailing Address: J-108 Maybank Residence, Universiti Utara Malaysia, 06010 Sintok, Kedah, Malaysia
Supervisors: Prof. Ir. Dr. Che Sobry bin Abdullah and Assoc. Prof. Dr. Shahimi bin Mohtar
Non-Disclosure Agreement
This research project guarantees respondent confidentiality. Information being solicited through this survey questionnaire is for research purpose only. All of your responses will be kept strictly confidential, reported only in aggregate and used only for research purposes. The researcher will not use the disclosed confidential information of the company in a manner that either confers commercial benefit on the receiving party or places the disclosing party at a commercial disadvantage. Your personal information will not be sold or traded to anyone. Orientation: The one-page questionnaire comprises of two parts
Part one pertains to background information of the responding organisation and general information of its maintenance department and Part two pertains to historical data collection for the financial year 2010: Maintenance Inputs, to be reported in Malaysian Ringgits and CPO production to be reported in tons; mill effluent (POME) production & treatment in tons; and Mill’s downtime in hours.
Please fill the, enclosed, one-page ‘SURVEY QUESTIONNAIRE FORM’ and send it back to me in postage paid self addressed envelope enclosed, or a scanned copy of it by email.
Thank you for your cooperation
Nazim Baluch
UNIVERSITI UTARA MALAYSIA COB – School of Technology Management & Logistics 06010 - Sintok, Kedah, Malaysia

290
Appendix - D
September 4, 2011 PLEASE KEEP THIS PAGE FOR YOUR RECORD
In-Charge Corporate Communications
I am a PhD research student at the Universiti Utara Malaysia. Presently, I am in the process of collecting data for my research project, in field of ‘Technology Management’.
For your records: My particulars; Information about my supervisors; and a ‘Non-Disclosure Agreement’ statement is provided below.
Research Title: “Maintenance Management Performance Evaluation: A Study of Malaysian Palm Oil
Mills”
Researcher: Nazim Baluch, student # 92963, (H/P 012-460-2713, [email protected]) Mailing Address: Maybank Residence # J-108, Universiti Utara Malaysia, 06010 Sintok, Kedah, Malaysia
Supervisors: Prof. Ir. Dr. Che Sobry bin Abdullah and Assoc. Prof. Dr. Shahimi bin Mohtar
Non-Disclosure Agreement
This research project guarantees respondent confidentiality. Information being solicited through this survey questionnaire is for research purpose only. All of your responses will be kept strictly confidential, reported only in aggregate and used only for research purposes. The researcher will not use the disclosed confidential information of the company in a manner that either confers commercial benefit on the receiving party or places the disclosing party at a commercial disadvantage. Your personal information will not be sold or traded to anyone. Orientation: The two-page questionnaire comprises of two parts
Part one pertains to background information of the responding organisation and general information of its maintenance department and Part two pertains to historical data collection for the financial year 2010: Maintenance Inputs, to be reported in Malaysian Ringgits and CPO production to be reported in tons; POME production & treatment in tons; and Mill’s downtime in hours. You may copy the questionnaire to accommodate info on the number of mills being reported
Please provide information, at random, for two of your mills, by filling the, enclosed, two-page ‘SURVEY QUESTIONNAIRE FORM’ and mail it back in the addressed & postage paid envelop provided; I will be glad to share the findings of my research with you, if you so desire.
Thank you for your cooperation
Nazim Baluch
UNIVERSITI UTARA MALAYSIA College of Business – Technology Management 06010 - Sintok, Kedah, Malaysia
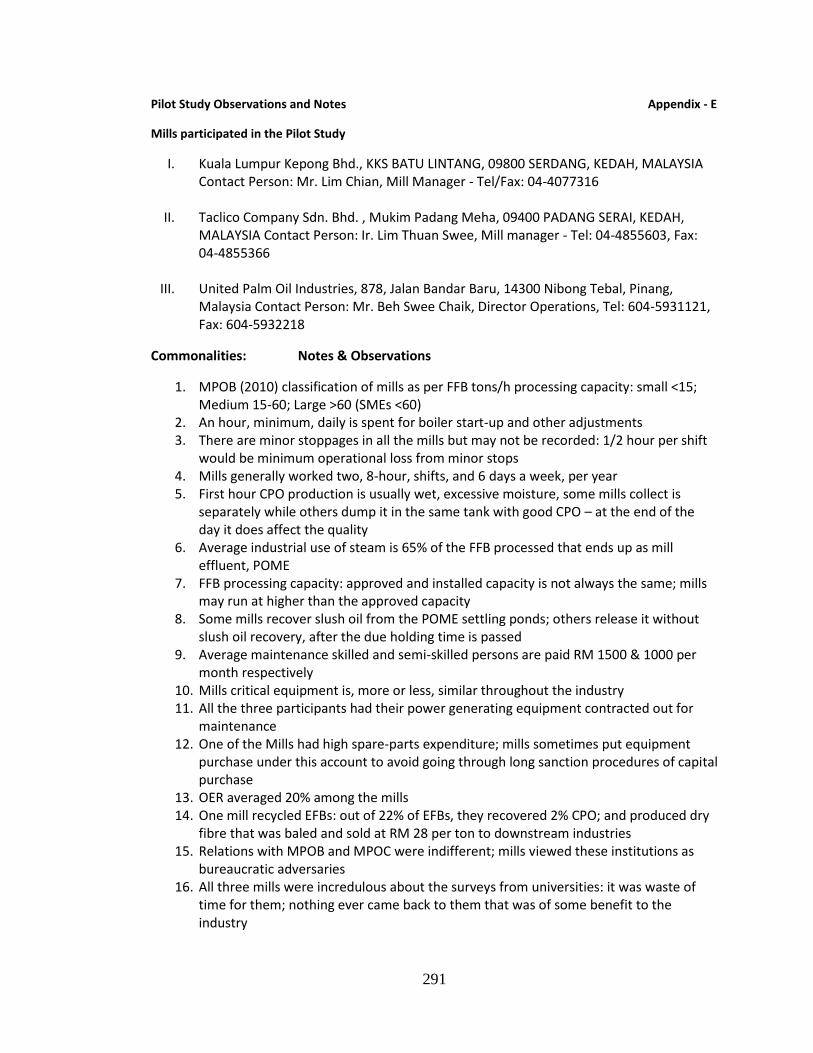
291
Pilot Study Observations and Notes Appendix - E
Mills participated in the Pilot Study
I. Kuala Lumpur Kepong Bhd., KKS BATU LINTANG, 09800 SERDANG, KEDAH, MALAYSIA Contact Person: Mr. Lim Chian, Mill Manager - Tel/Fax: 04-4077316
II. Taclico Company Sdn. Bhd. , Mukim Padang Meha, 09400 PADANG SERAI, KEDAH, MALAYSIA Contact Person: Ir. Lim Thuan Swee, Mill manager - Tel: 04-4855603, Fax: 04-4855366
III. United Palm Oil Industries, 878, Jalan Bandar Baru, 14300 Nibong Tebal, Pinang, Malaysia Contact Person: Mr. Beh Swee Chaik, Director Operations, Tel: 604-5931121, Fax: 604-5932218
Commonalities: Notes & Observations
1. MPOB (2010) classification of mills as per FFB tons/h processing capacity: small <15; Medium 15-60; Large >60 (SMEs <60)
2. An hour, minimum, daily is spent for boiler start-up and other adjustments 3. There are minor stoppages in all the mills but may not be recorded: 1/2 hour per shift
would be minimum operational loss from minor stops 4. Mills generally worked two, 8-hour, shifts, and 6 days a week, per year 5. First hour CPO production is usually wet, excessive moisture, some mills collect is
separately while others dump it in the same tank with good CPO – at the end of the day it does affect the quality
6. Average industrial use of steam is 65% of the FFB processed that ends up as mill effluent, POME
7. FFB processing capacity: approved and installed capacity is not always the same; mills may run at higher than the approved capacity
8. Some mills recover slush oil from the POME settling ponds; others release it without slush oil recovery, after the due holding time is passed
9. Average maintenance skilled and semi-skilled persons are paid RM 1500 & 1000 per month respectively
10. Mills critical equipment is, more or less, similar throughout the industry 11. All the three participants had their power generating equipment contracted out for
maintenance 12. One of the Mills had high spare-parts expenditure; mills sometimes put equipment
purchase under this account to avoid going through long sanction procedures of capital purchase
13. OER averaged 20% among the mills 14. One mill recycled EFBs: out of 22% of EFBs, they recovered 2% CPO; and produced dry
fibre that was baled and sold at RM 28 per ton to downstream industries 15. Relations with MPOB and MPOC were indifferent; mills viewed these institutions as
bureaucratic adversaries 16. All three mills were incredulous about the surveys from universities: it was waste of
time for them; nothing ever came back to them that was of some benefit to the industry
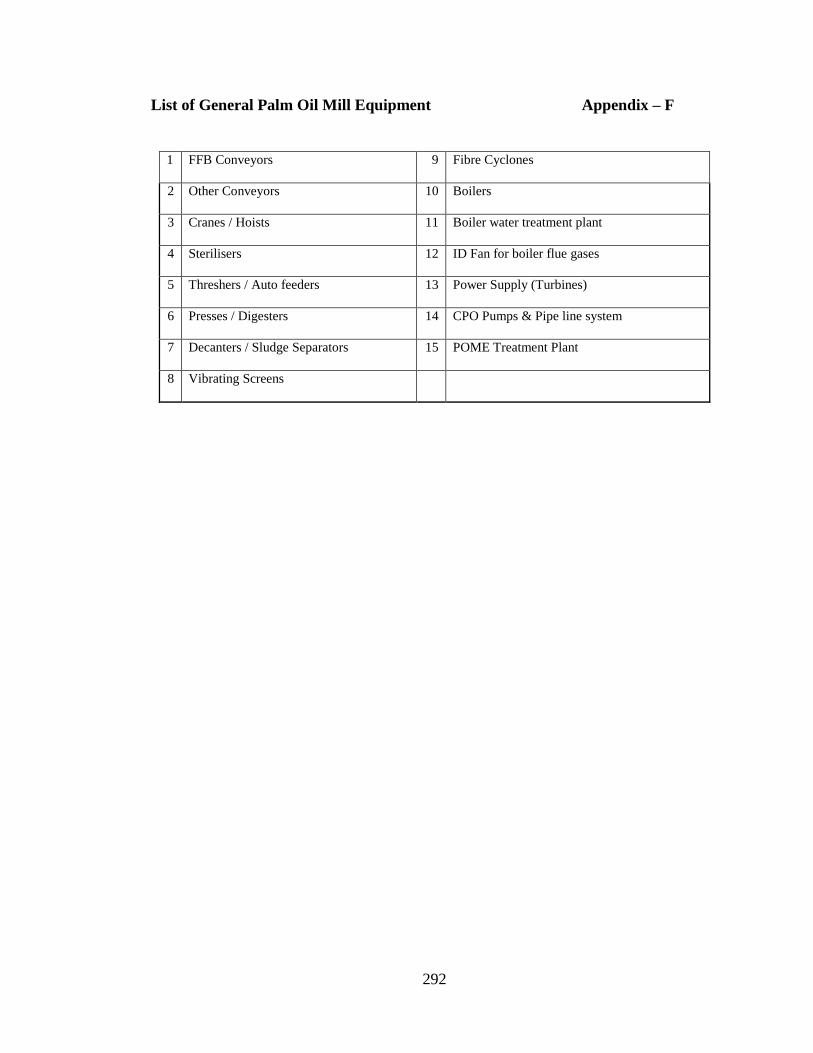
292
List of General Palm Oil Mill Equipment Appendix – F
1 FFB Conveyors 9 Fibre Cyclones
2 Other Conveyors 10 Boilers
3 Cranes / Hoists 11 Boiler water treatment plant
4 Sterilisers 12 ID Fan for boiler flue gases
5 Threshers / Auto feeders 13 Power Supply (Turbines)
6 Presses / Digesters 14 CPO Pumps & Pipe line system
7 Decanters / Sludge Separators 15 POME Treatment Plant
8 Vibrating Screens
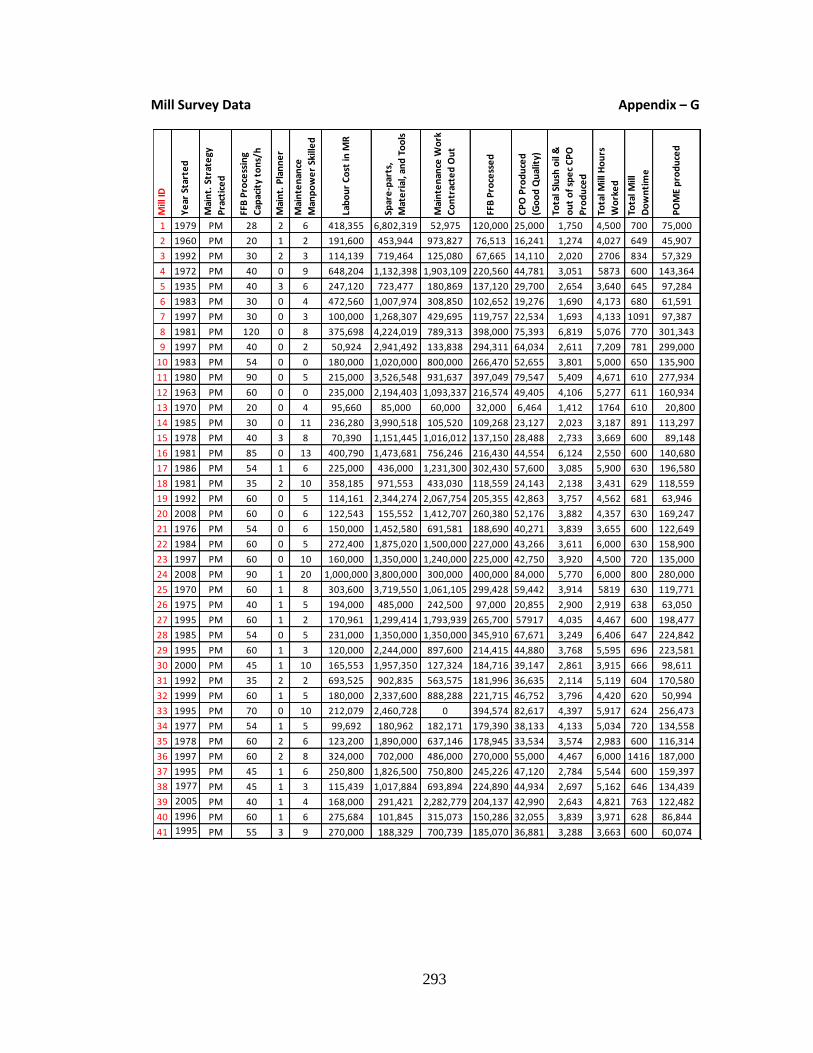
293
Mill Survey Data Appendix – G
Mill
ID
Ye
ar S
tart
ed
Mai
nt.
Str
ate
gy
Pra
ctic
ed
FFB
Pro
cess
ing
Cap
acit
y to
ns/
h
Mai
nt.
Pla
nn
er
Mai
nte
nan
ce
Man
po
we
r Sk
ille
d
Lab
ou
r C
ost
in M
R
Spar
e-p
arts
,
Mat
eri
al, a
nd
To
ols
Mai
nte
nan
ce W
ork
Co
ntr
acte
d O
ut
FFB
Pro
cess
ed
CP
O P
rod
uce
d
(Go
od
Qu
alit
y)
Tota
l Slu
sh o
il &
ou
t o
f sp
ec
CP
O
Pro
du
ced
Tota
l Mill
Ho
urs
Wo
rke
d
Tota
l Mill
Do
wn
tim
e
PO
ME
pro
du
ced
1 1979 PM 28 2 6 418,355 6,802,319 52,975 120,000 25,000 1,750 4,500 700 75,000
2 1960 PM 20 1 2 191,600 453,944 973,827 76,513 16,241 1,274 4,027 649 45,907
3 1992 PM 30 2 3 114,139 719,464 125,080 67,665 14,110 2,020 2706 834 57,329
4 1972 PM 40 0 9 648,204 1,132,398 1,903,109 220,560 44,781 3,051 5873 600 143,364
5 1935 PM 40 3 6 247,120 723,477 180,869 137,120 29,700 2,654 3,640 645 97,284
6 1983 PM 30 0 4 472,560 1,007,974 308,850 102,652 19,276 1,690 4,173 680 61,591
7 1997 PM 30 0 3 100,000 1,268,307 429,695 119,757 22,534 1,693 4,133 1091 97,387
8 1981 PM 120 0 8 375,698 4,224,019 789,313 398,000 75,393 6,819 5,076 770 301,343
9 1997 PM 40 0 2 50,924 2,941,492 133,838 294,311 64,034 2,611 7,209 781 299,000
10 1983 PM 54 0 0 180,000 1,020,000 800,000 266,470 52,655 3,801 5,000 650 135,900
11 1980 PM 90 0 5 215,000 3,526,548 931,637 397,049 79,547 5,409 4,671 610 277,934
12 1963 PM 60 0 0 235,000 2,194,403 1,093,337 216,574 49,405 4,106 5,277 611 160,934
13 1970 PM 20 0 4 95,660 85,000 60,000 32,000 6,464 1,412 1764 610 20,800
14 1985 PM 30 0 11 236,280 3,990,518 105,520 109,268 23,127 2,023 3,187 891 113,297
15 1978 PM 40 3 8 70,390 1,151,445 1,016,012 137,150 28,488 2,733 3,669 600 89,148
16 1981 PM 85 0 13 400,790 1,473,681 756,246 216,430 44,554 6,124 2,550 600 140,680
17 1986 PM 54 1 6 225,000 436,000 1,231,300 302,430 57,600 3,085 5,900 630 196,580
18 1981 PM 35 2 10 358,185 971,553 433,030 118,559 24,143 2,138 3,431 629 118,559
19 1992 PM 60 0 5 114,161 2,344,274 2,067,754 205,355 42,863 3,757 4,562 681 63,946
20 2008 PM 60 0 6 122,543 155,552 1,412,707 260,380 52,176 3,882 4,357 630 169,247
21 1976 PM 54 0 6 150,000 1,452,580 691,581 188,690 40,271 3,839 3,655 600 122,649
22 1984 PM 60 0 5 272,400 1,875,020 1,500,000 227,000 43,266 3,611 6,000 630 158,900
23 1997 PM 60 0 10 160,000 1,350,000 1,240,000 225,000 42,750 3,920 4,500 720 135,000
24 2008 PM 90 1 20 1,000,000 3,800,000 300,000 400,000 84,000 5,770 6,000 800 280,000
25 1970 PM 60 1 8 303,600 3,719,550 1,061,105 299,428 59,442 3,914 5819 630 119,771
26 1975 PM 40 1 5 194,000 485,000 242,500 97,000 20,855 2,900 2,919 638 63,050
27 1995 PM 60 1 2 170,961 1,299,414 1,793,939 265,700 57917 4,035 4,467 600 198,477
28 1985 PM 54 0 5 231,000 1,350,000 1,350,000 345,910 67,671 3,249 6,406 647 224,842
29 1995 PM 60 1 3 120,000 2,244,000 897,600 214,415 44,880 3,768 5,595 696 223,581
30 2000 PM 45 1 10 165,553 1,957,350 127,324 184,716 39,147 2,861 3,915 666 98,611
31 1992 PM 35 2 2 693,525 902,835 563,575 181,996 36,635 2,114 5,119 604 170,580
32 1999 PM 60 1 5 180,000 2,337,600 888,288 221,715 46,752 3,796 4,420 620 50,994
33 1995 PM 70 0 10 212,079 2,460,728 0 394,574 82,617 4,397 5,917 624 256,473
34 1977 PM 54 1 5 99,692 180,962 182,171 179,390 38,133 4,133 5,034 720 134,558
35 1978 PM 60 2 6 123,200 1,890,000 637,146 178,945 33,534 3,574 2,983 600 116,314
36 1997 PM 60 2 8 324,000 702,000 486,000 270,000 55,000 4,467 6,000 1416 187,000
37 1995 PM 45 1 6 250,800 1,826,500 750,800 245,226 47,120 2,784 5,544 600 159,397
38 1977 PM 45 1 3 115,439 1,017,884 693,894 224,890 44,934 2,697 5,162 646 134,439
39 2005 PM 40 1 4 168,000 291,421 2,282,779 204,137 42,990 2,643 4,821 763 122,482
40 1996 PM 60 1 6 275,684 101,845 315,073 150,286 32,055 3,839 3,971 628 86,844
41 1995 PM 55 3 9 270,000 188,329 700,739 185,070 36,881 3,288 3,663 600 60,074
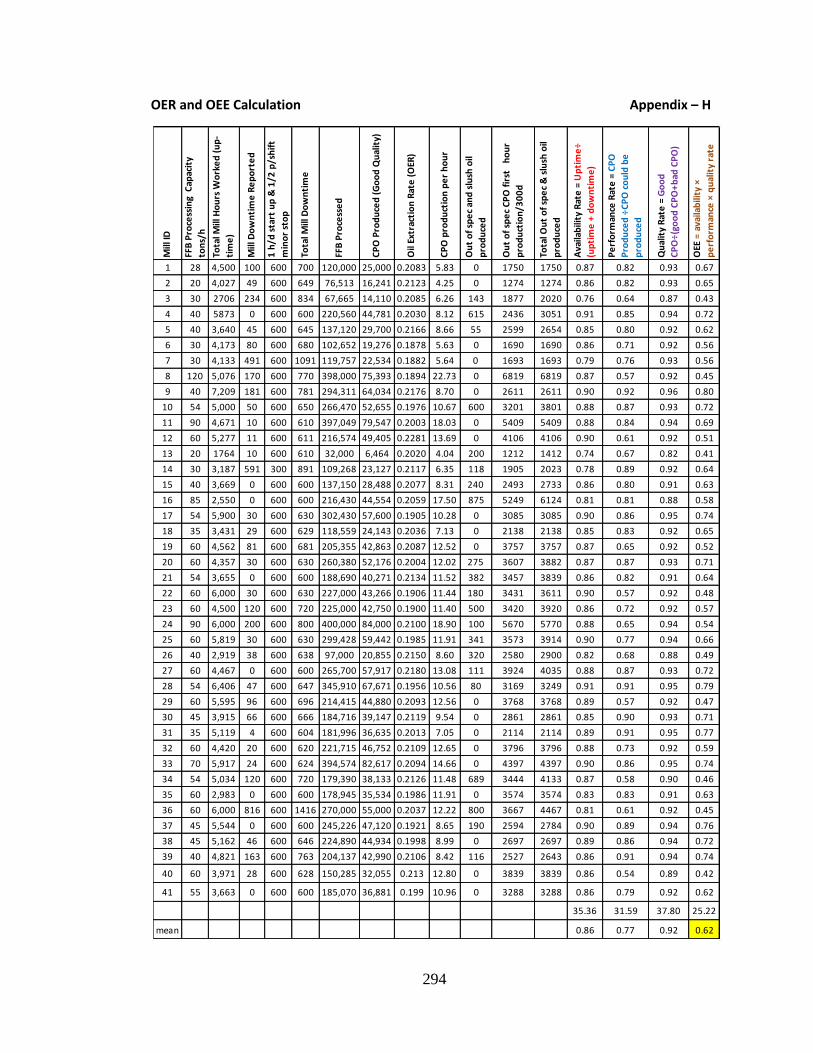
294
OER and OEE Calculation Appendix – H
Mill
ID
FFB
Pro
cess
ing
Cap
acit
y
ton
s/h
Tota
l Mill
Ho
urs
Wo
rke
d (
up
-
tim
e)
Mill
Do
wn
tim
e R
ep
ort
ed
1 h
/d s
tart
up
& 1
/2 p
/sh
ift
min
or
sto
p
Tota
l Mill
Do
wn
tim
e
FFB
Pro
cess
ed
CP
O P
rod
uce
d (
Go
od
Qu
alit
y)
Oil
Extr
acti
on
Rat
e (
OER
)
CP
O p
rod
uct
ion
pe
r h
ou
r
Ou
t o
f sp
ec
and
slu
sh o
il
pro
du
ced
Ou
t o
f sp
ec
CP
O f
irst
h
ou
r
pro
du
ctio
n/3
00
d
Tota
l Ou
t o
f sp
ec
& s
lush
oil
pro
du
ced
Ava
ilab
ility
Rat
e =
Up
tim
e÷
(up
tim
e +
do
wn
tim
e)
Pe
rfo
rman
ce R
ate
= C
PO
Pro
du
ced
÷C
PO
co
uld
be
pro
du
ced
Qu
alit
y R
ate
= G
oo
d
CP
O÷
(go
od
CP
O+
bad
CP
O)
OEE
= a
vaila
bili
ty ×
pe
rfo
rman
ce ×
qu
alit
y ra
te
1 28 4,500 100 600 700 120,000 25,000 0.2083 5.83 0 1750 1750 0.87 0.82 0.93 0.67
2 20 4,027 49 600 649 76,513 16,241 0.2123 4.25 0 1274 1274 0.86 0.82 0.93 0.65
3 30 2706 234 600 834 67,665 14,110 0.2085 6.26 143 1877 2020 0.76 0.64 0.87 0.43
4 40 5873 0 600 600 220,560 44,781 0.2030 8.12 615 2436 3051 0.91 0.85 0.94 0.72
5 40 3,640 45 600 645 137,120 29,700 0.2166 8.66 55 2599 2654 0.85 0.80 0.92 0.62
6 30 4,173 80 600 680 102,652 19,276 0.1878 5.63 0 1690 1690 0.86 0.71 0.92 0.56
7 30 4,133 491 600 1091 119,757 22,534 0.1882 5.64 0 1693 1693 0.79 0.76 0.93 0.56
8 120 5,076 170 600 770 398,000 75,393 0.1894 22.73 0 6819 6819 0.87 0.57 0.92 0.45
9 40 7,209 181 600 781 294,311 64,034 0.2176 8.70 0 2611 2611 0.90 0.92 0.96 0.80
10 54 5,000 50 600 650 266,470 52,655 0.1976 10.67 600 3201 3801 0.88 0.87 0.93 0.72
11 90 4,671 10 600 610 397,049 79,547 0.2003 18.03 0 5409 5409 0.88 0.84 0.94 0.69
12 60 5,277 11 600 611 216,574 49,405 0.2281 13.69 0 4106 4106 0.90 0.61 0.92 0.51
13 20 1764 10 600 610 32,000 6,464 0.2020 4.04 200 1212 1412 0.74 0.67 0.82 0.41
14 30 3,187 591 300 891 109,268 23,127 0.2117 6.35 118 1905 2023 0.78 0.89 0.92 0.64
15 40 3,669 0 600 600 137,150 28,488 0.2077 8.31 240 2493 2733 0.86 0.80 0.91 0.63
16 85 2,550 0 600 600 216,430 44,554 0.2059 17.50 875 5249 6124 0.81 0.81 0.88 0.58
17 54 5,900 30 600 630 302,430 57,600 0.1905 10.28 0 3085 3085 0.90 0.86 0.95 0.74
18 35 3,431 29 600 629 118,559 24,143 0.2036 7.13 0 2138 2138 0.85 0.83 0.92 0.65
19 60 4,562 81 600 681 205,355 42,863 0.2087 12.52 0 3757 3757 0.87 0.65 0.92 0.52
20 60 4,357 30 600 630 260,380 52,176 0.2004 12.02 275 3607 3882 0.87 0.87 0.93 0.71
21 54 3,655 0 600 600 188,690 40,271 0.2134 11.52 382 3457 3839 0.86 0.82 0.91 0.64
22 60 6,000 30 600 630 227,000 43,266 0.1906 11.44 180 3431 3611 0.90 0.57 0.92 0.48
23 60 4,500 120 600 720 225,000 42,750 0.1900 11.40 500 3420 3920 0.86 0.72 0.92 0.57
24 90 6,000 200 600 800 400,000 84,000 0.2100 18.90 100 5670 5770 0.88 0.65 0.94 0.54
25 60 5,819 30 600 630 299,428 59,442 0.1985 11.91 341 3573 3914 0.90 0.77 0.94 0.66
26 40 2,919 38 600 638 97,000 20,855 0.2150 8.60 320 2580 2900 0.82 0.68 0.88 0.49
27 60 4,467 0 600 600 265,700 57,917 0.2180 13.08 111 3924 4035 0.88 0.87 0.93 0.72
28 54 6,406 47 600 647 345,910 67,671 0.1956 10.56 80 3169 3249 0.91 0.91 0.95 0.79
29 60 5,595 96 600 696 214,415 44,880 0.2093 12.56 0 3768 3768 0.89 0.57 0.92 0.47
30 45 3,915 66 600 666 184,716 39,147 0.2119 9.54 0 2861 2861 0.85 0.90 0.93 0.71
31 35 5,119 4 600 604 181,996 36,635 0.2013 7.05 0 2114 2114 0.89 0.91 0.95 0.77
32 60 4,420 20 600 620 221,715 46,752 0.2109 12.65 0 3796 3796 0.88 0.73 0.92 0.59
33 70 5,917 24 600 624 394,574 82,617 0.2094 14.66 0 4397 4397 0.90 0.86 0.95 0.74
34 54 5,034 120 600 720 179,390 38,133 0.2126 11.48 689 3444 4133 0.87 0.58 0.90 0.46
35 60 2,983 0 600 600 178,945 35,534 0.1986 11.91 0 3574 3574 0.83 0.83 0.91 0.63
36 60 6,000 816 600 1416 270,000 55,000 0.2037 12.22 800 3667 4467 0.81 0.61 0.92 0.45
37 45 5,544 0 600 600 245,226 47,120 0.1921 8.65 190 2594 2784 0.90 0.89 0.94 0.76
38 45 5,162 46 600 646 224,890 44,934 0.1998 8.99 0 2697 2697 0.89 0.86 0.94 0.72
39 40 4,821 163 600 763 204,137 42,990 0.2106 8.42 116 2527 2643 0.86 0.91 0.94 0.74
40 60 3,971 28 600 628 150,285 32,055 0.213 12.80 0 3839 3839 0.86 0.54 0.89 0.42
41 55 3,663 0 600 600 185,070 36,881 0.199 10.96 0 3288 3288 0.86 0.79 0.92 0.62
35.36 31.59 37.80 25.22
mean 0.86 0.77 0.92 0.62