Title page - Consultancy.nl · (excl. promotion) 6.4% 3.8% 2016 (average) 2017 ... •As seniority...
44
Title page
Transcript of Title page - Consultancy.nl · (excl. promotion) 6.4% 3.8% 2016 (average) 2017 ... •As seniority...

Title page

2 Consulting Salary Survey 2017 Consultancy.nl Berenschot
Salary & Bonus 3
Work-Life Balance 14
Lease & Mobility 18
Job Satisfaction 21
Changing Jobs 25
Independent Consultants 30
Demographics 36
Appendix - About the study - The authors
40
Table of Contents

Salary & Bonus

Salary & Benefits Total salary by level and age
4 Consulting Salary Survey 2017 Consultancy.nl Berenschot
Total gross annual salary (€ / by function)
50,256
71,927
93,817
99,700
123,920
41,269
54,203
73,070
91,629
114,440
36,327
Partner 176,477
Principal
Senior Manager
Manager
Consultant
Junior Consultant
Median Average
Total Gross Annual Salary = Base salary (1 FTE), extra financial payments*, holiday allowance and variable bonus. Excludes reimbursement of expenses
* Includes 13th month, 14th month and profit sharing
• The median salary for the Junior Consultant level is circa €36,300
• Salaries for Junior Consultant to Senior Manager are higher compared to 2014 data; higher bonus a significant explanatory factor
• Salary differences between median and average are largest in the Principal and Partner levels
95,73096,284
74,88062,388
41,42635,894
149,403 149,788
101,857
81,710
65,048
45,72737,930
36 - 40 31 - 35 61+ 51 - 60
202,296
41 - 50 26 - 30 20 - 25
Total gross annual salary (€ / by age)

32.000 36.000 40.000 44.000 48.000 52.000
Junior Consultant
54.000 57.000 60.000 51.000 48.000
74.000 72.000 70.000 68.000 66.000 76.000 78.000
84.000 96.000 80.000 88.000 92.000 100.000
120.000 90.000 110.000 130.000 140.000 80.000 100.000
120.000 180.000 90.000 270.000 150.000 240.000 210.000
Consultant
Senior Manager
Principal
Partner
Manager
Interval Low
Interval High
Mean
• Example: With 95% confidence it can be stated that an average Manager earns between €68.859 (Low) and €76.281 (High). The Mean corresponds with data on slide 8.
• Population size (n) declines progressively with seniority, and the variance increases, leading to larger intervals given the same 95% confidence level
• Junior Consultant level has quite high variance because the interval includes both starters and those with ~2-3 years experience
The intervals present the salary range per level, based on a 95% confidence interval.
Salary & Benefits Total salary – 95% confidence interval
Total gross annual salary (€ / by level)
5 Consulting Salary Survey 2017 Consultancy.nl Berenschot

Salary & Benefits Salary breakdown: ‘Consultant’ and ‘Manager’ example
6 Consulting Salary Survey 2017 Consultancy.nl Berenschot
74.342
0 61.578
1 extra salary period
4.926
Holiday allowance
Variable bonus
Collective profit sharing
73.070
Total Gross Annual Salary
0
75.000
70.000
65.000
60.000
0
2 extra salary periods
Annual base salary
1.272
0
6.566
Monthly allowance
Total Net Annual Income*
‘Average’ Consultant
* Net income excludes costs for eg. lease car, phone, etc
Average of 14% received a 13th month
See slide 15 for details
Only 2% received a 13th + 14th
month
Average of 25% received profit sharing
Average of 79% received
variable bonus
924
Total Gross Annual Salary
Monthly allowance
Total Net Annual Income*
54.203
0
50.000
55.000
45.000
55.127
2 extra salary periods
Annual base salary
Holiday allowance
0
4.192
1 extra salary period
3.705
Variable bonus
0
0
60.000
Collective profit sharing
46.307
Average of 15% received a 13th month
See slide 15 for details
Only 5% received a 13th + 14th
month
Average of 29% received profit sharing
Average of 77% received
variable bonus
‘Average’ Manager
= A
vera
ge
= A
vera
ge

Salary & Benefits Total salary by firm type
7 Consulting Salary Survey 2017 Consultancy.nl Berenschot
Total average gross annual salary by level* (€ x 1.000)
Boutique 36.8
IT consulting 38.6
Midsized firms 36.4
Large firms 37.5
Big Four 35.9
Strategy firms
47.5
Junior Consultant Consultant
57.2
59.3
49.3
47.9
52.8
72.5
Manager
75.6
71.5
69.5
71.2
73.1
86.3
Senior Manager
95.3
74.7
78.8
94.6
102.4
161.7
149.8
124.6
70.2
97.4
Principal
128.2
116.5
199.2
110.8
Partner
• Total annual gross salaries are highest at the well-known strategy consulting firms
• Big Four firms seem to ‘underpay’ at starting levels, yet are on par / above par for (Senior) Manager levels
• Salaries at IT consulting firms are relatively high for early career levels, but lag their peers at experienced levels
• Remuneration at boutique firms often matches or is above the larger players in the consultancy industry
Median * Some values have low statistical confidence

Salary & Benefits Change in base salary and expectations
8 Consulting Salary Survey 2017 Consultancy.nl Berenschot
Overall change in base salary
30% 28%19%
14% 14%
9%
57%71%
56%
Salary decrease
No change
Salary increase, but lower
than inflation*
Salary increase above inflation*
2017
0%
2016
1%
2014
1%
5.6%
4.0%
Partner
5.0%
Principal
8.2% 8.4%
Senior Manager
3.9%
5.2%
Manager
2.5%
5.4%
Consultant
4.5%
8.0%
Junior Consultant
8.2%
5.8%
2.6%
8.3%
3.0% 3.3%
2016 (excl. promotion) 2016 2017
6.6%
2016 (excl. promotion)
6.4%
3.8%
2016 (average)
2017 (forecast)
2014 (average)
4.2%
Change in base salary by level (average %)
No
dat
a
* Assumed to be 2.4%

Salary & Benefits Bonus
9 Consulting Salary Survey 2017 Consultancy.nl Berenschot
68%
75%
32%
25%
+7%
Yes
No
Bonus? (2017) Bonus? (2014)
61%
77% 79% 81% 84%94%
39%
23% 21% 19% 16%
Partner
6%
Principal Senior Manager Manager Consultant Junior Consultant
Yes
No
% bonus per firm type
Midsized firms 71%
Large firms 76%
Big Four 84%
Strategy firms
89%
Boutiques 74%
IT Consulting 75%
% bonus per level
68%
78%
75%
Female Male
% bonus by gender

Salary & Benefits Bonus determinants
10 Consulting Salary Survey 2017 Consultancy.nl Berenschot
Partner
2.9
18%
14%
35%
20%
12%
Principal
2.9
19%
12%
29%
23%
17%
Senior Manager
2.6
29%
6%
26%
23%
16%
Manager
2.5
26%
9%
31%
18%
17%
Consultant
2.4
26%
7%
31%
14%
22%
Junior Consultant
2.0
23%
10%
32%
10%
23%
Chargeability
Performance of department
Performance of company
Revenue sold
Non-financial targets
Determinants of bonus
• As seniority rises, the number of bonus determinants grows
• At junior levels, most respondents indicate their bonus depends on chargeability and firm performance
• The importance of revenue sold is highest at Senior Manager+
• Non-financial targets have increased in importance compared to 2014 study
Average # bonus factors per level

Salary & Benefits Other benefits
11 Consulting Salary Survey 2017 Consultancy.nl Berenschot
Can you book overhours?
No 91%
Compensation for working abroad?
No 85%
Yes 15% 26.0
25.7
26.7
25.8
27.5
26.6Partner
Manager
Principal
Consultant
Junior Consultant
Senior Manager
Do you receive a fixed allowance?
Yes 63%
No 37%
29%
47% +14
120
58%
+8 +6
106
Principal Senior Manager
+29
Partner
112
140
53%
39%
Manager
61%
42%
71% 58%
Consultant Junior Consultant
63
77
63%
37%
42%
70%
30%
Time for time
No compensation
Fixed monthly allowances (€ p/m)
Overtime policy Average # holiday days Working abroad
But
• 63% of consultants receive a fixed monthly allowance
• The monthly allowance rises from €60 for Juniors to €140 for Partners
• Booking ‘overtime’ is generally not possible in consulting. However, ‘time for time’ is a commonly used practice
• % of consultants who receive compensation for working abroad has dropped from 48% to 15%

Salary & Benefits Benefit packages
12 Consulting Salary Survey 2017 Consultancy.nl Berenschot
41%
6%
53%
48%
2%
Manager
68%
Senior Manager Junior Consultant
40%
63%
13%
Consultant
27%
4%
51%
Principal
10%
Partner
57%
26%
17%
30%
45%
Deteriorated Stayed the same Improved
7%
Stayed the same
Improved
55%
37%
2017 2014
Deteriorated 22%
54%
24%
58% 73%
47% 48% 35% 41%
Competitive:
Below Competitive:
57% 40% 47% 48%
26% 20%
Compensation & Benefit packages have over the past year:

Salary & Benefits Career path in consulting
13 Consulting Salary Survey 2017 Consultancy.nl Berenschot
60
55
50
45
40
35
30
25
20
0
Partner Principal Senior Manager Manager Consultant Junior Consultant
An average career path in consulting
Age

Work-Life Balance

Work-Life Balance Working hours
15 Consulting Salary Survey 2017 Consultancy.nl Berenschot
Work more than contract hours?
Yes 76%
No 24%
7.2
6.6
8.4
5.4
9.4
12.4
4.8
6.5
5.6
5.1
6.5
4.0Partner
Principal
Senior Manager
Manager
Consultant
Junior Consultant Female
Male
Who are not working excessive hours?
• 37% of consultants with a HBO background do not work overtime, this drops to 26% for those with a WO title
• Gender difference is marginal, with 23% of men sticking to their contract hours, compared to 27% for women
•Of all firm types, consultants at IT consulting firms are most likely to not work more than contract hours
Overwork per week (by level) Overwork per week (by firm type)
• In consulting, men work more hours than women
• Partners and Directors work on average the most hours
• Strategy consultants work on average 10+ extra hours
• Advisors at large firms tend to work more hours
3.7
5.7
7.0
7.1
8.9
10.5
Midsized firm
Boutique
Large firm
Big Four
Strategy firm
IT consulting
Average

Work-Life Balance Working hours by function/industry
16 Consulting Salary Survey 2017 Consultancy.nl Berenschot
88%
87%
81%
79%
77%
77%
74%
72%
70%
51%
81%Other
Finance & Risk
Data Analytics
Lean / Process Management
Project Management
IT Consulting
Corporate Finance / M&A
Sales & Marketing
Human Capital
Procurement / Supply Chain
Strategy
Overwork % per main focus area
No overwork Overwork
Overwork % per main industry
95%
91%
86%
82%
78%
77%
76%
75%
74%
73%
73%
72%
70%
70%
68%
67%
67%
57%
83%
Technology
Telecom
Transport & Logistics
Healthcare
Financial Services
Energy
Public Sector
Pharma & Life Sciences
Education
Professional Services
ICT
Automotive
Construction
Oil & Gas
SME / Family Business
Retail / FMCG
Industry
Entertainment & Media
Other

Work-Life Balance Part-time working
17 Consulting Salary Survey 2017 Consultancy.nl Berenschot
Work part-time?
No (40h) 78%
Yes (<40h)
22%
75%
11%
58%
24%
41%
25%
33%
15%
11%
13%
Female
Male
Junior Consultant
12%
19%
Consultant
Manager
6%
31% Senior
Manager
Partner
Principal
29%
21%
% Part-time per level Part-time by gender Average overwork
4.0
8.1
7.1
5.7
6.4
4.5

Lease & Mobility
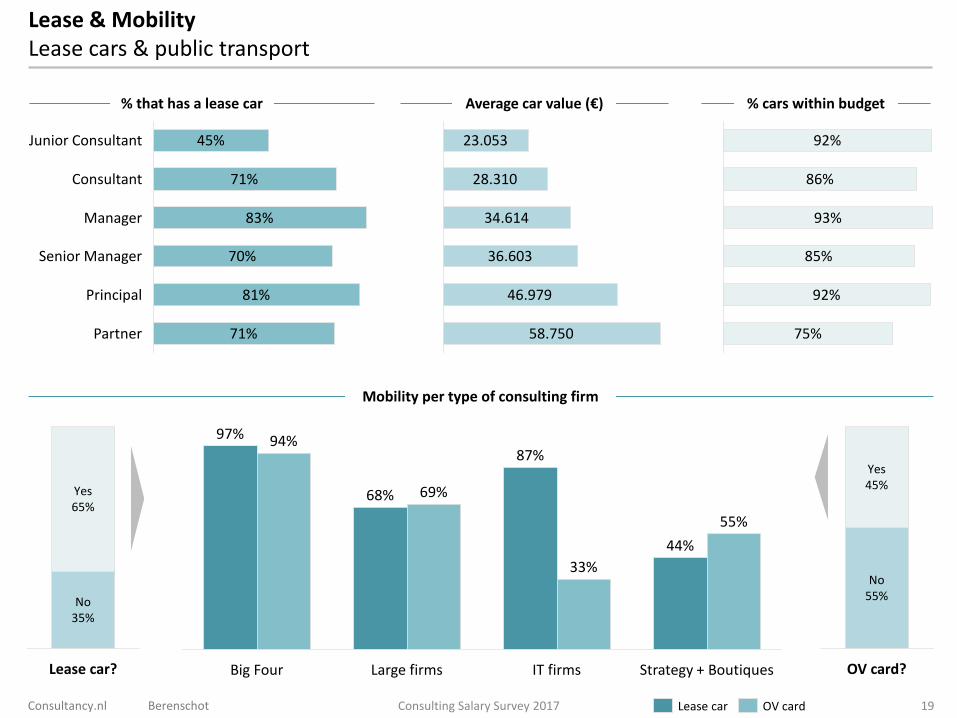
Lease & Mobility Lease cars & public transport
19 Consulting Salary Survey 2017 Consultancy.nl Berenschot
45%
70%
Partner
Manager
71%
83%
Principal
Consultant
81%
71%
Senior Manager
Junior Consultant 23.053
36.603
58.750
34.614
46.979
28.310
75%
92%
85%
93%
86%
92%
Yes 65%
No 35%
Lease car? OV card?
No 55%
Yes 45%
Large firms
94%
69% 68%
Strategy + Boutiques
55%
87%
33%
IT firms
44%
Big Four
97%
Lease car OV card
% that has a lease car Average car value (€) % cars within budget
Mobility per type of consulting firm
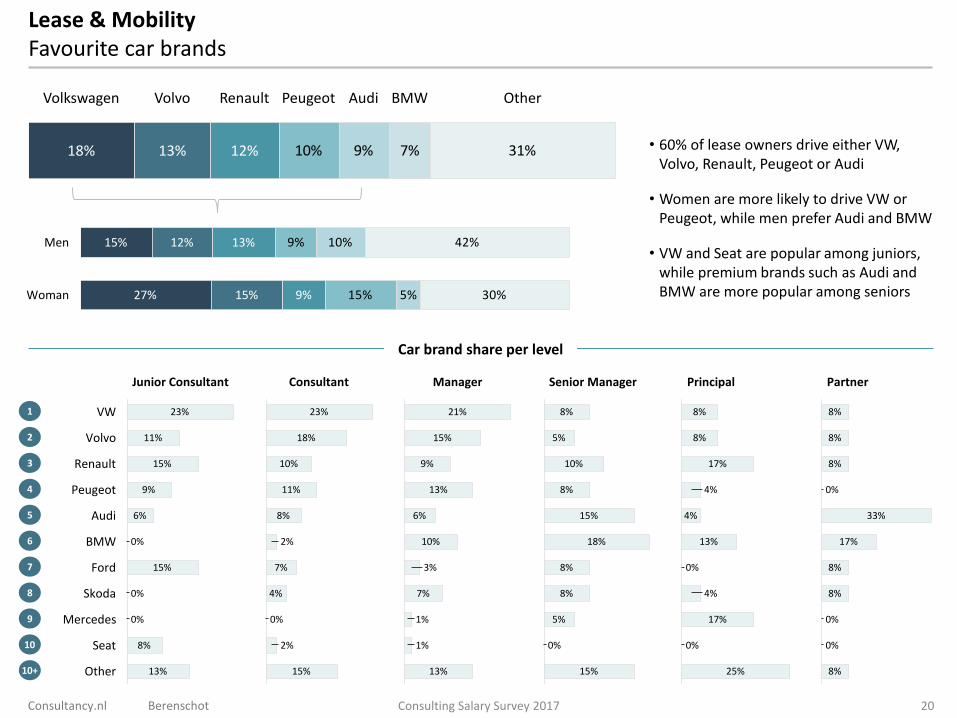
Lease & Mobility Favourite car brands
20 Consulting Salary Survey 2017 Consultancy.nl Berenschot
10% 9% 7% 31%
Volkswagen Volvo Renault Peugeot Audi BMW Other
18% 13% 12%
9%
15%
10%
5%
42%
30%Woman 27% 15% 9%
Men 15% 12% 13%
Car brand share per level
Junior Consultant
Other 13%
Ford
8%
Skoda
0% Mercedes
0%
Seat
15%
BMW
Audi 6%
Peugeot 9%
Renault 15%
Volvo 11%
VW 23%
0%
Consultant
15%
2%
0%
4%
7%
2%
8%
11%
10%
18%
23%
Manager
13%
1%
1%
7%
3%
10%
6%
13%
9%
15%
21%
Senior Manager
15%
0%
5%
8%
8%
18%
15%
8%
10%
5%
8%
Principal
25%
17%
4%
0%
13%
4%
4%
17%
8%
8%
0%
Partner
8%
8%
17%
0%
8%
8%
8%
33%
8%
0%
0%
1
2
3
4
5
6
7
8
9
10
10+
• 60% of lease owners drive either VW, Volvo, Renault, Peugeot or Audi
• Women are more likely to drive VW or Peugeot, while men prefer Audi and BMW
• VW and Seat are popular among juniors, while premium brands such as Audi and BMW are more popular among seniors

Job Satisfaction

Job Satisfaction Satisfaction by function
22 Consulting Salary Survey 2017 Consultancy.nl Berenschot
Work-Life
Staff 4,1
Partner 3,6
Principal 3,5
Senior Manager
4,0
Manager 3,5
Consultant 3,7
Junior Consultant
3,8
Salary & Bonus
4,0
4,1
3,9
3,5
3,5
3,2
3,2
Secondary Benefits
4,0
4,1
3,8
3,8
3,6
3,6
3,5
Lease & OV
3,4
3,9
4,2
3,9
4,1
4,0
3,7
Part-time opportunities
4,3
3,9
3,8
4,0
3,5
3,3
3,1
Satisfaction by level and position (5 point scale)
3.7 3.4 3.9 3.6 3.4 Average
Consultants:

Job Satisfaction Satisfaction over time and by gender
23 Consulting Salary Survey 2017 Consultancy.nl Berenschot
Part-time opportunities
Lease and OV mobility
Secondary Benefits
Salary & Bonus
Work-Life Balance
2017 results versus 2014
Part-time opportunities
Lease and OV mobility
Secondary Benefits
Salary & Bonus
Work-Life Balance
Gender comparison: men versus women
Highly satisfied Absolutely not satisfied
2014 2017
Women Men
2014 2017 Women Men
Highly satisfied Absolutely not satisfied
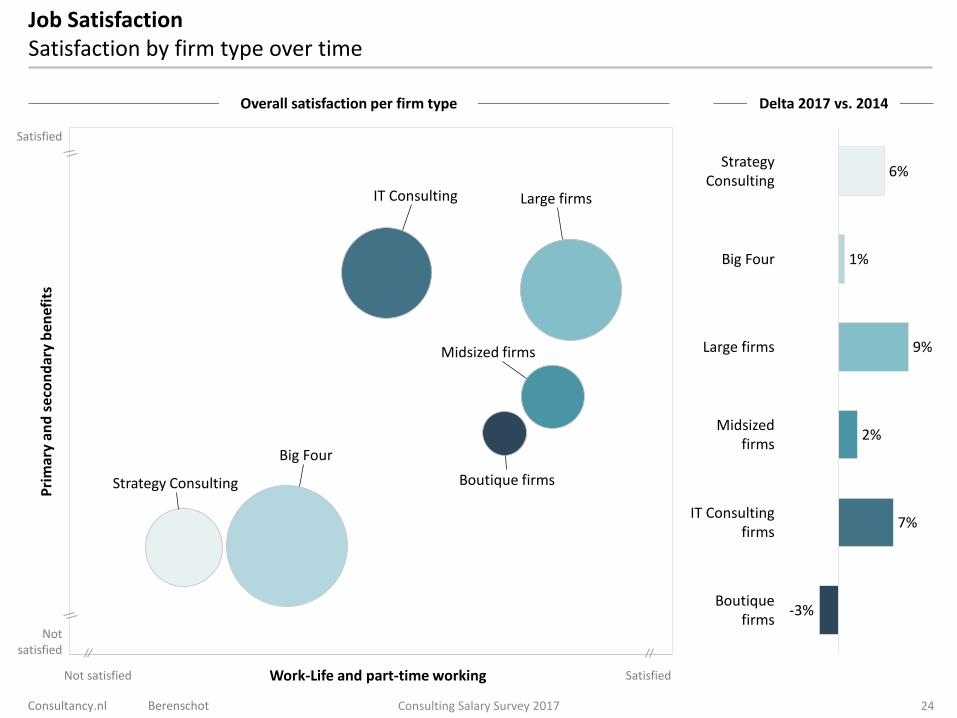
Job Satisfaction Satisfaction by firm type over time
24 Consulting Salary Survey 2017 Consultancy.nl Berenschot
2,9
Strategy Consulting
Big Four
Large firms
3,0
Midsized firms
Boutique firms
3,85
3,90
3,75
3,60
3,70
3,7
3,55
3,25
4,00
3,95
3,6 3,5
IT Consulting
3,65
3,80
3,3 3,2 3,1 3,4
3,35
3,50
3,45
3,40
3,8
3,30
Overall satisfaction per firm type
Pri
mar
y an
d s
eco
nd
ary
ben
efit
s
Work-Life and part-time working
7%
2% Midsized
firms
Large firms
-3%
IT Consulting firms
Boutique firms
9%
1%
Strategy Consulting
6%
Big Four
Delta 2017 vs. 2014
Satisfied Not satisfied
Not satisfied
Satisfied

Changing Jobs

Changing Jobs The labour market for consultants
26 Consulting Salary Survey 2017 Consultancy.nl Berenschot
No
Yes
No sight
Is the consulting labour market improving?
3%
86%
11%
A growing number of colleagues is leaving
28%
I’m seeing a growing number of job openings
33%
I’m receiving more calls from headhunters
48%
We are searching for consultants ourselves
57%
Main signals highlighting improvement
Principal
Manager
Partner
Senior Manager
Consultant
Junior Consultant
24%
27%
41%
49%
46%
24%
30%
Strategy
34%
32%
Data Analytics
Lean / Process Management
Finance & Risk 38%
IT Consulting 44%
Corporate Finance / M&A 50%
Which consultants are being called most? (% of total)
Why?
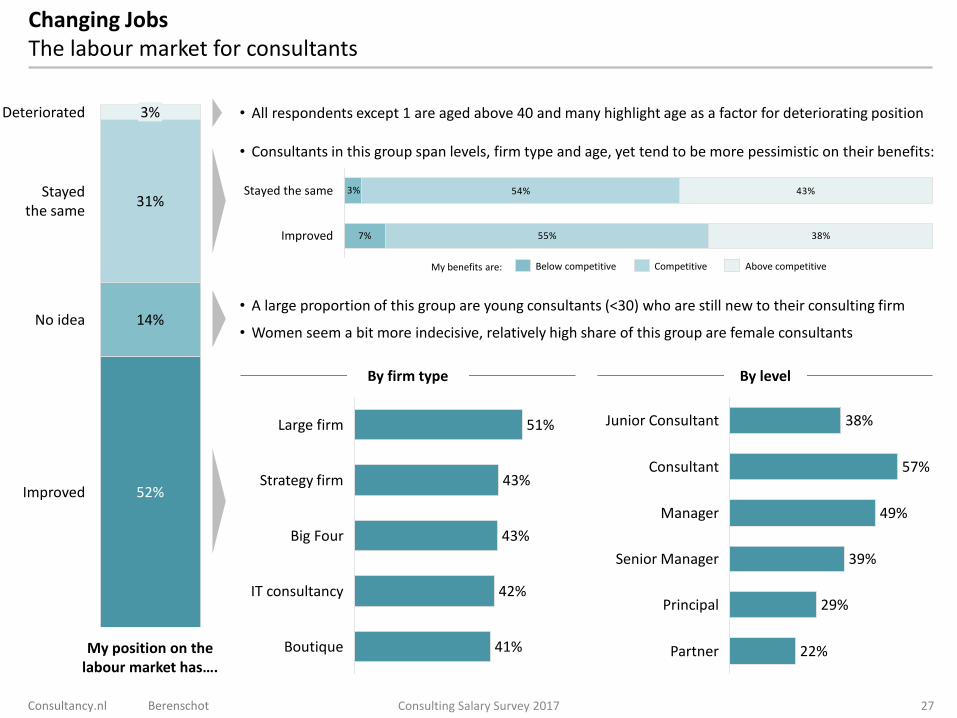
Changing Jobs The labour market for consultants
27 Consulting Salary Survey 2017 Consultancy.nl Berenschot
Stayed the same
31%
14%
Improved
No idea
My position on the labour market has….
Deteriorated
52%
3% • All respondents except 1 are aged above 40 and many highlight age as a factor for deteriorating position
57%
38%
22%
29%
Partner
39%
Manager 49%
Principal
Consultant
Senior Manager
Junior Consultant
By level By firm type
Boutique 41%
IT consultancy 42%
Big Four 43%
Strategy firm 43%
Large firm 51%
• A large proportion of this group are young consultants (<30) who are still new to their consulting firm
• Women seem a bit more indecisive, relatively high share of this group are female consultants
• Consultants in this group span levels, firm type and age, yet tend to be more pessimistic on their benefits:
7%
54%
55%
43%
38%
3%Stayed the same
Improved
Above competitive Competitive Below competitive My benefits are:

Changing Jobs Searching for a new job?
28 Consulting Salary Survey 2017 Consultancy.nl Berenschot
Main drivers for seeking a new job
Looking for a new job?
No 83%
Yes 17%
Where do you want to move to? Methods of finding your new job
40%
14%
47%
Own Business / Freelance
Move out of consulting
Stay in consulting
Events 0%
Social Media 32%
Online Jobsites 27%
Headhunter 37%
Own Network 73%
Working environment
Better salary
62%
Career development
38% 41%
20% 22%
13%
Company reputation
19%
11%
22%
Closer to home Secondary benefits
8%
Other Promotion
15%
3% 7%
17%
2% 1%
2017
2014
Why do totals differ? Maximum of 3 choices could be highlighted. Interestingly, respondents in 2017 ticked
on average ~2 options, compared to ~1 in 2014

Changing Jobs New job: gender and level preferences
29 Consulting Salary Survey 2017 Consultancy.nl Berenschot
Gender comparison: men versus women
Promotion
9% 18%
Closer to home
39%
10%
Working environment
-9
24%
Better salary
35% 44%
Career development
48%
68%
+29
-7
-20
Other
22% 18%
Secondary benefits
4% 10%
Company reputation
9% 12% 17%
Female
Male
Junior Consultant
26%
11%
6%
26%
39%
Principal + Partner
Other
Closer to home
Working environment
Better salary
Career development 31%
40%
0%
30%
0%
30%
Senior Manager
17%
9%
13%
22%
Manager
24%
14%
14%
22%
24%
24%
Consultant
22%
10%
10%
36%
Preferences by level

Independent Consultants

Independent consultants Respondent base (only freelancers)
31 Consulting Salary Survey 2017 Consultancy.nl Berenschot
23% 63% 9%
Other HBO WO MBA PhD
7
6
In consulting
As a freelancer
~13 years
44
No
Yes
Affiliated with firm?
76%
24%
No
Yes
Use of platforms?
80%
20%
No
Yes
Modelovereenkomst?
59%
41%
37%
No, still active without modelovereenkomst
56%
7% Yes, project stopped
No, still active with modelovereenkomst
Lost a project because of DBA?
Average age Consulting experience Educational background
Wet DBA Affiliations and use of platforms
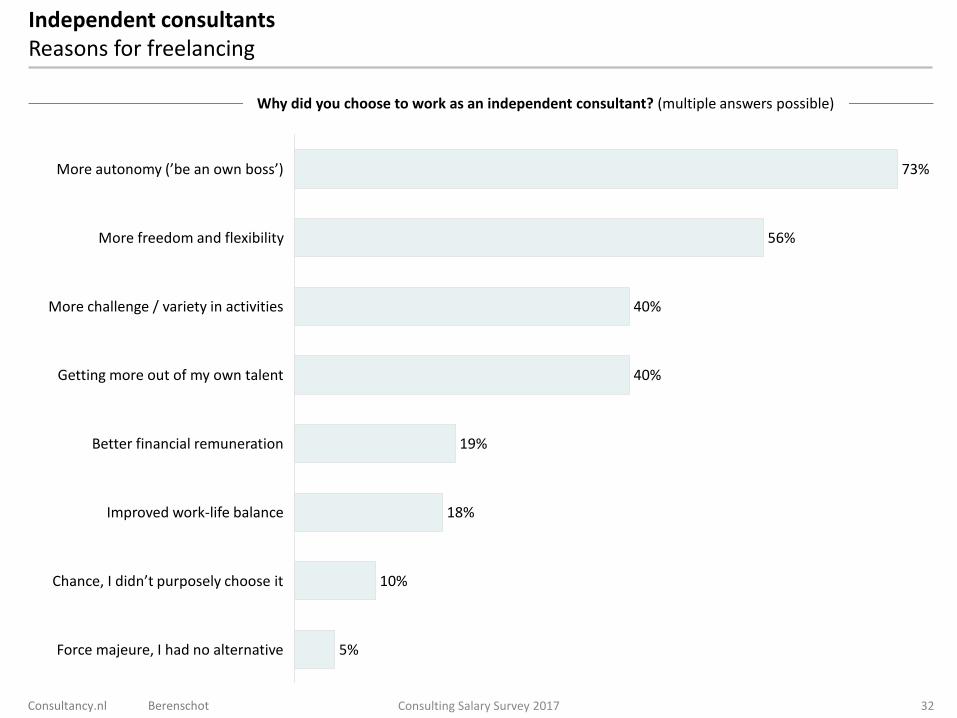
Independent consultants Reasons for freelancing
32 Consulting Salary Survey 2017
Why did you choose to work as an independent consultant? (multiple answers possible)
Consultancy.nl Berenschot
19%
40%
56%
18%
Getting more out of my own talent
Force majeure, I had no alternative
40%
Better financial remuneration
5%
10%
More autonomy (’be an own boss’)
More freedom and flexibility
More challenge / variety in activities
Improved work-life balance
73%
Chance, I didn’t purposely choose it

Independent consultants Job satisfaction
4% 9% 39% 49%
33 Consulting Salary Survey 2017 Consultancy.nl Berenschot
(Very) unsatisfied Neutral Satisfied Very satisfied
Satisfied with working as a freelancer?
61% 14% 17% 5%
Satisfied with the income?
No Yes, outside consulting Yes, at a consultancy
14% 75% 11%
Considering (returning to) fixed employment?
1 Working in teams 2 Larger projects 3 Personal development 4 More certainty

Independent consultants Performance over the past year
34 Consulting Salary Survey 2017 Consultancy.nl Berenschot
How have chargeability and hourly rates developed over the past 12 months?
51%
Increased
15%
34%
10%
Stayed the same Decreased
64%
25%
Hourly rate
Chargeability
71%
€111
Average hourly rate
Average chargeability

Independent consultants Expectations for coming year
35 Consulting Salary Survey 2017 Consultancy.nl Berenschot
4%
42%
4%
Will increase
11%
Remain stable
Reduce significantly
40%
Will reduce
Increase signifcantly
Expectations for demand in the coming 12 months?
33%
62%
Increase
Decrease
5%
Stay the same
Expectations for fees in the coming 12 months?

Demographics

Demographics Respondent base
37 Consulting Salary Survey 2017 Consultancy.nl Berenschot
4
81%
19%
41 - 50
36%
61+
74%
27%
64%
51 - 60
42
36 - 40
44%
56%
31 - 35
26%
73%
26 - 30
197
125
78 90
20 - 25
56
93%
Female
Male
29
64
18
34
59
87
140
135
Manager
Principal
Support staff
Senior Manager
Junior Consultant
Consultant
Partner
Freelancer
5% 6% 15% 3% 32% 23% 5% 11%
Strategy consultancy
Big Four firm
Large consulting firm
IT consulting firm
Midsized consulting firm
Boutique firm
Other firm
Freelancer
Age and gender Job title
Type of company (by % of respondents)

Demographics Focus areas of consultants
38 Consulting Salary Survey 2017 Consultancy.nl Berenschot
Corporate Finance / M&A 2%
Other 9%
Procurement / Supply Chain 3%
Sales & Marketing 4%
Data Analytics 4%
Finance & Risk 6%
Human Capital 6%
IT Consulting 9%
Lean / Process Management 13%
Strategy 20%
Project Management 20%
Main competency areas Industry focus
Other 4%
Oil & Gas 1%
Entertainment & Media 1%
Automotive 1%
Telecom 1%
Construction 2%
Pharma & Life Sciences 2%
Technology 3%
SME / Family Business 3%
Education 3%
Transport & Logistics 4%
ICT 4%
Energy 5%
Industry 5%
Healthcare 6%
Retail / FMCG 7%
Professional Services 10%
Public Sector 18%
Financial Services 20%

Demographics Educational background
39 Consulting Salary Survey 2017 Consultancy.nl Berenschot
Other
HBO
WO Bachelor
WO Master
MBA
PhD
Education
12%
3%
78%
4% 2%
Computer Science/Technology
Business Administration
Other
Physics and Natural Sciences 3%
Engineering
Social Sciences
Public Administration
Business Economics/Economics 15%
35%
Specialisation
21%
5%
5%
9%
9%

Appendix

Appendix About the study
41 Consulting Salary Survey 2017 Consultancy.nl Berenschot
The ‘Consulting Salary Survey 2017’ study looks into the compensation & benefits and other human capital trends in the Dutch management consulting sector. The analysis spans among others salaries, secondary benefits, work-life balance, lease & mobility, employee satisfaction and job mobility. The study builds on similar research conducted in 2014, with some analyses referring back to the previous study for comparison purposes. Research methodology:
• The survey was distributed through Consultancy.nl channels – mailings, network, website, newsletter and social media
• Consultants participated with the research on their own title, the research is independent from consulting firms
• In total 732 respondents (consultants and freelancers) filled in the survey. After a thorough data validation process (including filtering of target audience, data completeness, consistency and quality), the population size has been set at 530
• Note that some findings may be coupled with low(er) statistical validity. It is advised to interpret the data in a prudent manner
We would naturally like to thank all participants and consulting firms that have actively promoted participation among their employees. For any questions on the research: Consultancy.nl – [email protected] | Berenschot – [email protected] Whether you are a consultant, partner, staff professional or student with the ambition of joining the consultancy market, we hope that the research provides you with valuable insights. Larry Zeenny Consultancy.nl
Hans van der Spek Berenschot
&

Appendix The authors
42 Consulting Salary Survey 2017 Consultancy.nl Berenschot
Larry Zeenny (1981) obtained a MSc. in General Management from Nyenrode Universiteit and a MSc. in Economics from Maastricht University. In 2005 he joined Deloitte Consulting, where he worked for approximately eight years. He has contributed to dozens of consulting projects in the area of strategy, mergers & acquisitions, sales & marketing, operations and human capital. Larry is the owner of among others the consulting platforms Consultancy.nl and Consultancy.uk.
Consultancy.nl
Berenschot
Hans van der Spek (1961) studied Bedrijfseconomie at the HEAO in Zwolle. After his graduation he worked for several years in the areas of Finance, IT and HR. Parallel to his professional career, he successfully completed the studies AMBI (ICT) and the MSc. Management Consultancy at the VU Amsterdam. Since 2009 Hans works as management consultant for Berenschot, running HR-related projects. In his role as Manager of the HCM Knowledge Center Hans is responsible for several trend- and salary surveys.
Hella Sylva (1983) graduated in Labour and Organizational Psychology, after which she worked as a PhD candidate for the Amsterdam Business School. During her academic spell, she performed research and provided education in the HR-domain. Since 2012 she works for Berenschot, where she focuses on projects in the area of strategic HR planning, benchmarking and total rewards. Hella is in addition involved with several trend- and salary surveys.
Bas Looijestein (1981) studied Communication & Multimedia Design in The Hague. He started his career in the marketing industry, working with three creative design agencies before transitioning into a role as an independent consultant. Bas has worked as a digital and creative specialist for leading organisations across a wide range of sectors. Bas is the owner of among others the consulting platforms Consultancy.nl and Consultancy.uk.

Appendix About Consultancy.nl
43 Consulting Salary Survey 2017 Consultancy.nl Berenschot
1,100 followers 9,300 followers 1,300 followers 8,000+ members

Consultancy.nl Hogehilweg 8
Keynes gebouw, Arena Boulevard
1101 CC Amsterdam, Nederland
Tel: 020 36 36 299
Email: [email protected]
Internet: www.consultancy.nl
Copyright © 2017 Consultancy.nl and Berenschot. All rights reserved
Berenschot Europalaan 40
3526 KS Utrecht
Nederland
Tel: 030 291 68 43
Email: [email protected]
Internet: www.berenschot.nl