Tips & Tricks GPC/SEC: Calibration Using Broad · PDF fileTips & Tricks GPC/SEC: Calibration...
6
Tips & Tricks GPC/SEC: Calibration Using Broad Standards For polymeric materials where no narrowly distributed molar mass standards are available, reliable and true molar masses can be obtained using well characterized samples of broad molar mass distribution. This approach does not require additional instrumentation and offers an alternative to using molar mass sensitive detectors such as on-line light scattering or on-line viscometry detectors. Wolfgang Radke and Daniela Held, PSS Polymer Standards Service GmbH, Mainz, Germany. Gel permeation chromatography/ size-exclusion chromatography (GPC/SEC) is an easy and robust method to determine molar masses and molar mass distributions (MMD) of macromolecules. The separation is based on the size of macromolecules in solution — the larger the macromolecule, the earlier it elutes from the column. The primary information generated by GPC/SEC is the chromatogram showing the detector signal as a function of elution volume. To derive the molar mass distribution, the chromatogram has to be converted using a calibration curve that relates elution volume to the molar mass of the eluting polymer. Calibration curves are usually established using narrowly distributed polymer standards; however, chemically different polymers of the same molar mass often exhibit very different sizes in solution. Correct molar masses are therefore only obtained if the chemical structure of the calibrant matches the structure of the analyte. Unfortunately, for a large number of important polymers (for example, polyamides, polyesters, or polyolefins), narrow standards are not commercially available and alternative methods are required. The use of a molar mass sensitive detector is one option but it requires additional expensive instrumentation, more precise and accurate sample preparation, more time, and a greater level of knowledge about data evaluation. These limitations are especially crucial for quality control laboratories because fast, robust, and easy-to use calibration methods are required. A suitable, cost-effective solution is the use of broadly distributed standards. Photo Credit: CGinspiration/Getty Images 10 Pittcon 2015 Preview 2 News 7 Tips & Tricks: GPC/SEC 10 Q&A: Haselberg 16 7 10 0 The LCGC Blog 20 CHROMacademy 23 Training & Events 24 Staff 25 23 23 24 2
Transcript of Tips & Tricks GPC/SEC: Calibration Using Broad · PDF fileTips & Tricks GPC/SEC: Calibration...
Tips & Tricks GPC/SEC: Calibration Using Broad Standards
For polymeric materials where no narrowly distributed molar mass standards are available, reliable and true molar masses
can be obtained using well characterized samples of broad molar mass distribution. This approach does not require additional
instrumentation and offers an alternative to using molar mass sensitive detectors such as on-line light scattering or on-line
viscometry detectors.
Wolfgang Radke and Daniela Held, PSS Polymer Standards Service GmbH, Mainz, Germany.
Gel permeation chromatography/
size-exclusion chromatography (GPC/SEC)
is an easy and robust method to determine
molar masses and molar mass distributions
(MMD) of macromolecules. The separation
is based on the size of macromolecules in
solution — the larger the macromolecule,
the earlier it elutes from the column.
The primary information generated by
GPC/SEC is the chromatogram showing
the detector signal as a function of
elution volume. To derive the molar mass
distribution, the chromatogram has to be
converted using a calibration curve that
relates elution volume to the molar mass
of the eluting polymer. Calibration curves
are usually established using narrowly
distributed polymer standards; however,
chemically different polymers of the same
molar mass often exhibit very different
sizes in solution. Correct molar masses are
therefore only obtained if the chemical
structure of the calibrant matches the
structure of the analyte.
Unfortunately, for a large number
of important polymers (for example,
polyamides, polyesters, or polyolefins),
narrow standards are not commercially
available and alternative methods are
required. The use of a molar mass
sensitive detector is one option
but it requires additional expensive
instrumentation, more precise and
accurate sample preparation, more time,
and a greater level of knowledge about
data evaluation.
These limitations are especially crucial
for quality control laboratories because
fast, robust, and easy-to use calibration
methods are required. A suitable,
cost-effective solution is the use of broadly
distributed standards. Ph
oto
Cre
dit
: C
Gin
spir
ati
on
/Ge
tty I
ma
ge
s
10
Pittcon 2015 Preview2 News7 Tips & Tricks: GPC/SEC10 Q&A: Haselberg167 100The LCGC Blog20 CHROMacademy23 Training & Events24 Staff252323 242
The Column www.chromatographyonline.com
Calibration Using Broad Samples —
How Does It Work?
For a narrowly distributed polymer, the
maximum peak of the chromatogram
can be easily identifi ed and assigned. In
addition, we can assume Mw ≈ Mn ≈ Mp.
This is not the case for a broadly distributed
sample. Here, the maximum can be
diffi cult to precisely identify because it can
depend on the resolution of the separation
columns. It is therefore not recommended
to establish the calibration curve by simply
plotting the molar masses versus the elution
volume at peak maximum.
The generally accepted concept of
universal calibration1 in GPC/SEC results
in the following relationship for the
calibrations curves of the calibrant and
the analyte:
[1]log M analyte log M calibrantA �+= B
106
Elution volume (mL)
Mo
lar
ma
ss (
g/m
ol) 105
104
103
10 15 20 25
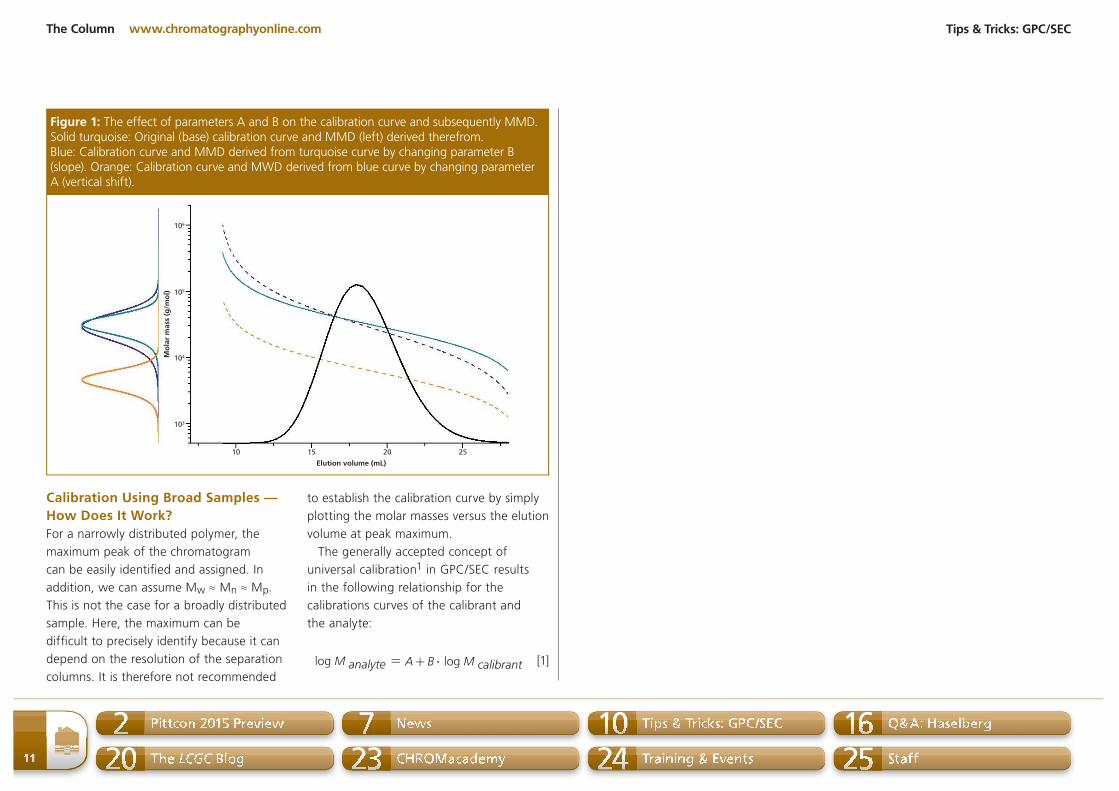
Figure 1: The effect of parameters A and B on the calibration curve and subsequently MMD. Solid turquoise: Original (base) calibration curve and MMD (left) derived therefrom. Blue: Calibration curve and MMD derived from turquoise curve by changing parameter B (slope). Orange: Calibration curve and MWD derived from blue curve by changing parameter A (vertical shift).
Tips & Tricks: GPC/SEC
11
Pittcon 2015 Preview2 News7 Tips & Tricks: GPC/SEC10 Q&A: Haselberg167 100The LCGC Blog20 CHROMacademy23 Training & Events24 Staff252323 242
LCGC Web VideosTUNE IN TODAY!
ChromTube is LCGC’s platform
for informative videos from
premier suppliers in the
separation science field. Watch
videos in your areas of interest:
Mass Spec, Sample Prep, GC,
and HPLC/UHPLC .
LCGC TV’s editorial videos bring
you insights from leading
analytical scientists, updates on
new research and methods as
well as best practices and
practical advice you can apply
in your lab.
WATCH NOW!LCGC TV: www.chromatographyonline.com/lcgctv
ChromTube: www.chromatographyonline.com/chromtube
The Column www.chromatographyonline.com
This is based on the assumption that
both calibrant and analyte elute without
interacting with the stationary phase.
The parameter A shifts the calibration
curve vertically relative to the calibration
curve, while a change in B varies the
slope of the calibration curve (Figure 1).
The parameter A and B are related to the
Mark–Houwink parameters of the analyte
and calibrant in the respective solvent.2–5
Because of the effect of parameters A and
B on the calibration curve, the MMD and
consequently the molar mass averages
calculated for a given chromatogram
change as a function of the parameters
as well.
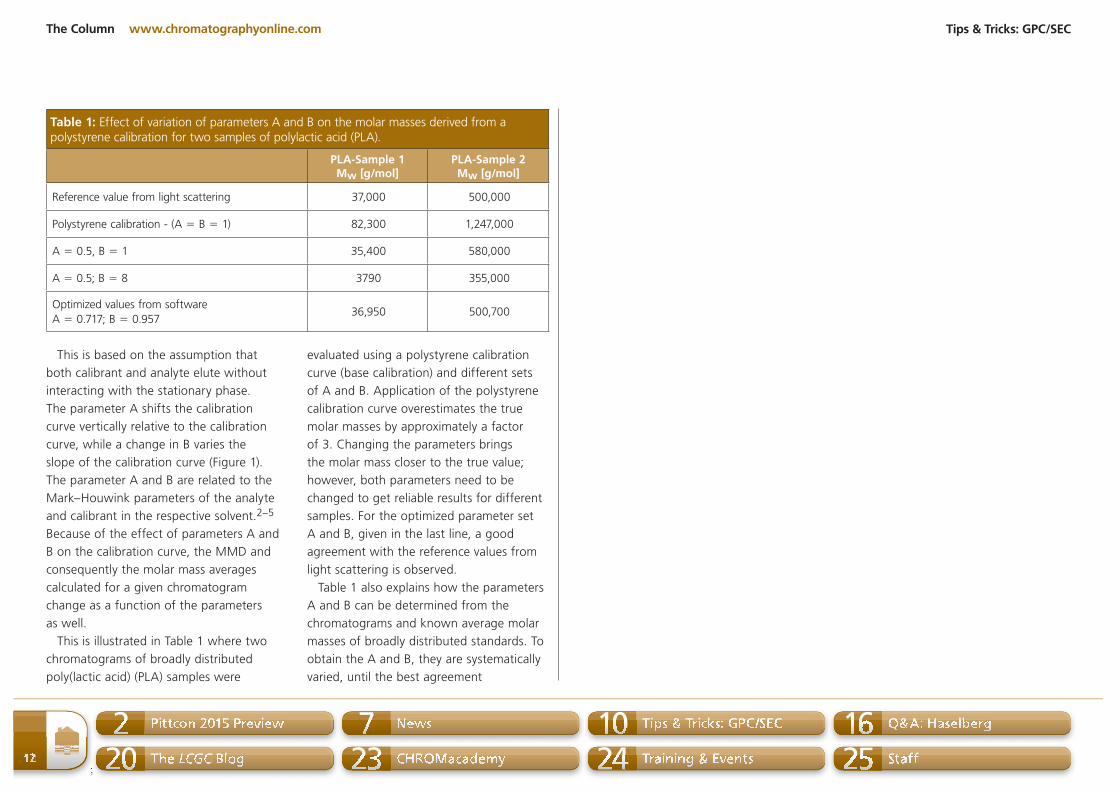
This is illustrated in Table 1 where two
chromatograms of broadly distributed
poly(lactic acid) (PLA) samples were
evaluated using a polystyrene calibration
curve (base calibration) and different sets
of A and B. Application of the polystyrene
calibration curve overestimates the true
molar masses by approximately a factor
of 3. Changing the parameters brings
the molar mass closer to the true value;
however, both parameters need to be
changed to get reliable results for different
samples. For the optimized parameter set
A and B, given in the last line, a good
agreement with the reference values from
light scattering is observed.
Table 1 also explains how the parameters
A and B can be determined from the
chromatograms and known average molar
masses of broadly distributed standards. To
obtain the A and B, they are systematically
varied, until the best agreement
Table 1: Effect of variation of parameters A and B on the molar masses derived from a polystyrene calibration for two samples of polylactic acid (PLA).
PLA-Sample 1Mw [g/mol]
PLA-Sample 2Mw [g/mol]
Reference value from light scattering 37,000 500,000
Polystyrene calibration - (A = B = 1) 82,300 1,247,000
A = 0.5, B = 1 35,400 580,000
A = 0.5; B = 8 3790 355,000
Optimized values from software
A = 0.717; B = 0.95736,950 500,700
Tips & Tricks: GPC/SEC
12
Pittcon 2015 Preview2 News7 Tips & Tricks: GPC/SEC10 Q&A: Haselberg167 100The LCGC Blog20 CHROMacademy23 Training & Events24 Staff252323 242
5
3rdAnnual
CHROMATOGRAPHY COMMUNITY MIXERJoin chromatographers from around the
world as we gather in the spirit of
fellowship and collaboration!
EVENT DETAILS<��&.02*"-�40�4)&�-"4&��&02(&3��5*0$)0/
<��*6&�.53*$�#9��2"..9�/0.*/"4&%�=�04����2"33��"/%>�
<�=�&$0/%��*/&>�+"::�1"2"%&
<��"33&%�)023�%>0&562&3�"/%�$2&0-&�$5*3*/&�#5''&4
<��1&/�#"2�
<��0..&.02"4*6&�(*'4�#"(
WHEN�5&3%"9���"2$)����������'20.� ���� ��1.�
WHERE�&/&2"4*0/3��"--�������/%2&7��*((*/3��2���&7��2-&"/3����������
TICKETS REQUIRED FOR ENTRY *3*4�"/9�0'�052�12&.*&2�310/3023�"4��*44$0/�40�$0--&$4�9052�4*$,&4 �
FOR MORE INFORMATION, CONTACT:
�0/"4)"/��%&-."/�;��&- ���������������."*- ��*44$0/.*8&2�(."*-�$0.
ORGANIZING SPONSORS:
��� ��!����������������������������������
MEDIA SPONSOR:
The Column www.chromatographyonline.com
between the known molar masses and
the ones calculated from the respective
chromatograms, the base calibration, and
the parameters is obtained.
Fortunately this variation can be
automated with GPC/SEC software
packages. With the obtained parameters,
a suitable calibration curve for unknown
samples of the same structure as the
analyte can be easily derived from the
base calibration.
In contrast to other approaches for broad
standards calibration, the above approach
benefi ts from the fact that the base
calibration reveals the pore size distribution
of the column packing and therefore
the true shape of the calibration curve.
In particular the method preserves the
non-linear shape, the exclusion volume, and
the separation limit of the base calibration
curve. An additional advantage is that more
than one sample can be used to create the
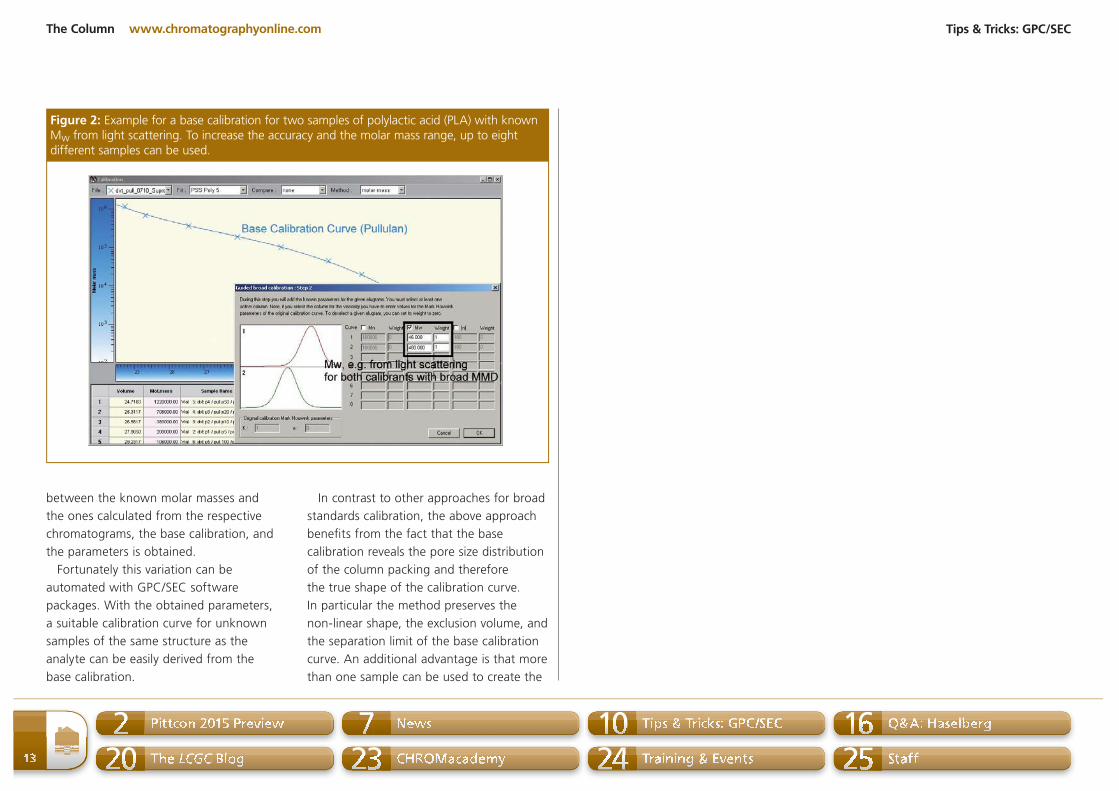
Figure 2: Example for a base calibration for two samples of polylactic acid (PLA) with known Mw from light scattering. To increase the accuracy and the molar mass range, up to eight different samples can be used.
Tips & Tricks: GPC/SEC
13
Pittcon 2015 Preview2 News7 Tips & Tricks: GPC/SEC10 Q&A: Haselberg167 100The LCGC Blog20 CHROMacademy23 Training & Events24 Staff252323 242
The Column www.chromatographyonline.com
calibration curve. This increases accuracy
and allows a wider molar mass range
to be covered.
How to Establish a Calibration Using
Broad Standards
Establishing a calibration curve by the
above procedure requires:
t� A base curve established using narrowly
distributed standards of arbitrary
chemical structure, such as polystyrene
for many organic solvents or pullulan of
poly(ethylene oxide)/poly(ethylene glycol)
(PEO/PEG) for aqueous applications.
t� At least one broadly distributed sample
with known Mw and Mn values of
the same chemical structure as the
analytes to be characterized. If two
or more broadly distributed samples
are used one molar mass average
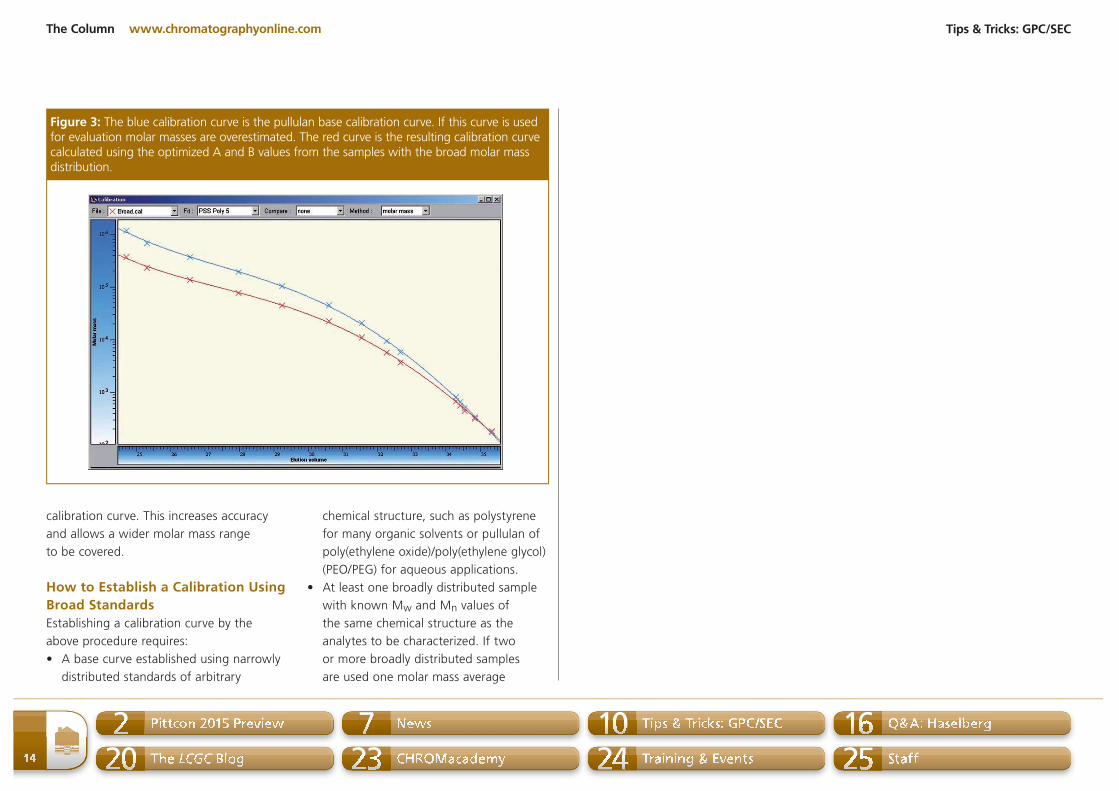
Figure 3: The blue calibration curve is the pullulan base calibration curve. If this curve is used for evaluation molar masses are overestimated. The red curve is the resulting calibration curve calculated using the optimized A and B values from the samples with the broad molar mass distribution.
Tips & Tricks: GPC/SEC
14
Pittcon 2015 Preview2 News7 Tips & Tricks: GPC/SEC10 Q&A: Haselberg167 100The LCGC Blog20 CHROMacademy23 Training & Events24 Staff252323 242
Lifetime Achievement and Emerging Leader in Chromatography Awards
8th Annual LCGC Awards at Pittcon 2015
Visit LCGC, LCGC’s CHROMacademy and Spectroscopy at Booth #2401
For more information, please visit www.chromatographyonline.com
The winner of the 2015 Lifetime Achievement award
is Jack Kirkland.
The Lifetime Achievement award
honors a seasoned professional for
a lifetime of contributions to the advancement of
chromatographic techniques and applications.
The winner of the 2015 Emerging Leader Award is Caroline West.
This award recognizes the achievements and aspirations of a talented young separation scientist who has made strides early in his or her career toward the advancement of chromatographic techniques and applications.
JOIN LCGC AT A NEW PITTCON AWARDS SYMPOSIUMMonday, MARCH 9, 1:30PM – 4:45PM
The Column www.chromatographyonline.com
(such as Mw or Mn) per sample is
suffi cient.
The procedure then is straightforward:
t� Run the narrowly and the broadly
distributed standards on your GPC/SEC
system.
t� Establish the base calibration using the
molar masses (Mp) and peak maxima of
the narrowly distributed calibrants.6
t� Use a software tool to shift the
calibration curve and adjust the slope
so that the calibration provides correct
results for the broadly distributed
samples. This means that the software
internally determines the optimized
parameters A and B using the
chromatograms of the broad standards
and applying the known molar mass
averages.
t� Save this calibration curve so that it can
be used to determine the complete molar
mass distribution and the true molar
mass averages of samples with unknown
molar masses.
Figure 2 shows the chromatograms of
the broadly distributed standards as well as
what is required to use the broad standards
calibration concept. To increase the accuracy
of the calibration, more than one broadly
distributed standard should be used. If a
wide molar mass range needs to be covered
the use of several samples is recommended.
Figure 3 shows a comparison of the base
calibration (blue) and the resulting calibration
curve after determination of A and B (red).
This calibration curve is then used for the
evaluation of unknown samples and it provides
true molar masses for all samples of this type.
How to Get Broad Standards
A limited number of broad standards for
a variety of chemical structures is available
from suppliers. If no broad standards are
commercially available, sample testing
laboratories or the R&D department can
determine true molar mass using conventional
batch measurements for example, by light
scattering, nuclear magnetic resonance
(NMR), or osmometry. On-line determination
using multidetection GPC/SEC can also solve
this problem.
Summary
t�Calibration using broad standards is a fast
and easy-to-use method for quality control
laboratories.
t�Standards with a broad molar mass
distribution can be easily obtained from
contract analysis laboratories or the R&D
department using batch methods. This
allows the measurement of precise and
accurate molar masses worldwide.
E-mail: [email protected]: www.pss-polymer.com
References
1. Z. Grubisic, P. Rempp, and H. Benoît, Journal
of Polymer Science, Part B: Polymer Letters
5(9), 753–759 (1967).
2. S. Mori, Anal. Chem. 53, 1813–1818 (1981).
3. H.K. Mahabadi and K.F. O´Driscoll, J. Appl.
Polym. Sci. 21, 1283–1287 (1977).
4. A.R. Weiss and E. Cohn-Ginsberg, Journal of
Polymer Science Part B: Polymer Letters 7(5),
379–381 (1969).
5. W. Radke, in Macromolecular Engineering,
K.G. Matyjaszewski and L. Leibler, Eds.
(Wiley-VCH, Weinheim, Germany vol. 3), pp.
1881–1936.
6. D. Held, The Column 4(6), 18–21 (2008).
Daniela Held studied polymer chemistry
in Mainz, Germany, and works in the
PSS solutions department. She is also
responsible for PSS webinars, education
programmes, and customer training.
Wolfgang Radke studied polymer
chemistry in Mainz, Germany, and in
Amherst, Massachusetts, USA. He is now
head of the PSS application development
department. He is also responsible for the
PSS customer training programme and for
customized trainings.
Tips & Tricks: GPC/SEC
15
Pittcon 2015 Preview2 News7 Tips & Tricks: GPC/SEC10 Q&A: Haselberg167 100The LCGC Blog20 CHROMacademy23 Training & Events24 Staff252323 242
Make Your Lab Productivity Soar With the Right
Chromatography Data SystemON-DEMAND WEBCAST(originally aired January 27, 2015)
Register for free atwww.chromatographyonline.com/soar
EVENT OVERVIEW:
Today’s chromatography laboratory is faced with a growing
number of business challenges: reducing time-to-results, meeting
increasing requirements for regulatory compliance, maximizing
productivity through optimum instrument asset utilization, and
reducing operational
costs. Having the right
chromatography data
system (CDS) software
is critical to addressing
these challenges. Of
course, replacing an
existing CDS is a big
decision and requires lab
decision-makers to take
a number of key factors
into account.What are the factors one needs to consider when
selecting a CDS? In this webinar, we will share with you what is
involved in making the change and how you can prepare for it.
Additionally, you’ll learn how you can increase productivity in
your lab by using the significantly improved data analysis and
reporting features that the right CDS has to offer. Key questions
that indicate that you should tune into this web seminar include:
■ Is your software running on
an out-of-support operating
system?
■ Do you use programs like
Microsoft Excel for calculations
and reporting?
■ Are you unable to take
advantage of the latest
instrumentation due to lack of
software support?
Who Should Attend:
■ Decision Makers:
Analytical Services, Method
Development, Production,
QA/QC, R&D, Lab Manager,
Manager/Dept. Head,
Scientist/ Chemist, Technical
Decision Maker
■ This information is valuable for all companies planning to
upgrade the software in their labs
Presenters
Thomas SchmidtOpenLAB CDS Product Manager
Michael SpeziaSenior Professional Services Engineer
Lisa Sprague,Software and Informatics Product ManagerTechnology Transitions
Moderator
Laura BushEditorial Director, LCGC
Key Learning Objectives:
■ Learn of the many advantages a
move to the right CDS can offer
■ How you can reduce complexity
and improve efficiency in your lab
■ How to boost lab productivity by
simplifying operations
Sponsored by Presented by
For questions, contact Kristen Moore at [email protected]