Introduction to GPC - TA Instruments...Introduction to GPC Columns, Distributions, Sample Prep.,...
69
©2018 Waters Corporation 1 Introduction to GPC Columns, Distributions, Sample Prep., Calibration, What’s New
Transcript of Introduction to GPC - TA Instruments...Introduction to GPC Columns, Distributions, Sample Prep.,...

©2018 Waters Corporation 1
Introduction to GPC
Columns, Distributions,
Sample Prep., Calibration,
What’s New
©2018 Waters Corporation 2
High Performance Liquid Chromatography (HPLC) (mainly Size Exclusion
Chromatography, SEC)
Mass Spectroscopy (MS)
Thermal Analysis (TA)
Rheometry, Nuclear Magnetic Resonance spectroscopy (NMR), Fourier
Transform Infrared spectroscopy (FTIR)
Polymer Analysis Techniques

©2018 Waters Corporation 3
What is GPC?
Gel Permeation Chromatography (GPC) separates sample
molecules based upon their relative size in solution
Size Exclusion Chromatography (SEC)
Gel Filtration Chromatography (GFC)
GPC is an isocratic mode of separation
GPC is well-suited for polymer analysis – provides a “molecular
weight distribution”
Particles are Porous, rigid
polymeric materials
Big ones are not slowed down because they are too big to go into the pores, so they elute first

©2018 Waters Corporation 4
What is GPC?
The elution profile represents the molecular weight distribution based upon the
relative content of different molecular weights…
Based on size in solution
Elution Volume (retention time)
largest smallest
Mn Mw
Mz
Mz+1
Big Ones Come Out First M
ole
cu
lar W
eig
ht

©2018 Waters Corporation 5
Molecular weight averages are used to provide numerical differences between samples – Mn: Number average molecular weight
o At this point in the curve the number of molecules in the sample to left is equal to the number of molecules to the right
– Mw: Weight average molecular weight
o At this point in the curve the weight of the molecules to the left is equal to the weight of the molecules to the right
– Mz and Mz+1: these values are calculated based on molecular weight and abundance (obtained by ultracentrifugation and GPC software computation)
o The values are used for “comparison” purposes
• Known samples to unknown samples
These averages are statistical moments calculated from the molecular weight distribution curve
Some definitions

©2018 Waters Corporation 6
GPC calculates the MW distribution
of the polymer; this distribution can
be measured for:
– Mn can affect a polymer’s brittleness,
flow and compression properties.
– Mw is related to strength properties,
and impact resistance
– Mz is related to elongation and
flexibility, (Gumby - rubber)
– Mz+1 is related to die swell,
(extrusion parameter)
Molecular Weight Averages GPC Delivers all MW information with one experiment

©2018 Waters Corporation 7
Molecular Weight/
Physical Property Correlations
Property/Processs Parameter
Effect of High MW
Effect of Low MW
Impact Strength
Melt Viscosity
Processing Temp
Flex Life
Brittleness
Drawability
Softening Temp
Stress-crack Resistance
Melt Flow
Properties of Polymers

©2018 Waters Corporation 8
GPC Process –
Separates by Size in Solution
Sample
Polymer
Vo Vt
“Bank” of 3 GPC Columns
Molecular Weight Distribution Chromatogram
Big Ones Come Out First

©2018 Waters Corporation 9
What is happening inside a column?
BOCOF
Separation by size – Usually no chemical Retention mechanism

©2018 Waters Corporation 10
Basic Column Information
Columns are put together in series
to form a bank (>2)
Always put the highest pore size
column first (from the injector), and
smallest pore size column last
– This reduces back pressure on the
most fragile column (LMW column)
Ramp the flow up slowly –
0.1ml/minute – 1.0 ml/minute in
small increments*
Change over solvent at a
0.1ml/minute flow rate over night
Some applications at High Temperature >150° C

©2018 Waters Corporation 11
GPC Column Types
Organic vs. Aqueous GPC columns
Different Pore Sizes
Analytical vs. Preparative GPC columns
Conventional vs. Solvent efficient, and High speed GPC columns.

©2018 Waters Corporation 12
Basic GPC – typically a bank of 3 columns of different pore sizes to cover a broad MW range (as
needed)
Never use methanol or acetonitrile with Organic GPC columns because certain polar solvents will
shrink the column, causing it to void
– Note: Make sure to flush the complete system with solvent to be used before connecting the columns to
the system
Life time of the columns can be as long as ~ 1 year or more
Store the columns in the solvent used with the column bank kept together
Make sure that the end fittings on the column are tight to keep the column packing from drying out
Be careful not to drop the columns, because they are fragile
Filter sample solutions
Prevent air bubbles from getting into columns
Care and Use of GPC Columns

©2018 Waters Corporation 13
Polymer is dissolved in a solvent at a low concentration (<0.10% w/v)
Polymer solution passes through crosslinked, organic gel columns packed with controlled pore size particles.
Larger molecules do not fit into pores (they are excluded) and elute first
Vo : Exclusion volume
Vt : Total volume or Permeation volume
Exclusion principle assumes no adsorption of polymer molecules on packing material
Every polymer will be eluted between Vo and Vt
GPC Rules

©2018 Waters Corporation 14
Concentration
– Response ~ concentration, (C)
– Refractometer; N = (dn/dc) C
Structure-selective
– UV/Vis Detector (Also can use as concentration detector if sample has UV response), Lambert-Beer Law
– IR
Molecular weight sensitive
– Response ~ C x f(M)
– Light scattering: f(M) = M; M(C)
– Viscometer: f(M) = [] = kM; []C
• Where k, alpha are the Mark-Houwink constants
– Mass Spec.: f(M) = 1/M; C/M
Detectors in Polymer Chromatography

©2018 Waters Corporation 15
RI’s were among the first detectors used in LC/GPC, (late 1960’s)
Typically referred to as a “Universal Detector”
Detects all dissolved solutes – “non-specific”
Refractive index of any optical medium is defined as the ratio of the speed of light
in a vacuum to the speed of light in the medium
Detection based on the refractive index of a given analyte
Measures the difference in RI from the eluent to the dissolved sample, (differential
type)
– The greater the dRI, the stronger the signal
Sensitivity increase as RI difference increases
Refractive Index (RI) Definition
R S
©2018 Waters Corporation 16
High Sensitivity
High Selectivity
Gain information on chemical composition
Can be used in gradient mode
Excellent for most polymer additives
Linear response over a wide absorption range:
A = x l x C (Beer/Lambert)
Sometimes UV/Vis detection is used for
– Higher detection sensitivity.
– Copolymer analysis (usually coupled with RI detector)
– Under gradient elution condition.
UV/Vis Detection

©2018 Waters Corporation 17
Polystyrene Standards
UV Detection at 260nm
AU
0.00
0.01
0.02
0.03
0.04
0.05
0.06
0.07
0.08
0.09
0.10
0.11
0.12
0.13
0.14
0.15
0.16
Minutes
0.5 1.0 1.5 2.0 2.5 3.0 3.5 4.0 4.5 5.0 5.5 6.0 6.5 7.0
6.0mm X 15cm RT MB-M Column (1)
(Same Pore Size as Conventional Column Set)
Flowrate: THF at 0.60 ml/min
Injection Volume: 5 µl
Detector: 2487 UV @260nm
PS Standards 3,840,000
2,890,000
1,260,000
775,000
422,000
186,000
42,800
16,700
5,570
2,980
890
474
©2018 Waters Corporation 18
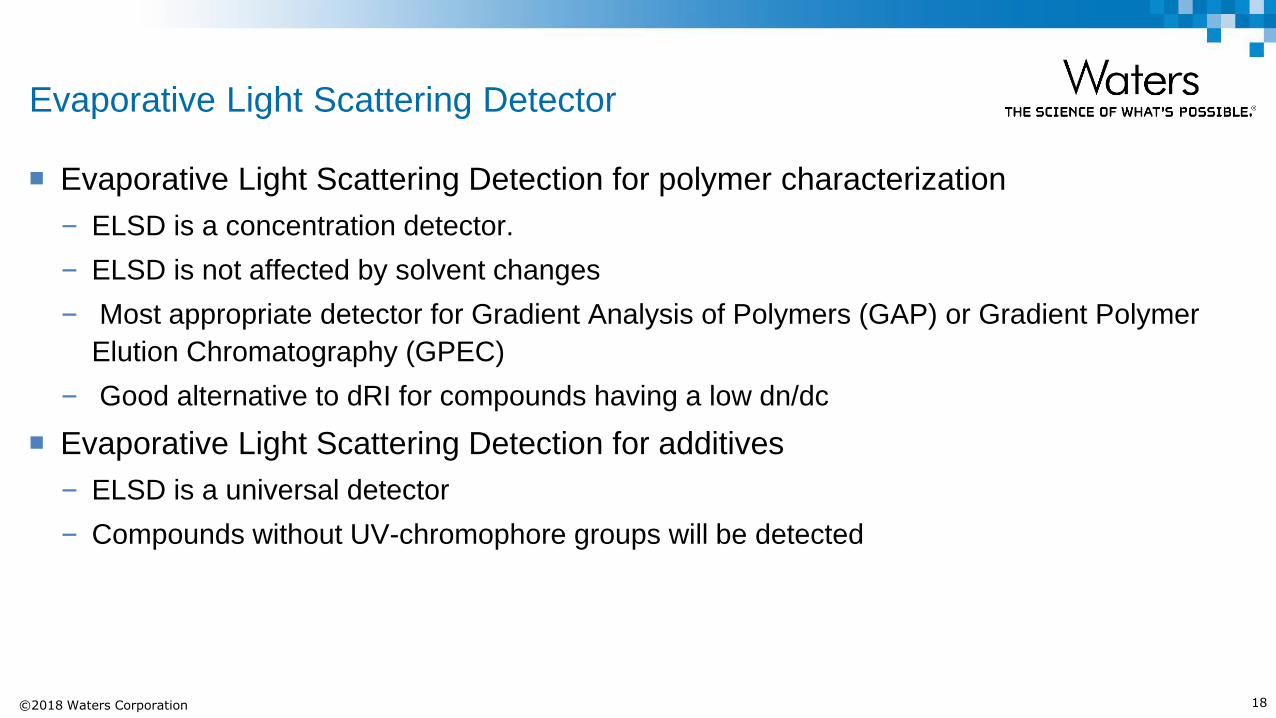
Evaporative Light Scattering Detection for polymer characterization
– ELSD is a concentration detector.
– ELSD is not affected by solvent changes
– Most appropriate detector for Gradient Analysis of Polymers (GAP) or Gradient Polymer
Elution Chromatography (GPEC)
– Good alternative to dRI for compounds having a low dn/dc
Evaporative Light Scattering Detection for additives
– ELSD is a universal detector
– Compounds without UV-chromophore groups will be detected
Evaporative Light Scattering Detector

©2018 Waters Corporation 19
Polymers are combined with low molecular compounds (0.1-3%)
Additives have several key functions :
– Protection : light stabilizers, antioxidants, anti-UV
– Safety : flame retardants
– Processing : plasticizers, slip agents
Full characterization of synthetic polymers involves detection of additives
Most of slip agents do not absorb UV light. ELS Detector is a good alternative to
UV detection
Evaporative Light Scattering Detector

©2018 Waters Corporation 20
Additives Mixture
Comparison of Detection Modes
Crodamide (oleamide) is
not detected in UV mode
5.00 10.00 15.00 20.00
Tin
uvin
312
Tin
uvin
P
BH
T
Luw
inox 4
4 B
25
Succonox 1
6
Naugard
445
Succonox 1
8 T
inuvin
328
Irganox 1
330
Irganox 1
076
Irgafo
s 1
68
Minutes
0.00 5.00 10.00 15.00 20.00
Tin
uvin
312
Tin
uvin
P Luw
inox 4
4B25
Succonox 1
6
Naugard
445
Succonox 1
8
Cro
dam
ide
Tin
uvin
328
Irganox 1
010
Irganox 1
330
Irganox 1
076
Irgafo
s 1
68
UV Detection (220 nm)
ELS Detection
Irganox 1
010

©2018 Waters Corporation 21
GPC Calibration - Narrow Standards
A calibration curve is built with low dispersity (narrow) standards with known molecular weight; (ideal if same structure as unknown polymer)(PS, PMMA...). This calibration curve may be used to quantitate a polymer of different nature (PC, PMMA...). Then results are expressed in PS or PMMA equivalents, (or relative to PS or PMMA – incorrect for the polymer sample of interest). The chromatographic process is based on hydrodynamic volume (H) (size in solution), and not molecular weight. Two different polymers with the same MW will elute at different retention volumes.
Vo Excluded V Total
MW* Range
No resolution ABOVE this MW Resolution
range is created by differences in elution time
Elution Time or Volume
No resolution BELOW this MW
*MW is Log scale

©2018 Waters Corporation 22
Creating Column “Banks”
Same “Pore Size” Columns
Vo Excluded V Total
MW Range
No resolution ABOVE this MW
Resolution range is created by differences in elution time
Elution Time or Volume
No resolution BELOW this MW
Vo Excluded V Total
MW Range
No resolution ABOVE this MW Resolution range
is created by differences in elution time
Elution Time or Volume
No resolution BELOW this MW
2 Columns of the SAME Type - SAME MW Range - More Resolution

©2018 Waters Corporation 23
Creating Column “Banks”
Different “Pore Size” Columns
Vo Excluded V Total
MW Range
No resolution ABOVE this MW Resolution
range is created by differences in elution
time
Elution Time or Volume
No resolution BELOW this MW
Vo Excluded V Total
New MW
Range
No resolution ABOVE this MW
Resolution range
is created by differences in elution time
Elution Time or Volume
No resolution BELOW this MW
2 Columns of the Different Type - EXPANDED MW Range - More Resolution

©2018 Waters Corporation 24
Actual Calibration Curves for the Different Pore Size
HT Columns
HT 2 for Low MW HT 6 for High MW HT 6E for Blended
High Temperature

©2018 Waters Corporation 25
GPC Calibration 1 – Narrow Standards
Calibration:
1. Usually >10 standards used
bracketing MW range
2. Standards may be injected as a
mixture
3. Mixtures should be 1 order of
magnitude different (1000,
10000,100000)
To build a calibration curve:
Narrow dispersity standards
(PD<1.1)
Elution volume at peak height
Curve : Log(M) = f(Ve) 2.6
2.8
3.0
3.2
3.4
3.6
3.8
4.0
4.2
4.4
4.6
4.8
5.0
5.2
5.4
5.6
5.8
6.0
6.2
6.4
18 19 20 21 22 23 24 25 26 27
Lo
g M
ol W
t
Time (min)
1100000
190000
9100
Log(M)
Elution
volume

©2018 Waters Corporation 26
GPC Calibration – Narrow Standards
Organic Polymers Aqueous Polymers
Polystyrene Poly(ethylene oxides)
Polybutadienes Poly(ethylene glycols)
Poly(methylmethacrylates) Pullulans
Polyisoprenes

©2018 Waters Corporation 27
Narrow standards may be mixed together to develop a relative calibration curve
– No more than 3 in one “cocktail” – be careful of concentrations
– MW’s should be one decade apart
Narrow standards should only be swirled gently
No need to filter narrow standards
Add antioxidant if high temperature application
Narrow Standards - Preparation Considerations

©2018 Waters Corporation 28
Sample may be mixed to facilitate dissolution
– Be careful of shear for high MW (>1M) samples
In some cases, sample solution should be filtered
– Presence of microgels, fillers, any other insolubles
Allow enough time for complete dissolution
For certain crystalline polymers, high temperature may be needed
– Example: Isotactic polypropylene requires 2 hours at 170C in an external oven
– The PP may then be run at 145C
Sample Preparation Considerations

©2018 Waters Corporation 29
The more dilute the polymer solution, the better
– This will prevent viscosity effects and non-reproducible retention
– A dilute solution will allow the polymer to open up into its most relaxed conformation
o No chain entanglement
o No microgel formation
Injection volume no more than 100 µL per column
For very high MW polymers, flow rate may have to be lowered
– HMW columns may be needed as well to prevent shear
Sample Concentration Guide

©2018 Waters Corporation 30
Sample Concentration Guide
MW < 1,000
MW 1,000 – 10,000
MW 10,000 – 100,000
MW 100,000 – 500,000
MW 500,000 – 1M
MW >1M
0.20 – 0.30%
0.15 – 0.20%
0.10 – 0.15%
0.05 – 0.10%
0.01 – 0.05%
0.005 – 0.01%
Above concentrations assume no more than
100 µL injection per column

©2018 Waters Corporation 31
Switch solvents by flushing to the column at 0.1ml/min overnight in the new solvent
Increase flow rates at 0.1 ml/minute/minute to the columns specified flow rates
Recommended to keep the flow through the columns at low flow, 50 ~ 100 ml/minute when idling
For TCB at 140 - 150 C - purge the toluene out of the columns at 0.1 mL/min. overnight at ~80C and then ramp up to temperature over 300 min after 3 column volumes of TCB have passed through
Detection – RI
– Viscometry
– UV
GPC Column Operation Techniques

©2018 Waters Corporation 32
A polymer is a mixture of different size chain lengths of the same monomer. To
measure this distribution of sizes we use molecular weight averages.
Slices are made to the chromatogram, where the height of each slice (Hi),
represents the population of molecules at that chain length or MW.
Polymer Distributions
Hi
Elution volume

©2018 Waters Corporation 33
Polymer Distributions
Mv
High MW Low MW
Mw
Mn
Mv is derived from Viscometry
MP
Mz
Mz+1

©2018 Waters Corporation 34
GPC and Flow Rate Precision
Mn
Mw
Ve
LC Peak Identification (Narrow Standard)
Based on retention time
Molecular Weight Determination
Gel permeation chromatography (GPC)
Based on volume of solvent flowing through the column
Essential for the flow rate to be absolutely constant
To calibrate, plot Log MW of standards vs volume (time)
Any flow variability will result in large MW errors

©2018 Waters Corporation 35
GPC and Flow Rate Precision
Mn
Mw
Ve
Precise solvent flow is essential for precise GPC…
©2018 Waters Corporation 36
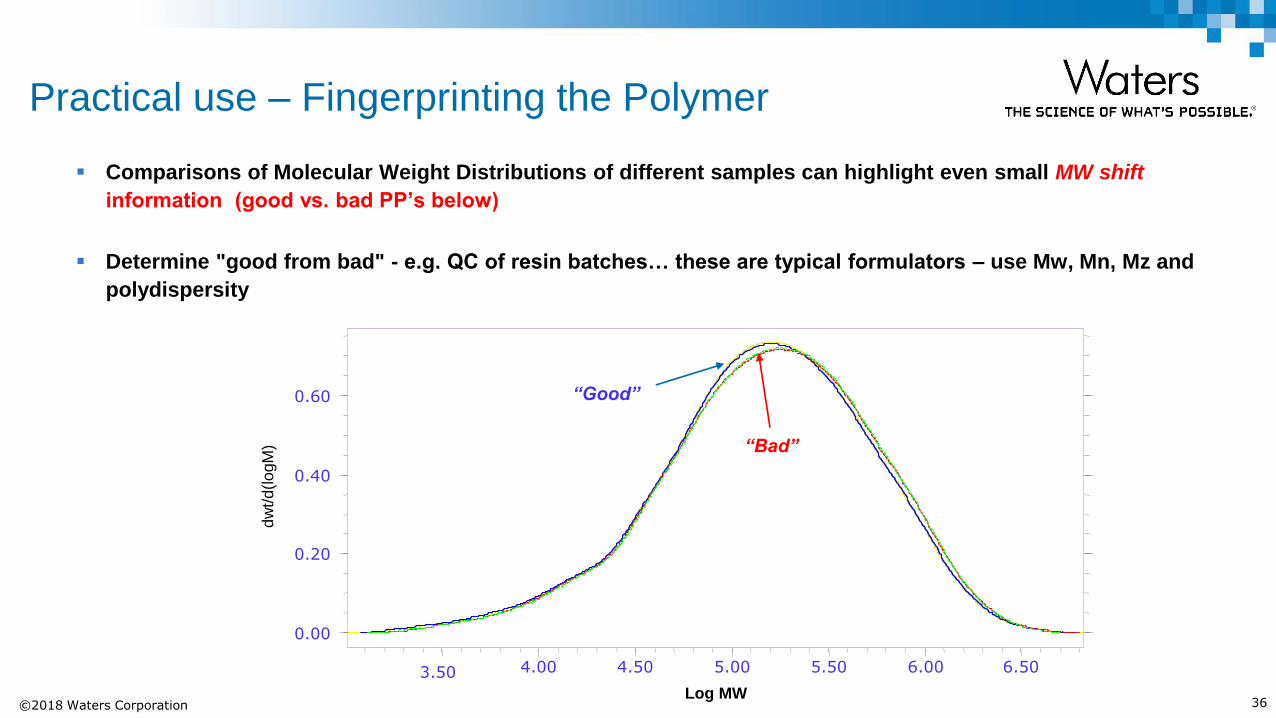
Comparisons of Molecular Weight Distributions of different samples can highlight even small MW shift
information (good vs. bad PP’s below)
Determine "good from bad" - e.g. QC of resin batches… these are typical formulators – use Mw, Mn, Mz and
polydispersity
Practical use – Fingerprinting the Polymer
dw
t/d
(lo
gM
)
0.00
0.20
0.40
0.60
Log MW
3.50 4.00 4.50 5.00 5.50 6.00 6.50
“Bad”
“Good”
©2018 Waters Corporation 37
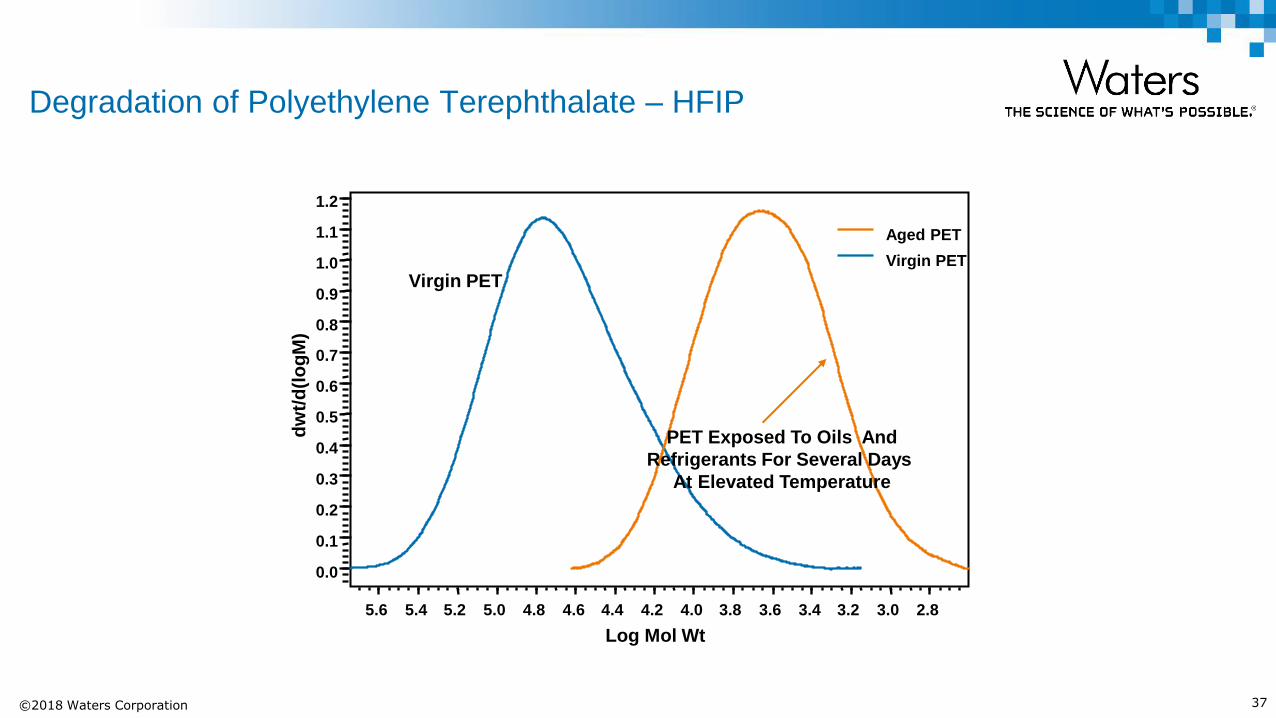
Degradation of Polyethylene Terephthalate – HFIP
Aged PET
Virgin PET
dw
t/d
(lo
gM
)
0.0
0.1
0.2
0.3
0.4
0.5
0.6
0.7
0.8
0.9
1.0
1.1
1.2
Log Mol Wt
2.8 3.0 3.2 3.4 3.6 3.8 4.0 4.2 4.4 4.6 4.8 5.0 5.2 5.4 5.6
PET Exposed To Oils And
Refrigerants For Several Days
At Elevated Temperature
Virgin PET

©2018 Waters Corporation 38
GAP of Additives

©2018 Waters Corporation 39
In recent years there has been increased interest in using gradient HPLC techniques, such
as Gradient Polymer Elution Chromatography (GPEC), with polymers for determining the
compositional drift of copolymers, the composition of polymer blends, or for the analysis of
polymer additives. Depending upon the gradient conditions and columns selected for
analysis, separations may be obtained dependent on molecular weight or based upon
precipitation, or adsorption mechanisms. The use of an Evaporative Light Scattering
Detector (ELSD) allows one to perform solvent gradients with a universal mass detector and
observe both UV absorbing and non-UV absorbing polymer samples without baseline
disturbances from the solvent gradient. The addition of a Photodiode Array Detector (PDA)
allows for compositional analysis across the molecular weight distribution of many
copolymers, can be useful for the identification of components in a polymer blend, and also
is invaluable for the quantitation of polymer additives and other small molecules in
traditional reverse phase separations.
Gradient Analysis of Polymers (GAP)

©2018 Waters Corporation 40
Experimental Conditions
System:
Waters Alliance 2690 Separations Module with column heater
at 30 ºC
Detector 1: Waters 996 Photodiode Array Detector
Detector 2: Alltech Model 500 ELSD with LTA Adapter
(Drift Tube at 40º C, 1.75 Liters/min Nitrogen)
Data System: Waters Millennium 32 Chromatography Manager
Column: As listed in Figures, 30 ºC
Flow Rate: 1mL/min
Samples: 10 - 25 µl injections of 0.2 - 0.5% samples
Gradient: Linear gradient, conditions and mobile phases as listed in
Figures.

©2018 Waters Corporation 41
GPC Analysis of a Polymer Blend
©2018 Waters Corporation 42
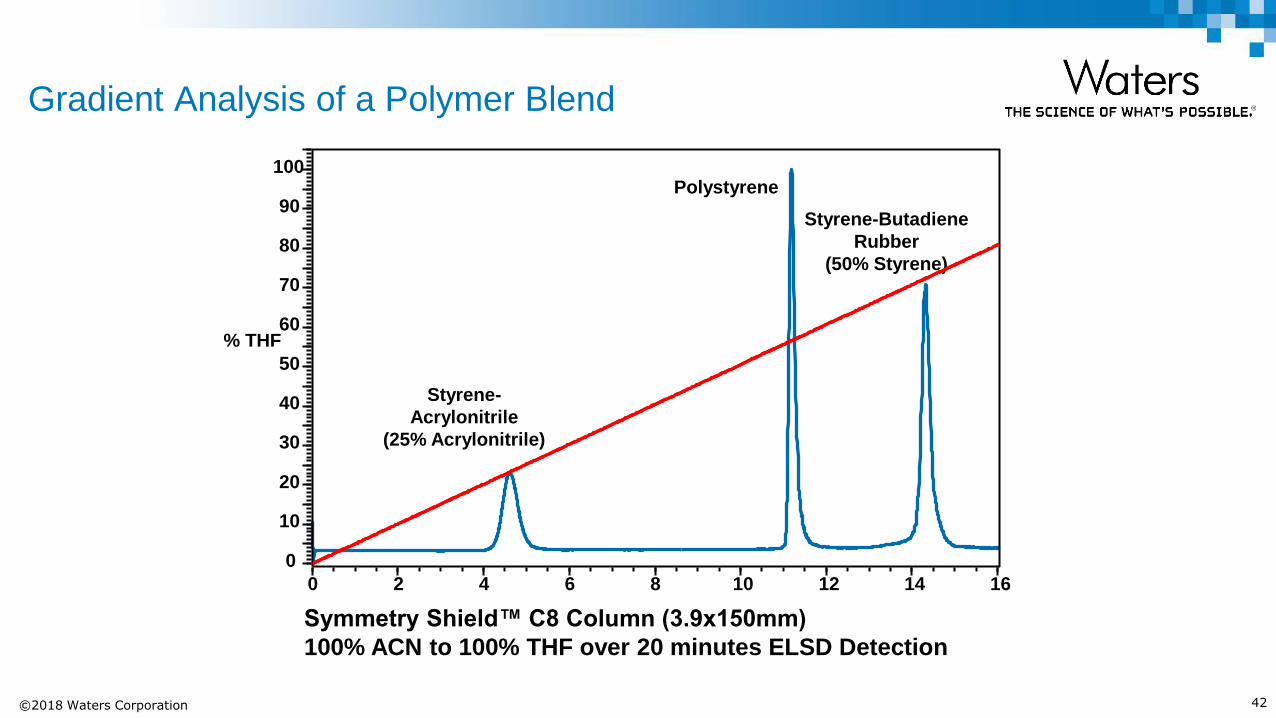
Gradient Analysis of a Polymer Blend
Styrene-
Acrylonitrile
(25% Acrylonitrile)
Polystyrene
Styrene-Butadiene
Rubber
(50% Styrene)
% THF
0
10
20
30
40
50
60
70
80
90
100
Minute
s 0 2 4 6 8 10 12 14 16
Symmetry Shield™ C8 Column (3.9x150mm)
100% ACN to 100% THF over 20 minutes ELSD Detection
©2018 Waters Corporation 43
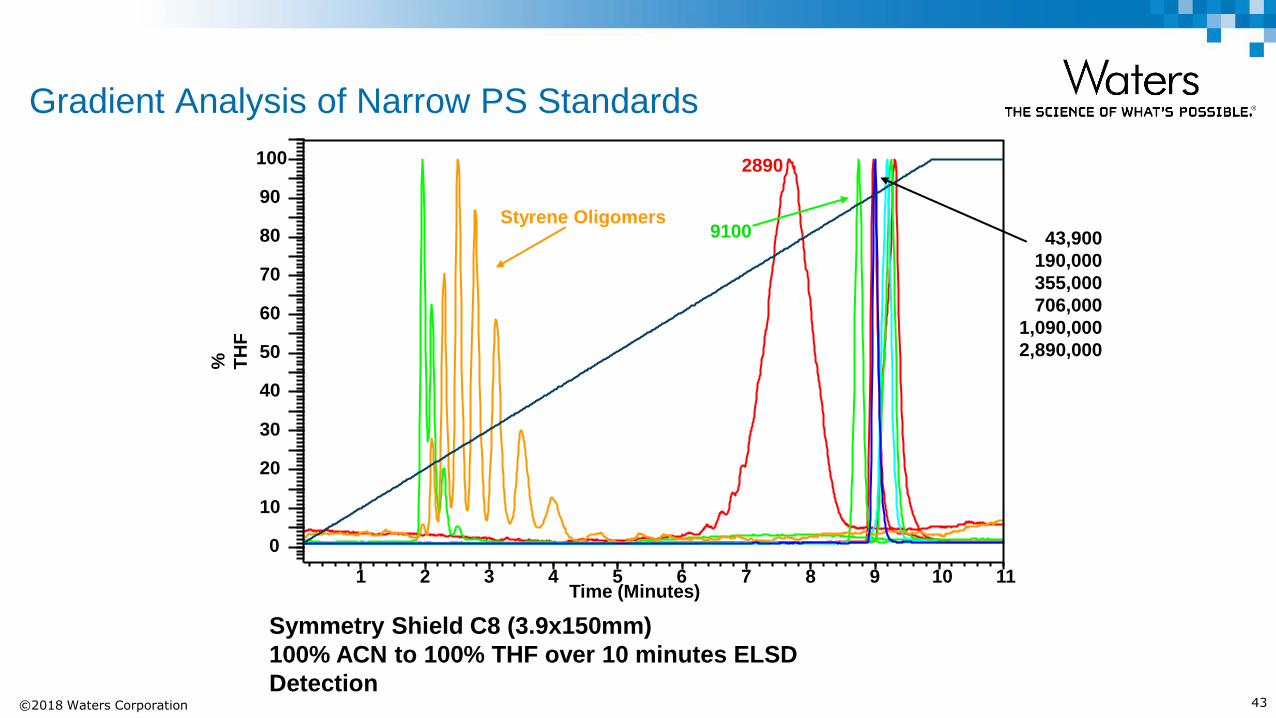
Gradient Analysis of Narrow PS Standards
%
TH
F
0
10
20
30
40
50
60
70
80
90
100
Time (Minutes) 1 2 3 4 5 6 7 8 9 10 11
Symmetry Shield C8 (3.9x150mm)
100% ACN to 100% THF over 10 minutes ELSD
Detection
Styrene Oligomers
2890
9100 43,900
190,000
355,000
706,000
1,090,000
2,890,000

©2018 Waters Corporation 44
Analysis of Styrene-Butadiene-Styrene Block
% T
HF
10
20
30
40
50
60
70
80
90
100
Minutes 10 11 12 13 14 15 16 17 18 19 20
10
0%
Sty
ren
e
40
% S
tyre
ne
30%
Sty
ren
e
22
% S
tyre
ne
10
0%
Bu
tad
ien
e
Prototype DVB/Vinylpyrolidone Column (3.9x150mm)
100% ACN to 100% THF over 20 minutes ELSD Detection
©2018 Waters Corporation 45
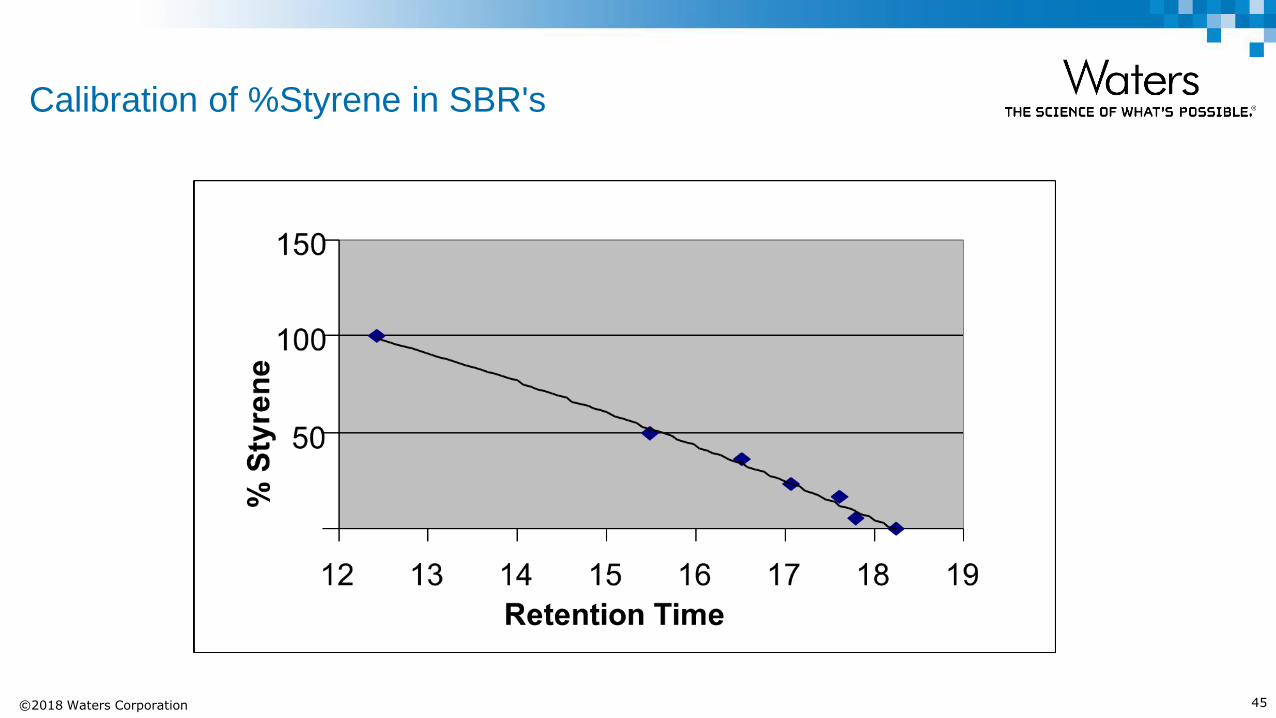
Calibration of %Styrene in SBR's

©2018 Waters Corporation 46
Gradient Analysis of Low Molecular Weight Waxes
Time (Minutes)
6
8
10
12
14
16
18
20
22
11 12 13 14 15 16 17 18
m
V
"Slack wax"
"C18 wax"
Nova-Pak® C18 (3.9x150mm)
100% ACN to 100% THF over 30 minutes ELSD Detection

©2018 Waters Corporation 47
Polymer Additives – Tinuvins, (UV Stabilizers)
4
6
8
10
12
14
16
18
20
22
24
26
28
14 16 18 20 22 24 26 28 30 32
mV
Minutes
Tinuvin 440
Tinuvin 900
Tinuvin
328
ELSD Detection

©2018 Waters Corporation 48
Polymer Additives – Phthalate Plasticizers
5.0
5.5
6.0
6.5
7.0
7.5
8.0
8.5
9.0
9.5
10.0
10.5
11.0
14 16 18 20 22 24 26 28 30 32 34 36 38
mV
Minutes
DcHP
DOP (DEHP)
DIDP
UDP
ELSD Detection

©2018 Waters Corporation 49
Polymer Additives - Slips and Antistats
0
20
40
60
80
100
120
140
160
180
200
220
14 16 18 20 22 24 26 28 30 32 34
mV
Minutes
Oleamide
Erucamide
Stearic Acid
ELSD Detection

©2018 Waters Corporation 50
Polymer Additives - Antioxidants
Overlay of 12 injections of Antioxidant Standard
UV Detection at 230nm

©2018 Waters Corporation 51
APC System

©2018 Waters Corporation 52
Birth of Polymer Chromatography
Dow/Waters Collaborations in GPC
1962 - Jim Waters builds prototype low volume, high temperature refractometer
for John C. Moore, Dow Chemicals
1963 – Waters exclusive license of US 3,326,875, “ Separation of Large Polymer
Molecules in Solution” from Dow Chemicals
1964 – Key paper by Moore
– Reduces analysis from days to hours
– Coins term “GPC”

©2018 Waters Corporation 53
Little change in column technology
Primarily polymer-based resins
– Styrene-DVB
– Methacrylates
Low resolution technique
– Particle size reduction ~75 micron to ~5 micron
o Minimal resolution improvement
– Limitations in minimizing instrument dispersion
“Universal columns” and fast GPC columns
– Compromise speed for resolution
– GPC/SEC remained a slow technique
GPC:1964 to today

©2018 Waters Corporation 54
A Novel, Practical Approach to
SEC/GPC Analysis
ACQUITY®
Advanced Polymer Chromatography™
(APC™) System

©2018 Waters Corporation 55
What’s is the APC System?
ACQUITY APC System
– Introduced at Pittcon 2013(Philadelphia)
GPC/SEC polymer characterization with
– sub-2µm /sub-3µm rigid hybrid particles
o BEH chemistry introduced in 2004
Complete solution
–New higher efficiency columns
o aqueous and organic
–New chromatographic system
o Designed for high efficiency columns
o Low dispersion, precise flow rate

©2018 Waters Corporation 56
Recent Trends Polymer Development
Green Chemistry
- Decrease organic solvents in processes
- Increase water based processes
- Bio-sourced polymers
- Biodegradable polymers
Key: Lower average molecular weight polymers
Modern Chemistry
- Functional polymers - End-groups - Pendant groups
- Better control
- Polymerization reactions - Molecular weight
averages & polydispersity
- Next gen catalysts
- New, innovative polymer structures

©2018 Waters Corporation 57
ACQUITY APC System
Analytical Challenges
ACQUITY APCTM System
Gel Based Columns
Typical materials include - Styrene-DVB - Methacrylates
Relatively fragile
Solvent to solvent conversion not easy
Speed of Analysis
Current approaches to size based separations compromise - Peak resolution
- Characterization
- Data quality
Poorly Resolved Low Molecular Weight Polymer & Oligomers
Traditional GPC is a low resolution technique Low resolution limits characterization information
Innovative polymers and building blocks need high resolution

©2018 Waters Corporation 58
.
Limitations of High Speed
Gel Permeation Chromatography
Data Courtesy of Janco, M; Alexander, J; Bouvier, E; Morrison, D; Ultra High Performance Size Exclusion Chromatography of Synthetic Polymers; Pittcon 2013; Session 2360-1

©2018 Waters Corporation 59
Advanced Polymer Chromatography
versus High Speed Gel Permeation Chromatography
Data Courtesy of Janco, M; Alexander, J; Bouvier, E; Morrison, D; Ultra High Performance Size Exclusion Chromatography of Synthetic Polymers; Pittcon 2013; Session 2360-1

©2018 Waters Corporation 60
Low MW Polymer: Resolution Realized
Polystyrene Standard 510 Mp HPLC System with RI
6x150mm HSPgel HR1
ACQUITY APC System with RI 4.6x150mm; 45Å XT

©2018 Waters Corporation 61
More resolution = more
points for low molecular
weight calibration
Better calibration =
more accurate data
Lo
g M
ol W
t
2.40
2.80
3.20
3.60
4.00
4.40
4.80
5.2
5.6
Retention Time
15 16 17 18 19 20 21 22 23 24 25 26 27
Lo
g M
ol W
t
2.00
2.50
3.00
3.50
4.00
4.50
5.00
5.50
Retention Time
2.4 2.6 2.8 3.0 3.2 3.4 3.6 3.8 4.0 4.2 4.4 4.6 4.8 5.0
Alliance GPC system
3 x Styragel 7.8 x 300mm (4e, 2, 0.5)
Polystyrene calibration (100K, 10K, 1K)
ACQUITY APC system
3 x APC TMS 4.6 x 150mm (200,45,45)
Polystyrene calibration (100K, 10K, 1K)
Speed of Analysis & Better Characterization

©2018 Waters Corporation 62
Speed of Analysis & Better Characterization Higher resolution & speed of APC
– Easier to run more calibration standards, faster
More calibration points Better calibration Better
characterization
FASTER calibration Calibrate in less than 30 minutes, not hours
DAILY calibration, not weekly easier to monitor data consistency
and quality
GPC APC
28.00 4.90
©2018 Waters Corporation 63
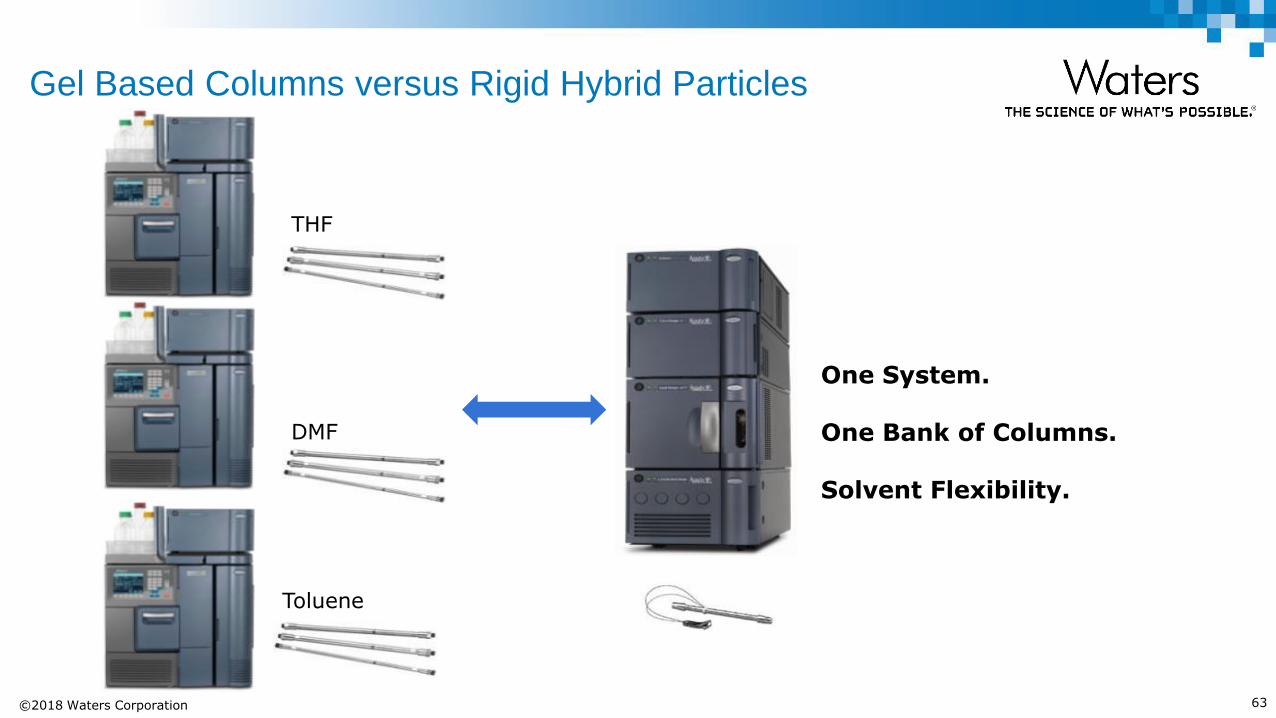
Gel Based Columns versus Rigid Hybrid Particles
THF
DMF
Toluene
One System. One Bank of Columns. Solvent Flexibility.
©2018 Waters Corporation 64
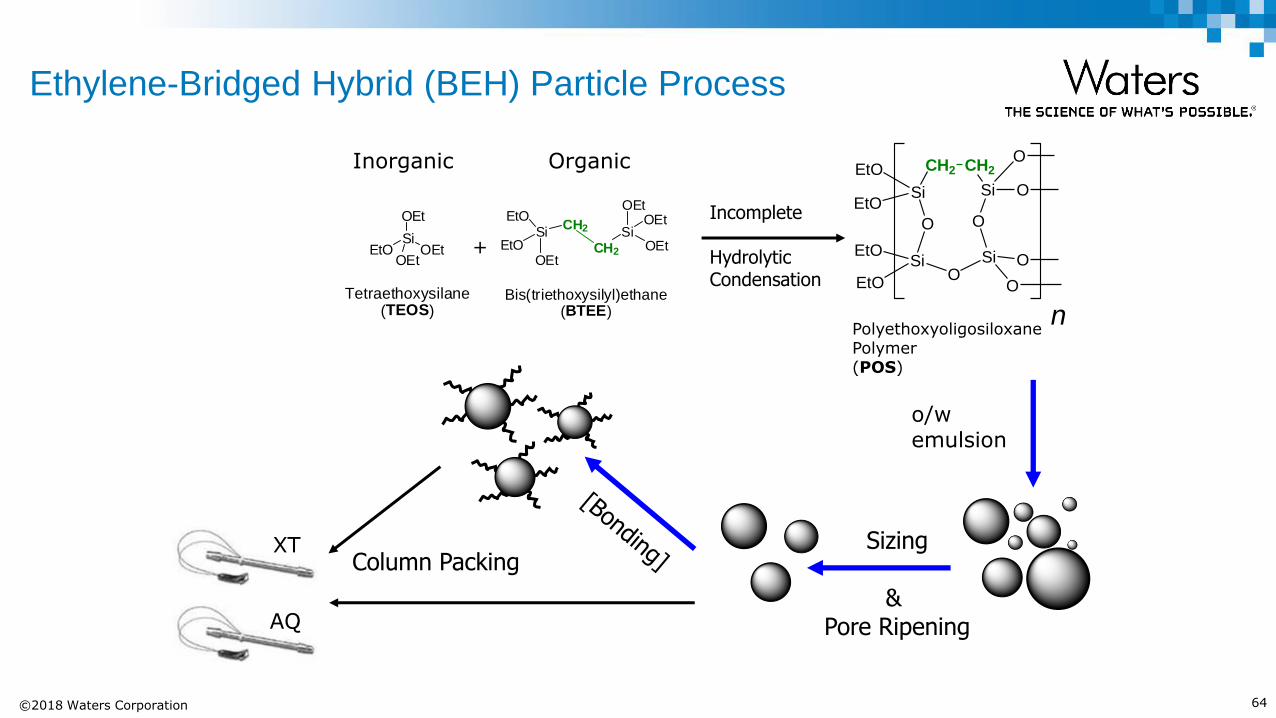
Ethylene-Bridged Hybrid (BEH) Particle Process
CH2SiEtO
OEtEtO
Bis(triethoxysilyl)ethane(BTEE)
CH2
SiOEt
OEtOEt Incomplete
Hydrolytic Condensation
Column Packing
OEt
SiEtO OEt
OEt
Tetraethoxysilane(TEOS)
Sizing
& Pore Ripening
o/w emulsion
+
Inorganic Organic CH2
SiEtO
O
SiEtO
OEtO
Si
Si
O
O
O
O
O
n
CH2EtO
Polyethoxyoligosiloxane Polymer (POS)
AQ
XT

©2018 Waters Corporation 65
More than 10 years experience
– sub-2µm particles submitted to extreme conditions
o pH, temperature, back pressure, flow rates, …
BEH particles combine advantages of silica & polymeric material
– Rigid, pressure resistant
– Particle size & pore diameter well-controlled
– Inert, resistant to temperature changes
E-cord device
– Traces usage history
o QC certificate, injection count, temperature, back pressure)
ACQUITY APC Columns
Built on Bridged Ethylene Hybrid (BEH)

©2018 Waters Corporation 66
Particles based on BEH chemistry
Five pore sizes
– 45 Å (200 – 5,000) 1.7µm
– 125 Å (1,000 – 30k) 2.5µm
– 200 Å (3,000 – 70k) 2.5µm
– 450 Å (20k – 400k) 2.5µm
– 900 Å (300k – 2M) 2.5µm
Two surface chemistries
– Organic solvent- XT
– Aqueous buffers – AQ
Three column lengths
– 30 mm
– 75 mm
– 150 mm
Internal diameter: 4.6 mm
ACQUITY APC Column Options

©2018 Waters Corporation 67
Rigid Hybrid Columns
Solvent Flexibility
82
27
2
µR
IU
-2.00
0.00
2.00
4.00
58
42
2
µR
IU
-2.00
0.00
2.00
4.00
81
70
9
µR
IU
-2.00
0.00
2.00
4.00
81
36
5
µR
IU
-2.00
0.00
2.00
4.00
Minutes
0.00 0.50 1.00 1.50 2.00 2.50 3.00 3.50
Poly(methyl methacrylate co ethylacrylate)
THF
Poly(methyl methacrylate co ethylacrylate)
THF
Poly(9,9 di-n-octylfluorenyl 2,7 diyl)
Toluene
Poly(bisphenol-A-co epichlorohydrin) DMF
before after % change
Mp 82272 81365 0.4
Mw 78650 78953 1.5
Mn 49383 50110 0.6
PDI 1.59 1.58 1.1
poly(methyl methacrylate co ethyl acrylate)
in THF
©2018 Waters Corporation 68
Size Exclusion and Interactive polymer Chromatography are complimentary techniques for polymer characterization – SEC measures MWD of polymers
– IPC measures CCD of copolymers and blends
– Gradient HPLC can be used for polymer additive analysis (deformulation)
New ACQUITY APC System
– Brings all the advantages of sub-2µm & sub-3µm particles to polymer characterization (GPC/SEC)
– Analysis time reduction by 5x (at minimum)
– Daily calibration is easy
– New columns compatible with any solvent
– Rigid, BEH particles
– Use one column set for different solvents
– Achieve better results faster
– Higher resolution, especially in low MW area
Summary

©2018 Waters Corporation 69