Timing and Profiling ECE 454 Computer Systems Programming Topics: Measuring and Profiling Cristiana...
23
Timing and Profiling ECE 454 Computer Systems Programming Topics: Topics: Measuring and Profiling Cristiana Amza
-
Upload
jack-waters -
Category
Documents
-
view
225 -
download
1
Transcript of Timing and Profiling ECE 454 Computer Systems Programming Topics: Measuring and Profiling Cristiana...

Timing and Profiling ECE 454 Computer
Systems Programming
Timing and Profiling ECE 454 Computer
Systems Programming
Topics:Topics: Measuring and Profiling
Cristiana Amza

– 2 –
““It is a capital mistake to It is a capital mistake to theorize before one has data. theorize before one has data. Insensibly one begins to Insensibly one begins to twist facts to suit theories twist facts to suit theories instead of theories to suit instead of theories to suit factsfacts.” - Sherlock Holmes .” - Sherlock Holmes

– 3 –
Measuring Programsand Computers
Measuring Programsand Computers

– 4 –
Why Measure a Program/Computer?Why Measure a Program/Computer?
To compare two computers/processorsTo compare two computers/processors Which one is better/faster? Which one should I buy?
To optimize a programTo optimize a program Which part of the program should I focus my effort
on?
To compare program implementationsTo compare program implementations Which one is better/faster? Did my optimization
work?
To find a bugTo find a bug Why is it running much more slowly than expected?
– 5 –
Basic MeasurementsBasic Measurements
IPS: instructions per secondIPS: instructions per second MIPS: millions of IPS BIPS: billions of IPS
FLOPS: floating point operations per secondFLOPS: floating point operations per second megaFLOPS: 106 FLOPS gigaFLOPS: 109 FLOPS teraFLOPS: 1012 FLOPS petaFLOPS: 1015 FLOPS Eg: playstation3 capable of 20 GFLOPS
IPC: instructions per processor-cycleIPC: instructions per processor-cycle
CPI: cycles per instructionCPI: cycles per instruction CPI = 1 / IPC

– 6 –
How not to compare processorsHow not to compare processors
Clock frequency (MHz)?Clock frequency (MHz)? IPC for the two processors could be radically different Megahertz Myth
Started from 1984
Apple IICPU: MOS Technology 6503@1MHz
LD: 2 cycles (2 microseconds)
IBM PCCPU: Intel [email protected]
LD: 25 cycles (5.24 microseconds)

– 7 –
How not to compare processorsHow not to compare processors
Clock frequency (MHz)?Clock frequency (MHz)? IPC for the two processors could be radically different
CPI/IPC?CPI/IPC? dependent on instruction sets used dependent on efficiency of code generated by compiler
FLOPS?FLOPS? only if FLOPS are important for the expected
applications also dependent on instruction set used

– 8 –
How to measure a processorHow to measure a processor
Use wall-clock time (seconds)Use wall-clock time (seconds)
time = IC x CPI x ClockPeriodtime = IC x CPI x ClockPeriod
IC = instruction count (total instructions executed)IC = instruction count (total instructions executed)
CPI = cycles per instructionCPI = cycles per instruction
ClockPeriod = 1 / ClockFrequency = (1 / MHz)ClockPeriod = 1 / ClockFrequency = (1 / MHz)

– 9 –
Amdahl’s Law: Optimizing part of a programAmdahl’s Law: Optimizing part of a program
speedup = OldTime / NewTimespeedup = OldTime / NewTime
Eg., my program used to take 10 minutesEg., my program used to take 10 minutes• now it only takes 5 minutes after optimization• speedup = 10min/5min = 2.0 i.e., 2x faster
If only optimizing part of a program (on following If only optimizing part of a program (on following slide):slide):• let f be the fraction of execution time that the
optimization applies to (1.0 > f > 0)• let s be the improvement factor (speedup of the
optimization)

Amdhal’s Law VisualizedAmdhal’s Law Visualized
f
1-f
f/s
1-f
Optimization
Old
Tim
e
New
Tim
e
the best you can do is eliminate f; 1-f remains
– 11 –
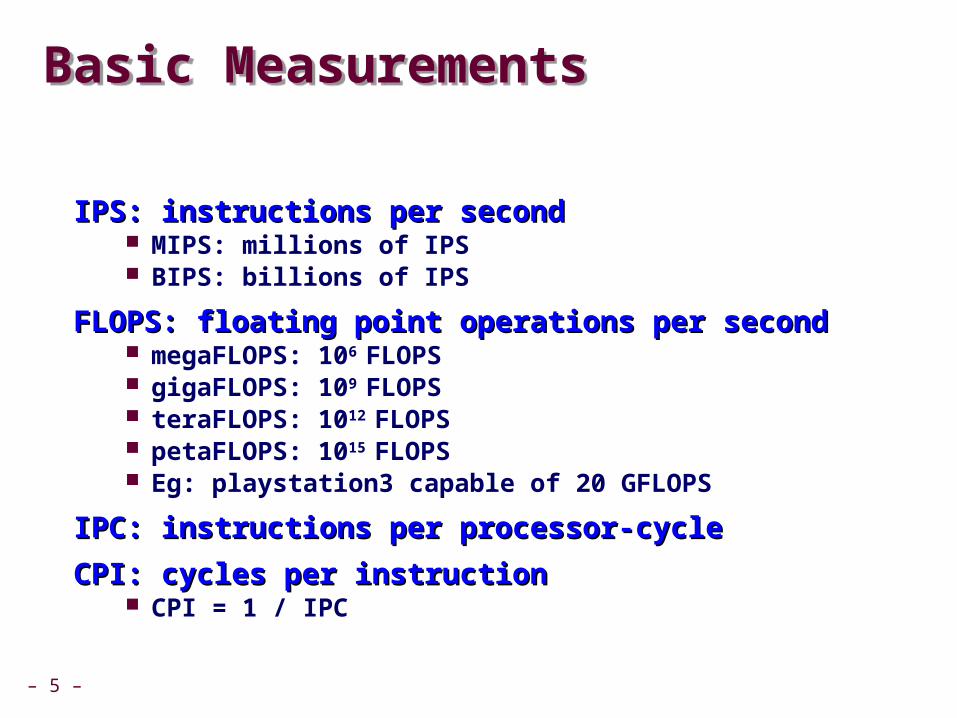
Amdahl’s Law: EquationsAmdahl’s Law: Equations
let f be the fraction of execution time that the let f be the fraction of execution time that the optimization applies to (1.0 > f > 0)optimization applies to (1.0 > f > 0)
let s be the improvement factorlet s be the improvement factor
NewTime = OldTime x [(1-f) + f/s]NewTime = OldTime x [(1-f) + f/s]
speedup = OldTime / (OldTime x [(1-f) + f/s])speedup = OldTime / (OldTime x [(1-f) + f/s])
speedup = 1 / (1 – f + f/s)speedup = 1 / (1 – f + f/s)

– 12 –
Example1: Amdahl’s LawExample1: Amdahl’s Law
If an optimization makes loops go 3 times faster, and If an optimization makes loops go 3 times faster, and my program spends 70% of its time in loops, how my program spends 70% of its time in loops, how much faster will my program go?much faster will my program go?
speedup = 1 / (1 – f + f/s)speedup = 1 / (1 – f + f/s)
= 1 / (1 – 0.7 + 0.7/3.0)= 1 / (1 – 0.7 + 0.7/3.0)
= 1/(0.533333)= 1/(0.533333)
= 1.875= 1.875
My program will go 1.875 times faster.My program will go 1.875 times faster.

– 13 –
Example2: Amdahl’s LawExample2: Amdahl’s Law
If an optimization makes loops go 4 times faster, If an optimization makes loops go 4 times faster, and applying the optimization to my program and applying the optimization to my program makes it go twice as fast, what fraction of my makes it go twice as fast, what fraction of my program is loops?program is loops?

– 14 –
Implications of Amdahl’s LawImplications of Amdahl’s Law
Uncommon
Common
Common
Uncommon
Optimization
optimize the common case
the common case may change!

– 15 –
Tools for Measuring and Understanding SoftwareTools for Measuring and Understanding Software

– 16 –
Tools for Measuring/UnderstandingTools for Measuring/Understanding
Software TimersSoftware Timers C library and OS-level timers
Hardware Timers and Performance CountersHardware Timers and Performance Counters Built into the processor chip
InstrumentationInstrumentation Decorates your program with code that counts & measures gprof gcov
GNU: “Gnu is Not Unix” --- Founded by Richard Stallman

– 17 –
Software Timers: Command LineSoftware Timers: Command Line
Example: Example: /usr/bin/time/usr/bin/time Measures the time spent in user code and OS code Measures entire program (can’t measure a specific function) Not super-accurate, but good enough for many uses
$ time ls $ time ls
user & sys --- CPU time /usr/bin/time gives you more information

– 18 –
Software Timers: Library: ExampleSoftware Timers: Library: Example
can measure within a programused in HW2
#include <sys/times.h> // C library functions for timeunsigned get_seconds() {
struct tms t; times(&t); // fills the struct
return t.tms_utime; // user program time // (as opposed to OS time)
}…
unsigned start_time, end_time, elapsed_time;start_time = get_seconds();
do_work(); // function to measureend_time = get_seconds();
elapsed_time = end_time - start_time;

Hardware: Cycle TimersHardware: Cycle Timers
can be more accurate than library (if used right)used in HW2
Programmer can access on-chip cycle Programmer can access on-chip cycle countercounter Eg., via the x86 instruction: rdtsc (read time stamp
counter) We use this in hw2:clock.c:line94 to time your solutions
Example use:Example use: start_cycles = get_tsc(); // executes rdtsc do_work(); end_cycles = get_tsc(); total_cycles = end_cycles – start_cycles;
Can be used to compute #cycles to execute codeCan be used to compute #cycles to execute code Watch out for multi-threaded program!

– 20 –
Hardware: Performance CountersHardware: Performance Counters
Special on-chip event countersSpecial on-chip event counters Can be programmed to count low-level architecture
events Eg., cache misses, branch mispredictions, etc.
Can be difficult to useCan be difficult to use Require OS support Counters can overflow Must be sampled carefully
Software packages can make them easier to useSoftware packages can make them easier to use Eg: Intel’s VTUNE, perf (recent linux)
perf used in HW2

– 21 –
InstrumentationInstrumentation
Compiler/tool inserts new code & data-structuresCompiler/tool inserts new code & data-structures Can count/measure anything visible to software Eg., instrument every load instruction to also record the load
address in a trace file. Eg., instrument every function to count how many times it is
called
““Observer effect”: Observer effect”: can’t measure system without disturbing it Instrumentation code can slow down execution
Example instrumentors (open/freeware): Example instrumentors (open/freeware): Intel’s PIN: general purpose tool for x86 Valgrind: tool for finding bugs and memory leaks gprof: counting/measuring where time is spent via sampling

– 22 –
Instrumentation: Using gprofInstrumentation: Using gprof
gprof: how it worksgprof: how it works Periodically (~ every 10ms) interrupt program
Determine what function is currently executing Increment the time counter for that function by interval (e.g.,
10ms) Approximates time spent in each function, #calls made Note: interval should be random for rigorous sampling!
Usage: compile with “-pg” to enableUsage: compile with “-pg” to enablegcc –O2 –pg prog.c –o prog./prog
Executes in normal fashion, but also generates file gmon.outgprof prog
Generates profile information based on gmon.out
used in HW1

– 23 –
Instrumentation: Using gcovInstrumentation: Using gcov
Gives profile of execution within a functionGives profile of execution within a function• Eg., how many times each line of C code was executed• Can decide which loops are most important• Can decide which part of if/else is most important
Usage: compile with “-g -fprofile-arcs -ftest-coverage” to Usage: compile with “-g -fprofile-arcs -ftest-coverage” to enableenablegcc -g -fprofile-arcs -ftest-coverage file.c –o file.o./prog
Executes in normal fashion Also generates file.gcda and file.gcno for each file.o
gcov –b progc Generates profile output in file.c.gcov
used in HW1