Time-lapse - what have we learned - Comtecmed · The clinical impact: How much do we see with...
49
Time-lapse - what have we learned Markus Montag
Transcript of Time-lapse - what have we learned - Comtecmed · The clinical impact: How much do we see with...

Time-lapse
- what have we learned
Markus Montag
Disclosure
This speaker has received during the last five years honorary / sponsoring from the following companies in alphabetical order:
- Cook, Ferring Arzneimittel GmbH, Gynemed, - Medical Technology GmbH, Merck Serono, - Merck Sharp & Dome, OvaScience, FertiliTech
- This speaker is CEO of ilabcomm GmbH, a consultancy company,
- A major contractor of ilabcomm GmbH is FertiliTech

Traditional embryo evaluation
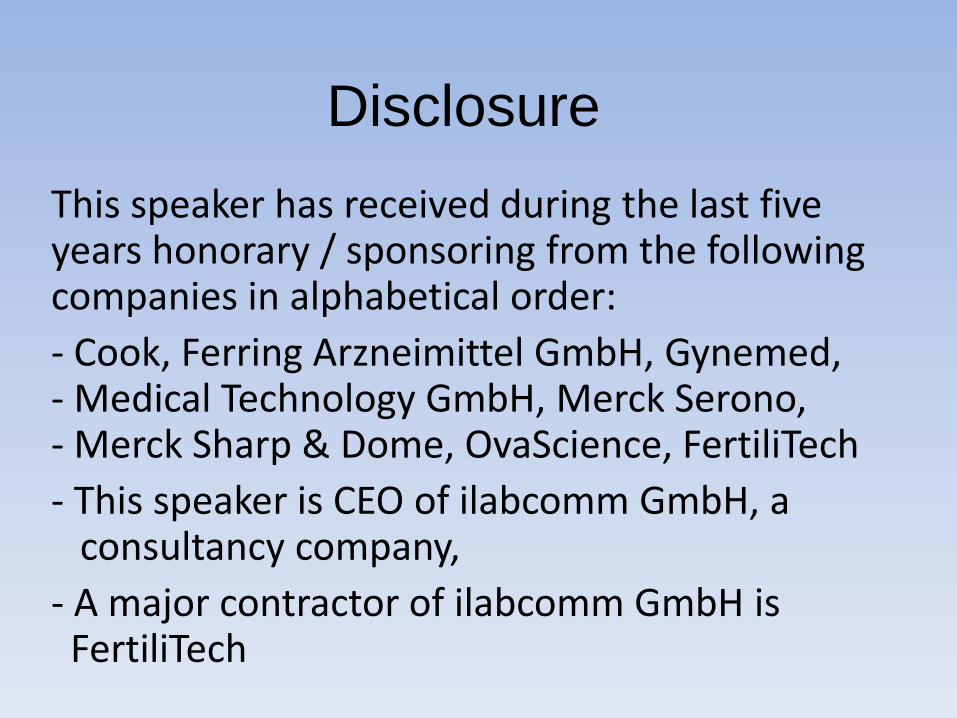
68 hrs 44 hrs 25-27 hrs 17-19 hrs
>1500 images over 3 days per embryo
Time-lapse monitoring
68 hrs 44 hrs 25-27 hrs 17-19 hrs

18 h
24 h
24 h
24 h 24 h
24 h
10-20 min
10-20 min
10-20 min
10-20 min
10-20 min
10-20 min
10-20 min
10-20 min
10-20 min
10-20 min
10-20 min
10-20 min
10-20 min
10-20 min
We move from 1 observation / day
to continuos observation
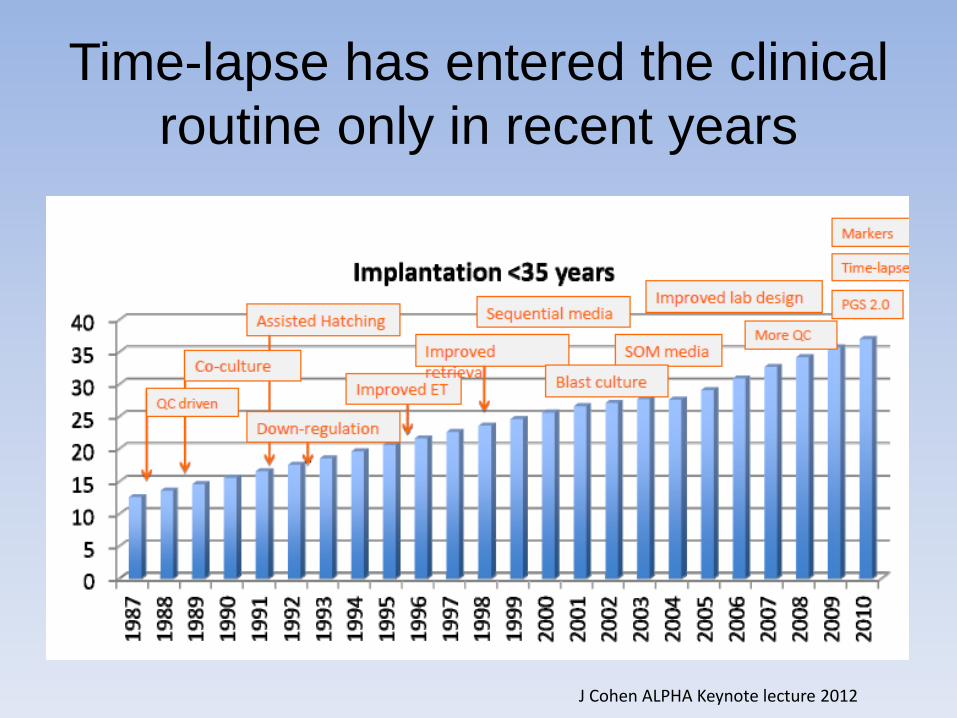
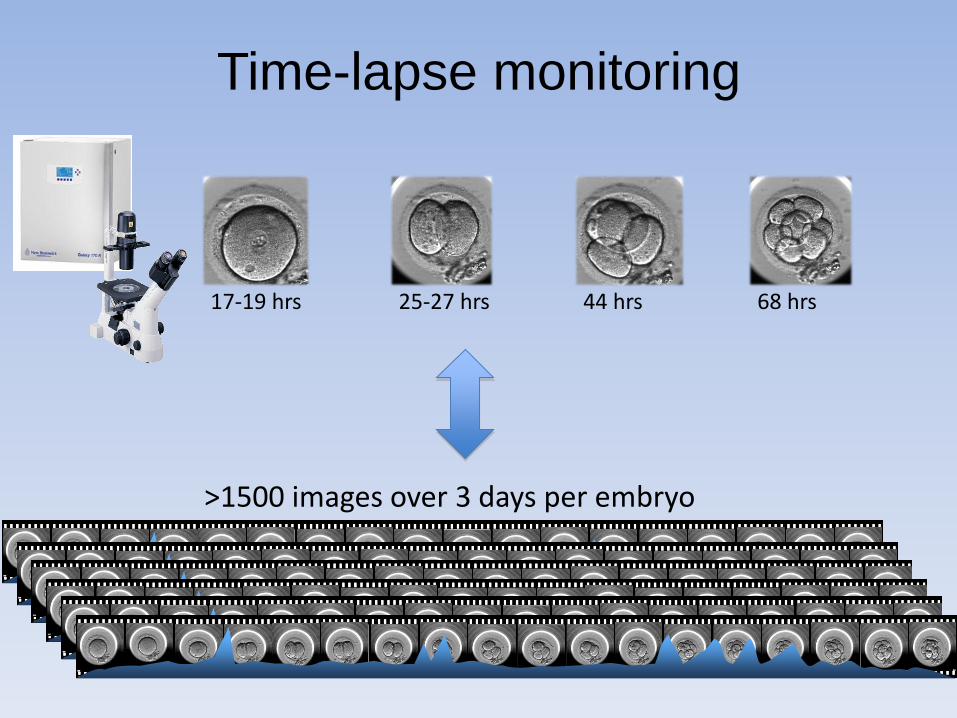
Time-lapse has entered the clinical
routine only in recent years
J Cohen ALPHA Keynote lecture 2012

Time-lapse in the scientific community-
Increasing number of published data*
*Abstracts / publications based on the EmbryoScope® time-lapse system
0
5
10
15
20
25
30
35
40
45
50
2010 2011 2012 2013
Peerreviewedar cles
ASRMAbstracts
ESHREAbstracts

What have we learned
Explaining controversial issues
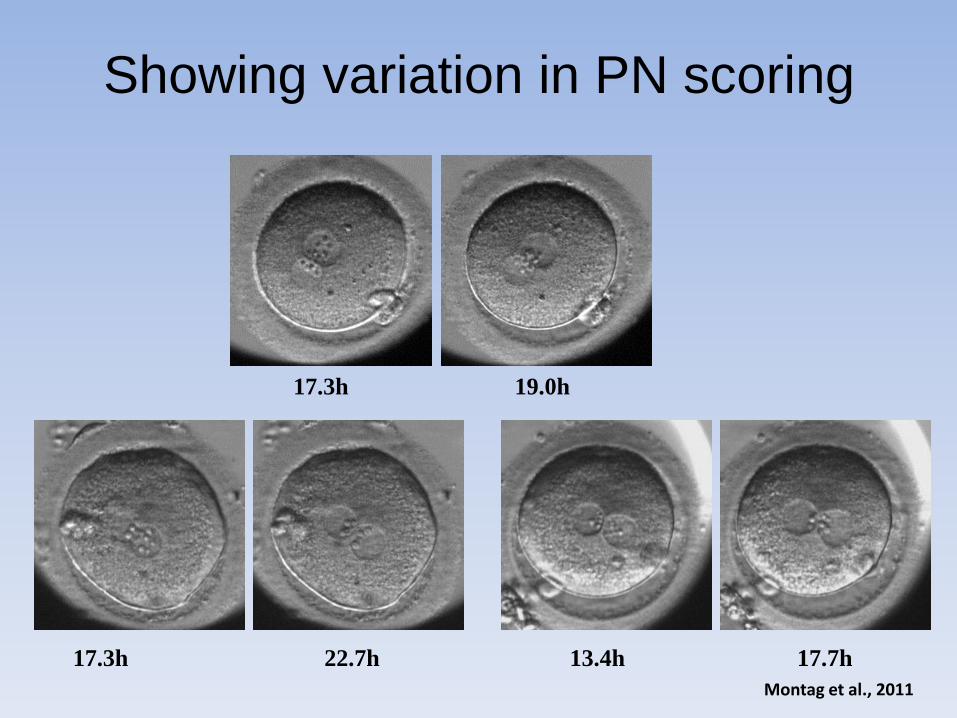
Showing variation in PN scoring
17.3h 22.7h 13.4h 17.7h
17.3h 19.0h
Montag et al., 2011

Early cleavage:
with time-lapse we move from
• Yes or no –”do we have early cleavage or not at 26 h PI”
to
• Know the exact time of when the embryo cleave

Clinical impact of time-lapse on
early cleavage: explaining controversy
IVF n = 2091 embryos ICSI n = 5838 embryos
t2
0.0
00
.05
0.1
00
.15
0.2
00
.25
0.3
0
05
10
15
20
25
30
05
10
15
20
25
30
Rela
tive a
mount
Impla
nta
tion r
ate
(%
)
t2
0.0
00
.05
0.1
00
.15
0.2
00
.25
0.3
0
05
10
15
20
25
30
05
10
15
20
25
30
Rela
tive a
mount
Impla
nta
tion r
ate
(%
)
Multicenter database evaluation; Montag, Petersen et al.
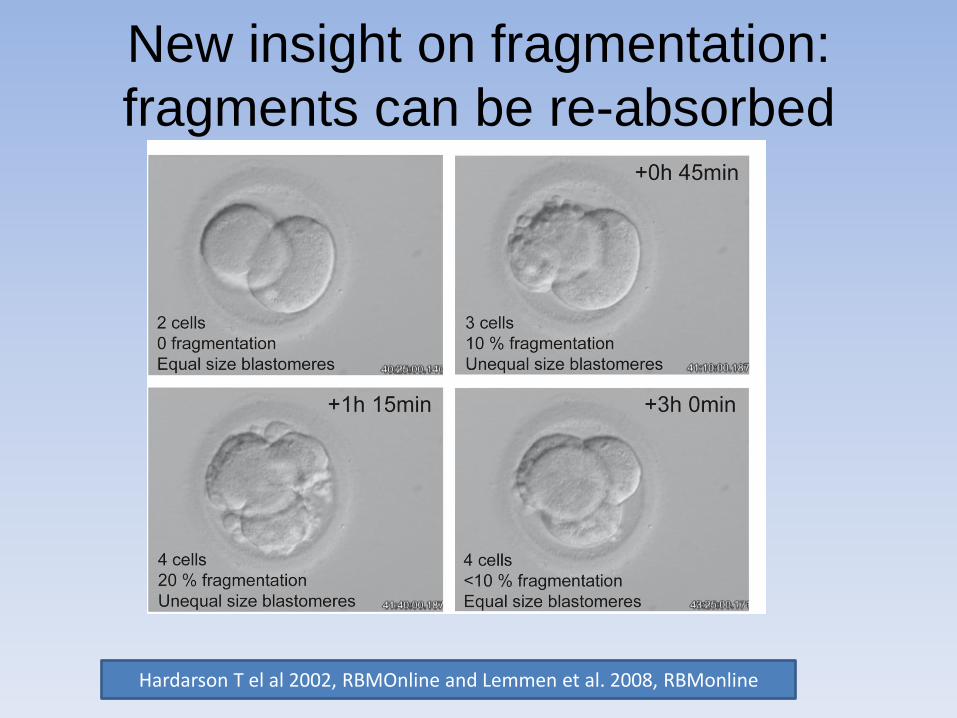
New insight on fragmentation:
fragments can be re-absorbed
Hardarson T el al 2002, RBMOnline and Lemmen et al. 2008, RBMonline

New selection criteria
Early timings

Pronuclear breakdown and live birth
• Azzarello et al. studied prospectively the time of PN breakdown and the PN score in 159 embryos which were all later transferred.
• The PN morphology in the 46 which resulted in live birth was compared with the 113 embryos which resulted in no live birth

PN breakdown and live birth
• PN breakdown occurred never earlier than 20 h and 45 min in embryo resulting in live birth significantly later (significant compared to no live birth).
• Z score had no effect in predicting implantation
Azzarello et al., 2012 Human Reproduction
10%
15%
20%
25%
30%
35%
<35 35-38 38-41 >41
% Im
pla
nted
em
bry
os
Optimal range
Out of range
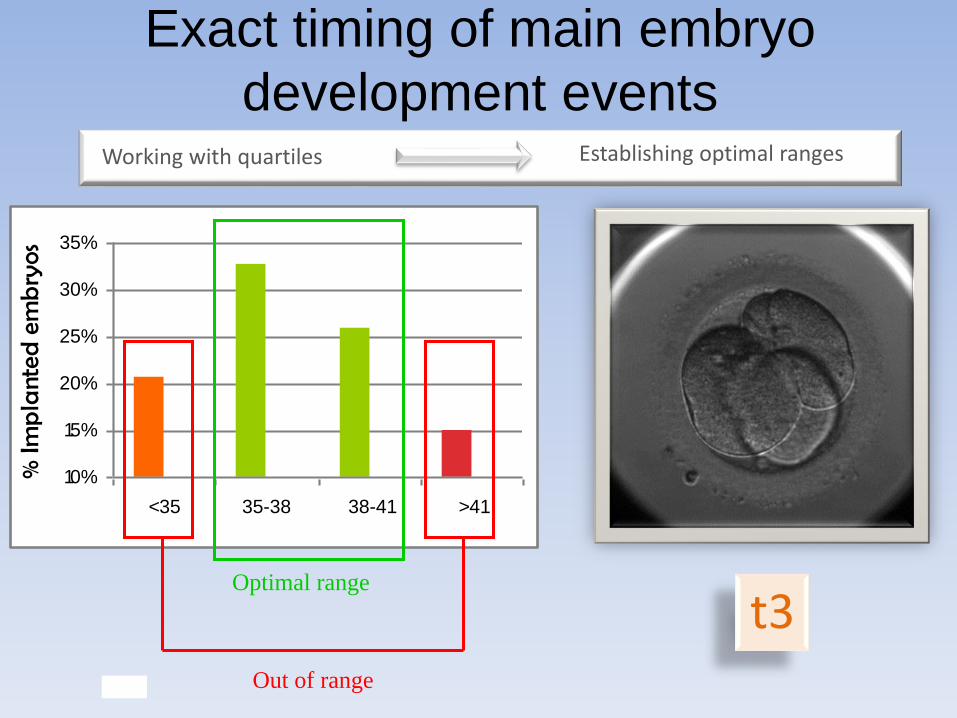
t3
Working with quartiles
Exact timing of main embryo
development events Establishing optimal ranges

Two cells
t2
Three Cells
t3
Five Cells
t5
15%
17%
19%
21%
23%
25%
27%
29%
31%
Out of
range
24.6-
28,2
Imp
lan
tati
on
P = 0,043
*
10%
15%
20%
25%
30%
35%
Out of
range
35.2-40.5
Imp
lan
tati
on
P = 0,007
*
Positive
10%
15%
20%
25%
30%
35%
40%
45%
Out of
range
46.5-56.7
Impl
anta
tion
P=0,001
*
10%
15%
20%
25%
30%
35%
Out of
range
36,6-41,9
Imp
lan
tati
on
P=0,036
*
Four Cells
t4
In and out of range

• Significantly improved clinical pregnancy rate in a retrospective study by a relative increase of 20% – P value 0.0043
– Odds ratio 1.201 (CL 95% 1.059-1.362)
– Meseguer et al., Fertil Steril 2012
• A prospective randomized trial confirmed the results from the retrospective study – Meseguer et al., submitted
– abstracts presented at ACE2014 / ASPIRE 2014
0%
10%
20%
30%
40%
50%
60%
StandardIncubator
EmbryoScope
+ 20%
The clinical impact of applying a time-
lapse strategy in the clinical routine
*EmbryoScopeTM
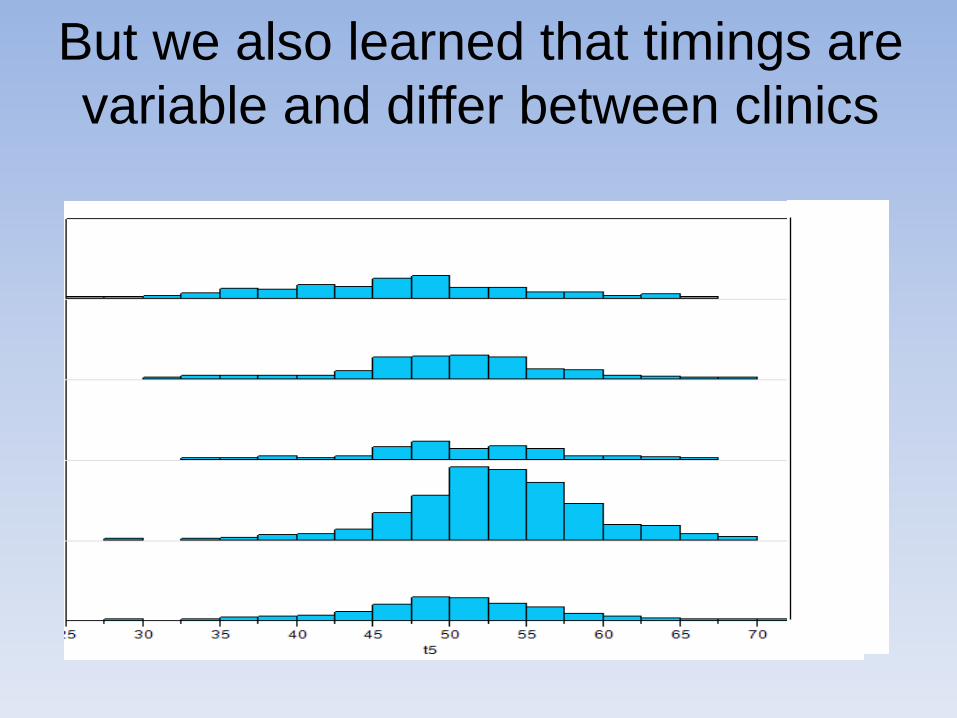
But we also learned that timings are
variable and differ between clinics

Evaluation of published data on
timing of cell divisions
Chamanyou S et al. 2013. J Assist Reprod Genet
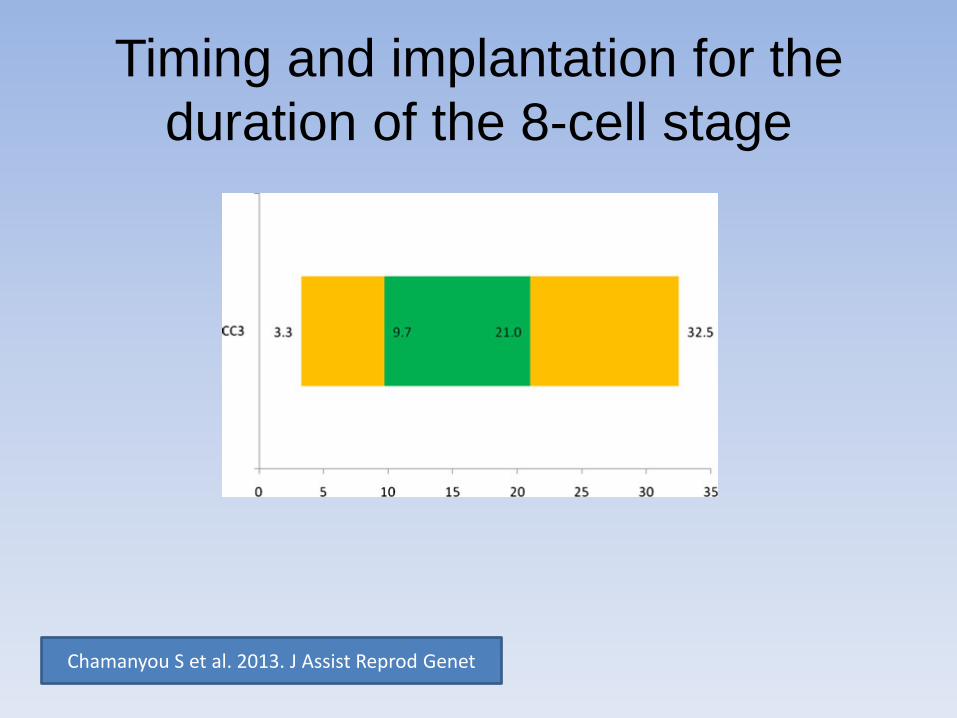
Timing and implantation for the
duration of the 8-cell stage
Chamanyou S et al. 2013. J Assist Reprod Genet
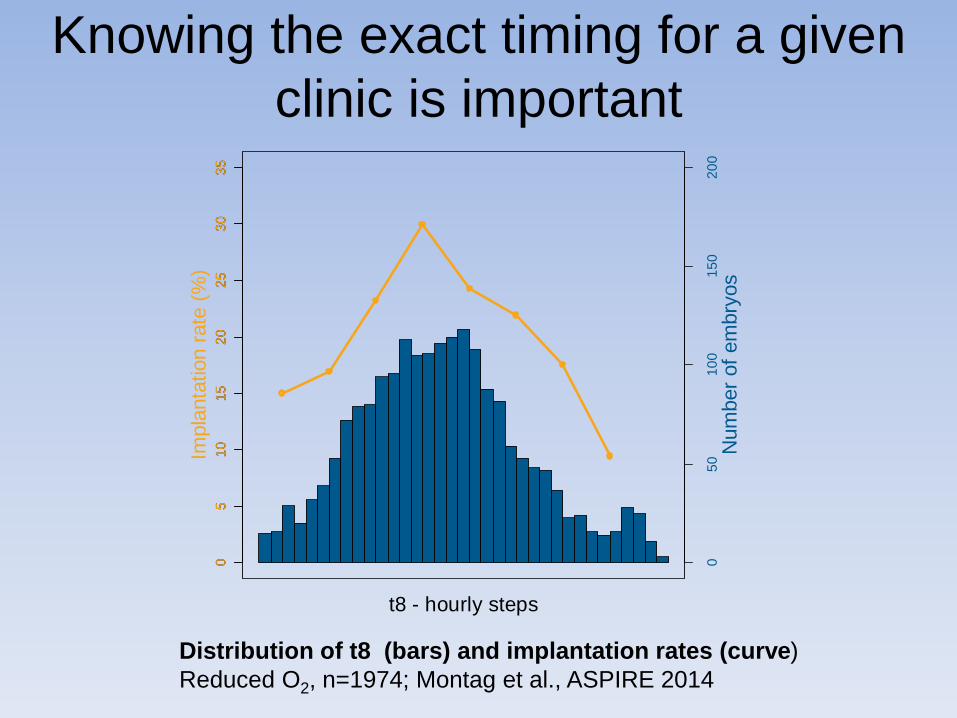
Knowing the exact timing for a given
clinic is important
t8 - hourly steps
05
01
00
15
02
00
05
10
15
20
25
30
35
05
10
15
20
25
30
35
Num
ber
of
em
bry
os
Impla
nta
tion r
ate
(%
)
Distribution of t8 (bars) and implantation rates (curve)
Reduced O2, n=1974; Montag et al., ASPIRE 2014

New de-selection criteria
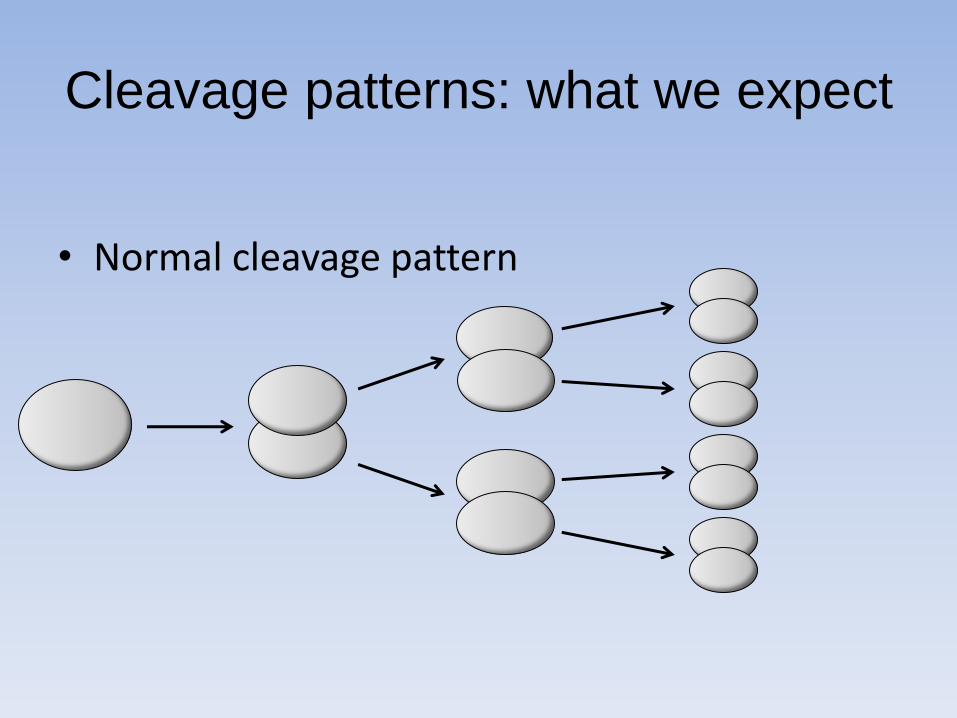
Cleavage patterns: what we expect
• Normal cleavage pattern
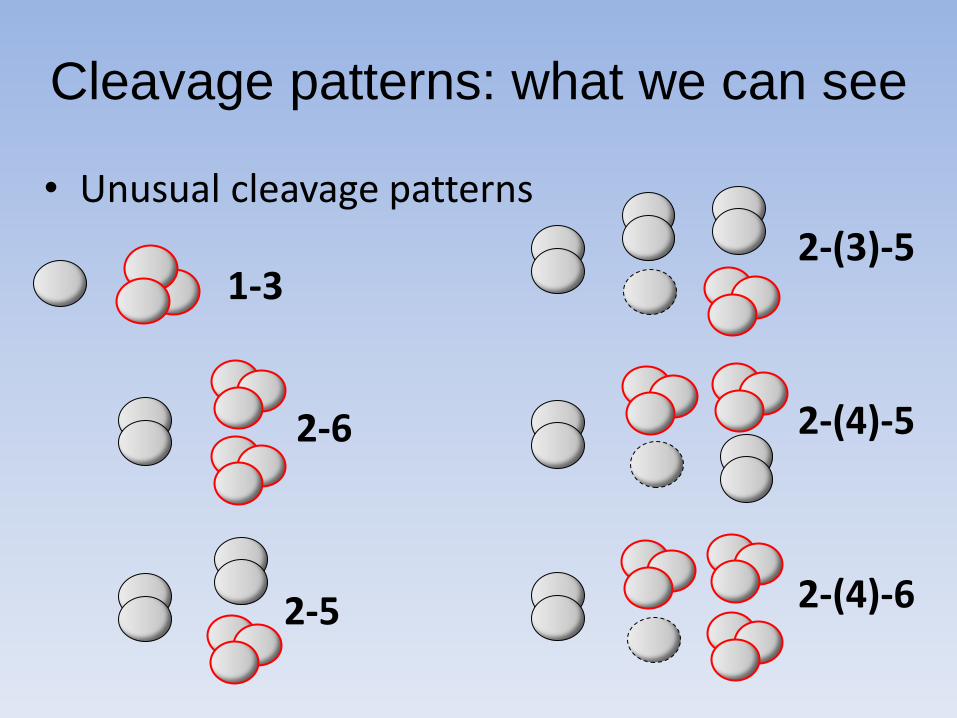
Cleavage patterns: what we can see
• Unusual cleavage patterns
1-3
2-6
2-5 2-(4)-6
2-(4)-5
2-(3)-5
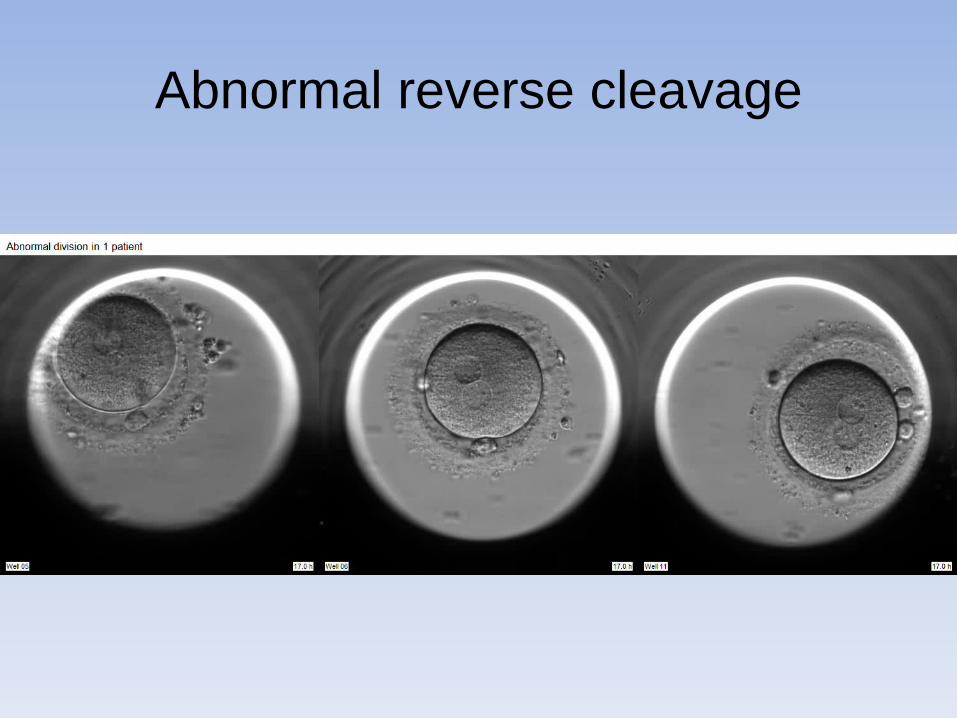
Abnormal reverse cleavage

Cleavage from 1-blastomere to 3-blastomeres in less than 5 hrs

Direct division from 1- to 3-cells
N=109 N=1550
80, 73%
2, 2%
2, 2%
24, 22%
1, 1% Direct 1->3 division
hCG neg
Biochemical abortion
Clinical abortion
Partial implantation
Known implantation
804, 52%
94, 6%
82, 5%
367, 24%
203, 13%
Not direct 1->3 division
Rubio I et al. 2012Fertility and Sterility / retrospective observational multicenter study
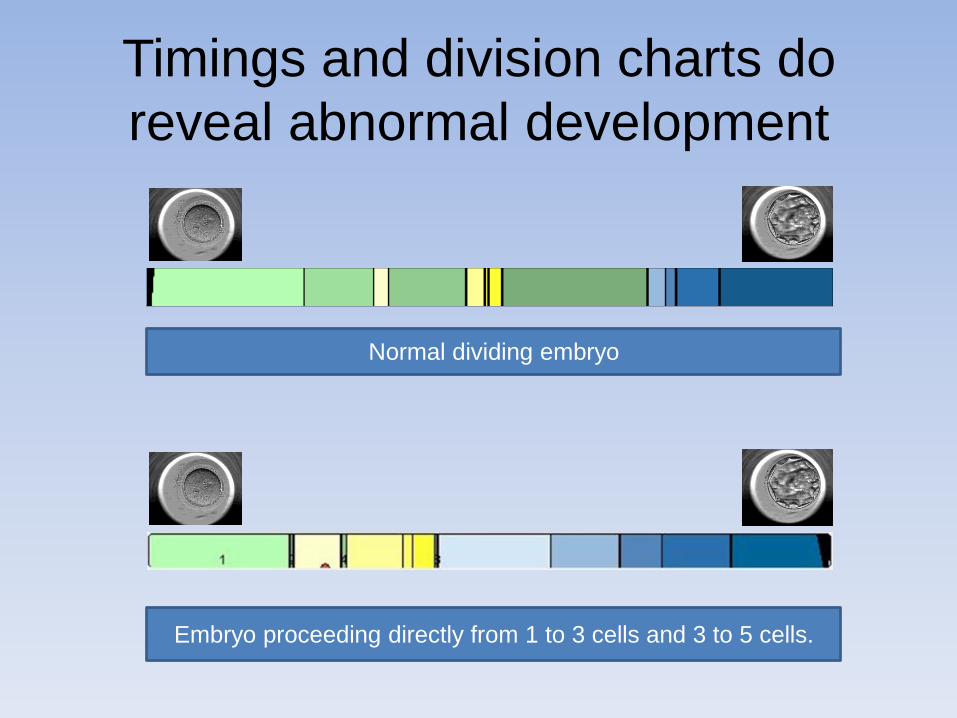
Timings and division charts do
reveal abnormal development
Normal dividing embryo
Embryo proceeding directly from 1 to 3 cells and 3 to 5 cells.
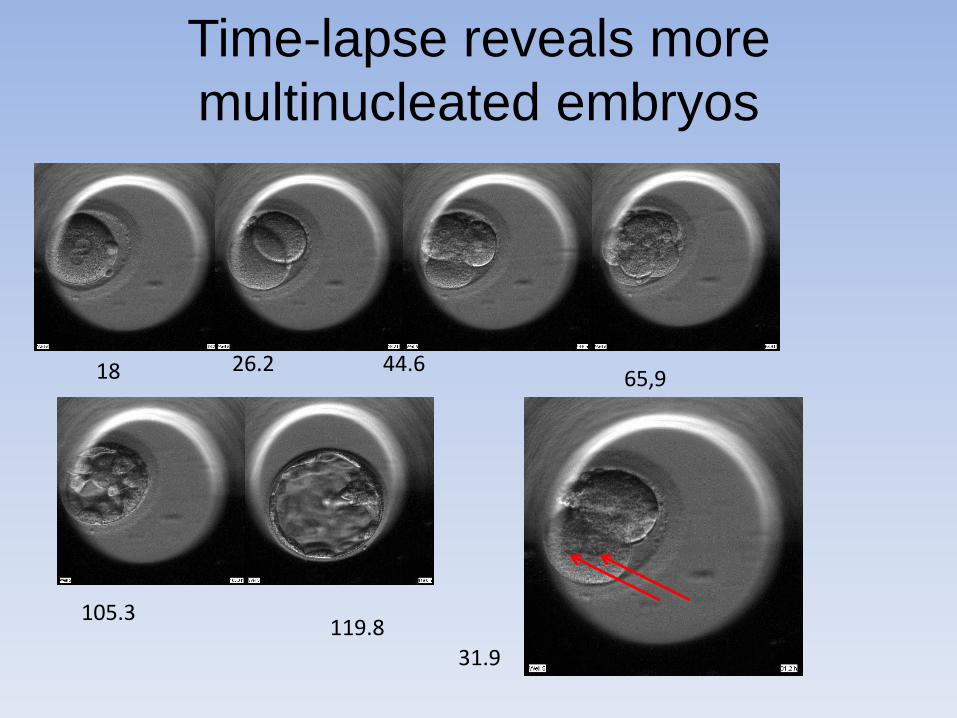
Time-lapse reveals more
multinucleated embryos
26.2 18 65,9 44.6
119.8 105.3
31.9
4-10 cell embryo with multinucleation
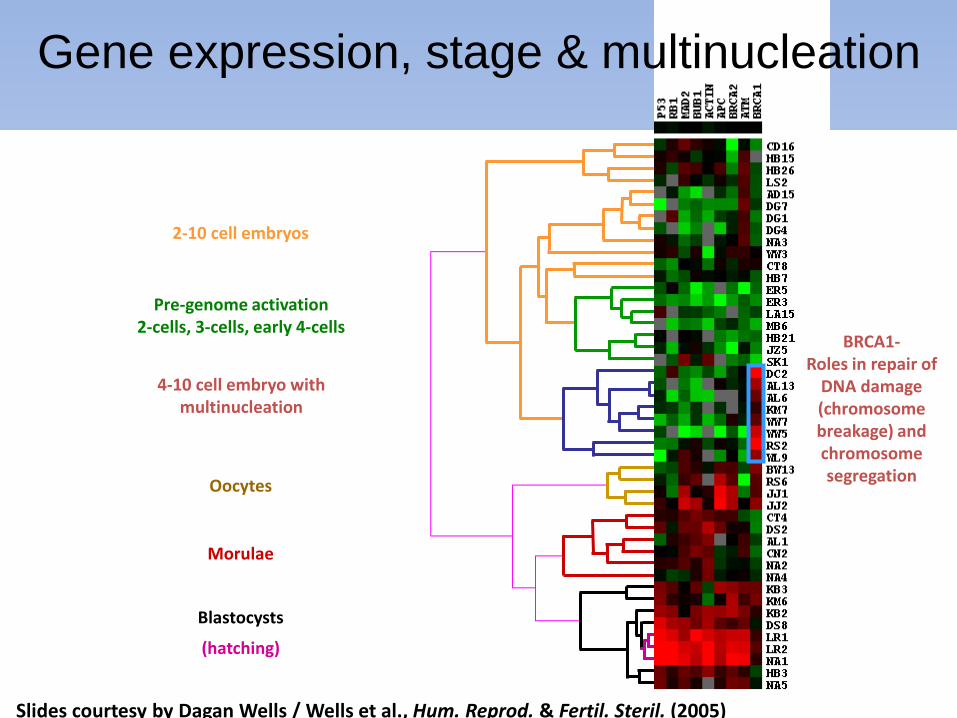
Slides courtesy by Dagan Wells / Wells et al., Hum. Reprod. & Fertil. Steril. (2005)
Gene expression, stage & multinucleation
Pre-genome activation 2-cells, 3-cells, early 4-cells
Oocytes
Morulae
Blastocysts
(hatching)
2-10 cell embryos
BRCA1- Roles in repair of
DNA damage (chromosome breakage) and chromosome segregation

The clinical impact: How much do we see with
standard (static) evaluation* versus time-lapse
Direct divison 1- to 3-cells
Multinucleation at the
2-cell stage
MN at the 4-cell stage
Division 2- to 5-cells
Extremely low implantation potential –
missed 63% at 24-26 hrs
40% reduction implantation potential –
missed 21% at 44-45 hrs
Various reports of reduced implantation potential–
missed 23% at 44-45 hrs
Various reports of reduced implantation potential–
missed 38% at 24-26 hrs
* Using the timings recommended in the Alpha / ESHRE consensus
External factors affecting
the embryo timing

Factors affecting morphokinetics…
t2 t3 t4 t5 t8
cc1 cc2 cc3
s2 s3
Age
ICSI Media
pH Oxygen
Aneuploidy Viability?
Etiology
Temperature
Handling
Embryo Development
Stimulation
Maturity
Biopsy
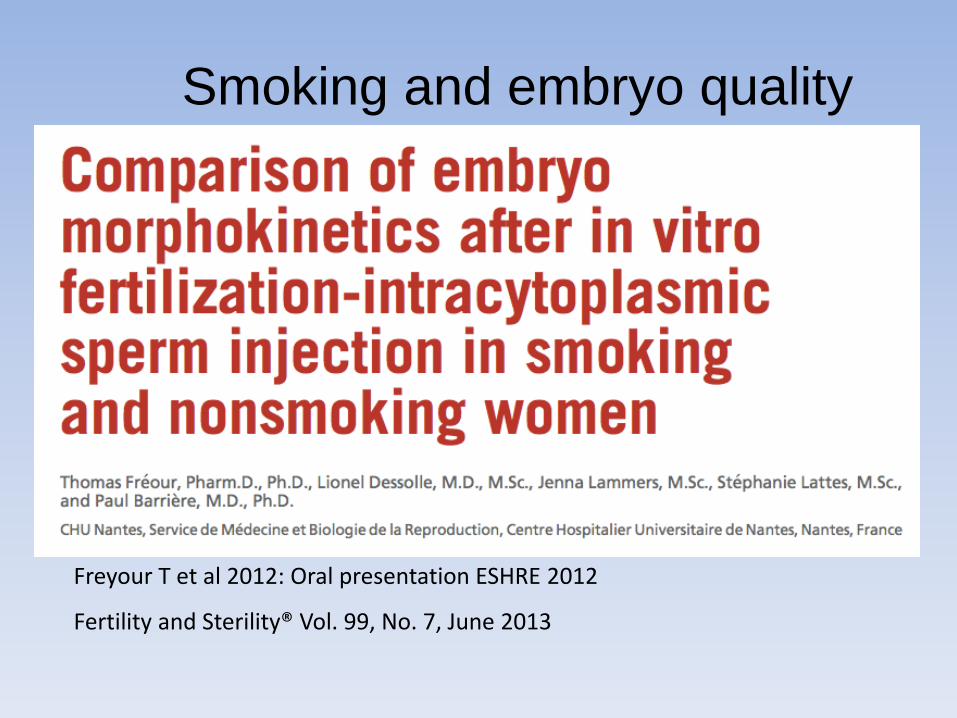
Smoking and embryo quality
Freyour T et al 2012: Oral presentation ESHRE 2012
Fertility and Sterility® Vol. 99, No. 7, June 2013

Results :
- No difference in conventional morphology
- Significant difference in the kinetics of cell division:
- Embryos of smoking women reached the 3-cell and 5-cell stage
slower than the embryos of non-smoking women (p= 0.01)
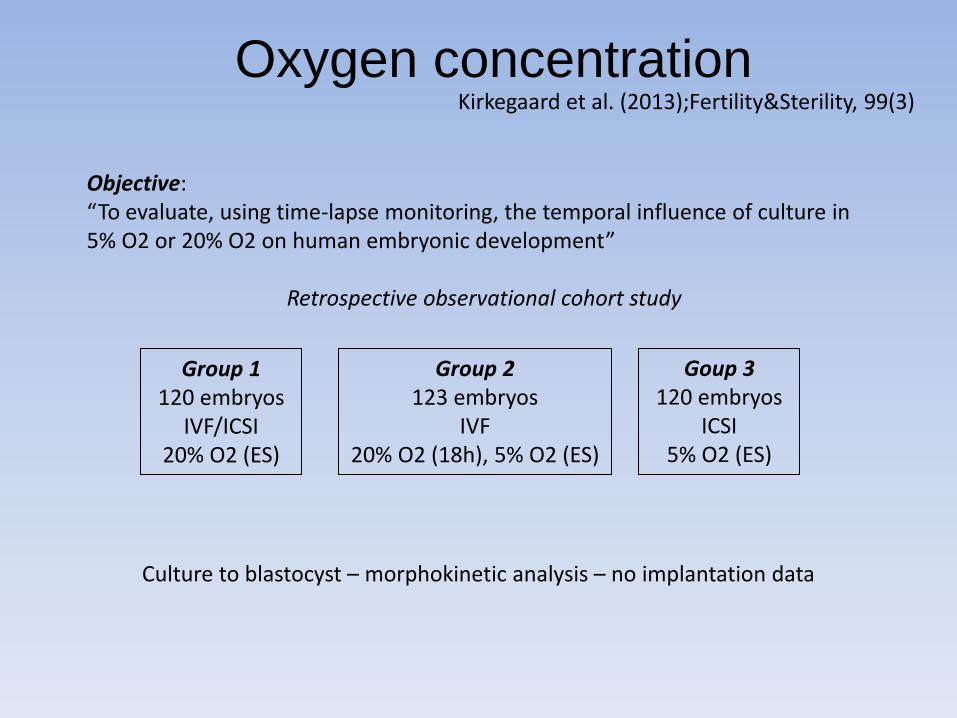
Oxygen concentration
Objective: “To evaluate, using time-lapse monitoring, the temporal influence of culture in 5% O2 or 20% O2 on human embryonic development”
Retrospective observational cohort study
Group 1 120 embryos
IVF/ICSI 20% O2 (ES)
Group 2 123 embryos
IVF 20% O2 (18h), 5% O2 (ES)
Goup 3 120 embryos
ICSI 5% O2 (ES)
Culture to blastocyst – morphokinetic analysis – no implantation data
Kirkegaard et al. (2013);Fertility&Sterility, 99(3)

Culture Conditions (O2) Kirkegaard et al. (2013);Fertility&Sterility, 99(3)
• Severely delayed timing at late cleavage stages in ambint air • Already an exposure for 18 hours has an effect (Group 2)

t5 - hourly steps
0.0
00
.05
0.1
00
.15
05
10
15
20
25
30
35
05
10
15
20
25
30
35
Rela
tive a
mount
Impla
nta
tion r
ate
(%
)0
51
01
52
02
53
03
5
0.0
00
.05
0.1
00
.15
Comparing t5 timings and implantation rates between reduced O2 (blue bars, solid line) and ambient O2 (hatched bars, dashed line), n=5365
Impact of Oxygen on t5

Applying time-lapse in
quality control
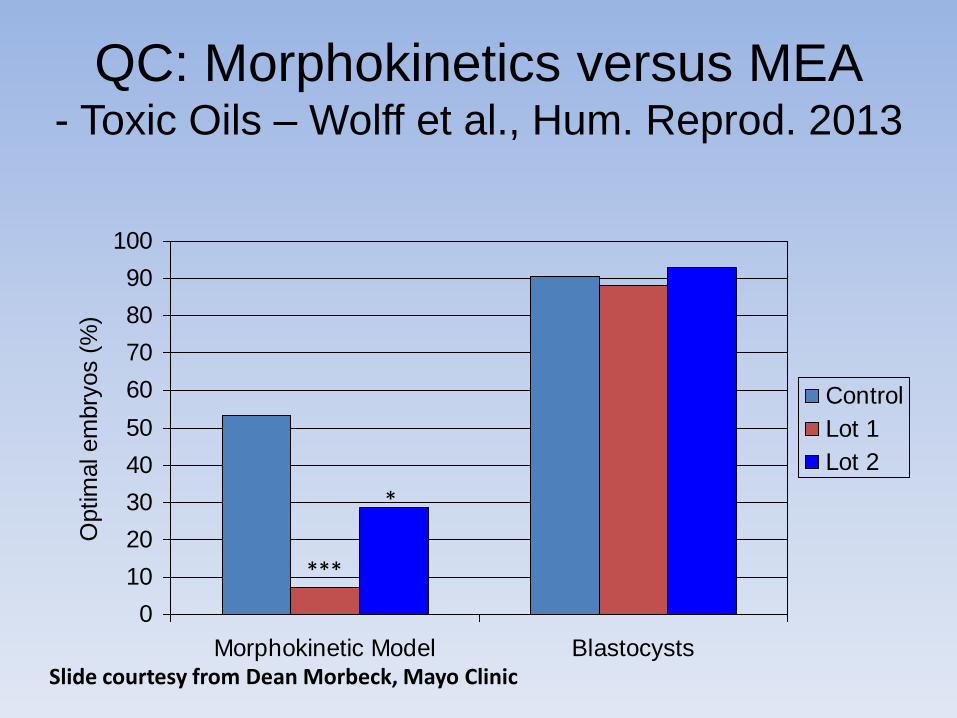
QC: Morphokinetics versus MEA - Toxic Oils – Wolff et al., Hum. Reprod. 2013
0
10
20
30
40
50
60
70
80
90
100
Morphokinetic Model Blastocysts
Optim
al em
bry
os (
%)
Control
Lot 1
Lot 2
*
***
Slide courtesy from Dean Morbeck, Mayo Clinic
The next step forward :
Applying models / algorithm for evaluating
the implantation potential of embryos
in the daily routine clinical work

Potential selection parameters
have been identified
• Correct fertilization*
• Optimal ranges for the timing of cleavages*
• Optimal division characteristics*
• Optimal morphology
– blastomer size variation
– fragmentation etc.
*Scientific evidence available either retrospective observational or prospective

Potential de-selection parameters
have been identified
• Fast division like 1 to 3, 2-5*
• Multinucleation
• Reverse cleavage
• Uneven blastomere size 2-cell / 4-cell*
*Scientific evidence available either retrospective observational or prospective

Models: from basic to tailor-made including clinic characteristics
15.000

Meseguer et al., 2011, Human Reproduction 26:2658-71
0% versus 100% Implantation
Selection marker:
1.Division to 5-cell embryo: 48.8-56.6 h (meanwhile corrected 43-57 h)
2. Time in 3-cell stage: < 0.75 h
3.Division to 2-cell embryo: 24.6-28.2 h
Potent models have been published
- but need adaption to clinics
• Established with ambient air (no low oxygen)
• Numerous cycles with donated oocytes
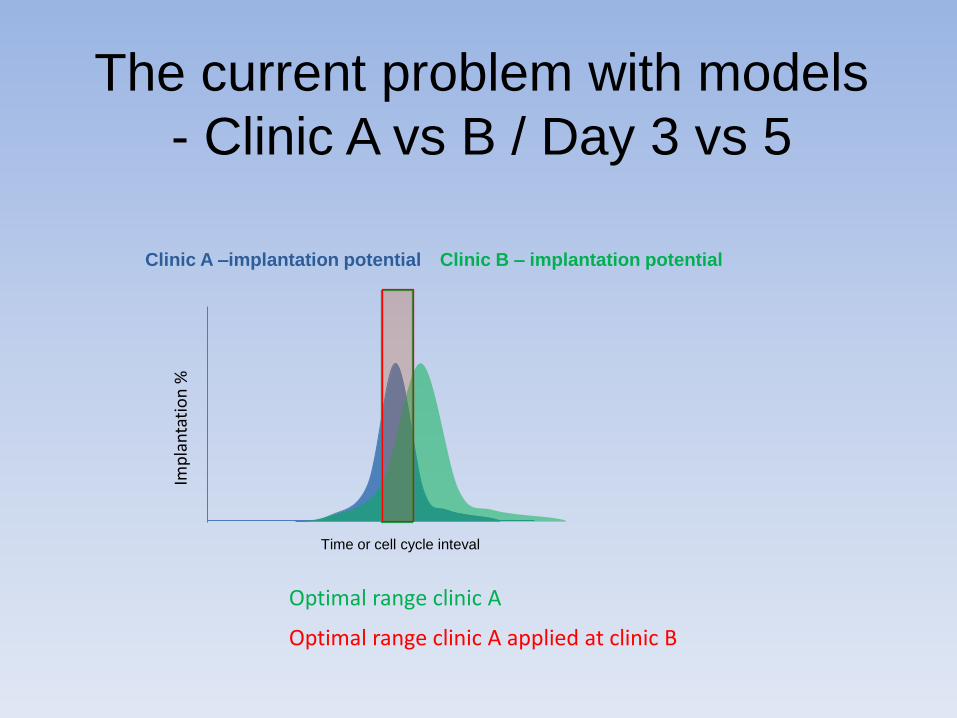
The current problem with models
- Clinic A vs B / Day 3 vs 5
Time or cell cycle inteval
Clinic B – implantation potential Clinic A –implantation potential
Imp
lan
tati
on
%
Optimal range clinic A
Optimal range clinic A applied at clinic B

Conclusion
• Time-lapse has arrived and it will change our way of embryo assessmenct
• Time-lapse has already today a clinical impact
• New selection criteria have been found and introduced:
– PN fading
– Exact time for t2 and t8 is important
– Cell cycle lenght have an impact
– Fast division cycles
– Time to reach the blastocyst

Thank you for your attention ?