Time analysis of the containerized cargo flow in the ...
9
Time analysis of the containerized cargo flow in the logistic chain using simulation tools: the case of the Port of Seville (Spain) J. J. Ruiz-Aguilar Lecturer, Intelligent Modelling of Systems Research Group, University of Cádiz, Polytechnic School of Engineering (Algeciras) Spain I. J. Turias Assistant professor, Intelligent Modelling of Systems Research Group, University of Cádiz, Polytechnic School of Engineering (Algeciras) Spain M. Cerbán Lecturer, Research Group Transport and Innovation Economic, University of Cádiz, Faculty of Economics, Spain M. J. Jiménez-Come Lecturer, Intelligent Modelling of Systems Research Group, University of Cádiz, Polytechnic School of Engineering (Algeciras), Spain M. J. González Contracted researcher, IAT (Andalusian Institute of Technology), Seville, Spain A. Pulido General Manager of the Port of Seville, Port Authority of Seville, Spain RESUMEN The logistic chain that connects the capital of Spain (Madrid) with the Canary Islands has the Port of Seville as the port node. This port node makes possible to switch from one transport mode (railway) to another (maritime) at the container terminal of the port. Some constraints, such as the operational time window that restricts the freight train access into the port in a certain time-slot or the need of the reversal of the train before entering into port, lead to generate important time delays in the intermodal chain. A time analysis of the process is necessary in order to check the critical points. A simulation of the whole process from the goods departing the origin station by train until they leave the port of Seville by ship to the Canary Islands is performed. To this aim, a queuing model network was developed in order to simulate the travel time of the cargo. The database is composed of daily departures of goods train and daily departures of vessels (including times of docking, berthing or load/unload cargo). The final objective of this work is twofold: firstly, to provide a validated model of the containerized cargo flow and secondly, to demonstrate that this kind of queuing models can become a powerful supporting tool in making decisions about future investments. 1. INTRODUCTION CIT2016 – XII Congreso de Ingeniería del Transporte València, Universitat Politècnica de València, 2016. DOI: http://dx.doi.org/10.4995/CIT2016.2016.3083 This work is licensed under a Creative Commons Attribution-NonCommercial-NoDerivatives 4.0 International License (CC BY-NC-ND 4.0).
Transcript of Time analysis of the containerized cargo flow in the ...
Time analysis of the containerized cargo flow in the logistic
chain using simulation tools: the case of the Port of Seville
(Spain)
J. J. Ruiz-Aguilar
Lecturer, Intelligent Modelling of Systems Research Group, University of Cádiz,
Polytechnic School of Engineering (Algeciras) Spain
I. J. Turias
Assistant professor, Intelligent Modelling of Systems Research Group, University of
Cádiz, Polytechnic School of Engineering (Algeciras) Spain
M. Cerbán
Lecturer, Research Group Transport and Innovation Economic, University of Cádiz,
Faculty of Economics, Spain
M. J. Jiménez-Come
Lecturer, Intelligent Modelling of Systems Research Group, University of Cádiz,
Polytechnic School of Engineering (Algeciras), Spain
M. J. González
Contracted researcher, IAT (Andalusian Institute of Technology), Seville, Spain
A. Pulido
General Manager of the Port of Seville, Port Authority of Seville, Spain
RESUMEN
The logistic chain that connects the capital of Spain (Madrid) with the Canary Islands has
the Port of Seville as the port node. This port node makes possible to switch from one
transport mode (railway) to another (maritime) at the container terminal of the port. Some
constraints, such as the operational time window that restricts the freight train access into
the port in a certain time-slot or the need of the reversal of the train before entering into port,
lead to generate important time delays in the intermodal chain. A time analysis of the process
is necessary in order to check the critical points. A simulation of the whole process from the
goods departing the origin station by train until they leave the port of Seville by ship to the
Canary Islands is performed. To this aim, a queuing model network was developed in order
to simulate the travel time of the cargo. The database is composed of daily departures of
goods train and daily departures of vessels (including times of docking, berthing or
load/unload cargo). The final objective of this work is twofold: firstly, to provide a validated
model of the containerized cargo flow and secondly, to demonstrate that this kind of queuing
models can become a powerful supporting tool in making decisions about future
investments.
1. INTRODUCTION
CIT2016 – XII Congreso de Ingeniería del TransporteValència, Universitat Politècnica de València, 2016.DOI: http://dx.doi.org/10.4995/CIT2016.2016.3083
This work is licensed under a Creative Commons Attribution-NonCommercial-NoDerivatives 4.0 International License (CC BY-NC-ND 4.0).

.
The railway corridor that links the Abroñigal Railway Terminal (Madrid) with the Port of
Seville is configured as the main route in the transportation of goods to the Canary Islands.
The increase in freight traffic of this critical route, together with certain political or
infrastructure restrictions, create the necessity for the Port Authority of Seville (PAS) to
modify or to improve the port access. Nevertheless, this kind of infrastructure requires large
investments that must be justified, especially in the actual context of the current economic
crisis. An analysis of the travel times of goods from its departure from the Abroñigal Railway
Terminal (Madrid), to its departure from the Port of Seville by ship (towards the Canary
Islands) was developed. The whole transportation process was thereby modelled, simulated
and analysed by queuing theory using a Discrete Event System (DES) model.
Queuing theory is a mathematical study of waiting lines and was firstly introduced by Erlang
(1917) to analyse congestion in telephone networks. Since then, it has been widely extended
to other research fields such as economics, transportation, computing or telecommunication.
Concerning the transport sector, queueing theory has demonstrated to be an effective tool to
model and simulate traffic flows. The earlier studies of Heidemann (1991, 1994) proved the
successful use of this approach modelling the distributions of queue lengths and delays at
intersections and traffic signals. After that, Vandalae et al. (2000) used queuing models to
simulate behaviour of traffic flows. In contrast to queuing theory, DES models are more
versatile and have become a widely used simulation tool that underpin decision support
systems (DSS) (Quaddus and Intrapairot 2001). DES models are free from assumptions of
the particular type of the arrival process as well as the service time. A DES system evolves
in accordance with the sudden occurrence of physical events, at possibly unknown irregular
intervals. DES model is generally composed of a network of queues where state changes
occur at a discrete point of time. DES models has demonstrated reaching a huge performance
in modelling complex systems. In the field of logistics, simulation-based DSS systems
provide powerful solutions to several issues not only in the strategic level but also at the
operational level (Tako and Robinson, 2012). The work of Tako and Robinson (2012) stated
that DES has been used in literature frequently to model supply chains. Furthermore, this
study suggests that DES appears to be more suitable to undertake issues concerning the
operational level, such as distribution and transportation planning, routing and scheduling,
the design of the transportation network or choice of the transportation models, which are
issues raised in our proposed study, and finally the authors concluded that DES is a powerful
technique that can be integrated in DSS of the field of logistic and supply chain management.
Due to its capacity to support decision-making providing solution with a high detailed level
(Kellner et al., 1999), DES has been also successfully applied in traffic simulations. Some
recently examples are the application of DES to simulate movements of several trains
(Valigura et al., 2009) and to model the performance of bus rapid transit (Gunawan and
Gunawan, 2013). In particular, DES has been widely used to generate DSS in maritime
transport and ports tasks (Gambardella and Rizzoli, 2000; Thiers and Janssens, 1998).
Concerning these kind of transport issues, simulation tools have been used in several studies
CIT2016 – XII Congreso de Ingeniería del Transporte València, Universitat Politècnica de València, 2016. DOI: http://dx.doi.org/10.4995/CIT2016.2016.3083
This work is licensed under a Creative Commons Attribution-NonCommercial-NoDerivatives 4.0 International License (CC BY-NC-ND 4.0).

.
improving certain port processes and solving particular logistic problems: to assess and
improve the inter-terminal transport within the port area (Duinkerken and Ottjes, 2000), to
solve storage locations of containers (Preston and Kozan, 2001), to assess berth and crane
operations (Soriguera et al., 2006), to forecast the number of freight inspections carried out
in the port facilities ( J. J. Ruiz-Aguilar et al., 2014; J. J. Ruiz-Aguilar et al., 2015a; J. J.
Ruiz-Aguilar et al., 2015b) and to simulate the landslide congestion in a port container
terminal (Veloqui et al., 2014).
2. DESCRIPTION OF THE PROCESS INVOLVED
Following the guidelines of the European Union (UE) “MED-PORTS” Research Project (II-
B/3.2/0711), the freight containerized transport route Madrid-Seville-Canary Islands is
simulated and analysed. The whole itinerary is described below and schematically
summarized in Fig. 1. First, the train wagons are loaded at Abroñigal Railway Terminal by
two freight operators: RENFE (95% of the time) and TRANFESA (5%). Then, the train
leaves the Abroñigal Railway Station within a time slot between 18:00 h and 20:00 h. The
trains have to cover a distance of around 465 km from Abroñigal Terminal (Madrid) to
Majarabique Station (Seville), investing a total time of approximately 8 h. At Majarabique
Station, a diesel locomotive is coupled in the rear of the train. After that, the train heads to
La Salud Station. Here, in order to access into the Port of Seville, some restrictions must be
satisfied. The length of the siding of this station is lower than 450 m. Thus, only the trains
which do not exceed 450 m can perform the reversal manoeuvre to enter into the port pulled
by the diesel locomotive. Trains with a length of more than 450 m have to head to Dos
Hermanas Station, a nearby station, in order to perform the manoeuvre and then come back
to La Salud. However, passenger trains have priority in this route. Thus, an operational time
window regulates the traffic of goods trains in this path and allows them to circulate only
within the time slot from 23:00 to 06:00 h. Trains which do not fall within this time slot and
have a length exceeding 450 m have to be divided into two parts in La Negrilla Station and
must wait for the National Rail Infrastructure Agency (ADIF) instructions to allow them
access into the port. This situation involves two reversals and thereby significant delays. The
first train part often enters about 10:00 h and the second one around 12:00 h. Once the
reversal manoeuvre is performed, the train heads to the terminal container of the Port of
Seville. Here, the train must wait if it arrives before the start time of the load/unload process
by the terminal operator (from 08:00 h). Besides, the train must arrive 2 h before the
departure of the vessel in order to perform the container unloading of the train and its loading
and stowage of the vessel. Finally, the freight follows a different path depending on the
destination (two port destinations in the Canary Islands) and the arrival day:
Train arrival on Tuesday morning. The freight is loaded onto two vessels (Vessel 1 and
Vessel 2) leaving the Port of Seville on Tuesday, dividing the cargo between them. The
vessels are the different shipping companies. If the train is delayed, the goods of Vessel
1 can depart on Friday, in Vessel 3 (the same company) whereas goods transported in
CIT2016 – XII Congreso de Ingeniería del Transporte València, Universitat Politècnica de València, 2016. DOI: http://dx.doi.org/10.4995/CIT2016.2016.3083
This work is licensed under a Creative Commons Attribution-NonCommercial-NoDerivatives 4.0 International License (CC BY-NC-ND 4.0).

.
Vessel 2 must wait to depart in the following week in the same vessel (Vessel 2).
Train arrival on Friday morning. The freight is loaded onto Vessel 3 that leaves from the
port of Seville on Friday. If the train is delayed, the goods with Destination 2 may leave
on Saturday in Vessel 4 whereas goods with Destination 1 have to wait until Tuesday.
Train arrival on Saturday morning. Goods are loaded onto Vessel 4 on Saturday/Sunday.
If the train is delayed, the cargo is loaded Vessel 1 the following Tuesday.
Fig. 1 – Schematic diagram of the freight flow (Madrid-Seville-Canary Islands).
3. MATERIAL AND METHODS
3.1 Brief introduction to the methodology
The proposed methodology is based on the queueing theory, using SimEvents ® module of
the Simulink ® software. Creating a DES model, SimEvents simulates the passing of entities
through certain blocks, which represent network of queues, gates, servers and switches,
based on events. DES are mainly based on discrete items called entities which represent
individually objects or people. Each entity can carry data (attributes) that determine what
happen to them through the simulation. An event is understood as a passing of an entity
through a block representing a discrete incident that modifies the occurrence, outputs, or
state of variables of next events. In this work, entities represent the goods trains and their
passing between blocks (paths, railway stations) are events. The entities can contain
information about trains: the total time invested in each section of the itinerary by a train,
the departure date and time, number of train, the destination, the train operator or total train
length. Some data are assigned to individual entities as input parameters whereas other
information are attributed or modified during the process in m-files programmed by authors.
MAJARABIQUE
STATION
Operator ?
Total
length ?
Out of
operational time
window ?
LA SALUD
STATION
RENFETRANSFESA
< 450 m
DOS HERMANAS
STATION
no yes
Arrival before
08:00 am ?
Departure day?
no
CONTAINER
TERMINAL
(PORT OF SEVILLE)
yes
Destination?Out of
time?
Out of
time?
Tuesday Saturday / SundayFriday
Out of
time?
Destination 1 Destination 2
VESSEL 1 VESSEL 2 VESSEL 3 VESSEL 4
no yes
yesno no yes
> 450 m
LA NEGRILLA
STATION
Out of
time?
no yes
Destination?
1 2
ABROÑIGALTERMINAL
(MADRID)
Reversal of Direction
Train partition
Locomotive coupling
CIT2016 – XII Congreso de Ingeniería del Transporte València, Universitat Politècnica de València, 2016. DOI: http://dx.doi.org/10.4995/CIT2016.2016.3083
This work is licensed under a Creative Commons Attribution-NonCommercial-NoDerivatives 4.0 International License (CC BY-NC-ND 4.0).

.
3.2 The database
The database includes the daily train departures from the Abroñigal Terminal (provided by
ADIF), the train arrivals to the container terminal at Port of Seville (provided by the terminal
operator) and the vessel departures from the Port of Seville (provided by the PAS). The
traceability of each train is obtained by linking the entities and dates from the three databases.
The database provided by ADIF contains the train departure dates and times from the
Abroñigal Terminal to La Salud Station and it is composed by daily departures of goods
trains, comprising a total of 90 records from July 2013 to December 2013. The goods trains
depart usually on Mondays, Wednesdays/Thursdays and Fridays (one train per day). The
terminal database includes dates and times of the vessel operations (load/unload, docking,
berthing, start/end operative, etc.), departing one vessel per day, except on Mondays.
4. THE SIMULATION MODEL
The whole process presented in section 2 was modelled by DES, using SimEvents. This
model was validated comparing the simulated times with the real values contained in the
database. Prior to validate the model, several times were considered and analysed in order
to measure the critical points of the railway corridor. These time values, collected in Table
1, are average times extracted from the available databases.
Time Train route Average
Time
S.D.
T1 Departure Abroñigal Terminal – Arrival Majarabique Station 490.339 39.475
T2 Arrival Majarabique – Departure Majarabique 299.042 15.751
T3 * Departure Majarabique – Departure La Salud 63.564 13.532
T4 Departure La Salud – Functional Point 15.000 3.000
T5 Functional Point – Arrival Container Terminal (constant) 40.000 15.00
T6 Arrival Terminal Container – Receipt of goods (from 08:00) Variable
T7 Receipt of goods – Vessel operation start Variable
T8 ** Vessel 1 (08:00 h) Vessel operations start – Operation end
(Start time in brackets)
456.400 50.388
Vessel 2 (17:00 h) 297.000 55.770
Vessel 3 (08:00 h) 570.000 145.113
Vessel 4 (var.) 380.667 82.155
T9 Vessel 1 Vessel operation end – Undocking 187.292 110.931
Vessel 2 20.455 20.004
Vessel 3 231.263 126.262
Vessel 4 291.071 150.594
T10 Vessel 1 Undocking – Outward the lock 62.609 10.426
Vessel 2 60.227 15.433
Vessel 3 67.200 15.742
Vessel 4 60.400 6.613
Table 1 – Mean time and standard deviation of the observed times. Time in minutes.
(*) Reversal of direction computed in this section. If the train partition is included, 3 h
are adding. (**) Vessel 4 operative usually starts 2 to 3 h after the ship berthing.
CIT2016 – XII Congreso de Ingeniería del Transporte València, Universitat Politècnica de València, 2016. DOI: http://dx.doi.org/10.4995/CIT2016.2016.3083
This work is licensed under a Creative Commons Attribution-NonCommercial-NoDerivatives 4.0 International License (CC BY-NC-ND 4.0).
.
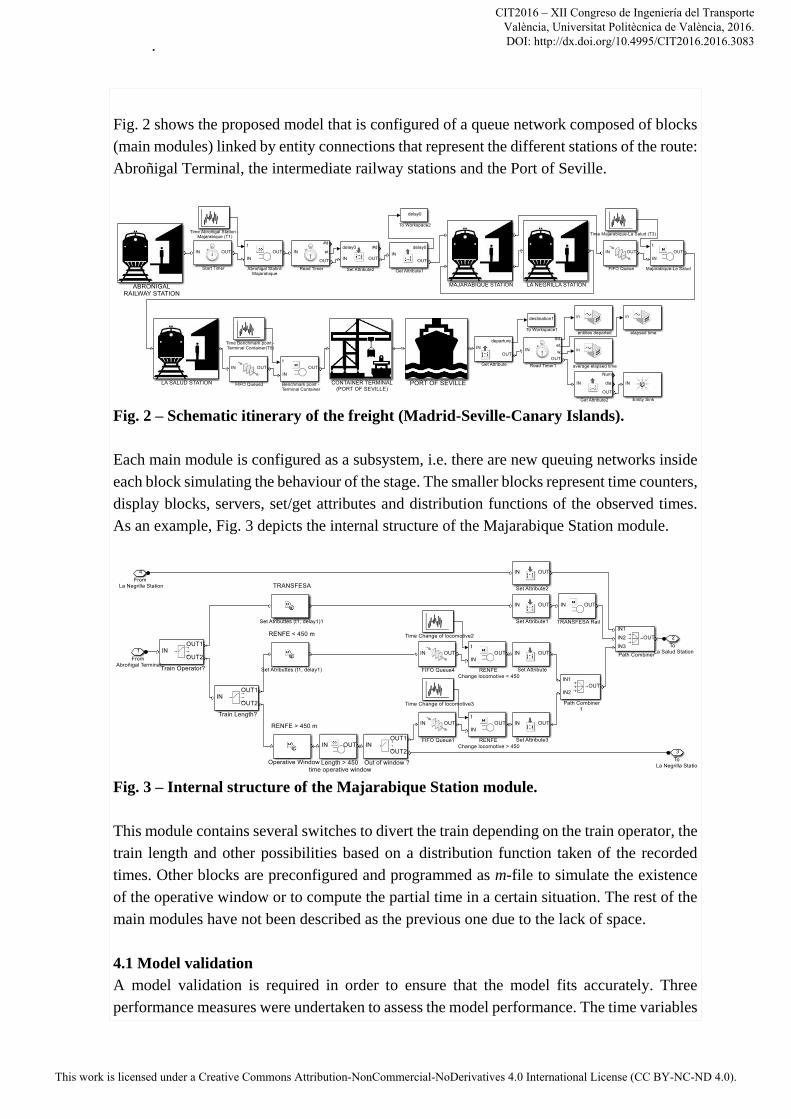
Fig. 2 shows the proposed model that is configured of a queue network composed of blocks
(main modules) linked by entity connections that represent the different stations of the route:
Abroñigal Terminal, the intermediate railway stations and the Port of Seville.
Fig. 2 – Schematic itinerary of the freight (Madrid-Seville-Canary Islands).
Each main module is configured as a subsystem, i.e. there are new queuing networks inside
each block simulating the behaviour of the stage. The smaller blocks represent time counters,
display blocks, servers, set/get attributes and distribution functions of the observed times.
As an example, Fig. 3 depicts the internal structure of the Majarabique Station module.
Fig. 3 – Internal structure of the Majarabique Station module.
This module contains several switches to divert the train depending on the train operator, the
train length and other possibilities based on a distribution function taken of the recorded
times. Other blocks are preconfigured and programmed as m-file to simulate the existence
of the operative window or to compute the partial time in a certain situation. The rest of the
main modules have not been described as the previous one due to the lack of space.
4.1 Model validation
A model validation is required in order to ensure that the model fits accurately. Three
performance measures were undertaken to assess the model performance. The time variables
CIT2016 – XII Congreso de Ingeniería del Transporte València, Universitat Politècnica de València, 2016. DOI: http://dx.doi.org/10.4995/CIT2016.2016.3083
This work is licensed under a Creative Commons Attribution-NonCommercial-NoDerivatives 4.0 International License (CC BY-NC-ND 4.0).

.
used are random variables that came from a probability distribution obtained from the real
behaviour whereas other variables, for instance the train operator, are designed using a
predetermined random probability. In these cases, the probability of going through a certain
path depends on the probability distribution used. Thus, it is not possible an exact fitting of
the total travel of an entity (train). To validate the model, the three performance measures
used are the total average elapsed time (tm), the index of agreement (d) and the correlation
coefficient (R) that are robust and effective measures to compare the total elapsed time
obtained against the real elapsed time. Indexes d and R are described in Equations (1) and
(2) where the parameter o indicates the observed value and ŷ represents the simulated value.
d values are ranged between 0 and 1 whereas R values are comprised between -1 and 1. R
and d values close to 1 indicate better performance. Note that the wide time margin between
consecutive departures avoid queues building up during the process.
2 2
1 11 ˆ ˆ( ) ( )
n n
i i i ii id y o y o o o
(1)
2 2
1 1 1ˆ ˆ ˆ ˆ( )( ) ( ) ( )
n n n
i i i ii i iR o o y y o o y y
(2)
5. RESULTS
The main aim of the study is to obtain a simulation model that represents the real process of
this intermodal chain accurately. In order to guarantee the randomness of the process, 20
repetitions of the simulation were considered. The final values of the performance measures
are the averages of these repetitions. The results obtained are plotted in Figs. 4 and 5. The
total travel time of each entity (from its departure by train from the Abroñigal Terminal
(Madrid) until it leaves the Port of Seville lock by vessel) is shown in Fig. 4 left. The average
travel time are plotted in Fig. 4 right and varies over simulation time. The final average travel
time obtained from the simulation is 1948.34 min. It is a value very close to the real average
travel time measured from the database (2001.67 min). The simulated time results were also
graphically compared with the observed values. Fig. 5 represents a comparison between real
times and their simulated values. The figure graphically shows the good performance of the
model in which the simulated values are very close to the real values. Values in grey denote
the real data and values in blue represent the simulated data. The number close to grey values
depicts the departure number of the goods (entities) from the Abroñigal Railway Terminal.
Fig. 4 – Simulated travel time (left) and simulated average time (right) for each entity.
0 0.5 1 1.5 2
x 105
0
1000
2000
3000
4000
5000
Simulation T ime (minutes x 105)
Tim
e p
er e
nti
ty
(min
ute
s)
0 0.5 1 1.5 2
x 105
1000
1500
2000
Simulation T ime (minutes x 105)
Tim
e p
er e
nti
ty
(min
ute
s)
CIT2016 – XII Congreso de Ingeniería del Transporte València, Universitat Politècnica de València, 2016. DOI: http://dx.doi.org/10.4995/CIT2016.2016.3083
This work is licensed under a Creative Commons Attribution-NonCommercial-NoDerivatives 4.0 International License (CC BY-NC-ND 4.0).

.
The R value of 0.968 and a d value of 0.983 obtained demonstrate analytically an excellent
fitting between simulated and observed values. Thus, these results close to 1 together with
the excellent results of the mean value, close to the real average time, lead to consider an
almost perfect fitting to the real data. In conclusion, the model can be used to simulate any
travel time and to assess any possible modifications (such as the elimination of certain
constraints or the execution of new infrastructure) between the Abroñigal Terminal and the
Port of Seville.
Fig. 5 – Comparison of the observed data and the simulated data.
6. CONCLUSIONS
The intermodal transport chain that links the export route of goods between Madrid and the
Canary Islands has the Port of Seville as the port node. The need of the Port Authority of
Seville to provide a better service and higher capacity due to the steady growth in the
exchange of goods leads to consider both new transport policies and the assessment of new
infrastructure, such as the elimination of the operational time window or the enlargement of
the port access. This requires investments that must be justified. To this goal, a queuing
model was performed and assessed to simulate the route of the goods. An accurate model
allows to simulating different scenarios at minimum cost, avoiding unnecessary investments
or inefficient solutions. The excellent results obtained in the validation procedure (R=0.968,
d=0.983 and a mean simulated value very close to the real value) indicate that the model can
be used to experiment certain improvements in the intermodal chain. In conclusion, this
model can be a helpful tool for decision-making within the transport policies and to evaluate
the construction of new infrastructure, even not being binding the obtained results.
ACKNOWLEGMENTS
This work has been supported by the European project “MED-PORTS – Mediterranean Ports
Sustainability & Efficiency in Intermodal Synchronization” (II-B/3.2/0711).
REFERENCES
DUINKERKEN, M. B., and OTTJES, J. A. (2000). A simulation model for automated
container terminals. In Proceedings of the Business and Industry Simulation Symposium
(Vol. 10, pp. 134–139).
ERLANG, A. K. (1917). Solution of some problems in the theory of probabilities of
significance in automatic telephone exchanges. Elektrotkeknikeren 13, pp. 5–13.
GAMBARDELLA, L., and RIZZOLI, A. (2000). The role of simulation and optimisation in
0 0.5 1 1.5 2
x 105
1000
2000
3000
Simulation T ime (min x 105)
Tim
e p
er e
nti
ty (
min
)
Observed values
Simulated values
CIT2016 – XII Congreso de Ingeniería del Transporte València, Universitat Politècnica de València, 2016. DOI: http://dx.doi.org/10.4995/CIT2016.2016.3083
This work is licensed under a Creative Commons Attribution-NonCommercial-NoDerivatives 4.0 International License (CC BY-NC-ND 4.0).

.
intermodal container terminals. In European Simulation Symposium pp. 107–116.
Hamburg.
GUNAWAN, F. E., and GUNAWAN, A. A. S. (2013). Simulation Model of Bus Rapid
Transit. In: Ford Lumban Gaol (ed.) ICASCE 2013 - International Conference on
Advances Science and Contemporary Engineering. Jakarta, Indonesia.
HEIDEMANN, D. (1991). Queue length and waiting-time distributions at priority
intersections. Transportation Research Part B: Methodological 25(4), pp. 163–174.
HEIDEMANN, D. (1994). Queue length and delay distributions at traffic signals.
Transportation Research Part B: Methodological 28(5), pp. 377–389.
JAIN, A. K., MURTY, M. N., and FLYNN, P. J. (1999). Data clustering: a review. ACM
Computing Surveys (CSUR) 31(3), pp. 264–323.
KELLNER, M. I., MADACHY, R. J., and Raffo, D. M. (1999). Software process simulation
modeling: Why? What? How? Journal of Systems and Software 46(2-3), pp. 91–105.
LARSEN, E. R., MORECROFT, J. D. W., and Thomsen, J. S. (1999). Complex behaviour
in a production–distribution model. European Journal of Operational Research 119(1),
pp. 61–74.
PRESTON, P., and KOZAN, E. (2001). An approach to determine storage locations of
containers at seaport terminals. Computers & Operations Research 28(10), 983–995.
QUADDUS, M., and INTRAPAIROT, A. (2001). Management policies and the diffusion of
data warehouse: a case study using system dynamics-based decision support system.
Decision Support Systems 31(2), pp. 223–240.
RUIZ-AGUILAR, J. J., TURIAS, I. J., and JIMÉNEZ-COME, M. J. (2014). Hybrid
approaches based on SARIMA and artificial neural networks for inspection time series
forecasting. Transportation Research Part E: Logistics and Transportation Review 67,
pp. 1–13.
RUIZ-AGUILAR, J. J., TURIAS, I. J., and JIMÉNEZ-COME, M. J. (2015). A novel three-
step procedure to forecast the inspection volume. Transportation Research Part C:
Emerging Technologies 56, pp. 393–414.
RUIZ-AGUILAR, J., TURIAS, I. J., and JIMÉNEZ-COME, M. J. (2015). A two-stage
procedure for forecasting freight inspections at Border Inspection Posts using SOMs
and support vector regression. International Journal of Production Research 53(7), pp.
2119–2130.
SORIGUERA, F., ROBUSTÉ, F., JUANOLA, R., and LOPEZ-PITA, A. (2006).
Optimization of handling equipment in the container terminal of the Port of Barcelona,
Spain. Transportation Research Record: Journal of the Transportation Research Board
1963, pp. 44–51.
TAKO, A. A., and ROBINSON, S. (2012). The application of discrete event simulation and
system dynamics in the logistics and supply chain context. Decision Support Systems
52(4), pp. 802–815.
THIERS, G. F., and JANSSENS, G. K. (1998). A port simulation model as a permanent
decision instrument. Simulation 71(2), pp. 117–125.
VALIGURA, K., FOLTIN, M., and BLAHO, M. (2009). Transport System Realization in
SimEvents Tools. Technical Computing Prague.
VANDAELE, N., WOENSEL, T. VAN, and VERBRUGGEN, A. (2000). A queueing based
traffic flow model. Transportation Research Part D: Transport and Environment 5(2),
pp. 121–135.
VELOQUI, M., TURIAS, I., CERBÁN, M. M., GONZÁLEZ, M. J., BUIZA, G., and
BELTRÁN, J. (2014). Simulating the Landside Congestion in a Container Terminal.
The Experience of the Port of Naples (Italy). Procedia - Social and Behavioral Sciences
160, pp. 615–624.
CIT2016 – XII Congreso de Ingeniería del Transporte València, Universitat Politècnica de València, 2016. DOI: http://dx.doi.org/10.4995/CIT2016.2016.3083
This work is licensed under a Creative Commons Attribution-NonCommercial-NoDerivatives 4.0 International License (CC BY-NC-ND 4.0).