Tim Holden, Bill May Rich Farnham - ITRS |...
18
On the Utility of Rescue Randy Mannequins in Rescue Systems Drop Testing Presented by: Tim Holden, Bill May & Rich Farnham
Transcript of Tim Holden, Bill May Rich Farnham - ITRS |...

On the Utility of Rescue Randy Mannequins in Rescue Systems
Drop Testing
Presented by:
Tim Holden, Bill May &
Rich Farnham

© 2009, Rocky Mountain Rescue Group, Boulder CO
On the Utility of Rescue Randy Mannequins in Rescue System Drop Testing Tim Holden1
Bill May2 Rich Farnham3
1. Introduction In 2007 the Rocky Mountain Rescue Group (RMRG) received a grant from the Mountain Rescue Association to subsidize the purchase of three Rescue Randy4 mannequins to support a series of vertical evacuation system tests. The test plan was intended to evaluate the ramifications of main line failures in two widely used vertical evacuation systems: a two line “scaffolding” system, and a main line plus belay line system. It was clearly undesirable to use actual rescuers in these tests, and it was predicted that the use of steel weights in place of the rescuer(s) and patient would produce unrealistic and potentially misleading results. Prior to initiating the full system testing, it was important to determine how well the Rescue Randy mannequins simulated actual humans in drop tests. It was also relevant to establish whether the Rescue Randy mannequin was sufficiently better as a human-body analog, when compared to steel plates, to merit the additional cost and complexity associated with the mannequins. This paper provides an overview of the testing performed to evaluate the utility of Rescue Randy mannequins in rescue system testing. Low impact force comparisons were made among actual humans, Rescue Randys, and steel plates. Higher impact force comparisons were made between Rescue Randys and steel plates (for these tests the risk to human subjects was deemed too high). For drop tests designed to determine realistic peak forces or force histories, it was found that the results produced using Rescue Randy as a test load differ significantly from results produced using steel plates; the Rescue Randy results better simulate the results expected with a human load. Specifically, tests with the steel plates provide realistic peak forces and force histories only for scenarios with significant energy absorption, and lacking inherent nonlinearities (for example, breaking bartacks or slipping prussiks). For determining forces generated by drops on highly static systems, or on systems with inherent nonlinearities, the use of Rescue Randy produces more realistic results.
1 Qualified Member, Rocky Mountain Rescue Group 2 Retired Qualified Member, Rocky Mountain Rescue Group 3 Qualified Member, Rocky Mountain Rescue Group 4 165 lb. model, manufactured by Simulaids, Inc.

© 2009, Rocky Mountain Rescue Group, Boulder CO
Figure 1: The RMRG test facility includes a 35' (10.7m) tall test tower, with 1000 lb (4.45N) of steel weights and a built-in hoist.
This paper is organized as follows: Section 2 provides a detailed description of the test tower and equipment used in this testing (additional detail is provided in an appendix). Section 3 describes the Rescue Randy mannequins, including the harness arrangement used in this testing. Sections 4 and 5 contain results from representative testing for low force tests and high force tests, respectively. For each scenario, the tests were conducted multiple times to verify accuracy and repeatability. In this paper, “typical” results are presented. The results of testing are discussed in Section 6. 2. Test Tower and Equipment
The testing presented in this paper was conducted on RMRG’s 35 foot (10.7m) tall steel test tower (Figure 1). The tower is outfitted with a hoist and a stack of thirty 33 lb. (15 kg) steel plates (for a total of 1000 lb. (455 kg)), which can be used to create a wide range of test loads. Drops are initiated using a pneumatic release mechanism (McMillan Design’s “Sea Catch”), which can be triggered either manually or via computer. Additional details of the tower are provided in Appendix A.
Data is collected by a Lenovo Thinkpad, with a National Instruments data acquisition card Model 6251, and running LabView 8.2. A variety of sensors are available, including temperature sensors, load cells, and a custom-made distance measurement system using rotary encoders (string pots). The load cells have an operational range up to 10,000 lb (44.5kN).
Significant test errors can result from using measurement devices that collect data at a rate slower than the phenomena being measured. For this reason, the load cells and data acquisition system were characterized to establish that their data sampling rates were sufficiently fast for this type of testing. Testing showed that the load cells have a self-resonant frequency near or above 7 kHz, and that the data acquisition amplifier has an effective bandwidth of roughly 5 kHz. This allows sampling rates greater than 2500 samples/second, which is more than adequate to capture the critical information in these drop tests.
3. Rescue Randy
The Rescue Randy is a commercially produced mannequin (from Simulaids Inc.), weighing 165 lbs (75 kg)5. For their intended use in training by emergency response personnel, the Randys simulate the weight, weight distribution, and articulation of a human. However, they are not intended to have (or at least they aren’t marketed as 5 Simulaids also sells lighter and heavier mannequins, and they sell separate weight vests to allow for heavier simulated patients.

© 2009, Rocky Mountain Rescue Group, Boulder CO
having) human-like response to dynamic loading, including energy absorption and damping effects.
A great deal of experimentation was used to determine the ideal method of attaching the Rescue Randys to the system in order to get the most human-like behavior (and force histories) from them. The Rescue Randys were each fitted with a standard climbing harness; however, because the mannequins are significantly top-heavy, and lack muscles to keep themselves upright, they hang head-down with an arched back unless they are provided with additional support. For this reason they were fitted with chest harnesses to maintain the more upright body position typical of a live rescuer6. This position (Figure 2) made Randy a better analog, but also limited his movement during an impact. Slow motion video of a falling human shows that all body parts don’t start falling simultaneously. For a human suspended by his waist, when the tension disappears, some parts of the body initially move upward relative to the body, even though the center of mass is moving down. Likewise, at the end of a drop, as the system pulls on the harness to stop the falling human, not all parts decelerate at the same rate. The distribution of this deceleration over time is one of the reasons that peak force is lower with a human in the system than with steel plates. Randy’s limbs do not respond as well as a human’s, but his articulation does allow for some distribution of acceleration and deceleration over time during drops. A properly designed chest harness does not limit this movement.
Figure 2: The Rescue Randy mannequins were typically fitted with a chest harness to better emulate a rescuer's body position.
The Rescue Randy’s chest harness was tied with 1 inch nylon tubular webbing. It was found that keeping the chest harness as high as possible produced the most human-like 6 Attempts to make the Rescue Randy “grip” the litter rail prior to drops were unsuccessful.

© 2009, Rocky Mountain Rescue Group, Boulder CO
body position. The chest harness was joined to the seat harness with a single loop of 1 inch nylon tubular webbing (water knot to close the loop). The effect of knot tightening in these harness connections was found to be insignificant after the first drop onto a freshly-tied chest harness. Variations of the chest harness were tested, including clipping the chest harness and the seat harness directly into the knot in the main line, each with its own carabiner (this is the configuration shown in Figure 2), which did not produce a significant change in the force history. In general, small changes in the tilt of Rescue Randy’s body had little effect on the force history generated during isolated drop tests.7
For the Rescue Randy to be a useful test subject, drop test results employing it had to be repeatable, i.e. similar drops needed to produce similar measurements. Producing this repeatability turned out to be somewhat challenging. The manufacturer sells a special plastic reinforcement piece (a “truss”), to be used if the Rescue Randy will be hanging in a harness. The truss spans between his thighs to keep the harness leg loops from sliding into the hip joints. If the harness slid into the hip joint, the Rescue Randy behaved more like a rigid mass, significantly changing the forces measured during drops. After several repeated drops, the plastic trusses broke. New steel trusses were fabricated, thereby increasing the overall mass by a few pounds. This reinforcement helped, but did not completely prevent the harness leg loops from going into the hip joints. Although the harness-in-hip problem was mitigated, it was found that variations in the force v. time histories resulted from varying the initial position of Randy’s limbs for a given drop. In general, we were most successful at getting repeatable results when we kept the mannequin’s harness positioned as it would be on a human, and his limbs oriented consistently (arms hanging straight down).
4. Low Impact Force Testing A number of distinct tests were run to compare the behavior of humans, Rescue Randy,
and steel plates in drop tests. For obvious reasons, these three-way comparisons were limited to tests that resulted in low forces safe for humans to endure. The goal of these tests was twofold: to look at qualitative (behavioral) differences among the loads, and when a test involved a human subject weighing the same as the Rescue Randy, to compare quantitative results as well.
A typical low-force test was to drop each of the three loads (steel plates, a Rescue Randy, and human), using 8 inch (20.3 cm) drops onto 66 inches (1.67 m) of steel cable8. With a fall factor of <0.12, these would seem to be low force tests; however, because of the extremely low energy absorption of the steel cable, these drops can generate surprisingly high forces, and the load itself may provide the majority of the energy absorption and damping. Figure 3 shows typical force histories for these drops. Peak forces for the Rescue Randy and the human are 712 lbs (3.17 kN) and 647 lbs (2.88 kN)
7 The pendulum tests, described later, and vertical system failure tests that we have conducted, have demonstrated that the Rescue Randy’s initial orientation – either facing the direction of swing or facing across the direction of swing – does influence the generated forces. In tests that involved movement in more than one direction, repeatable results were achieved when the Rescue Randy started in the same body position relative to the system and the direction of movement. 8 The cable is 3/16” 7x19, Mil Spec Mil-W-83420 aircraft cable (non-jacketed), also called “wire rope”.

© 2009, Rocky Mountain Rescue Group, Boulder CO
respectively, and they scale approximately with the dropped weights (712 lbs/647 lbs = 1.10 and 170 lbs/158 lbs = 1.08). Both of these loads absorb a significant amount of energy, and show similar damping. The peak force generated by the steel load was more than 3 times the peak forces generated by the other two loads. The ratio of the peak force to the load weight for steel is 13.5, much larger than the same ratio for Randy (4.2) or for the human (4.1). Qualitatively, the force histories for the Rescue Randy and the human are quite similar; on the other hand, the steel plates show a very different behavior, including much higher peak forces, distinctly less damping (including a conspicuous bounce during which tension in the cable drops to zero), and a chaotic ringing. It is clear here, as in most of the other testing, that despite having somewhat less intrinsic damping than a human, the Rescue Randy emulates the human much better than the steel plates do.
A second type of low-force test again used steel cable, (the 3/16” aircraft wire rope) but
this time in pendulum drops rather than vertical drops. These drops were done on 66.5 inches (1.7m) of steel cable, with the load initially displaced 37.5 inches (0.95m) horizontally from the anchor (see Figure 4), resulting in a vertical displacement of 11.6 inches (0.29m). The cable was under tension prior to load release. Figure 5 shows the force histories for each of the three loads. The human load and the Rescue Randy again show qualitatively similar behavior, with some large initial rapid oscillations (associated with rocking of the load at the bottom of the cable), followed by slower pendulum oscillations. The damping of the rocking motion and the peak forces are similar for the human and the Rescue Randy. The behavior of the steel plates is distinctly different in character, and shows significantly higher peak loads. The oscillations of the steel
Figure 3: Force v. time histories of short drops (8”) onto 66” of 3/16” aircraft cable show very different results for the three different loads.
© 2009, Rocky Mountain Rescue Group, Boulder CO
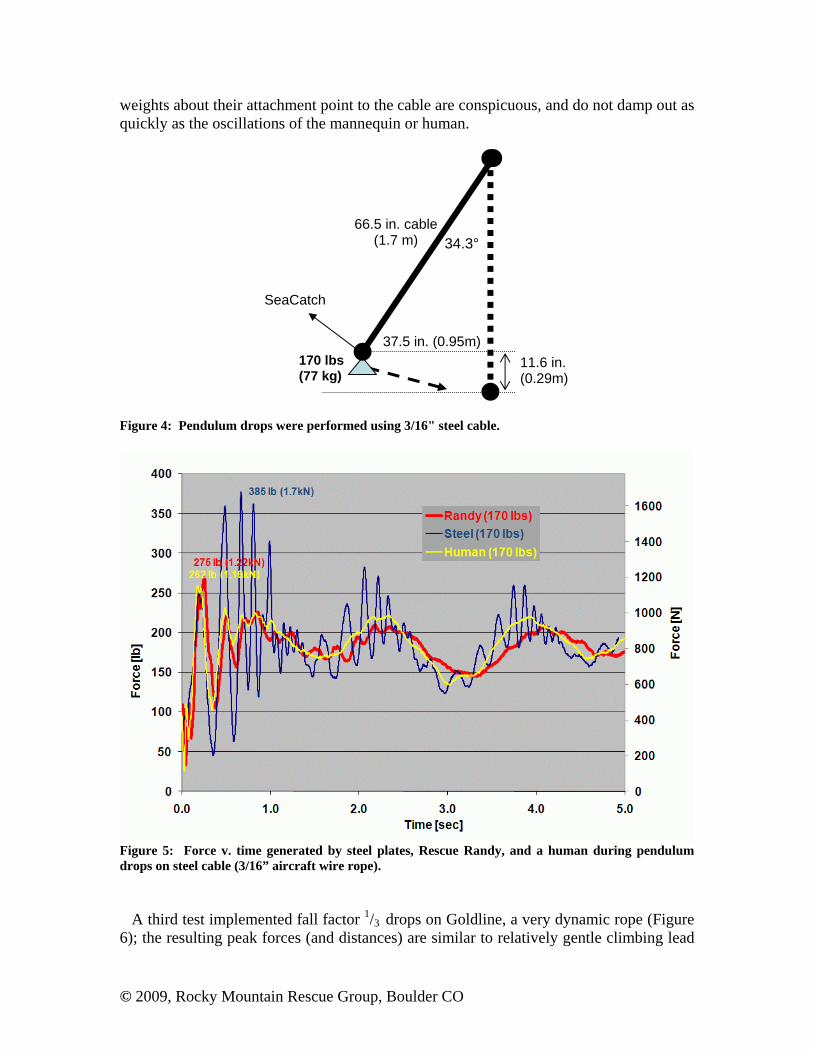
weights about their attachment point to the cable are conspicuous, and do not damp out as quickly as the oscillations of the mannequin or human.
Figure 4: Pendulum drops were performed using 3/16" steel cable.
Figure 5: Force v. time generated by steel plates, Rescue Randy, and a human during pendulum drops on steel cable (3/16” aircraft wire rope).
A third test implemented fall factor 1/3 drops on Goldline, a very dynamic rope (Figure
6); the resulting peak forces (and distances) are similar to relatively gentle climbing lead
SeaCatch
37.5 in. (0.95m)
66.5 in. cable (1.7 m)
11.6 in. (0.29m)
34.3°
170 lbs (77 kg)
© 2009, Rocky Mountain Rescue Group, Boulder CO
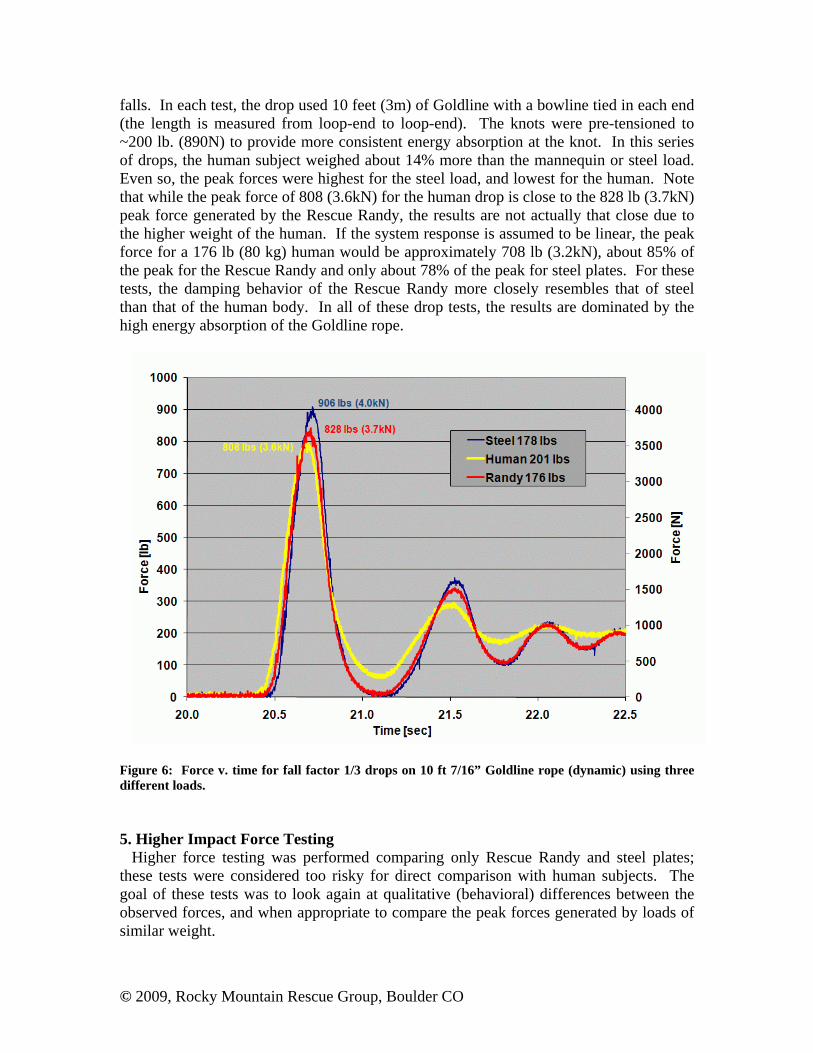
falls. In each test, the drop used 10 feet (3m) of Goldline with a bowline tied in each end (the length is measured from loop-end to loop-end). The knots were pre-tensioned to ~200 lb. (890N) to provide more consistent energy absorption at the knot. In this series of drops, the human subject weighed about 14% more than the mannequin or steel load. Even so, the peak forces were highest for the steel load, and lowest for the human. Note that while the peak force of 808 (3.6kN) for the human drop is close to the 828 lb (3.7kN) peak force generated by the Rescue Randy, the results are not actually that close due to the higher weight of the human. If the system response is assumed to be linear, the peak force for a 176 lb (80 kg) human would be approximately 708 lb (3.2kN), about 85% of the peak for the Rescue Randy and only about 78% of the peak for steel plates. For these tests, the damping behavior of the Rescue Randy more closely resembles that of steel than that of the human body. In all of these drop tests, the results are dominated by the high energy absorption of the Goldline rope.
Figure 6: Force v. time for fall factor 1/3 drops on 10 ft 7/16” Goldline rope (dynamic) using three different loads.
5. Higher Impact Force Testing Higher force testing was performed comparing only Rescue Randy and steel plates;
these tests were considered too risky for direct comparison with human subjects. The goal of these tests was to look again at qualitative (behavioral) differences between the observed forces, and when appropriate to compare the peak forces generated by loads of similar weight.

© 2009, Rocky Mountain Rescue Group, Boulder CO
One set of high-force tests consisted of fall factor ½ drops onto static rope with knots. These drops generated qualitatively different damping histories for steel plates and for Rescue Randy. Figure 7 shows the force histories as a function of time for drops onto 10 feet (3m) of PMI MaxWear tied with bowlines in each end (again, pre-tensioned to ~200 lb (890N)). As expected, the peak loads are roughly 25% higher using steel weights versus using the Rescue Randy. Both loads show a distinct bounce after first impact; the damping is much more rapid with the Rescue Randy.
Figure 7: Force v. time histories for fall factor 1/2 drops on 10 ft (3 m) PMI MaxWear, 11mm, comparing steel load with Rescue Randy.
Another high force test consisted of fall factor 1 drops onto Spectra daisy chains. All of these tests were conducted using Black Diamond ½” Dynex (Spectra with a small amount of nylon) daisy chains. Some of the daisy chains were 55 in (140 cm) with 14 bartack sets, and some were 45 in (115 cm) with 12 bartack sets; but in none of these drops did all of the bartacks break (in which case we would expect a spike in the peak force). All the daisies were manufactured with 2 tacks per bartack set (providing similar energy absorption per bartack set). Figure 8 (vertical bar chart) shows that the peak forces vary significantly even for a given type of load. The peak forces generated by the steel plates are anywhere between 5% and 37% greater than the peak forces generated by the Rescue Randy. The diamond markers in Figure 8 show the number of bartacks broken for the five drops. Measured this way, the differences between the steel load and the Rescue Randy are obvious: much more energy was absorbed by the many bartack failures during the drops of steel weights (the energy being associated with not only the greater number

© 2009, Rocky Mountain Rescue Group, Boulder CO
of bartacks broken, but also the larger total distance through which the load fell). In other words, much more energy was absorbed by the Rescue Randy than by the steel plates, indicating unrealistic results for tests with steel weights simulating drops with humans.
2301 24352749
20042182
9
1112
01
0
500
1000
1500
2000
2500
3000
Steel Steel Steel Randy Randy
Pea
k Fo
rce
(lb)
0
2
4
6
8
10
12
14
# of
Bar
tack
Set
s B
roke
n
Peak Force (lb) # of Bartack Sets Broken
Figure 8: Peak force and # of bartack sets broken for fall factor 1 drops on Spectra daisy chains
The final high-force tests included here were fall factor 1 drop tests onto Purcell prussiks (Figure 9-10). This test was conceived after it was noticed that Rescue Randy and steel plates generated significantly different forces in systems that had nonlinear behavior, such as when daisy chain bartacks break, or presumably when a prussik slips.9 The Purcells were made from Beal 7mm static cord, and were tied with three wrap prussiks; the load was attached to the small loop, and the large prussik loop was attached to the fixed load cell. These tests were run for Purcells of two lengths (80 cm and 130 cm), all with similar results. Figure 10 shows the (typical) force v. time histories for two drops, one with a load of steel plates, and the other with a Rescue Randy. In both data plots, the initial slip of the prussik is conspicuous, followed by the prussik catching the load and creating peak forces. In various tests, the force at which the prussik initially slips varies considerably (this variability is normal for prussiks in general); however, in all cases the peak force for the steel load is approximately 35% higher than for the Randy, again indicating unrealistic results for tests with steel weights simulating drops with humans.
9 Recent testing by Gibbs (Daisy Chains and Other Lanyards: Some Shocking Results when Shock Loaded, ITRS 2005) did a thorough examination of daisy chains and Purcells (among other lanyards) using steel loads. Our goal was to determine whether the use of Rescue Randy as a test load might result in significantly different results.
(10.2kN) (10.8kN)
(12.2kN)
(8.9kN) (9.7kN)

© 2009, Rocky Mountain Rescue Group, Boulder CO
Figure 9: Drops were conducted on Purcell prussiks using two different loads
Figure 10: Typical peak force v. time for drops of steel and Randy onto Purcell prussiks, using Beal 7mm static cord and 3-wrap prussik, FF=1 6. Discussion of Results
All of the low-force testing indicated that in drop testing scenarios the Rescue Randy mannequin provides a better analog for the human body than steel weights do, and for some systems, a much better analog. Similarly, the high-force testing showed potentially important differences between the behavior of the mannequins and the behavior of steel

© 2009, Rocky Mountain Rescue Group, Boulder CO
plates in drop testing; however, the question of whether the use of Randy is worth the added expense and complexity of testing is more difficult to answer.
Drop tests generally come in one of three flavors: dropping to determine the breaking strength of certain components or sets of components, dropping to determine if a particular scenario does break a system, or dropping to determine realistic estimates of the forces generated by specific scenarios. Clearly, steel loads are adequate for breaking components; however, for the latter types of testing, trying to determine the survivability of a system or to determine realistic forces in specific scenarios, it is clear that Rescue Randy is valuable as a test load. The primary conclusion from the wide variety of testing performed is that steel weights provide an adequate and cost-effective test load for simple peak-force measurements of drop testing on systems only if the system being tested is inherently capable of absorbing significant amounts of energy. As shown in Figures 6 and 7 (for a dynamic rope and for a rope with knots not previously loaded), in systems with energy absorption potential based on elongation of components, the steel loads produce conservative peak forces but similar initial dynamic behavior. Note that we include the drops onto the low stretch MaxWear rope as having sufficiently high energy absorption potential, because the knots in the system absorb significant energy beyond what can be absorbed by the rope itself.10 Drop tests using steel loads with such systems will produce conservative (high) peak forces, but this often satisfies the requirements of the testing. If the goal of the testing is realistic forces, or realistic damping and dynamic behavior beyond the initial impact, then the mannequins show a significant advantage: more realistic force measurements.
More significantly, for dropping onto highly static systems such as steel cable (Figures 3 and 5), or for dropping onto nonlinear systems such as Dynex (Spectra) daisy chains (Figure 8) or Purcell prussiks (Figure 10), the use of a steel load can lead to significantly unrealistic results (much higher peak loads, significantly more bartacks broken, very different dynamics, etc.). In these tests, the use of steel loads may produce grossly misleading results rather than just conservative (higher force) results. Although it adds significant cost, realistic force data combined with adequate analysis (material strengths, etc.) will lead to better system designs and operating procedures.
We have developed a mathematical model allowing for predicting whether a particular simple drop test using steel weights would have produced significantly different peak loads with a mannequin. The model has undergone only limited validation, but our results so far support its validity. For the interested reader, further details are provided in Appendix B.
The impetus for this mannequin evaluation was to support a program of testing main line failure scenarios in vertical evacuation systems. The primary question was whether the added expense and complexity of using Rescue Randys in place of steel weights was justified; additional questions pertained to such topics as whether drops on Randy produced repeatable results. While our vertical system testing has demonstrated that there is generally a large reservoir for energy absorption in a complex litter system (main
10 Note that these were fairly short drops, relative to which the tensioning of the knots represented a significant amount of energy absorption. For longer drops with the same FF, the knots become less important, and the system begins to behave more statically. Additionally, if drops are conducted a second time on the same knots, the system behaves more statically. In either of these alternative scenarios, the steel load produces less realistic forces.

© 2009, Rocky Mountain Rescue Group, Boulder CO
line, main line tie-in knot, spider tie-in knot, spider leg knots, spider materials, litter bearer tie-in material and knot, slip in the brakes, etc.), the comparative testing described here indicates that the use of steel loads would likely produce unrealistic peak forces and unrealistic dynamics in these tests.
Appendix A: Further Detail on the Test Tower and Equipment Tower Structure
The testing facility is outdoors, thus without temperature or humidity control. We do note weather conditions for the day realizing that nylon properties vary with ambient conditions.
The tower itself is a 35 ft (10.7m) steel structure originally used in a high voltage transmission line, 6 ft (2m) square at the base. The structure is mounted on a very substantial underground concrete foundation and is further secured from tipping by four guy wires to Manta Ray earth anchors. Maximum peak drop loads are limited operationally to 10,000 lbs (44kN).
A 14 ft horizontal beam was added across the top, cantilevered 4 ft (1.2m) outward from each side. This beam is built from two 6” (15 cm) C-channels and is used to support load anchors, pulleys, etc. The center of the beam deflects <0.1” (<0.25cm) under 8000 lb (35.6kN) load, and the outboard end of the cantilevered beam deflects <0.6” (<1.5cm) at 5000 lb (22.3kN) load. These deflections were calculated using an Ansys Mechanical FEA , for AISI 1005 steel, E=29,000 ksi, Poisson’s Ratio 0.29, and confirmed via measurement.
The steel drop weight is a stack of up to thirty plates 33 lb (147N) each, for a maximum of 1000 lb (4.45kN). Several additional smaller weights are available for ‘fine tuning’ the dropped weight.
The weight can be guided by an arm running on low friction wheels in a track, positioning the weight at the center of the tower. The vertical motion of the arm is measured by a string and rotary optical encoder.
A Cordem Golo power winch Model 1200 is used to lift the weight stack. Extension bars (7/8” dia.) hung from the high horizontal beam are used to position
anchor points as needed, internal or external to the tower. The anchor point usually supports a load cell and the release device.
The load release device is a pneumatic McMillan Design’s “Sea Catch”, controlled manually or by computer.
Instrumentation
Most data is recorded by computer; simple load cell monitoring readouts may be used on occasion.
The computer is a Lenovo Thinkpad R60 with sufficient performance to cause no limitation in our measurements.
Data acquisition is by a National Instruments M series USB-6251 DAQ, 16 bit with 1.25Msamples/sec input.
Software is LabView 8.2 programmed to accept 8 bipolar channels of analog input and 2 counters, with a digital output for load release control.

© 2009, Rocky Mountain Rescue Group, Boulder CO
Video (not high speed) and still photography are used to document experiment set ups and actual tests, synchronizing the image time with computer file time.
Various sensors are available.
The load cells are Honeywell (Sensotec) with 2000-lb or 10,000-lb rating. Rotary optical encoders (DataTorque, HP) are used with pulley and Kevlar string to
record distance at 500 counts/revolution, providing high resolution. Thermocouples imbedded in a device are used occasionally for temperature rise
measurements.
Amplifiers InLine amplifiers are used with the load cells to provide necessary signal level for the
analog input to the DAQ card. Cables between load cell and computer are 75 ft (23m) with amplifier near the load cell. The actual load cell excitation level is sensed to eliminate errors from cable length. A shunt calibration resistor is available to unbalance the load cell bridge and give a calibration check. All inline amplifiers are Sensotec Universal series powered from the computer interface.
Rotary optical encoders use quadrature converters at the encoder, providing suitable signal conditioning for the DAQ counter inputs. The pulse output of the quadrature converters is chosen long enough so that capacitance of the cable is not a limitation, and short enough that there is no pulse overlap at the highest speeds.
Thermocouples use a Fluke TC-to-millivolt temperature converter giving an adequate analog signal to the DAQ, resolving better than 1deg C or F.
Monitoring of load cell output is normally done with the computer and LabView, but on occasion, a Honeywell (Sensotec) portable instrument Model NK is used for convenience. The NK allows monitoring of the real-time load while storing the peak load since last reset; the peak detecting circuit has shorter than 1ms response time.
Resolution, Calibration, Speed, Bandwidth Issues
Resolution - load cell. With the inline amplifiers, the signal at the maximum 10,000 lb load to the DAQ is 10 volts, i.e. 1 lb is 1 mv = 0.001 volt. The resolution of the DAQ is better than that. Noise is a bigger limitation - we see typically +/- a few lbs of noise. The precision of a few lbs is entirely adequate for our studies.
Resolution - distance. The rotary encoders have 500 counts/revolution, each count is resolved. With the pulleys in use, that becomes a linear distance of only 0.16mm, much better resolution than we need. We have not seen dropped counts in high-speed encoder performance testing.
Calibration, accuracy. Load cells are specified to ~0.2% full scale for various characteristics (shunt calibration, linearity, repeatability, temperature, etc.). We expect and are satisfied with 1%. Likewise, we expect and are satisfied with 1% for the distance measurement calibration; bigger errors may occur because of obvious geometry (2D) issues on drops. Special consideration may be appropriate when looking at very precise measurement requirements.
Recording speed. We usually record data at 1000 samples/sec, which is adequate to record almost all data of interest. Occasionally we raise the rate to 2500samples/sec to

© 2009, Rocky Mountain Rescue Group, Boulder CO
see if all useful features in the data at 1000samples/sec are resolved. The sampling rate can go much higher. The DAQ can handle 1.25Msamples/sec for the analog inputs.
Bandwidth issues - load cells. A fundamental limitation of load cell speed of response is the load cell self-resonant frequency. The manufacturer (Honeywell-Sensotec) specifies, and our direct measurements show, that the self-resonant frequency is > 6.4kHz for all load cells. The inline amplifiers (Sensotec) have bandwidth of 5kHz. Our upper rate of 2500samples/sec should give reliable performance, and is not limited by the DAQ. Capacitance of the cable is not a factor given these bandwidth considerations.
Speed issues - rotary encoder. The DataTorque encoders used for these tests are specified to 200kHz/3000rpm. We tested these to higher speeds and found no data loss. Our experiments reported in these papers do not exceed the specified numbers. We also found no data loss in performance stress tests of the encoder in the distance measuring system including a pulley and associated Kevlar string, i.e., no string slippage on the pulley. Appendix B: A Proposed Mathematical Model for Predicting the Realism of Drop
Test Results Using Steel Weights
As discussed above, drop tests using steel weights as a load may result in much higher peak forces in the rope than would occur with a human load. We present here a simple physical model that may be used to compare quantitatively the behavior of drop tests on rope etc., using a steel weight or mannequin in place of a human, and may indicate validity of results from the steel weight for predicting peak forces for a human weight.
If, during the rise in force to the first peak, the energy gained by the rope under test is much greater than the energy absorbed by the human or mannequin weight, then the steel weight simulation will be valid. If the opposite occurs, then expect the peak forces measured with the steel weight to be significantly greater than for the human or mannequin. This happens because the steel weight cannot absorb and dissipate significant energy, but the human can. Summary of the method:
A drop test of a steel weight on a rope can be reasonably modeled as a spring-mass-dashpot system (Figure B1), assuming linear relation F(x). The parameters (spring constant and damping constant) can be determined from force and distance measurements taken from a drop test using steel. (Note, however, that the system parameters may change after a drop, for example, if knots in the system cinch tight.) The same drop with a human as the load can similarly be modeled as a spring-mass-dashpot system attached as the load on the original spring-dashpot system (Figure B2). The behavior will generally be dominated by the “softer” of the two spring-dashpot systems.

© 2009, Rocky Mountain Rescue Group, Boulder CO
Figures B1 (left) and B2 (right): a reasonable model of dropping a steel weight in a simple drop
test is a spring-mass-dashpot (left); a human or mannequin can be reasonably modeled as a second spring-mass-dashpot system in series with the first.
The physical parameters that go into the simplified mathematical model of the rope
under test are readily derived from the drop test of the steel weight by using force vs. time and distance vs. time data. The spring constants k are readily found from experimental data by plotting force vs. distance and finding the slope k during the initial rise of force to the peak. Because k varies with conditions (velocity, recent history), in this Appendix, we apply the model only for the initial rise to the first peak of force, during which time, F(x) is often close to a straight line (constant k). This approach assumes that the damping or dissipation or loss may be neglected during the initial rise to the peak in rope force.
The parameters for the mannequin have been measured and the spring constant of the Rescue Randy is estimated to be 876 lbs/in. This value is assumed to apply for any drop test with the mannequin.
A simple comparison of the rope spring constant and the mannequin spring constant will indicate validity of the test with steel weight. If the mannequin dominates the behavior in the model, i.e. has the lower spring constant, then the results with the steel weight will be in error.
The table below provides some experimental numbers comparing drops of 175 lbs of steel plates and RescueRandy on three systems.

© 2009, Rocky Mountain Rescue Group, Boulder CO
Test Drop load
Drop free fall
Peak force (lbs)
k lb/in Ratio of peak forces
MaxWear - 10 ft Steel FF = 0.5 1866 k =150 1.17 RR FF = 0.5 1593 Goldline -10 ft Steel FF = 0.5 1080 k =40 1.13 RR FF = 0.5 955 Cable - 5.6 ft Steel FF = 0.12 2573 k =2000 2.51 RR FF = 0.12 1024 Notes:
k is calculated from F(x) for 1st peak Rise time (to 1st peak) is less than decay time for oscillatory behavior after the first peak
For drops of steel plates onto MaxWear and Goldline the calculated spring constants
were 150 lb/in and 40 lb/in, respectively – both significantly lower than the 876 lb/in of Rescue Randy. For both of these cases, the peak forces generated by the steel plates are a reasonable approximation of the loads generated by Rescue Randy (13% and 17% higher).
For the drop of steel plates onto cable, the calculated spring constant was 2000 lb/in – significantly greater than the 876 lb/in of the Rescue Randy. In this case the, the peak force generated by the steel plates was significantly high compared to the loads generated by the Rescue Randy (2.5x).
In the two drops where the Rescue Randy is the much stiffer spring, the steel plates and Rescue Randy give similar peak forces. For the drop where Rescue Randy is the much softer spring, the peak force measured based on dropping steel is misleading.
We are currently developing a model that should allow, not only a determination of the validity of the drops of steel plates, but also a rough prediction of the peak forces for the mannequin drop based on the measurement of the peak forces from the steel plate drop.
Acknowledgements
The authors would like to thank the Mountain Rescue Association for providing the original grant used to purchase the Rescue Randy mannequins, as well as Honeywell/Sensotec, National Instruments, and Black Diamond for contributing significant equipment used in this testing. Thanks also go to the many members of RMRG who volunteered their time to make this testing possible.

_______________________________________________________
_______________________________________________________
_______________________________________________________
_______________________________________________________
_______________________________________________________
_______________________________________________________
_______________________________________________________
_______________________________________________________
_______________________________________________________
_______________________________________________________
_______________________________________________________
_______________________________________________________
_______________________________________________________
_______________________________________________________
_______________________________________________________
_______________________________________________________ ITRS 2009
NOTES