Tilburg University Finance and Oil. Is There a Resource ...
39
Tilburg University Finance and Oil. Is There a Resource Curse in Financial Development? Beck, T.H.L. Publication date: 2011 Document Version Early version, also known as pre-print Link to publication in Tilburg University Research Portal Citation for published version (APA): Beck, T. H. L. (2011). Finance and Oil. Is There a Resource Curse in Financial Development? (EBC Discussion Paper; Vol. 2011-004). EBC. General rights Copyright and moral rights for the publications made accessible in the public portal are retained by the authors and/or other copyright owners and it is a condition of accessing publications that users recognise and abide by the legal requirements associated with these rights. • Users may download and print one copy of any publication from the public portal for the purpose of private study or research. • You may not further distribute the material or use it for any profit-making activity or commercial gain • You may freely distribute the URL identifying the publication in the public portal Take down policy If you believe that this document breaches copyright please contact us providing details, and we will remove access to the work immediately and investigate your claim. Download date: 21. Mar. 2022
Transcript of Tilburg University Finance and Oil. Is There a Resource ...

Tilburg University
Finance and Oil. Is There a Resource Curse in Financial Development?
Beck, T.H.L.
Publication date:2011
Document VersionEarly version, also known as pre-print
Link to publication in Tilburg University Research Portal
Citation for published version (APA):Beck, T. H. L. (2011). Finance and Oil. Is There a Resource Curse in Financial Development? (EBC DiscussionPaper; Vol. 2011-004). EBC.
General rightsCopyright and moral rights for the publications made accessible in the public portal are retained by the authors and/or other copyright ownersand it is a condition of accessing publications that users recognise and abide by the legal requirements associated with these rights.
• Users may download and print one copy of any publication from the public portal for the purpose of private study or research. • You may not further distribute the material or use it for any profit-making activity or commercial gain • You may freely distribute the URL identifying the publication in the public portal
Take down policyIf you believe that this document breaches copyright please contact us providing details, and we will remove access to the work immediatelyand investigate your claim.
Download date: 21. Mar. 2022

Finance and Oil Is there a resource curse in financial development?
By Thorsten Beck
Januari 2010
European Banking Center Discussion Paper No. 2011-004
This is also a CentER Discussion Paper No. 2011-017
ISSN 0924-7815

0
Finance and Oil
Is there a resource curse in financial development?
Thorsten Beck*
This draft: January 2010
Abstract: This paper shows that the finance and growth relationship is as important in resource-based economies as in other economies. This paper also documents less developed financial systems in resource-based economies and banks that are more liquid, better capitalized and more profitable, but give fewer loans to firms. Firms in resource-based economies use less external finance and a smaller share of them uses bank loans, although there is the same level of demand as in other countries, thus pointing to supply constraints. Overall, there is some indication of a natural resource curse in financial development, which falls more on enterprises than on households. This calls for intensified efforts in resource-based economies to deepen and broaden financial systems. ________________________________________________________________________ Beck ([email protected]): CentER and European Banking Center,Tilburg University and CEPR; This paper was prepared for a conference by the IMF Institute and the Bank of Algeria on Natural Resources, Finance and Development: Confronting New and Old Challenges. Comments by Rabah Arezki, Thorvaldur Gylfason, Steven Poelhekke and Marc Quintyn and research assistance by Mohammad Hoseini and Radomir Todorov are gratefully acknowledged without implicating them.

1
1. Introduction
An extensive literature has identified financial sector development as a critical factor
in inclusive economic development (see Levine, 2005 and Beck, 2009 for overviews).
Countries with deeper financial systems grow faster and it is the lowest income quintile that
benefits most from this deepening (Beck, Levine and Loayza, 2000; Beck, Demirguc-Kunt
and Levine, 2007). Countries with deeper financial systems also experience faster reductions
in income inequality and poverty rates. Financial sector development helps industries that are
most reliant on external finance grow faster and helps enterprises, especially smaller and
more opaque ones, overcome financing constraints (Rajan and Zingales, 1998; Beck,
Demirguc-Kunt and Maksimovic, 2005). The positive effect of financial sector development
on economic growth comes through improved resource allocation and productivity growth
rather than increased capital accumulation (Beck, Levine, and Loayza, 2000; Wurgler, 2000).
Most of this literature, however, has focused on broad cross-country samples,
assuming that the finance-growth relationship is a linear one, constant across countries.1
This paper focuses on financial deepening in resource-based economies. Specifically,
we (i) test whether the finance and growth relationship varies across countries depending on
the degree to which they rely on natural resources, and (ii) document the development and
structure of financial system in natural resource based economies compared to other
countries. In the first part, we will use standard cross-country growth regressions as well as
industry-level regressions and allow for a differential relationship between finance and
It is
more; many papers in the finance and growth literature drop oil countries or natural-resource-
based economies in general, arguing that economic development is driven by different factors
in these countries and that the financial sector has a different role and structure in these
economies.
1 There are several papers, however, that have shown non-linear finance-growth relationships, including Aghion, Howitt and Mayer-Foulkes (2005) and Rioja and Valev (2004a,b).

2
economic growth depending on the degree to which an economy relies on natural resource
exports or is abundant in natural resource wealth. In the second part, we will use aggregate,
bank-level and firm-level data to explore whether the depth, breadth and efficiency of
financial systems varies systematically across countries with different degrees of natural
resource reliance.
Exploring the role of financial sector development in growth of resource-based
economies is interesting and important for both academics and policy makers. There is a
large literature on the natural resource curse and the different channels through which
resource abundance can influence growth; understanding the role of financial development in
this context is critical. Policymakers who care about the development of their countries need
to understand the relative importance of different policy areas and the effectiveness of
specific policies. Understanding channels through which resource abundance can stimulate
or dampen economic development can be important to develop policies to maximize the
benefits of natural capital.
By exploring the role and structure of the financial system in resource-based
economies, this paper builds on a large literature that has explored the curse of natural
resource abundance (see van der Ploeg, 2011 for a recent survey). The natural resource curse
refers to the crowding out of non-resource based activities or investment through price and
incentive effects. One form - also referred to as Dutch disease – works through the exchange
rate mechanism: commodity exports will put upwards pressure on the real exchange rate,
which will turn non-resource exports uncompetitive, ultimately depressing the traded goods
sector. The decline of British manufacturing after the discovery of oil in the 1970s and the
decline of the Dutch manufacturing sector after the discovery of a natural gas field in 1959
are prominent recent examples, although neither of them lasted. Beyond price effects, the
natural resource curse also refers to the distortion of incentives for investment in institutions,

3
education and other public services due to windfall gains from natural resources, which can
ultimately have negative repercussions for political freedom and stability. It is generally
easier to materialize short-term profits from natural resources such as oil than from fixed
assets such as manufacturing plants, equipment and machinery, because proceeds from
natural resources depend less on the creation of a market, on human capital, and on R&D
investment. This in turn reduces incentives to invest in an institutional framework that
supports broad domestic market-based exchange, private property rights and the contractual
framework supporting non-commodity production (Besley and Persson, 2010). Natural
resource wealth also allows less than democratic governments to buy off opposition, avoid
accountability and prevent transparency. Natural resources make it more profitable for the
elites to hang on to power and block the development of an open society (Beck and Laeven,
2006). This, in turn, can foster conflict, seen most prominently across Sub-Saharan Africa
(Collier and Hoeffler, 2004). In addition, a commodity-induced bonanza can foster a shift
from profit-making entrepreneurship towards socially inefficient rent seeking. However,
there is also an interaction between institutional development and resource abundance, with
countries above a threshold of institutional development able to reap benefits from natural
resource wealth (Mehlum, Moene and Torvik, 2006).
The empirical literature has provided ample evidence for the natural resource curse
and the different channels through which it affects growth. However, this literature has also
noted a wide cross-country variation in experiences; on the one hand, Nigeria has
experienced negative growth since its independence, associated with exchange rate effects,
rent-seeking and violence stemming from oil exports, while, on the other hand, Botswana has
experienced positive growth over the past 50 years in spite of being heavily reliant on
diamond exports. However, according to Gylfason (2001), only four out of 65 resource-
based economies can be considered success stories in terms of growth - Indonesia, Malaysia,
4
Thailand and Botswana - and the three Asian countries still fared less well than their East
Asian neighbors Hong Kong, Singapore or South Korea. With few exceptions, however, the
literature has not considered the effect of natural resource abundance on financial
development or its role in mitigating the natural resource curse (van der Ploeg and Poelhekke,
2007).2
In exploring whether there is a natural resource curse in financial development, this
paper also builds on a large literature on the determinants of financial deepening across
countries. Boyd, Levine and Smith (2001) show the importance of macroeconomic stability
for financial deepening, while La Porta et al. (1997, 1998) and Djankov, McLiesh and
Shleifer (2007) show the importance of the contractual and information frameworks for
financial development.
3
Theory and the institutional literature on the natural resource curse provide different
hypotheses on the effect of natural resource abundance on financial system development.
There are both demand side and supply side effects in this respect. Take first the demand
side. On the one hand, windfall gains from natural resource abundance and the consequent
expansion of the non-traded goods sector can lead to higher demand for financial services,
including consumer credit. On the other hand, there is lower demand for external financing
from the natural resource sector than from non-resource traded goods sector, which will
suffer in a Dutch disease scenario. Further, the literature has documented lower savings and
investment rates in resource-based economies, which in turn can also explain a lower demand
A related literature has explored the importance of historic factors,
such as legal tradition, or geographic traits in forming institutional and specifically financial
development (see Beck and Levine, 2005, for a survey).
2 One of the few exceptions is Bhattacharyya and Hodler (2010) who show a negative relationship between resource dependence and financing development in countries with low levels of democracy using country-level data, and Barajas, Chami and Yousefi (2010) who explore the finance and growth relationship across countries with different degrees of resource dependence. Gylfason (2004) also offers some suggestive evidence of lower financial development in resource-based economies. 3 See Beck (2006) for an overview.

5
for financial services in resource-based economies. Specifically, resource-rich countries can
use the revenues from their resources for consumption smoothing, which weakens the
incentive to build an effective financial system to serve as a buffer to smooth consumption
over the business cycle (Gylfason, 2004). Take next the supply side. Higher investment in the
natural resource sector can lead to lower investment in the financial sector and draw away
skills from the financial system. In addition, the heavy dependence of the financial system on
a sound institutional framework, including an effective contractual framework, can hamper
financial deepening in countries where natural resource abundance undermines institutional
development.
Theory also makes ambiguous prediction about the finance-growth relationship in
resource-based economies. On the one hand, the financial system might be less important as
growth depends less on finance-intensive sectors. On the other hand, financial system
development might be more important to compensate for the negative effects of Dutch
disease and in order to diversify the economy. In addition, financial systems in resource-
based economies can help counter the negative impact of real exchange rate volatility
(Aghion et al., 2009).
Our empirical results show that financial development is as important for economic
growth in resource-based economies as in other countries. On the other hand, resource-based
economies have less developed financial systems and their banks are more liquid, better
capitalized and more profitable, but give fewer loans to firms. Firms in resource-based
economies use less external finance and a smaller share of them uses bank loans, although
there is the same level of demand as in other countries, thus pointing to supply constraints.
Overall, there is some indication of a natural resource curse in financial development, which
falls more on enterprises than households.
6
As this paper is one of the first to rigorously explore the role of financial systems in
resource-based economies, several caveats are due. First, we work with very rough measures
of natural resource dependence; we test, however, the robustness of our results across several
indicators. Second, this is a very broad but preliminary exploration of the role of financial
systems in resource based economies; what we gain in breadth, we miss in depth in the
different dimensions. Several of the topics explored in this paper can be subject to more in-
depth explorations that also have to address issues of identification.
This paper is related to a small literature on the institutional resource curse. Beck and
Laeven (2006) show that variation in the extent of natural resources across transition
economies can partly explain variation in institution building after 1990, when all these
countries faced the same challenge of building market-compatible institutions. Cross-country
regressions have confirmed this negative relationship between natural resource abundance
and the rule of law (Norman, 2009), control of corruption (Papyrakis and Gerlagh, 2004) and
overall institutional capacity (Isham et al., 2005).
The remainder of the paper is structured as follows. Section 2 assesses whether the
finance and growth relationship varies across countries with the degree of importance of
commodities in the economy. Section 3 explores whether commodity-based economies have
lower levels of financial development, thus a test of the resource curse for financial system
development. Section 4 analyzes banks’ balance sheets and income statements to show
whether banks are different in resource-based economies. Section 5 uses firm-level survey
data to explore difference in firms’ use of external finance and firms’ financing obstacles
across countries with a different reliance on natural resources and aggregate outreach data.
Section 6 concludes and provides some policy discussion.

7
2. Finance and growth – is there a natural resource discount?
This section explores whether the positive relationship between financial development
and economic growth varies across countries with the degree of natural resource reliance. In
order to do so, we use Barro-style standard cross-country finance and growth regressions,
adding a variable capturing natural resource reliance or abundance plus its interaction with
financial development.
We use two indicators to gauge the reliance of economies on natural resources. The
first indicator is Natural Resource Exports, which is the sum of fuel, ores, and metal exports
relative to GDP.4 Data come from World Development Indicators and are available for a
broad cross-section of countries on an annual basis over the period 1960 to 2007. The second
indicator is Subsoil Assets per capita and refers to natural assets (World Bank, 2006). It is
computed as the net present value of the income these resources are able to produce,
calculated for the year 2000. Natural Resource Exports ranges from zero in countries like
Mauritius to almost 100% in many oil-exporting countries. Similarly, Subsoil Assets per
capita ranges from zero in countries like Singapore to 80,000 USD in Saudi Arabia. Given
the wide variation, we use the log of one plus Subsoil Assets in our regressions. It is
important to note that there are important differences between these two measures, with
Natural Resource Exports referring to the realized income stream based on the resources and
Subsoil Assets to the actual wealth.5
4 We therefore abstract from agricultural commodities,
However, the two measures are highly and significantly
correlated with each other, suggesting that most economies that are abundant in natural
resources also rely on natural resources as export good. It is important to note that both
measures have their shortcomings. The ratio of Natural Resource Exports to GDP can be
driven as much by the numerator as by the denominator and depends very much on the
extraction rate. Subsoil Assets per capita is a more direct measure of natural resource wealth,
5 Brunnschweiler and Bulte (2008) point to important differences in the effect of natural resource dependence and natural resource abundance on institutional and economic development.

8
but relies heavily on assumptions about reserves and extraction costs (Van der Ploeg and
Poelhekke, 2010).
As indicator of financial development, we use a standard indicator from the literature,
Private Credit, which is the total claims by financial institutions outstanding on the domestic
nonfinancial private sector, divided by GDP. This indicator ranges from less than 2% in DRC
to almost 150% in Switzerland. As alternative indicator, we use Liquid Liabilities to GDP,
which is defined as currency plus demand and interest-bearing liabilities of banks and
nonbank financial intermediaries, divided by GDP, and thus focuses on banks’ liability side.
Both indicators are from the World Bank’s Financial Development and Structure Database
(Beck, Demirguc-Kunt and Levine, 2010). All other macroeconomic indicators are from the
World Development Indicators (WDI) of the World Bank.
We average real GDP per capita growth over the period 1980 to 2007 and run the
following regressions:
g(i) = α1 + β1Private Credit (i) + β2Private Credit (i) *Natural Resources (i) +
+ β3Natural Resources (i) + γ’C(i) + ε(i) (1)
where β1 captures the general effect of financial development on growth, while β2 captures
the differential effect in economies that are more resource based. Following the finance and
growth literature, our set of conditioning information includes (i) the log of initial real GDP
per capita to control for convergence, (ii) average years of schooling to control for human
capital accumulation, (iii) the share of exports and imports to GDP, (iv) the inflation rate and
(v) the ratio of government expenditures to GDP.6 With the exception of initial GDP per
capita, all explanatory variables are averaged over the sample period 1980 to 2007.7
6 Similar sets of conditioning information were used by Beck, Levine and Loayza (2000) and Beck and Levine (2004).
7 In the context of this paper, we will not address issues of causality and omitted variable. A large literature has shown that the relationship between financial development and growth is robust to controlling for biases due to endogeneity, measurement and omitted variables. See Beck (2009) for a survey.
9
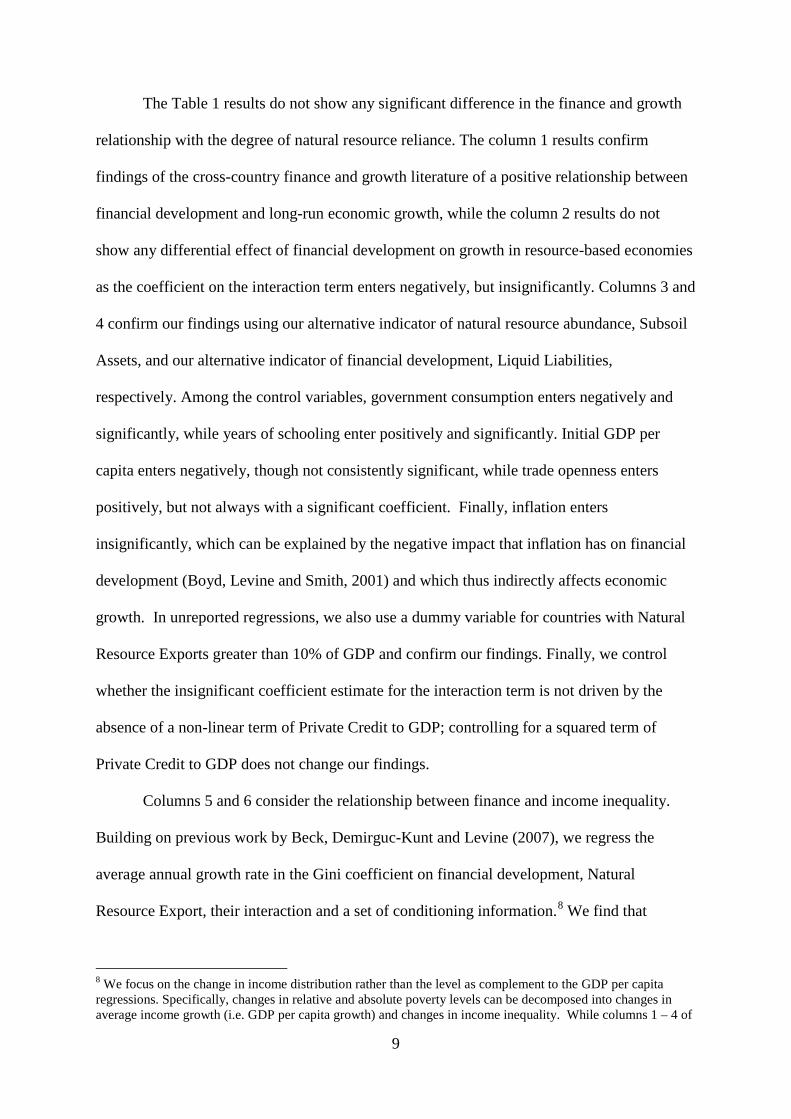
The Table 1 results do not show any significant difference in the finance and growth
relationship with the degree of natural resource reliance. The column 1 results confirm
findings of the cross-country finance and growth literature of a positive relationship between
financial development and long-run economic growth, while the column 2 results do not
show any differential effect of financial development on growth in resource-based economies
as the coefficient on the interaction term enters negatively, but insignificantly. Columns 3 and
4 confirm our findings using our alternative indicator of natural resource abundance, Subsoil
Assets, and our alternative indicator of financial development, Liquid Liabilities,
respectively. Among the control variables, government consumption enters negatively and
significantly, while years of schooling enter positively and significantly. Initial GDP per
capita enters negatively, though not consistently significant, while trade openness enters
positively, but not always with a significant coefficient. Finally, inflation enters
insignificantly, which can be explained by the negative impact that inflation has on financial
development (Boyd, Levine and Smith, 2001) and which thus indirectly affects economic
growth. In unreported regressions, we also use a dummy variable for countries with Natural
Resource Exports greater than 10% of GDP and confirm our findings. Finally, we control
whether the insignificant coefficient estimate for the interaction term is not driven by the
absence of a non-linear term of Private Credit to GDP; controlling for a squared term of
Private Credit to GDP does not change our findings.
Columns 5 and 6 consider the relationship between finance and income inequality.
Building on previous work by Beck, Demirguc-Kunt and Levine (2007), we regress the
average annual growth rate in the Gini coefficient on financial development, Natural
Resource Export, their interaction and a set of conditioning information.8
8 We focus on the change in income distribution rather than the level as complement to the GDP per capita regressions. Specifically, changes in relative and absolute poverty levels can be decomposed into changes in average income growth (i.e. GDP per capita growth) and changes in income inequality. While columns 1 – 4 of
We find that

10
financial development has a negative relationship with the growth rate in the Gini coefficient,
while Natural Resource Reliance has a positive, thus inequality-increasing, impact. The
interaction term between the two, on the other hand, does not enter significantly.
The results in Table 1 suggest that the finance and growth and the finance and
inequality relationships hold as much for resource-based economies as for other economies.
The insignificant interaction term between natural resource dependence and financial
development, however, can also be interpreted as indicating that financial development does
not have a dampening impact on the negative role of natural resources in the overall growth
process.
In a second step, we test whether industries that are more dependent on external
finance grow faster in countries with deeper financial systems and whether this relationship
depends on a country’s reliance on natural resources. This test follows the seminal work by
Rajan and Zingales (1998) who show that financial development is indeed beneficial for
industries that depend more on external financing sources, where this demand is measured for
large U.S. corporations that face a flat supply curve. As financial deepening is especially
relevant for manufacturing, a sector, on the other hand, that might easily be crowded out by
natural resource abundance, this test seems especially relevant in the context of our
assessment whether the finance and growth relationship holds for natural resource countries
as much as for other countries. Specifically, we extend the Rajan and Zingales (1998) test as
follows:
g(i,k) = α(i) + λ(k) + β1(External(k)∗Private Credit(i)) + γShare(i,k) +
+ β2(External(k)∗Private Credit(i)*Natural Resources (i)) + ε(i,k) (2)
where g(i,k) is growth of industry k in country i, averaged over the 1980s, External(k) is an
industry-level measure of external dependence that does not vary across countries, α and λ are Table 1 focus on the former, columns 5 and 6 focus on the latter. See Beck, Demirguc-Kunt and Levine (2007) for a more detailed discussion.
11
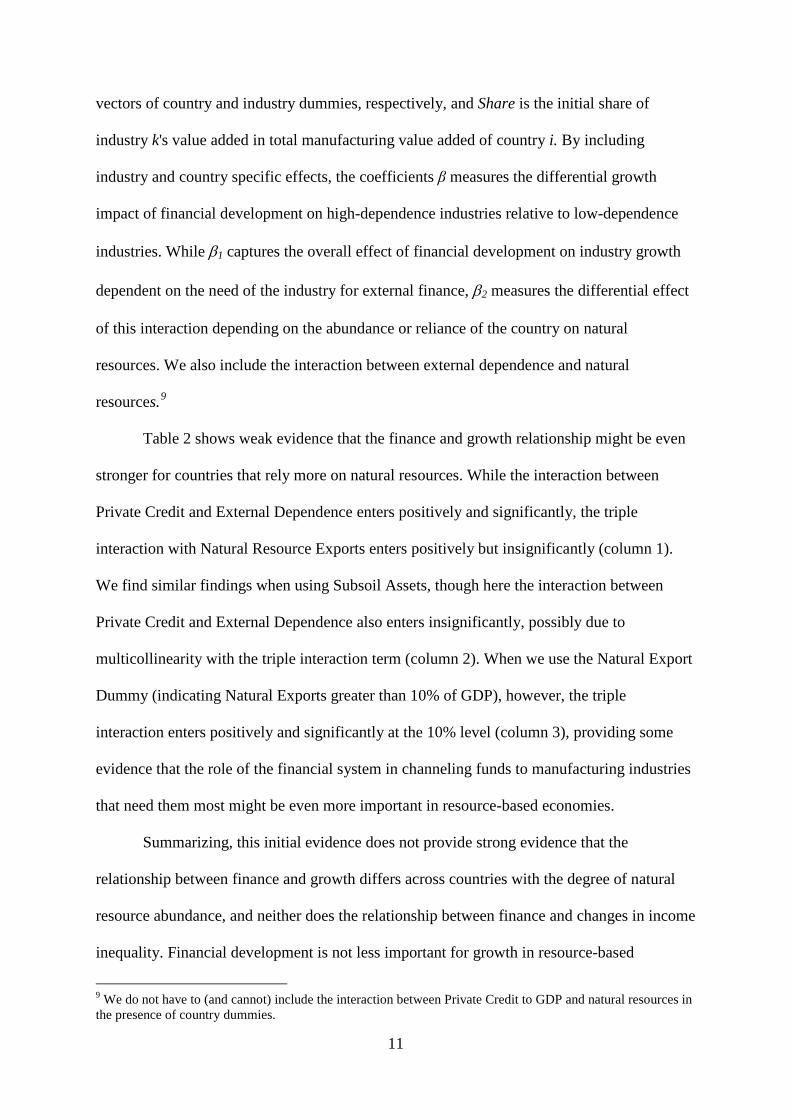
vectors of country and industry dummies, respectively, and Share is the initial share of
industry k's value added in total manufacturing value added of country i. By including
industry and country specific effects, the coefficients β measures the differential growth
impact of financial development on high-dependence industries relative to low-dependence
industries. While β1 captures the overall effect of financial development on industry growth
dependent on the need of the industry for external finance, β2 measures the differential effect
of this interaction depending on the abundance or reliance of the country on natural
resources. We also include the interaction between external dependence and natural
resources.9
Table 2 shows weak evidence that the finance and growth relationship might be even
stronger for countries that rely more on natural resources. While the interaction between
Private Credit and External Dependence enters positively and significantly, the triple
interaction with Natural Resource Exports enters positively but insignificantly (column 1).
We find similar findings when using Subsoil Assets, though here the interaction between
Private Credit and External Dependence also enters insignificantly, possibly due to
multicollinearity with the triple interaction term (column 2). When we use the Natural Export
Dummy (indicating Natural Exports greater than 10% of GDP), however, the triple
interaction enters positively and significantly at the 10% level (column 3), providing some
evidence that the role of the financial system in channeling funds to manufacturing industries
that need them most might be even more important in resource-based economies.
Summarizing, this initial evidence does not provide strong evidence that the
relationship between finance and growth differs across countries with the degree of natural
resource abundance, and neither does the relationship between finance and changes in income
inequality. Financial development is not less important for growth in resource-based
9 We do not have to (and cannot) include the interaction between Private Credit to GDP and natural resources in the presence of country dummies.

12
economies and possibly even more important! These results are certainly not conclusive and
more work is needed in this area, especially using industry and firm-level data and
disaggregating GDP into the resource-related and non-resource-related component.
Preliminary work by Barajas, Chami and Yousefi (2010) shows that there might be a
differential effect if one considers panel rather than cross-country regressions, with financial
development having lower if not negative impact on growth in oil-exporting countries. In
related work, Van der Ploeg and Poelhekke (2009) show that financial development has a
dampening impact on volatility in resource based economies, with positive repercussions for
economic growth. Prima facie, policymakers in resource-based economies should thus care
about financial sector deepening as much as policymakers in other countries.
Having shown that financial development is as important for economic growth in
resource-based economies as in other countries, we now explore whether the development
and structure of financial systems differs across countries with different degrees of resource
abundance.
3. Finance and natural resources – is there a resource curse?
This section explores whether there is empirical evidence for a resource curse in
financial development. Specifically, we assess whether economies more reliant on natural
resources have lower levels of financial development after controlling for standard factors
associated with cross-country variation in financial development.
Controlling for economic development, we find that countries that rely more on
natural resource exports have lower levels of Private Credit. Figure 1 presents a partial scatter
plot of Private Credit and Natural Resource Exports, controlling for GDP per capita. Here we
present data across countries, with data averaged over the period 2000 to 2007. In the

13
following, we will use multivariate regression analysis to assess the robustness of this finding
to controlling for other determinants of financial development.
The literature has pointed to macroeconomic stability and the efficiency of the
contractual and information frameworks as important determinants of financial sector
development (Boyd, Levine, and Smith, 2001; Djankov, McLiesh and Shleifer, 2007). In our
analysis, we therefore control for (i) the log of real GDP per capita, averaged over the sample
period (ii) the average inflation rate between 2000 and 2007, (iii) time to enforce a contract in
number of days, and (iv) the efficiency of the credit information system, with the latter two
measures averaged over the period 2003 to 2007. Specifically, we run the following
regressions.
Private Credit (i) = βNatural Resources (i) + γ’C(i) + ε(i) (3)
In addition to the two financial system indicators introduced above, we focus on
several other indicators, all from the Financial Development and Structure Database (Beck,
Demirguc-Kunt and Levine, 2010). The Loan-Deposit Ratio is a measure of intermediation
efficiency and is the ratio of total banks’ claim outstanding on domestic, non-financial
sectors, and total bank deposits. Higher ratios indicate higher intermediation efficiency; ratios
above one, however, might indicate overheating of the financial system. We also use two
indicators to gauge the development of the stock market. Specifically, Stock Market
Capitalization to GDP is a measure of stock market size relative to real economic activity and
Stock Market Turnover is an indicator of stock market trading relative to stock market
capitalization, thus a measure of the liquidity of the market.
In addition to the financial development indicators defined above, we consider the
relationship between natural resource reliance and two indicators of financial structure, i.e.
the degree to which a financial system is market or bank-based. Following Beck and Levine
(2002), we define Structure-Size as the ratio of Stock Market Capitalization and Bank Assets,

14
where the latter is defined as total banking claims on non-financial (private and public)
domestic sectors. Higher ratios would indicate a financial system that is more market-based.
Structure-Efficiency is defined as the product of Stock Market Turnover and banks’ Net
Interest Margin (a negative indicator of bank efficiency). Higher numbers would again
indicate a financial system that is more market-based.
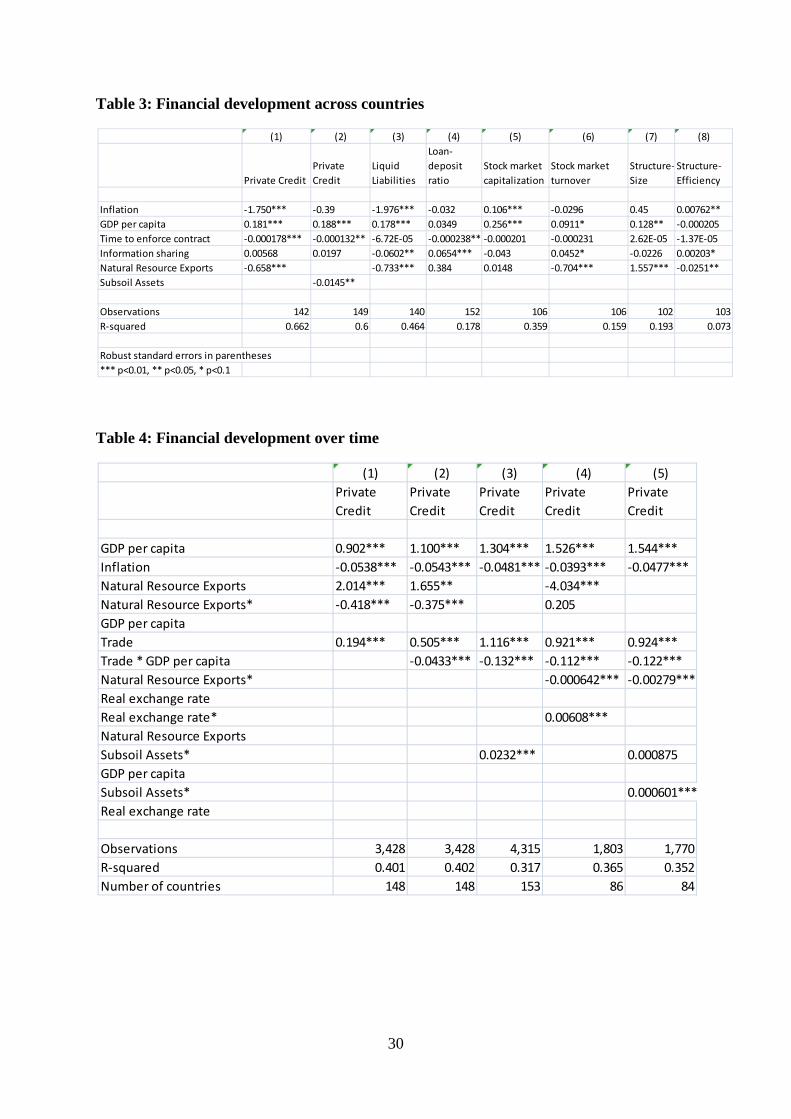
Table 3 shows that countries that are more reliant on natural resource exports have
lower levels of financial development, even after controlling for other determinants of
financial development. The effect is not only statistically, but also economically large. Take
the example of column 1. One standard deviation higher Natural Resource Exports imply 10
percentage points lower Private Credit.10
10 It is important to note, however, that not all resource-based economies have a lower level of Private Credit than predicted by the other variables. Norway and other high-income countries have even higher levels of Private Credit than predicted by the other included variables, while many developing resource-based economies have significantly lower levels. This points to further exploration of differential effects of natural resource abundance in future research.
Consistent with the literature, there is a negative
relationship of inflation and contract enforcement inefficiency, while the efficiency of credit
information sharing does not enter significantly. Consistent with Figure 1, the log of GDP
per capita enters positively and significantly. The column 2 results confirm this finding using
Subsoil Assets as indicator of natural resources, while column 3 confirms the results using
Liquid Liabilities. The column 4 results show that lower levels of financial intermediation do
not imply lower intermediation efficiency as Natural Resources does not enter significantly in
the regression of the aggregate Loan-Deposit Ratio. The columns 5 and 6 results show that
economies that rely more on natural resources do not have smaller stock exchanges, but
significantly less liquid ones. Natural Resource Exports enters insignificantly in the
regression of Stock Market Capitalization to GDP, but negatively and significantly in the
regression of Stock Market Turnover. The columns 7 and 8 results, finally, show that when
measured by size, resource-based economies have more market-based financial systems,
while when measured by efficiency, they have more bank-based financial systems. Given

15
the previous results we can interpret this as suggesting that the market-based nature in terms
of size stems from the smaller banking systems in resource-based economies, while the bank-
based nature in terms of efficiency stems from the lower stock market liquidity in these
countries. We confirm the findings of Table 3, using our alternative indicators of natural
resource abundance, Subsoil Assets and the Natural Resource Export dummy.
The results so far have focused on cross-country variation in financial development,
but there is also a large variation within countries over time. How do countries with different
degrees of natural resource dependence develop their financial systems? Does natural
resource abundance help or impede further financial deepening as demand for financial
services increases with economic development?
Table 4 explores within-country variation of financial development as function of
natural resource reliance. Specifically, here we present estimations with country-fixed effects
to explore how Private Credit develops with GDP per capita over time. We focus on a longer
sample period, using annual data over the period 1960 to 2007. We use this sample to assess
how the financial system deepens as a function of economic development and other
macroeconomic indicators, and whether these relationships vary according to the degree of
natural resource reliance.
FD(i,t) = β1 GDP per capita (i,t)+ β2 GDP per capita(i,t)*Natural Resources (i,t) +
+ β3 Natural Resources(i,t) + γ’C(i,t) + δ’X(i) + ε(i,t) (4)
Unlike in Tab le 3, we include all indicators in logs so that we can interpret the coefficient
estimates as elasticities. While β1 shows the relationship between Private Credit and GDP per
capita, β2 indicates whether this relationship is significantly higher or lower in countries with
higher reliance on natural resources. We do not include indicators of the contractual or
information framework, as we have limited time-series variation and data availability in these
indicators. We include country-specific fixed effects and other time-varying country variables
16
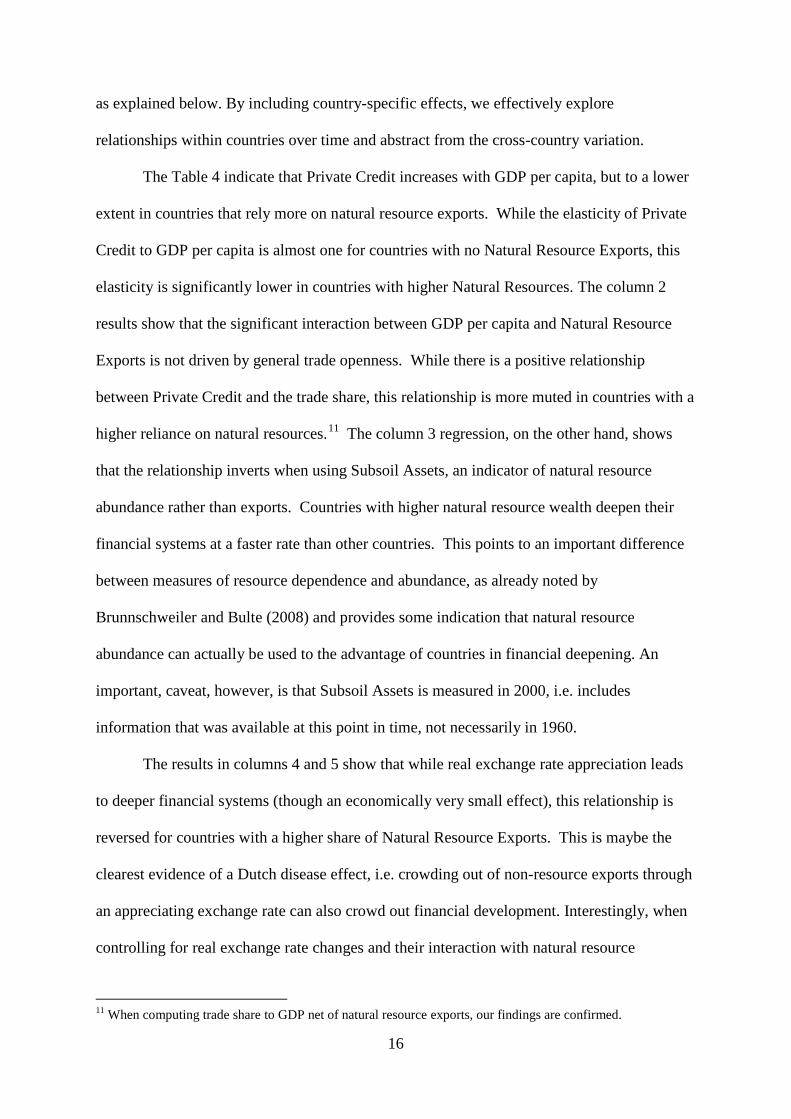
as explained below. By including country-specific effects, we effectively explore
relationships within countries over time and abstract from the cross-country variation.
The Table 4 indicate that Private Credit increases with GDP per capita, but to a lower
extent in countries that rely more on natural resource exports. While the elasticity of Private
Credit to GDP per capita is almost one for countries with no Natural Resource Exports, this
elasticity is significantly lower in countries with higher Natural Resources. The column 2
results show that the significant interaction between GDP per capita and Natural Resource
Exports is not driven by general trade openness. While there is a positive relationship
between Private Credit and the trade share, this relationship is more muted in countries with a
higher reliance on natural resources.11
The results in columns 4 and 5 show that while real exchange rate appreciation leads
to deeper financial systems (though an economically very small effect), this relationship is
reversed for countries with a higher share of Natural Resource Exports. This is maybe the
clearest evidence of a Dutch disease effect, i.e. crowding out of non-resource exports through
an appreciating exchange rate can also crowd out financial development. Interestingly, when
controlling for real exchange rate changes and their interaction with natural resource
The column 3 regression, on the other hand, shows
that the relationship inverts when using Subsoil Assets, an indicator of natural resource
abundance rather than exports. Countries with higher natural resource wealth deepen their
financial systems at a faster rate than other countries. This points to an important difference
between measures of resource dependence and abundance, as already noted by
Brunnschweiler and Bulte (2008) and provides some indication that natural resource
abundance can actually be used to the advantage of countries in financial deepening. An
important, caveat, however, is that Subsoil Assets is measured in 2000, i.e. includes
information that was available at this point in time, not necessarily in 1960.
11 When computing trade share to GDP net of natural resource exports, our findings are confirmed.

17
indicators, the interaction between the natural resource indicators and GDP per capita turns
insignificant, which would suggest that the resource curse in financial development works
indeed mainly through the Dutch disease effect of real exchange rate appreciation.
Summarizing, resource-based economies have smaller banking systems and less liquid
stock exchanges than predicted by their level of economic development, degree of monetary
stability and efficiency of contractual and informational framework. As resource-based
economies develop economically, their financial systems deepen at a slower rate than in other
countries, though this results holds for natural resource reliance (or dependence) rather than
natural resource abundance. The fact that this result holds after controlling for the contractual
and information frameworks suggests that the natural resource curse in financial development
goes beyond the institutional natural resource curse documented in the literature (e.g., Beck
and Laeven, 2006).
The findings so far are consistent with both a demand-driven and a supply-driven story,
i.e. lower demand for financial services resulting in a smaller financial system or supply
constraints preventing a financial system from developing. In the next two sections, we
therefore focus first on indicators derived from banks’ financial statements to assess whether
banks in commodity-based economies are different in their business model, efficiency and
stability, before turning to firm-level data to assess whether clients are underserved in
resource-based economies.
4. Banks in resource-based economies
While the previous section has provided some evidence for a natural resource curse in
financial development, this section digs deeper by exploring banks’ business model,
efficiency, stability, and asset composition to assess whether there are significant differences
across banks in countries with different reliance on natural resources. We use data from

18
Bankscope over the period 2000 to 2007 and construct and compare indicators of business
orientation, efficiency, and stability across banks and across countries with different degrees
of natural resource reliance. We only include banks with at least two observations and
countries with data on at least four banks. We restrict our sample to the largest 100 banks in
terms of assets within a country so that our sample is not dominated by a specific country.
Finally, we eliminate outliers in all variables by winsorizing at the 1st and 99th percentiles.
To compare the business orientation of banks, we use two indicators suggested by
Demirguc-Kunt and Huizinga (2010) - the ratio of fee-based to total operating income and the
importance of non-deposit funding to total funding - as well as the traditional loan-deposit
ratio. Further, we use the ratio of liquid assets to total assets. Second, we use three indicators
of bank efficiency. Our first efficiency indicator is overhead cost, which is computed as total
operating costs divided by total assets. Second, we use the cost-income ratio, which
measures overhead costs relative to gross revenues, with higher ratios indicating lower levels
of cost efficiency. Third, we use the net interest margin, which is net interest revenue relative
to total earning assets. All three indicators decrease in efficiency, i.e. higher numbers indicate
less efficient banks. To compare the stability of banks across countries, we focus on the z-
score, which is defined as the sum of capital-asset ratio and return on assets (ROA), divided
by the standard deviation of ROA. It measures the number of standard deviations in ROA that
a bank is away from insolvency and thus increases in the stability of banks. We also assess
differences across banks and countries in the capital-asset ratio and in ROA, two of the
components of the z-score.
We average data over the sample period 2000 to 2007 and run the following
regression:
Bank (i,j) = αB(i,j) + β1 GDP per capita(j) + β2 Natural(j) + ε(i,j) (5)

19
where i stands for bank and j for country. B is a set of bank-level control variables, including
size (measured in logs of millions of USD of total assets), the share of non-loan earning
assets in total assets and fixed assets to total assets. We control for the log of GDP per capita
to prevent confounding the relationship between economic development and natural resource
dependence with the relationship between natural resource dependence and bank
characteristics. We apply standard errors clustered on the country level, i.e. allow for
correlation between error terms of banks within countries, but not across countries to thus
control for unobserved factors across banks within a country.
The results in Table 5 show few significant differences across banks according to the
reliance on natural resources in the country they operate in. When it comes to business
model, we find no significant differences in the share of fee income, the reliance on non-
deposit funding or the loan-deposit ratio across countries with different reliance on natural
resources. We do, however, find that the share of liquid assets in total assets increases as we
move from countries with no natural resource exports to resource-based economies. In terms
of efficiency, the only dimension where the degree of natural resource reliance seems to
matter is the cost-income ratio, which is significantly lower in countries that are more
resource-based. On the other hand, there are no significant differences in the net interest
margin or overhead costs across countries with different reliance on natural resources.
Finally, we find no significant differences in stability of banks across countries with different
reliance on natural resources, but find a significant difference in capitalization and
profitability. Banks in resource-based economies are significantly better capitalized and more
profitable. The higher profitability also explains why we find a lower cost-income ratio for
banks in resource-based economies, while there are no significant differences in the other two
efficiency indicators. We confirm all our findings using Subsoil Assets and the Natural
Export dummy as indicators of the resource nature of economies. Turning to the control

20
variables, we find that banks in richer countries have higher cost-income ratios but lower net
interest margins and are more stable due to higher capitalization and in spite of lower
profitability. Banks with a higher share of fixed assets have higher fee income, a lower loan-
deposit ratio, are less efficient and better capitalized. Banks with higher non-loan earning
assets have higher fee income, lower loan-deposit ratio, higher liquid assets, lower net
interest margins, and are less stable. Larger banks, finally, rely more on non-deposit funding,
have lower loan-deposit ratios, hold fewer liquid assets, are more efficient, and have lower
capital-asset ratios and return on assets.
In a separate analysis, we compare the balance sheet composition of banks in
resource- and non-resource-based economies using data from the IMF’s International
Financial Statistics. Specifically, we compare the asset shares of (i) credit to the private
sector, (ii) credit to national and sub-national governments, (iii) credit to state-owned
enterprises, (iv) foreign assets and (v) liquid assets, between banks in countries with Natural
Resource Exports higher than 10% of GDP and less than 10% of GDP.
Figure 2 shows that banks in resource-based economies invest a lower share of their
assets in loans to the private sector or government, but a higher share in loans to state-owned
enterprises. They also hold a larger share of their assets in liquid and in foreign assets. These
differences are consistent with the previous findings reported in Table 5, but also show a
lower tendency of banks to fulfill their intermediation function.
Summarizing, comparisons of bank-level indicators suggest that the only differences
between banks in natural-resource based economies and other economies is that banks in the
former countries are better capitalized, more liquid and more profitable. There are no
significant differences in the business model, in the overall efficiency or in their stability.
Comparisons of asset composition across these two country groups also suggest that banks in
21
resource-based economies are less engaged in financial intermediation. We will now turn to
demand-side data to complement this analysis.
5. Access to finance in resource-based economies
While the previous sections have focused on aggregate and supplier data to explore
differences across countries with different levels of natural resource reliance, we now explore
whether these differences also translate into differences in firms’ financing patterns and
financing obstacles. We rely on the World Bank/IFC Enterprise Surveys, which have been
conducted over the past eight years in almost 100 countries with a consistent survey
instrument.12
We focus on several questions that capture firms’ financing patterns. First, we
compute the share of enterprises with a loan or overdraft facility. Second, we compute the
average share of working capital that is financed with external financial source across all
enterprises in a country. Finally, we compute the average share of fixed assets that is
financed with external financial source across all enterprises in a country. We also focus on a
demand-side question, i.e. the share of firms in each country that states that financing is a
severe obstacle to its operation and growth.
The surveys try to capture business perceptions on the most important obstacles
to enterprise operation and growth, but also include detailed information on management and
financing arrangements of companies. Sample sizes vary between 250 and 1,500 companies
per country and data are collected using either simple random or random stratified sampling.
The sample includes formal enterprises of all sizes, different ownership types and across 26
industries in manufacturing, construction, services and transportation.
12 See www.enterpriseseurveys.org for more details. Similar surveys were previously conducted under the leadership of the World Bank and other IFIs in Africa (RPED), the Central and Eastern European transition economies (BEEPS) in the 1990s and world-wide in 2000 (World Business Environment Survey).

22
Figures 3 through 6 show the correlation between Natural Resources and four
indicators of firm finance. We see a negative relationship between (i) the share of firms with
loans or line of credits, (ii) the average share of working capital financed externally, (iii) the
average share of fixed asset investment financed externally, and the reliance on natural
resources. We note, however, that these negative relationships are weak and noisy and driven
by countries with high share of natural resource exports. The share of firms that rate
financing as severe obstacle for the operation and growth of their enterprise, on the other
hand, is not significantly correlated with Natural Resources (Figure 6).
Table 6 Panel A shows that the negative relationship between access to external
finance and Natural Resources is consistent across firms of all sizes. To assess the
relationship between firms’ financing patterns and natural resource reliance across different
size classes, we recalculate the above mentioned indicators within each country for small
firms (fewer than 20 employees), mid-size companies (20 to 100 employees) and large
enterprises (over 100 employees). For each size class, we compare the indicators, averaged
across countries with Natural Resource Exports of less than 10% of GDP and averaged across
countries with Natural Resource Exports of more than 10%. Unlike in the scatter plots, we
find significant differences between firms in resource-based economies and other economies
across all size groups. Firms of all sizes use less external finance in resource based economies
than in other economies. The fact that large firms in resource-based economies have lower
external financing as much as small firms is in contrast to general cross-country findings of
significantly lower external financing by small than by large enterprises (Beck, Demirguc-
Kunt and Maksimovic, 2008).
Table 6 Panel B shows additional significant differences between firms in resource-
based and non-resource based economies in their access to finance. Here, we dig deeper into
the loan application process of firms, splitting our sample again into countries with Natural

23
Resource Exports, averaged over 2000 to 2007, below 10% of GDP and above 10% of GDP.
Line 1 shows that firms in resource-based economies are significantly less likely to have a
loan, consistent with Figure 2. Among the firms that do not have a loan, however, there is no
significant difference in the tendency to apply for a loan across countries with and without
resource abundance (line 2). Among the firms that decided not to apply, however,
significantly more firms in resource-based economies stated that they did not do so because
of cumbersome application procedures, while a significantly smaller share of non-applicants
stated as reason that they do not need a loan. Overall, the share of firms stating that they do
not need a loan is about the same in both samples, which clearly suggests that it is not a lack
of demand that drives the lower level of financial development in resource-based economies.
There are no significant differences in other reasons for not applying for a loan. In summary,
these data suggest that the lower use of external finance by firms in resource-based
economies is not driven by demand but rather supply-side constraints.
Table 7 shows weak evidence for lower bank outreach in resource-based economies
and other countries. Here, we follow the model of Table 3 and regress indicators of branch
penetration per capita and deposit accounts per capita on (i) log of GDP per capita, (ii) time
to enforce a contract, (iii) efficiency of credit information sharing, (iv) inflation and (v)
Natural Resource Exports to GDP or Subsoil Assets. We focus on branch penetration,
measured as branches per capita, and account penetration, measured as deposit accounts per
capita. Both Natural Resource Exports and Subsoil Assets enter negatively in all regressions,
but only Natural Resource Exports enters significantly in the regression of Branches per
capita. Overall, this seems weak evidence for a lower outreach in resource-based economies.
It suggests that it is not the lack of geographic outreach or overall lower bank penetration that
drives the more limited access to external finance by firms in resource-based economies.

24
6. Conclusions
This paper tested for the existence of a natural resource curse in financial system
development. We can summarize our findings as follows: banking systems are smaller in
resource-based economies and stock markets less liquid, i.e. with lower trading activity.
Financial deepening is less income-elastic in resource-based economies, which suggests that
resource-based economies invest less in their economies as they grow. In resource-based
economies, banks are more liquid13
Overall, these findings point to a natural resource curse in financial development, with
negative repercussions for resource-based economies. The finance and growth relationship
seems as important for resource-based economies as for other economies, so that the under-
investment in the financial sector will have long-term negative repercussions for economic
growth. Country characteristics and policies related to financial sector deepening –
macroeconomic stability, legal system efficiency and an effective information sharing
framework – hold as much in resource-based economies as in other economies. It seems that
it is rather a lack of investment of the necessary financial and human resources into the
financial sector that can explain the natural resource curse of finance.
, more profitable and better capitalized, but do not have
different business models and are not more or less efficient or stable than banks in other
countries. They also engage less in intermediation with the real economy. Firms in resource-
based economies are less likely to have a loan and finance a lower share of working capital
and fixed asset investment with external finance; in addition, this gap is consistent across
firms of all sizes. This is not due to a lack of demand, though. Overall, it seems that supply
constraints, though not necessarily related to physical outreach of banks, explain the more
limited access of firms to external finance and overall lower levels of financial development.
13 Note that the concept of liquidity is a different one in the case of banks and stock markets. In the case of banks, it refers to the asset holdings, i.e. a stock variable, while in the case of financial markets, it refers to an activity, i.e. a flow variable.

25
What are the policy implications of our findings? Policy makers in resource-based
economies should care about the financial sector as much as policy makers in other
economies, but have to “make the extra effort” in order to achieve the goals of inclusive
financial deepening. In addition to the medium- to long-term policies – macroeconomic
stability and an effective contractual and information framework – competition seems a
fruitful area for policy makers to consider, given the high profitability of banks in resource-
based markets, which might be partly due to lack of competition. Additional incentives for
market-based lending to the private sector might be another important area, e.g. through
partial credit guarantees. It is important, however, that the necessary institutional framework
has to be in place in order to ensure the necessary governance structure for such
interventions. It is important to note that it is not the lack of resources that constrains
intermediation in these countries, but rather missing incentives.
As mentioned in the Introduction, this is a first exploratory paper on the role of
financial systems in resource-based economies, with many further venues for research.
Analyzing the role of financial sectors in resource-led boom and bust cycles is important, as
is the role of government interference and governance in banks in resource-based economies.
Disentangling financial intermediation into different components, such as enterprise and
household lending seems a promising area in this context to better understand the role of
financial systems in the growth process of natural resource based economies. Exploring the
role of the financial systems in mitigating the effects of commodity price and then ensuing
exchange rate volatility is critical for policy advice as well.

26
References
Aghion, P., P. Howitt, and D. Mayer-Foulkes. 2005. The Effect of Financial Development on Convergence: Theory and Evidence. Quarterly Journal of Economics 120, 173-222. Aghion, P., P. Bacchetta, R. Ranciere and K. Rogoff. 2009. Exchange Rate Regimes and Productivity Growth: The Role of Financial Development, Journal of Monetary Economics 56, 494-51. Barajas, R. Chami and R. Yousefi. 2010. The Finance and Growth Nexus Re-examined: Are There Cross-Region Differences? IMF mimeo. Beck, T. 2006. Creating an Efficient Financial System: Challenges in a Global Economy, in: Economic Growth, edited by South African Reserve Bank, Banco de México and The People’s Bank of China. Beck, T. 2009. The Econometrics of Finance and Growth, in: Terence Mills and Kerry Patterson (Eds.): Palgrave Handbook of Econometrics, Vol. 2, Palgrave Macmillan. Beck, T., A. Demirgüç-Kunt, and R. Levine. 2007. Finance, Inequality, and the Poor. Journal of Economic Growth 12, 27-49. Beck, T., A. Demirgüç-Kunt, and R. Levine. 2010. Financial Institutions and Markets Across Countries and Over Time: The Updated Financial Development and Structure Database. World Bank Economic Review 24, 77-92. Beck, T., A. Demirgüç-Kunt and V. Maksimovic. 2005. Financial and legal constraints to firm growth: Does firm size matter? Journal of Finance 60, 137-77. Beck, T., A. Demirgüç-Kunt and V. Maksimovic. 2008. Financing Patterns Around the World: Are Small Firms Different? Journal of Financial Economics 89,467-87. Beck, T. and L. Laeven. 2006. Institution Building and Growth in Transition Economies. Journal of Economic Growth 11, 157-186.` Beck, T. and R. Levine. 2002. Industry Growth and Capital Allocation: Does Having a Market- or Bank-Based System Matter? Journal of Financial Economics 64, 147-180. Beck, T. and R. Levine. 2004. Stock markets, banks and growth: Panel evidence. Journal of Banking and Finance 28, 423-42. Beck, T. and R. Levine. 2005. Legal Institutions and Financial Development, in: Handbook of New Institutional Economics, edited by Claude Menard and Mary Shirley, Kluwer Dordrecht (The Netherlands). Beck, T., R. Levine and N. Loayza. 2000. Finance and the sources of growth. Journal of Financial Economics 58, 261-300. Besley, T. and T. Persson. 2010. State Capacity, Conflict and Development, Econometrica 78, 1-34.

27
Bhattacharyya S. and R. Hodler.2010. Do Natural Resource Revenues Hinder Financial Development? The Role of Political Institutions” Oxford University, mimeo. Boyd, J., R. Levine and B. Smith. 2001. The Impact of Inflation on Financial Sector Performance. Journal of Monetary Economics 47: 221-248. Brunnschweiler, C.N. and Bulte, E. 2008. The Resource Curse Revisited and Revised: A Tale of Paradoxes and Red Herrings. Journal of Environmental Economics and Management 55, 248-64. Collier, P. and A. Hoeffler. 2004. Greed and grievance in civil wars. Oxford Economic Papers 56, 663-95. Demirgüç-Kunt, A., and Huizinga.H. 2010. Bank Activity and Funding Strategies. Journal of Financial Economics 98, 626-50. Djankov, S., C. McLiesh, and A. Shleifer. 2007. Private Credit in 129 Countries. Journal of Financial Economics, 84, 299-329. Gylfason, T. 2001. Natural resources, education and economic development. European Economic Review 45, 847-59. Gylfason, T. 2004. Natural resources and economic growth: from dependence to diversification. CEPR Discussion Paper 4804. Isham, J., M, Woolcock, L. Pritchett, G. Busby.2005. The varieties of resource experience: natural resource export structures and the political economy of economic growth, World Bank Economic Review 19, 141–174. La Porta, R., F. Lopez-de-Silanes, A. Shleifer, and R. W. Vishny. 1997. Legal Determinants of External Finance. Journal of Finance 52, 1131-1150. La Porta, R., F. Lopez-de-Silanes, A. Shleifer, and R. W. Vishny. 1998. Law and Finance. Journal of Political Economy 106, 1113-1155 Levine, R. 2005. Finance and Growth: Theory and Evidence. In P. Aghion and S. Durlauf (eds.), Handbook of Economic Growth. The Netherlands: Elsevier Science. Mehlum, H., K. Moene and R. Torvik, 2006. Institutions and the Resource Curse. Economic Journal 116, 1-20. Norman, C. 2009. Rule of Law and the Resource Curse: Abundance versus Intensity. Environmental and Resource Economics 43, 183-207. Papyrakis, E. and R. Gerlagh,2004. The Resource Curse Hypothesis and Its Transmission Channels, Journal of Comparative Economics 31, 181–193. Ploeg, F. van der. 2011. Natural Resources: Curse of Blessing? Journal of Economic Literature, forthcoming.

28
Ploeg, F. van der and S. Poelhekke. 2009. Volatility and the Natural Resource Curse. Oxford Economic Papers 61, 727-60. Ploeg, F. van der and S. Poelhekke. 2010. The Pungent Smell of “Red Herrings”: Subsoil Assets, Rents, Volatility and the Resource Curse. Journal of Environmental Economics and Management 60, 44-55. Rajan, R., and L. Zingales. 1998. Financial Dependence and Growth. American Economic Review 88, 559-87. Rioja, F. and N. Valev. 2004a. Does One Size Fit All? A Reexamination of the Finance and Growth Relationship. Journal of Development Economics 74, 429-47.
Rioja, F. and N. Valev. 2004b. Finance and the Sources of Growth at Various Stages of Economic Development. Economic Inquiry 42(1): 127-40. World Bank (2006): Where is the Wealth of Nations: Measuring Capital for the 21st Century, Washington D.C. Wurgler, J. 2000. Financial Markets and the Allocation of Capital. Journal of Financial Economics 58, 187-214.

29
Table 1: Finance, natural resources and growth across countries
Table 2: Industry growth, finance and natural resources across countries
(1) (2) (3) (4) (5) (6)GDP pc growth
GDP pc growth
GDP pc growth
GDP pc growth
Growth in Gini
Growth in Gini
Initial GDP per capita -0.00354* -0.00356* -0.00274 -0.00561***Private Credit 0.00735** 0.00798*** 0.0105*** -0.00521**-0.00467*Inflation 0.00185 0.00228 -0.00067 0.00142 1.30E-05 1.35E-05Government consumption -0.0112** -0.0114** -0.0101** -0.0101**Trade 0.00545** 0.00552** 0.00425 0.00203 -0.00088 -0.00079Years of schooling 0.00227** 0.00222** 0.00226** 0.00308** 0.000685 0.000494Natural Resource Exports -0.0284***-0.0360** -0.0368** 0.0212** 0.00453Natural Resource Exports* -0.00657 -0.0108Private CreditLiquid Liabilities 0.0101***Natural Resource Exports* -0.00912Liquid LiabilitiesSubsoil Assets -0.00064Subsoil Assets* -0.00033Private CreditInitial Gini -0.0173***-0.0173***GDP pc growth 0.0464 0.0533Constant 0.0450** 0.0462** 0.0412** 0.0699*** 0.0578*** 0.0581***
Observations 104 104 102 102 64 64R-squared 0.419 0.421 0.411 0.381 0.322 0.329
Industry growth
Industry growth
Industry growth
Initial share -0.936*** -1.080*** -1.111***Private Credit*External dependence 0.0804** 0.0535 0.0766**Private Credit*External dependence* 0.0408Natural resource exports External dependence*natural resource exports 0.111Private Credit*External dependence* 0.00922Subsoil assets External dependence*Subsoil Assets -0.0046Private Credit*External dependence* 0.163*Natural resource dummy External dependence*natural resource dummy -0.0677
Observations 1,105 1,132 1,147R-squared 0.302 0.277 0.281
30
Table 3: Financial development across countries
Table 4: Financial development over time
(1) (2) (3) (4) (5) (6) (7) (8)
Private CreditPrivate Credit
Liquid Liabilities
Loan-deposit ratio
Stock market capitalization
Stock market turnover
Structure-Size
Structure-Efficiency
Inflation -1.750*** -0.39 -1.976*** -0.032 0.106*** -0.0296 0.45 0.00762**GDP per capita 0.181*** 0.188*** 0.178*** 0.0349 0.256*** 0.0911* 0.128** -0.000205Time to enforce contract -0.000178*** -0.000132** -6.72E-05 -0.000238** -0.000201 -0.000231 2.62E-05 -1.37E-05Information sharing 0.00568 0.0197 -0.0602** 0.0654*** -0.043 0.0452* -0.0226 0.00203*Natural Resource Exports -0.658*** -0.733*** 0.384 0.0148 -0.704*** 1.557*** -0.0251**Subsoil Assets -0.0145**
Observations 142 149 140 152 106 106 102 103R-squared 0.662 0.6 0.464 0.178 0.359 0.159 0.193 0.073
Robust standard errors in parentheses*** p<0.01, ** p<0.05, * p<0.1
(1) (2) (3) (4) (5)
Private Credit
Private Credit
Private Credit
Private Credit
Private Credit
GDP per capita 0.902*** 1.100*** 1.304*** 1.526*** 1.544***Inflation -0.0538*** -0.0543*** -0.0481*** -0.0393*** -0.0477***Natural Resource Exports 2.014*** 1.655** -4.034***Natural Resource Exports* -0.418*** -0.375*** 0.205GDP per capitaTrade 0.194*** 0.505*** 1.116*** 0.921*** 0.924***Trade * GDP per capita -0.0433*** -0.132*** -0.112*** -0.122***Natural Resource Exports* -0.000642*** -0.00279***Real exchange rateReal exchange rate* 0.00608***Natural Resource ExportsSubsoil Assets* 0.0232*** 0.000875GDP per capitaSubsoil Assets* 0.000601***Real exchange rate
Observations 3,428 3,428 4,315 1,803 1,770R-squared 0.401 0.402 0.317 0.365 0.352Number of countries 148 148 153 86 84

31
Table 5: Banks’ business model, efficiency and stability across countries
(1) (2) (3) (4) (5) (6) (7) (8) (9) (10)
Fee income
Non deposit-funding
Loan-deposit ratio
Liquid assets
Cost-income ratio
Overhead costs
Net interest margin Z-score
Equity-asset ratio ROA
Fixed Assets 1.439** -0.0232 -0.0584***-0.274 3.546*** 0.596*** 0.00269*** -0.544* 0.278** -0.0285Nonloan earning assets 0.192*** 0.00168 -0.0159***0.543*** 0.0385 0.00125 -0.000185*** -0.0617*** 0.0113 0.000809Size -0.408 0.558** -0.0474***-1.673*** -1.708*** -0.409*** -0.00286*** -0.402 -1.990*** -0.0494**GDP per capita 0.927 -0.314 0.0248 -0.0659 2.066*** -0.0142 -0.00361*** 2.288*** 0.465** -0.0989***Natural Resource Exports2.302 -1.636 0.222 16.49*** -24.86*** 0.341 0.0161 -0.911 6.247*** 2.277***
Observations 2,160 3,503 3,432 3,555 3,422 3,446 3,437 3,525 3,554 3,547R-squared 0.061 0.014 0.137 0.525 0.155 0.409 0.268 0.075 0.341 0.132Number of countries 113 114 114 114 114 114 114 114 114 114
*** p<0.01, ** p<0.05, * p<0.1

32
Table 6: Firms’ financing patterns and obstacles across countries
Panel A: Use of external finance and financing obstacles across different size groups
Panel B: The demand for loans across countries
Resource Based Economies
Non-resource based economies Difference
p-value T-stat
Small enterprises
External finance in working capital 23.70 30.74 -7.042 0.0272**External finance in investment 28.06 37.48 -9.424 0.0122**Share of firms with loan 23.32 33.02 -9.709 0.0059***Share of firms with severe financing obstacles 16.31 16.84 -0.525 0.8047
Medium-size enterprises
External finance in working capital 30.13 39.51 -9.377 0.0034***External finance in investment 30.29 41.90 -11.613 0.0004***Share of firms with loan 36.69 49.00 -12.317 0.003***Share of firms with severe financing obstacles 13.55 12.90 0.654 0.7031
Large enterprises
External finance in working capital 33.05 42.82 -9.773 0.0095***External finance in investment 34.83 43.40 -8.571 0.0216**Share of firms with loan 49.59 59.83 -10.243 0.0243**Share of firms with severe financing obstacles 12.14 11.16 0.983 0.6147
Resource Based Economies
Non-resource based economies Difference
p-value T-stat
Do you have a loan? 30.783 42.079 -11.296 0.0066***
If you do not have a loan, did you apply for a loan? 13.271 13.395 -0.124 0.933
Why did you not apply for a loan No need for a loan - establishment has sufficient capital 47.288 61.363 -14.075 0.001*** Application procedures for loans or lines of credit are complex 15.561 8.152 7.409 0.0003*** Interest rates are not favorable 14.262 13.003 1.260 0.510 Collateral requirements are too high 6.865 6.342 0.523 0.646 Did not think it would be approved 7.364 6.488 0.877 0.562

33
Table 7: Banking sector outreach across countries
(1) (2) (3) (4)
Branches per capita
Accounts per capita
Branches per capita
Accounts per capita
Inflation -0.668 -180.6*** -1.093 -128.8*GDP per capita 5.175*** 546.8*** 5.387*** 532.9***Time to enforce contract 0.000966 -0.243 0.000662 -0.137Information sharing 0.0824 -130.8** -0.0671 -113.6**Natural Resource Exports -5.528 -1,267**Subsoil Assets -0.0532 -29.82
Observations 114 82 114 83R-squared 0.283 0.504 0.302 0.483

34
Figure 1: Financial development and natural resource dependence
Partial scatter plot between Private Credit to GDP (vertical axis) and Natural Resource Exports to GDP (horizontal axis), controlling for GDP per capita
Figure 2: Asset composition in resource-based economies
-1-.5
0.5
1P
rivat
e C
redi
t to
GD
P
-.2 0 .2 .4 .6Natural Resource Exports
Private Credit|GDP pc Fitted values
0%
10%
20%
30%
40%
50%
60%
70%
80%
90%
100%
Other countries Resource-abundant
Liquid assets
Foreign assets
Credit to SOEs
Credit to government
Credit to private sector

35
Figure 3: External finance in working capital and natural resource dependence
Scatter plot of average external financing of working capital, across all surveyed firms in a country (vertical axis) and natural resource exports to GDP (horizontal axis)
Figure 4: External finance in fixed asset investment and natural resource dependence
Scatter plot of average external financing of fixed asset investment, across all surveyed firms in a country (vertical axis) and natural resource exports to GDP (horizontal axis)
1020
3040
5060
Ext
erna
l Fin
ance
for W
orki
ng C
apita
l
0 .1 .2 .3 .4 .5Natural Resource Exports
External finance in working capital Fitted values
020
4060
80E
xter
nal F
inan
ce fo
r Inv
estm
ent
0 .1 .2 .3 .4 .5Natural Resource Exports
External finance for investment Fitted values

36
Figure 5: Share of firms with credit and natural resource dependence
Scatter plot of share of firms with a loan in a country (vertical axis) and natural resource exports to GDP (horizontal axis).
Figure 6: Financing obstacles and natural resource dependence
Scatter plot of share of firms in a country that rates financing as severe obstacle to operation and growth of firm (vertical axis) and natural resource exports to GDP (horizontal axis)
0.2
.4.6
.8S
hare
of f
irms
with
loan
s
0 .1 .2 .3 .4 .5Natural Resource Exports
Share of firms with loans Fitted values
0.1
.2.3
.4.5
Sha
re o
f firm
s w
ith s
ever
e fin
anci
ng o
bsta
cles
0 .1 .2 .3 .4 .5Natural Resource Exports
Share - severe obstacle Fitted values