Tidal Flat Macrofaunal Communities and Their...
19
http://www.jstor.org Tidal Flat Macrofaunal Communities and Their Associated Environments in Estuaries of Southern California and Northern Baja California, Mexico Author(s): Theresa Sinicrope Talley, Paul K. Dayton, Silvia E. Ibarra-Obando Source: Estuaries, Vol. 23, No. 1, (Feb., 2000), pp. 97-114 Published by: Estuarine Research Federation Stable URL: http://www.jstor.org/stable/1353228 Accessed: 16/07/2008 01:13 Your use of the JSTOR archive indicates your acceptance of JSTOR's Terms and Conditions of Use, available at http://www.jstor.org/page/info/about/policies/terms.jsp. JSTOR's Terms and Conditions of Use provides, in part, that unless you have obtained prior permission, you may not download an entire issue of a journal or multiple copies of articles, and you may use content in the JSTOR archive only for your personal, non-commercial use. Please contact the publisher regarding any further use of this work. Publisher contact information may be obtained at http://www.jstor.org/action/showPublisher?publisherCode=estuarine. Each copy of any part of a JSTOR transmission must contain the same copyright notice that appears on the screen or printed page of such transmission. JSTOR is a not-for-profit organization founded in 1995 to build trusted digital archives for scholarship. We work with the scholarly community to preserve their work and the materials they rely upon, and to build a common research platform that promotes the discovery and use of these resources. For more information about JSTOR, please contact [email protected].
Transcript of Tidal Flat Macrofaunal Communities and Their...
http://www.jstor.org
Tidal Flat Macrofaunal Communities and Their Associated Environments in Estuaries ofSouthern California and Northern Baja California, MexicoAuthor(s): Theresa Sinicrope Talley, Paul K. Dayton, Silvia E. Ibarra-ObandoSource: Estuaries, Vol. 23, No. 1, (Feb., 2000), pp. 97-114Published by: Estuarine Research FederationStable URL: http://www.jstor.org/stable/1353228Accessed: 16/07/2008 01:13
Your use of the JSTOR archive indicates your acceptance of JSTOR's Terms and Conditions of Use, available at
http://www.jstor.org/page/info/about/policies/terms.jsp. JSTOR's Terms and Conditions of Use provides, in part, that unless
you have obtained prior permission, you may not download an entire issue of a journal or multiple copies of articles, and you
may use content in the JSTOR archive only for your personal, non-commercial use.
Please contact the publisher regarding any further use of this work. Publisher contact information may be obtained at
http://www.jstor.org/action/showPublisher?publisherCode=estuarine.
Each copy of any part of a JSTOR transmission must contain the same copyright notice that appears on the screen or printed
page of such transmission.
JSTOR is a not-for-profit organization founded in 1995 to build trusted digital archives for scholarship. We work with the
scholarly community to preserve their work and the materials they rely upon, and to build a common research platform that
promotes the discovery and use of these resources. For more information about JSTOR, please contact [email protected].

Estuaries Vol. 23, No. 1, p. 97-114 February 2000
Tidal Flat Macrofaunal Communities and Their Associated
Environments in Estuaries of Southern California and Northern
Baja California, Mexico
THERESA SINICROPE TALLEY1
PAUL K. DAYTON
Marine Life Research Group Scripps Institution of Oceanography La Jolla, California 92093-0201
SILVIA E. IBARRA-OBANDO Centro de Investigaci6n Cientifica y de Educaci6n Superior de Ensenada (CICESE) Km 107, Carretera Tijuana to Ensenada Baja California, Mexico
ABSTRACT: Several tidal flats in both Estero de Punta Banda and Bahia de San Quintin, Baja California, and one in Mission Bay, southern California, were sampled for macrofaunal properties (taxonomic composition, density, species richness, and functional groups for animals >0.3 mm) and associated environmental variables (sediment properties, salinity, plant belowground biomass, and cover of Zostera marina) in order to establish a benchmark data set for these areas. The grouping of macrofauna into higher taxonomic or functional groups for these comparisons reduced variability and revealed stronger relationships. Each estuary had a fairly distinct macrofaunal assemblage, with that of Estero de Punta Banda being different from Bahia de San Quintin and Mission Bay primarily due to dominance by a capitellid polychaete, lower proportions of surface deposit feeders, and higher proportions of fauna with a planktonic stage. The flats in Mission Bay and Bahia de San Quintin were dominated by peracarid crustaceans, oligochaetes and polychaetes and had higher proportions of direct developers and macrofauna with mobile adult stages than did Estero de Punta Banda. There was an overlap of the environmental characteristics among estuaries, with more variability of sediment and vegetation properties within than among estuaries. Within Bahia de San Quintin, there was an oceanic to back-bay distribution gradient of macrofauna that was similar to that found in estuaries in wetter climates, despite the lack of a salinity gradient in San Quintin. A decoupling of the benthos and the assumed anthropogenic stresses was observed with the degraded site, Mission Bay, being most similar to the relatively pristine Bahia de San Quintin. Selection of reference sites and sampling variables should be made cautiously because effects of disturbance factors on the benthos may be site-dependent, scale-dependent, or negligible.
Introduction
The coastal wetlands of California are an endan- gered habitat due to the loss of 90% of their orig- inal area, and the fragmentation and degradation of the remaining areas through urbanization (Schoenherr 1992). In comparison, the estuaries of northern Baja California show comparatively lit- tle effect of man, yet they face potential develop- ment and encroachment as has been experienced by the estuaries of southern California. An under- standing of faunal and environmental conditions is therefore especially important in these Mexican estuaries both for future within-estuary compari- sons and for their potential use as reference sites for the urbanized estuaries of southern California. This paper examines the macro-infaunal (animals
1 Corresponding author; e-mail: [email protected].
> 0.3 mm) communities on the intertidal mudflats in two estuaries in Baja California and one estuary in southern California in order to establish a benchmark data set of tidal flat macrofauna, ex- amine the environmental variables that are associ- ated with the macrofaunal assemblages, and con- sider the feasibility of making comparisons among these systems.
Benchmark, or point of reference, data sets al- low for comparisons to be made both within one system across time (e.g., before and after a distur- bance event) and between systems at any one time (e.g., disturbed versus pristine systems). Bench- mark data sets can be as simple as a list of the species present (Droege et al. 1998) or can include associated environmental information. Under- standing the relationships between the species pre- sent and their environment can give insight as to the processes structuring a system, and may allow
? 2000 Estuarine Research Federation 97
98 T. S. Talley et al.
basic predictions to be made as to how disturbanc- es or changes in the environment might affect spe- cies assemblages.
Estuaries in arid climates occur throughout the world (Adam 1990), yet information on the macro- infaunal communities and associated environmen- tal parameters of arid intertidal mud and sand flats, such as those examined in this study, is lim- ited. It is well documented that macro-infaunal communities play an important role in the transfer of energy and nutrients within and between ben- thic habitats (subtidal and higher intertidal areas such as salt marshes) and with the pelagic zone (e.g., Levinton 1982; Thompson et al. 1993; Kneib 1997 and references therein).
The tidal flat habitats examined in this study have enjoyed a certain amount of attention, al- though the studies generally focused on one taxon and, when faunal assemblages were examined, the fauna were larger than those sampled here (non- annelids : 1 mm, annelids ' 0.5 mm) and/or were located subtidally (except Levin et al. 1998). For example, there are numerous such studies of benthic fauna in Mission Bay in southern Califor- nia (MacDonald 1969a,b; Levin 1981, 1982a,b, 1984; Dexter 1983; Crooks 1996, 1998; Levin et al. 1998), and Estero de Punta Banda (De Ita-Gargallo 1982; Von Son-Gallut 1991; Wauman-Rojas 1998) and Bahia de San Quintin (Keen 1962; Reish 1963; Barnard 1964, 1970; MacDonald 1969a,b; Cook 1974; Bretado-Aguirre 1987; Cantfi-Martinez 1987; Griffis and Chavez 1988; Calderon-Aguilera 1992; Diaz-Castafieda and Rodriguez-Villanueva 1998) in northern Baja California. Our study focuses on smaller organisms (0.3 mm to approximately 1 mm in size) of intertidal macro-infaunal communities. Levin et al. (1998) found that a 0.3 mm mesh opening retains the smaller individuals of the same taxa that are found in screens with the larger, com- monly used apertures (0.5 and 1 mm), thereby al- lowing a more accurate estimate of the density and size distribution of each taxon.
Study Locations
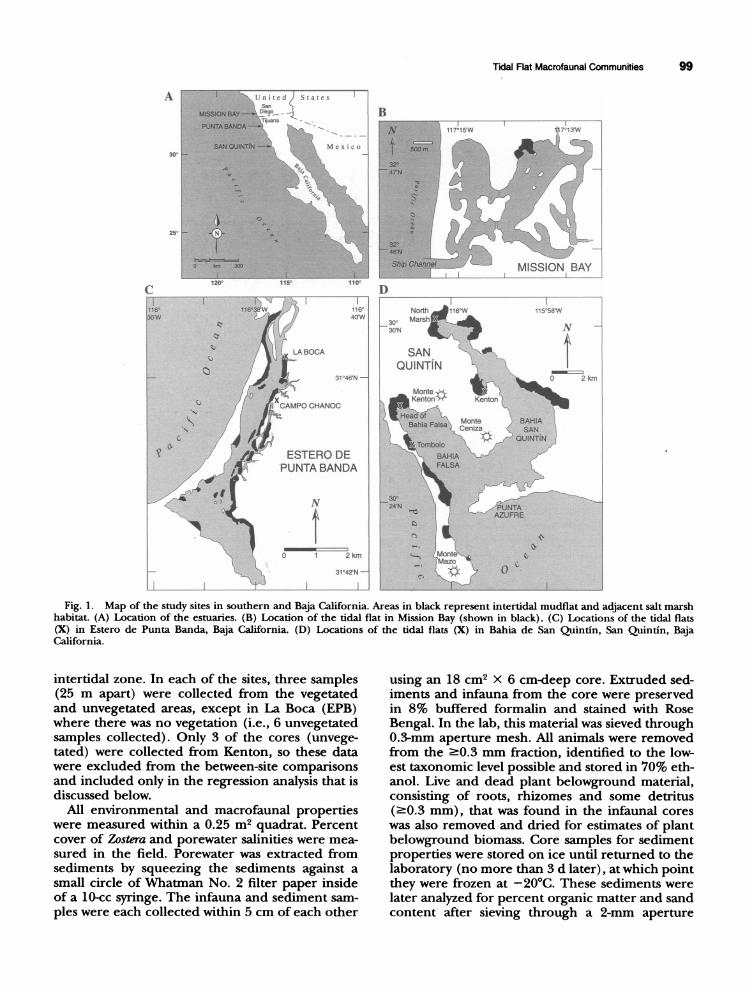
Tidal flats contiguous with salt marshes were sampled within 3 estuaries in southern California and Baja California (Fig. la). Mission Bay, located in southern California (32?47'N, 117?14'W) con- tains one 0.46-km2 salt marsh. Estero de Punta Ban- da (EPB) (31?46'N, 116?39'W), located just south of Ensenada about 100 km south of the Mexico/ United States border contains 3.3 km2 of salt marsh (Ibarra-Obando and Poumian-Tapia 1991). Two of the marsh areas were sampled in this study. We sampled four areas within Bahia de San Quintin (BSQ), which is located about 400 km south of the
border (30?27'N, 116?W) and contains 10.8 km2 of salt marsh.
Mission Bay is completely surrounded by intense urban development in contrast to the land adja- cent to the Mexican estuaries that includes small amounts of development and agriculture as well as undeveloped natural areas. Freshwater input into the tidal flat studied in Mission Bay is limited to seasonal storm inputs (mostly street runoff) that flow in a channel to the eastern side of the tidal flat. The flats in Mexico have no constant fresh- water inputs and experience only seasonal fresh- water storm inputs.
The tidal flat surveyed within Mission Bay is lo- cated roughly 5 km from the mouth of the estuary and is about 30-50 m wide from the salt marsh to the upper edge of Zostera marina (eelgrass, here- after referred to as Zostera) (Fig. lb). The two flats surveyed within Estero de Punta Banda are La Boca (2.8 km from the mouth) and Campo Chan- oc (4.6 km from the mouth) (Fig. lc). La Boca flat is an expansive unvegetated sand flat that leads gradually into the subtidal, while the flat at Campo Chanoc is a smaller flat (15-20 m from marsh edge to Zostera edge) that leads into a tidal creek. Four flats were studied in Bahia de San Quintin (Fig. Id), the first of which consists of a flat on the sand spit, or Tombolo, bordering the western side of the estuary. This site is closest to the mouth of the es- tuary (5.5 km from the mouth) and gradually slopes into the subtidal (about 60-75 m from marsh to Zostera edge). The tidal flat at the head of Bahia Falsa is 8.5 km from the mouth and is located at the head of the western side of the es- tuary. The mudflat in this area is expansive and stretches about 100-150 m before the Zostera zone begins. The tidal flat east of the volcano Kenton, in the eastern part of the estuary, is roughly 11 km from the mouth and gradually slopes into the sub- tidal (about 20-30 m from marsh to Zostera edge). The North Marsh is located at the head of the east- ern arm of the estuary, the farthest distance from the mouth of the estuary (16 km). This area is the least well flushed and has about 20-30 m of mud- flat between marsh and Zostera edge. It receives or- ganic inputs from the municipal development and agriculture along this side of the estuary.
Materials and Methods
Vegetated (Zostera) and unvegetated areas of the tidal flats were sampled for infauna and sediments within an elevation range of 0-1 m above mean lower low water (MLLW) from April 26, 1996 to August 10, 1996 (Table 1). The upper limit of Zos- tera occurs in this tidal range, and so patches of seagrass (5-30 cm in length, 25-50% cover), as well as unvegetated areas, are characteristic of this
Tidal Flat Macrofaunal Communities
I - - ' I' n i t n d i S t ) a e s
MISSION BAY - D ego ' Tijuana
PUNTA BANDA - r-
SAN QUINTfN-- , \ ico
0 .,.. k a
I I I
| ~ ~ ~ ~~~~~~~~~~~~ ,
115:
B i 117 15'W 117 13'W I
~476N | / . / Ship Channel MISSION BAY
Ship Channel ./ ̂ - M]SSION B.AY 110-
D 116 40'W
LA BOCA
31 46'N -
) CHANOC
ESTERO DE PUNTA BANDA
N
0 1 2km
?--~ 31 42'N-
: I!--; I I
North 116W 0' Marsh . _
115 58'W
SAN ?
" QUINTIN -
^. ^ '-^ 0 2 km
Monte . V 2 k_ ,.& Kenton'"' Kenton
Hadof- Monte '
BAHIA aa Falsa e Ceniza SAN
' -E "
? ^ QUINTiN
ITombolo *
.
.
;
*.; BAHIA '-/
' FALSA '
30? \ - j '".^ \j-- -
-24N j ' .-/PUNTA i : -"-~- SAZUFRE
-. i E 0 : Mont&e,-
Mazo :
;
;'^ - j / r- LV
Fig. 1. Map of the study sites in southern and Baja California. Areas in black represent intertidal mudflat and adjacent salt marsh habitat. (A) Location of the estuaries. (B) Location of the tidal flat in Mission Bay (shown in black). (C) Locations of the tidal flats (X) in Estero de Punta Banda, Baja California. (D) Locations of the tidal flats (X) in Bahia de San Quintin, San Quintin, Baja California.
intertidal zone. In each of the sites, three samples (25 m apart) were collected from the vegetated and unvegetated areas, except in La Boca (EPB) where there was no vegetation (i.e., 6 unvegetated samples collected). Only 3 of the cores (unvege- tated) were collected from Kenton, so these data were excluded from the between-site comparisons and included only in the regression analysis that is discussed below.
All environmental and macrofaunal properties were measured within a 0.25 m2 quadrat. Percent cover of Zostera and porewater salinities were mea- sured in the field. Porewater was extracted from sediments by squeezing the sediments against a small circle of Whatman No. 2 filter paper inside of a 10-cc syringe. The infauna and sediment sam- ples were each collected within 5 cm of each other
using an 18 cm2 X 6 cm-deep core. Extruded sed- iments and infauna from the core were preserved in 8% buffered formalin and stained with Rose Bengal. In the lab, this material was sieved through 0.3-mm aperture mesh. All animals were removed from the >0.3 mm fraction, identified to the low- est taxonomic level possible and stored in 70% eth- anol. Live and dead plant belowground material, consisting of roots, rhizomes and some detritus (-0.3 mm), that was found in the infaunal cores was also removed and dried for estimates of plant belowground biomass. Core samples for sediment properties were stored on ice until returned to the laboratory (no more than 3 d later), at which point they were frozen at -20?C. These sediments were later analyzed for percent organic matter and sand content after sieving through a 2-mm aperture
A
30
25
C
99
120:
116e 36'W
o,
I . .. . , .
3C \

100 T. S. Talley et al.
- t
, r- '
o o 0
V
1-
v
o 0
V 9 0 o o
C 0 C 00 r -
o - -~~~~~~~l
0 i I' I O
sr m .-
_ c
o
"t I , cn o - 1 . i!
(M4 (Mi
.0 01 ~ ~ ~ ~ 0
0- 0 0
n t- 00 ~ le
0 01
- . .0 6 0
GM CD 00
v 0 0
C,i~~~~~~.
-e -V
mesh to remove large pieces of plant material and shells. Percent organic matter content was ana- lyzed by combusting samples at 550?C overnight. Sediment particle size was measured by sieving wet, sediments digested with hydrogen peroxide through 63-,um aperture mesh (-63 ,m = sand), drying both the -63Rm and <63[xm fractions, and calculating percent sand content.
Statistical Analysis Comparisons of sediment properties (percent
organic matter and sand contents), vegetation (percent cover of Zostera and belowground bio- mass) and macrofaunal properties (species rich- ness [or number of species] per core, abundance of total macrofauna per core, proportional abun- dances of major taxonomic groups, and propor- tional abundances of functional groups) within and between the estuaries were made using anal- ysis of variance (ANOVA) and a posteriori Stu- dent's t-tests (JMP statistical software). Each mac- rofaunal species (or higher taxon) was assigned to functional groups (adult mobility, reproductive modes, and trophic groups) based on the litera- ture (Wirth and Stone 1963; Lasserre 1971; Fau- chald and Jumars 1979; Diaz 1980; Morris et al. 1980; Giere and Pfannkuche 1982; Levin 1984; Highsmith 1985; Levinton and Stewart 1988; Wil- son 1991; Holmquist 1994; Levinton et al. 1995; Crooks 1998). Species richness as a function of number of individuals was examined by calculating rarefaction curves (Hurlbert 1971). In cases where the taxa could not be identified to species (i.e., some oligochaetes and amphipods), families were used. This provided a conservative estimate of spe- cies richness and will be referred to as taxa rich- ness throughout this paper.
Differences and similarities in macrofaunal com- munities (abundances of each taxon) were exam- ined using non-metric multidimensional scaling (MDS; see Clarke and Green 1988; Clarke 1993) on Bray-Curtis similarity indices of transformed (log10(x + 1)) data. Analysis of similarity (ANO- SIM) was used to assess differences in community composition (taxa abundances and proportional abundances of functional groups) and environ- mental parameters (organic matter content, sand content, percent cover of Zostera, plant below- ground biomass) among sites. Taxa abundances and functional group proportional abundances were also used to determine the percent of simi- larity (SIMPER) within and among sites, and which taxa or groups were responsible for any differenc- es. ANOSIM, SIMPER, and MDS analyses were run using Primer software (Clarke and Warwick 1994). A stress value, which is a measure of how well the two-dimensional MDS plot represents the distances
0 O'
r.
C v r.
MI
0 o
.0 E 0
H
0 0 r.
Q 0
0
5 1
0 1 LI 1-
L'
_4z
Q.
_0 c > o
*0 ̂
V1
'c.
o
o V
Is'
- c
ct
"0 V0 .
_,-
X .
s0e
_ clo cl i. ^
0"0 c e l
Cl
V^ i- Cl
5 cl << 40^
Tidal Flat Macrofaunal Communities 101
I 30 A. Macrofaunal density 0
0M
13 c. 200-
13s10- b, 0 U Z. o 1 0
Ia, b I
P=-0.02, F5-43.1
T a,b.c U
Tr b.c U
Mission Bay La Boca Campo Chanoc Tombolo Bahia Falsa North Marsh
Eatero de Punta Banda San Quintin
25 - B. Taxa richness per core
20-
15 -
10-
P=0.003, F5,344.4 T a 0 Ta
T6a b I
Tb lb 0
0
Mission Bay La Boca Campo Chanoc Tombolo Bahia Falsa North Marsh Eatero de Punta Banda San Quintin
C. Taxa richness per sample size
0-
4.
0 0 .0
0.
LI
-II- Mission Bay
Eatero de Punta Banda .....La Boca
. ..0--.. Camnpo Chanoc
San Quintin -a-- Tombolo
p Bahia Falsa
.....0....North Marsh
0 500 1000 1500 Samnple size (number of individuals)
2000
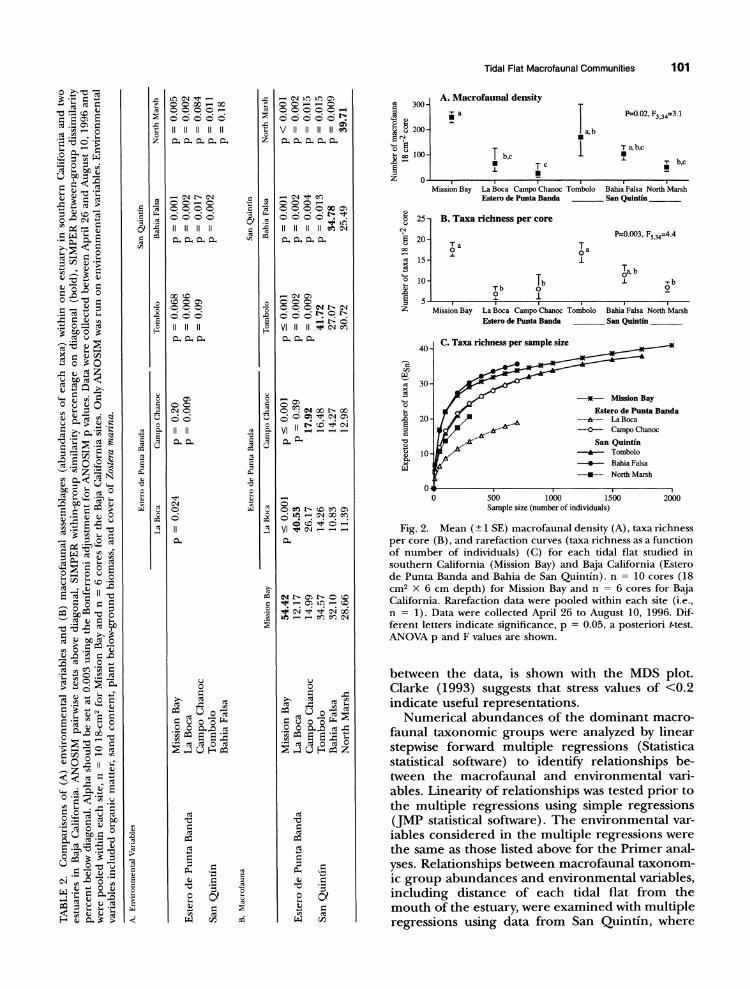
Fig. 2. Mean (I SE) macrofaunal density (A), taxa richness per core (B), and rarefaction curves (taxa richness as a function of number of individuals) (C) for each tidal flat studied in southern California (Mission Bay) and Baja California (Estero de Punta Banda and Bahia de San Quintin). n = 10 cores (18 cm2 XK 6 cm depth) for Mission Bay and n =6 cores for Baja California. Rarefaction data were pooled within each site (i.e., n = 1). Data were collected April 26 to August 10, 1996. Dif- ferent letters indicate significance, p =0.05, a posteriori t-testL ANOVA p and F values are shown.
between the data, is shown with the MDS plot. Clarke (1993) suggests that stress values of <0.2 indicate useful representations.
Numerical abundances of the dominant macro- faunal taxonomic groups were analyzed by linear stepwise forward multiple regressions (Statistica statistical software) to identify relationships be- tween the macrofaunal and environmental vari- ables. Linearity of relationships was tested prior to the multiple regressions using simple regressions (JMP statistical software). The environmental var- iables considered in the multiple regressions were the same as those listed above for the Primer anal- yses. Relationships between macrofaunal taxonom- ic group abundances and environmental variables, including distance of each tidal flat from the mouth of the estuary, were examined with multiple regressions using data from San Quintin, where
.0w
0
0)C)00 -40- 66666
> (6
I II II I
.a
0 z
0.
0=
Os' 0
,-q V' t- 0C1 00o -0C
0 000C 6 6 66 II 11 II II
0 0
.0 B 0
00 '.0 '. 000' 000) C 66 6 II II 1I
2
0
.0
B- 0.
z2
0
.0
.0
H
o'. 0 0 Ost 0) 006
1I II 0.40.
000O 00 C
000) C 0 00C)
liii I i~
000) 00 e. - C.4
VI I I - O:.
VI --- c
0) W~ t 0 t-0
0 '.0 m tC 0-~
VI 't ---
t4-0~i)- C'.0
0l -i0 Bn o .B C
cis B
0 0 r.
0 0. B
0
-I
CZ
0
0.
CL.
bo B
B 00
B 4 .2 t
V BcC'
ol B z
-a . .
ob c) C's
z t 2 cl
V d b a, B,
C' ub r.2 C'
C'S .
0 0 r.
0 0. B
0
-I
0.
~0
LIM 0I 0
0)
B 0. 02
0
B
Q> o m
m 2 2 BBOB
'A
0
.0 0Z
CZ
LI
Bl -e
"0.
0 Vd
0
B
Bz 2 B - B
00
I I I
3 9 I I I I I

TABLE 3. Mean (?1 SE, shown next to mean) number of individuals per 18 cm2 X 6 cm depth of each infaunal taxon collected within Mission Bay, southern California, 0 and Estero Punta Banda and San Quintin, Baja California. Data were collected between April and August 1996. n = 10 cores in Mission Bay and n = 6 cores in the other sites. To calculate numbers per m2, multiply values shown by 553.
Estero de Punta Banda Bahia de San Quintin
Campo Head of East of North Mean (? 1 SE) Taxa Mission Bay La Boca Chanoc Tombolo Bahia Falsa Kenton Marsh
Annelida Oligochaeta
Tubificidae (Limnodriloides barnardi and
Tectidrilus diversus) Thalassodriloides belli Tubificoides brownae
Naididae Paranais litoralis
Enchytraeidae Enchytraeus sp.
Polychaeta Spionidae
Polydora cornuta (formerly P ligni) Prinospio p. heterobranchia Pseudopolydora paucibranchiata Streblospio benedicti Spionidae A
Capitellidae Capitella sp. Mediomastus spp. Mediomastus ambiseta Capitellidae A Capitellidae B
Syllidae Brania spp. Exgone lourei
Phyllodocidae Sabellidae
Fabricia limnicola Fabricia sp. A Megalomma pigmentum
Cirratilidae Cirraformia spirabranchia
Dorvilleidae Dorvilleia articulata
Lumbrinaridae Orbinidae Nereidae Paraonidae
Paraonis spp. Paraonella platybranchia
Hesionidae Hesionella mccullochae
49.5 (19.5) 0 25.6 (8)
0.1 (0.1)
0
0 0 0.9 (0.3) 0 0
6.8 (1.1) 1.8 (1.4) 0 0.1 (0.1) 0.3 (0.3)
3.1 (1.1) 14.4 (4.8) 0
0 0.1 (0.1) 0 0.1 (0.1) 0
0 0.1 (0.1) 2.7 (1.1)
12.3 (5.8)
0 0 0.3 (0.3) 0
0 0 0
0 0 0.2 (0.2)
0 0
0 0
0 0.2 (0.2) 5.8 (3.8) 0 0
0.2 (0.2) 0
92.3 (30) 0 0
0.5 (0.3) 0 0
0 0 0 0 0
0 0.2 (0.2) 0
10.8 (4.8)
0.3 (0.2) 0.2 (0.2) 0 0.3 (0.3)
0 1.2 (0.7) 0 0.3 (0.3) 0.7 (0.4)
0.7 (0.5) 0
71.5 (47.7) 0 0
0 5.5 (4.9) 0.2 (0.2)
0 0.2 (0.2) 0 0.2 (0.2) 0
5.8 (5.8) 1.3 (0.8) 1.3 (1.1) 1.2 (0.8)
0 0 0.2 (0.2) 0
36.8 (30.5) 0
18.3 (9.7)
0.2 (0.2)
0
0.2 (0.2) 0.7 (0.3) 1.8 (0.5) 0 0
0.8 (0.4) 1.5 (1.5) 3 (1.4) 0.3 (0.3) 0
55 (21.2) 64.7 (34.1) 0.2 (0.2)
0 2.8 (1.4) 0.2 (0.2) 0 0.2 (0.2)
0 0 4.8 (2) 1.2 (0.8)
0.3 (0.3) 0 0 0
2.3 (1) 1.3 (1.3) 4.5 (2.8)
3.8 (2.2)
29 (27.5) 0 7 (7)
2 (1.5)
13.8 (8.6) 0
4.2 (3.1) 0.2 (0.2) 1.3 (0.9) 0 0
11.3 (4.3) 0.5 (0.5) 0.5 (0.5) 3.7 (3.7) 0
2.7 (2.2) 9.5 (7.3) 0
0 0 0 0 0.2 (0.2)
0 0 0.3 (0.3) 0.2 (0.2)
0 0 0 0
0 0 0 0 0
0.7 (0.3) 0 0 0 0
0 0 0
0 0 0 0 0
0 0 0.3 (0.3) 0
0 0 0 0
=
CD
0)
u l< CD SI)
9.8 (5.2) 2 (1.4)
32.2 (20)
0.2 (0.2)
0
0 0 0 0.2 (0.2) 0
0.5 (0.2) 0 0 0.2 (0.2) 0
3.7 (1.7) 1.5 (1.5) 0
4.3 (3.7) 0.3 (0.3) 0 0 0.2 (0.2)
0 0 1.2 (0.7) 0
0 0 0 0
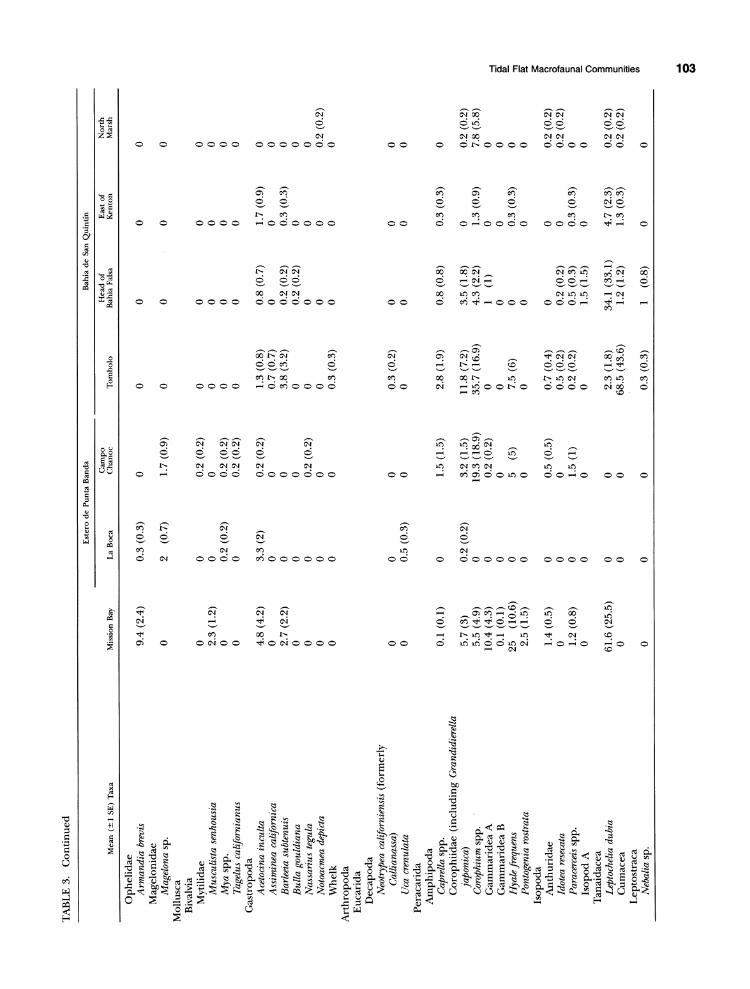
TABLE 3. Continued
Estero de Punta Banda Bahia de San Quintin
Campo Head of East of North Mean ( I1 SE) Taxa Mission Bay La Boca Chanoc Tombolo Bahia Falsa Kenton Marsh
Ophelidae Armandia brevis
Magelonidae Magelona sp.
Mollusca Bivalvia
Mytilidae Musculista senhousia Mya spp. Tagelus californianus
Gastropoda Acetocina inculta Assiminea californica Barleeia subtenuis Bulla gouldiana Nassarius tegula Notoacmea depicta Whelk
Arthropoda Eucarida
Decapoda Neotrypea californiensis (formerly
Callianassa) Uca crenulata
Peracarida Amphipoda
Caprella spp. Corophiidae (including Grandidierella
japonica) Corophium spp. Gammaridea A Gammaridea B Hyale frequens Pontogenia rostrata
Isopoda Anthuridae Idotea resecata Paracerceis spp. Isopod A
Tanaidacea Leptochelia dubia Cumacea
Leptostraca Nebalia sp.
9.4 (2.4)
0
0 2.3 (1.2) 0 0
4.8 (4.2) 0 2.7 (2.2) 0 0 0 0
0 0
0.1 (0.1)
5.7 (3) 5.5 (4.9)
10.4 (4.3) 0.1 (0.1)
25 (10.6) 2.5 (1.5)
1.4 (0.5) 0 1.2 (0.8) 0
0.3 (0.3)
2 (0.7)
0 0 0.2 (0.2) 0
3.3 (2) 0 0 0 0 0 0
0 0.5 (0.3)
0
0.2 (0.2) 0 0 0 0 0
0 0 0 0
61.6 (25.5) 0 0 0
0 0
0 0
1.7 (0.9)
0.2 (0.2) 0 0.2 (0.2) 0.2 (0.2)
0.2 (0.2) 0 0 0 0.2 (0.2) 0 0
0 0
1.5 (1.5)
3.2 (1.5) 19.3 (18.9) 0.2 (0.2) 0 5 (5) 0
0.5 (0.5) 0 1.5 (1) 0
0 0
0
0
0
0
0 0 0 0
1.3 (0.8) 0.7 (0.7) 3.8 (3.2) 0 0 0 0.3 (0.3)
0.3 (0.2) 0
2.8 (1.9)
11.8 (7.2) 35.7 (16.9) 0 0 7.5 (6) 0
0.7 (0.4) 0.5 (0.2) 0.2 (0.2) 0
2.3 (1.8) 68.5 (43.6)
0.3 (0.3)
0
0
0 0 0 0
0 0 0 0
0.8 (0.7) 0 0.2 (0.2) 0.2 (0.2) 0 0 0
0 0
0
0
0 0 0 0
1.7 (0.9) 0 0.3 (0.3) 0 0 0 0
0 0
0.8 (0.8)
3.5 (1.8) 4.3 (2.2) 1 (1) 0 0 0
0 0.2 (0.2) 0.5 (0.3) 1.5 (1.5)
0 0 0 0 0 0.2 (0.2) 0
0 0
0.3 (0.3)
0 1.3 (0.9) 0 0 0.3 (0.3) 0
0 0 0.3 (0.3) 0
34.1 (33.1) 4.7 (2.3) 1.2 (1.2) 1.3 (0.3)
1 (0.8) 0
0
0.2 (0.2) 7.8 (5.8) 0
- 0 ^ 0 n 0
0.2 (0.2) O ,0
0
0.2 (0.2) 2 0.2 (0.2) . 0 D
0
0
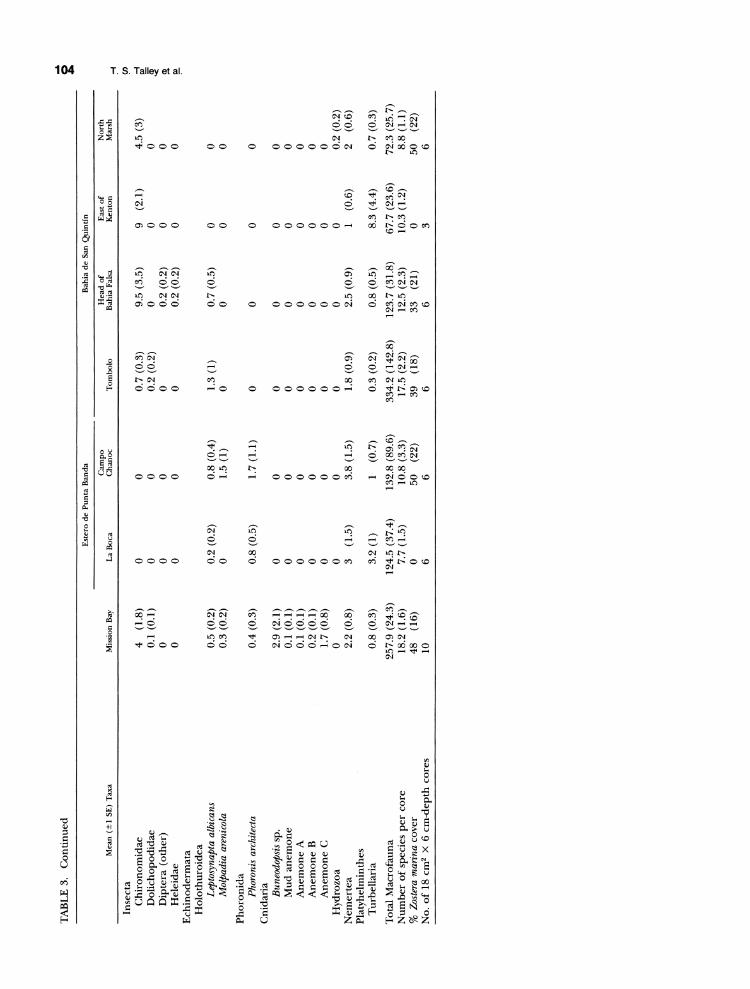
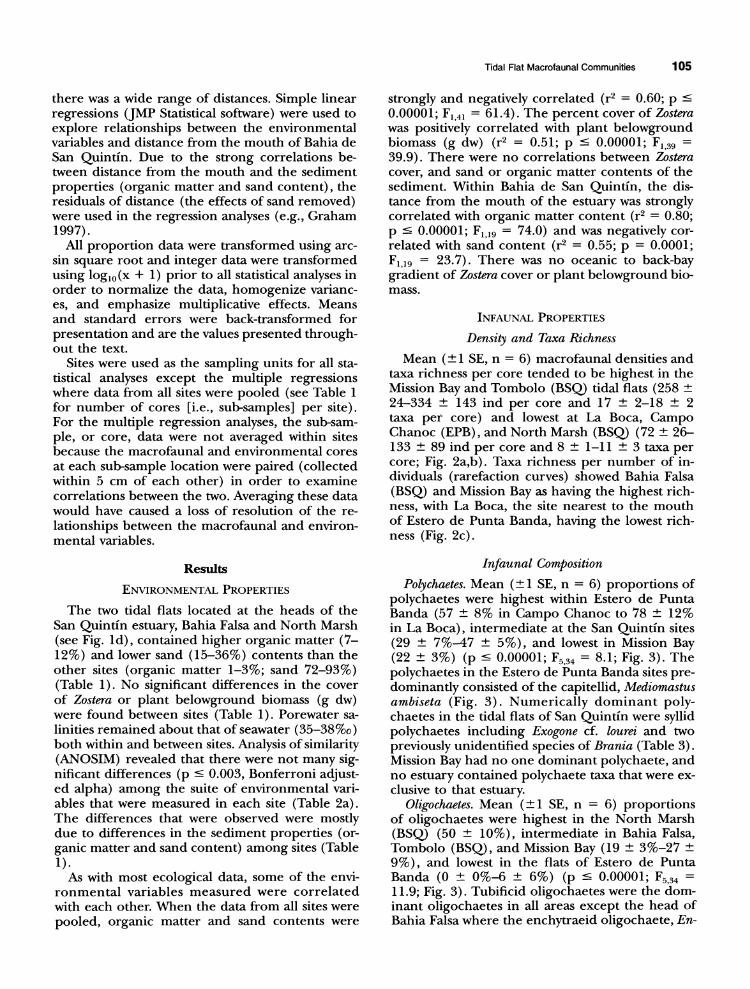
TABLE 3. Continued 09
Estero de Punta Banda Bahia de San Quintin
Campo Head of East of North
Insecta Chironomidae 4 (1.8) 0 0 0.7 (0.3) 9.5 (3.5) 9 (2.1) 4.5 (3) Dolichopodidae 0.1I (0. 1) 0 0 0.2 (0.2) 0 0 0 Diptera (other) 0 0 0 0 0.2 (0.2) 0 0 Heleidae 0 0 0 0 0.2 (0.2) 0 0
Echinodermata Holothuroidea
Leptosynapta albi cans 0.5 (0.2) 0.2 (0.2) 0.8 (0.4) 1.3 (1) 0.7 (0.5) 0 0 Molpadia arenic'ola 0.3 (0.2) 0 1.5 (1) 0 0 0 0
Phoronida Phoronis architecta 0.4 (0.3) 0.8 (0.5) 1.7 (1.1) 0 0 0 0
Cnidaria Buneodopsis sp. 2.9 (2.1) 0 0 0 0 0 0 Mud anemone 0.1I (0. 1) 0 0 0 0 0 0 Anemone A 0.1I(0. 1) 0 0 0 0 0 0 Anemone B 0.2 (0.1) 0 0 0 0 0 0 Anemone C 1.7(0.8) 0 (1 0 C) 0 C)
Hydrozoa 0 0 0 0 0 0 0.2 (0.2) Nemertea 2.2 (0.8) 3 (1.5) 3.8 (1.5) 1.8 (0.9) 2.5 (0.9) 1 (0.6) 2 (0.6) Platyhelminthes
Turbellaria 0.8 (0.3) 3.2 (1) 1 (0.7) 0.3 (0.2) 0.8 (0.5) 8.3 (4.4) 0.7 (0.3)
Total Macrofauna 257.9 (24.3) 124.5 (37.4) 132.8 (89.6) 334.2 (142.8) 123.7 (31.8) 67.7 (23.6) 72.3 (25.7) Number of species per core 18.2 (1.6) 7.7 (1.5) 10.8 (3.3) 1 7.5 (2.2) 12.5 (2.3) 10.3 (1.2) 8.8 (1.1) % Zostera marina cover 48 (16) 0 50 (22) 39 (18) 33 (21) 0 50 (22) No. of 18 cm2 X 6 cm-depth cores 10 6 6 6 6 3 6
Tidal Flat Macrofaunal Communities 105
there was a wide range of distances. Simple linear regressions (JMP Statistical software) were used to explore relationships between the environmental variables and distance from the mouth of Bahia de San Quintin. Due to the strong correlations be- tween distance from the mouth and the sediment properties (organic matter and sand content), the residuals of distance (the effects of sand removed) were used in the regression analyses (e.g., Graham 1997).
All proportion data were transformed using arc- sin square root and integer data were transformed using log10(x + 1) prior to all statistical analyses in order to normalize the data, homogenize varianc- es, and emphasize multiplicative effects. Means and standard errors were back-transformed for presentation and are the values presented through- out the text.
Sites were used as the sampling units for all sta- tistical analyses except the multiple regressions where data from all sites were pooled (see Table 1 for number of cores [i.e., sub-samples] per site). For the multiple regression analyses, the sub-sam- ple, or core, data were not averaged within sites because the macrofaunal and environmental cores at each sub-sample location were paired (collected within 5 cm of each other) in order to examine correlations between the two. Averaging these data would have caused a loss of resolution of the re- lationships between the macrofaunal and environ- mental variables.
Results
ENVIRONMENTAL PROPERTIES
The two tidal flats located at the heads of the San Quintin estuary, Bahia Falsa and North Marsh (see Fig. ld), contained higher organic matter (7- 12%) and lower sand (15-36%) contents than the other sites (organic matter 1-3%; sand 72-93%) (Table 1). No significant differences in the cover of Zostera or plant belowground biomass (g dw) were found between sites (Table 1). Porewater sa- linities remained about that of seawater (35-38%o) both within and between sites. Analysis of similarity (ANOSIM) revealed that there were not many sig- nificant differences (p - 0.003, Bonferroni adjust- ed alpha) among the suite of environmental vari- ables that were measured in each site (Table 2a). The differences that were observed were mostly due to differences in the sediment properties (or- ganic matter and sand content) among sites (Table 1).
As with most ecological data, some of the envi- ronmental variables measured were correlated with each other. When the data from all sites were pooled, organic matter and sand contents were
strongly and negatively correlated (r2 = 0.60; p - 0.00001; F1,41 = 61.4). The percent cover of Zostera was positively correlated with plant belowground biomass (g dw) (r2 = 0.51; p ' 0.00001; F,39 =
39.9). There were no correlations between Zostera cover, and sand or organic matter contents of the sediment. Within Bahia de San Quintin, the dis- tance from the mouth of the estuary was strongly correlated with organic matter content (r2 = 0.80; p - 0.00001; F1l9 = 74.0) and was negatively cor- related with sand content (r2 = 0.55; p = 0.0001; F1,19 = 23.7). There was no oceanic to back-bay gradient of Zostera cover or plant belowground bio- mass.
INFAUNAL PROPERTIES
Density and Taxa Richness
Mean (? 1 SE, n = 6) macrofaunal densities and taxa richness per core tended to be highest in the Mission Bay and Tombolo (BSQ) tidal flats (258 ? 24-334 ? 143 ind per core and 17 ? 2-18 ? 2 taxa per core) and lowest at La Boca, Campo Chanoc (EPB), and North Marsh (BSQ) (72 ? 26- 133 ? 89 ind per core and 8 ? 1-11 ? 3 taxa per core; Fig. 2a,b). Taxa richness per number of in- dividuals (rarefaction curves) showed Bahia Falsa (BSQ) and Mission Bay as having the highest rich- ness, with La Boca, the site nearest to the mouth of Estero de Punta Banda, having the lowest rich- ness (Fig. 2c).
Infaunal Composition
Polychaetes. Mean (? 1 SE, n = 6) proportions of polychaetes were highest within Estero de Punta Banda (57 ? 8% in Campo Chanoc to 78 ? 12% in La Boca), intermediate at the San Quintin sites (29 ? 7%-47 ? 5%), and lowest in Mission Bay (22 ? 3%) (p ' 0.00001; F534 = 8.1; Fig. 3). The polychaetes in the Estero de Punta Banda sites pre- dominantly consisted of the capitellid, Mediomastus ambiseta (Fig. 3). Numerically dominant poly- chaetes in the tidal flats of San Quintin were syllid polychaetes including Exogone cf. lourei and two previously unidentified species of Brania (Table 3). Mission Bay had no one dominant polychaete, and no estuary contained polychaete taxa that were ex- clusive to that estuary.
Oligochaetes. Mean (? 1 SE, n = 6) proportions of oligochaetes were highest in the North Marsh (BSQ) (50 ? 10%), intermediate in Bahia Falsa, Tombolo (BSQ), and Mission Bay (19 ? 3%-27 + 9%), and lowest in the flats of Estero de Punta Banda (0 ? 0%-6 ? 6%) (p ' 0.00001; F5,34 =
11.9; Fig. 3). Tubificid oligochaetes were the dom- inant oligochaetes in all areas except the head of Bahia Falsa where the enchytraeid oligochaete, En-
106 T. S. Talley et al.
* Polychaetes S Molluscs E3 Insects U Other * Oliwochaetoe [ Crustaceans E: Nemerteans & Turbellarians
ii _10('}~ ;.'- I OCI r .
" .
-
: , 1 I
.- f' I
,~: ''
I !-
Mission B I B oca Campo Chanc.l: Torrnbolo Bahia Falsa North Mar.i E>Lcr,, JLd Punra HBiLndL __ Balhi:, . SnI QutiIrti __
IncreaLsed distnce froril milotith
Fig. 3. Mean percent composition of the higher macrofau- nal taxonomic groups found in the tidal flats of Mission Bay, southern California and in Estero de Punta Banda and Bahia de San Quintin, Baja California. n = 10 cores (18 cm2 X 6 cm depth) in Mission Bay and n = 6 cores in Baja California. Data were collected April 26 to August 10, 1996.
chytraeus sp., was numerically dominant (Fig. 3, Ta- ble 3).
Crustaceans. Mean (?1 SE, n = 6) crustacean densities were proportionally highest in Mission Bay (48 ? 6%) and lowest in La Boca, Campo Chanoc (EPB), and North Marsh (BSQ) (7 + 5%- 10 ? 5%) (p = 0.001; F5,34 = 5.2; Fig. 3). In all sites except La Boca, all or most of the crustaceans were peracarid crustaceans (Table 3). The tanaid, Leptochelia dubia, was numerically the most com- mon in Mission Bay and Bahia Falsa. Amphipods from the suborder Gammaridea were also com- mon in Mission Bay. Corophiid amphipods (in- cluding Corophium spp. and the exotic Grandidierel- la japonica) comprised a small proportion of the total macrofauna in all sites. Another peracarid found in low numbers (0.3-1 ind per core) on the flats of the western side of San Quintin was an un- described species of leptostracan, Nebalia sp. Ne- balia was found only in the Zostera-vegetated sam- ples of the Head of Bahia Falsa and the Tombolo. In La Boca, the numerically dominant crustacean was the decapod, Uca crenulata (fiddler crab).
Insects. Mean (? 1 SE, n = 6) proportional abun- dance of insects (both larvae and adults) was sig- nificantly highest at Bahia Falsa (BSQ) (11 ? 3%), intermediate at North Marsh, Tombolo (BSQ) and Mission Bay (0.6 ? 0.5%-3 + 2%) and none were found on the flats of Estero de Punta Banda (p < 0.00001; F534 = 8.3; Fig. 3). Patterns of insect den- sity were similar to that of their proportional abun- dances (Fig. 3; Table 3). Chironomid larvae were the numerically dominant insect type (Table 3).
Nemerteans and Turbellarians. Mean (? 1 SE, n = 6) proportions of nemerteans and turbellarians were highest in the flats of Estero de Punta Banda (13 + 8%-15 + 7%), intermediate in the North Marsh (BSQ) (6 ? 2%) and lowest in the Tombolo
and Bahia Falsa flats (BSQ) and in Mission Bay (1 + 0.4%-2 ? 0.6%) (p = 0.01; F5,34
= 3.3; Fig. 3). Molluscs. Proportional abundances (mean ? 1
SE, n = 6) of molluscs did not differ significantly between sites (0.2 ? 0.2%-9 + 6%) (p = 0.20; F5,34 = 1.6; Fig. 3). Small densities of bivalves (0.2 ? 0.2 ind per core) were found at the Estero de Punta Banda sites (Table 3). The exotic Japanese mussel, Musculista senhousia, was only found in Mission Bay (2 ? 1 ind per core). No bivalves were collected in these 18-cm2 cores from the flats in San Quintin. The opisthobranch Acteocina inculta was found in all flats (0.2-5 ind per core) except the North Marsh (BSQ). Barleeia subtenuis (Prosobranchia) was not found in Estero de Punta Banda, but was present in Mission Bay and all flats in San Quintin except North Marsh. The Tombolo had 4 different taxa of gastropods, Bahia Falsa had 3 taxa and the other sites had 1 or 2 taxa. The seagrass limpet, Notoacmea depicta, was found only on the seagrass in the North Marsh.
Other Taxa. The mean (?+1 SE, n = 6) propor- tional abundance of the category of other taxa did not differ between sites (p = 0.18; F5,34 = 1.6; Fig. 3). Holothuroids were found in all estuaries; pho- ronids were rare in Mission Bay and Estero de Pun- ta Banda, and lacking from the samples from San Quintin. Anemones were only found in Mission Bay, including the invasive, exotic anemone, Bun- odeopsis sp. (Table 3).
Functional Groups Trophic Groups. Proportions of surface deposit
feeders, the dominant trophic group, differed among estuaries (ANOVA, p = 0.01, F533 = 3.4) with generally higher proportions in Mission and San Quintin Bays (51-68%) than in Estero de Pun- ta Banda (35-40%) (Fig. 4a). Proportional abun- dances of subsurface deposit feeders, the second most dominant trophic group, did not differ among sites (26-39%) (Fig. 4a) (ANOVA, p = 0.64). Proportions of suspension feeders were higher in Mission Bay and Campo Chanoc (EPB) (10-11%) than in the Bahia de San Quintin sites (0-2%) (Fig. 4a) (ANOVA, p = 0.008, F5 33= 3.8). The sites in Estero de Punta Banda contained high- er proportions (20-21%) of carnivores than in Mis- sion Bay, or Tombolo and Bahia Falsa (BSQ) (5- 7%) (Fig. 4a) (ANOVA, p = 0.005, F533 = 4.2).
Life-history Strategies. Proportions of direct devel- opers were significantly higher (64-77%) (ANO- VA, p < 0.00001, F5,33 = 45.0), while the propor- tions of taxa with a planktonic stage were signifi- cantly lower (23-36%) (ANOVA, p - 0.00001, F5,33 = 45.0) in Mission Bay and Bahia de San Quintin than in Estero de Punta Banda (direct developer 3-28%; planktonic stage 72-97%) (Fig. 4b). The
ir,- I
Ij--------- - - 1I v
I _ = -
Tidal Flat Macrofaunal Communities 107
Mission Bay Estero de Punta Banda Bahia de San Quintfn La Boca Campo Chanoc Tombolo Bahia Falsa North Marsh
A. Trophic groups
o Surface deposit feeder [E Suspension feeder Subsurface deposit feeder I Carnivore
B. Reproductive groups
Me e 0 cee Mobile adults: 30% 0.8% 8 % 18% 37% 21%
3 Plmaktonic
* Direct developer
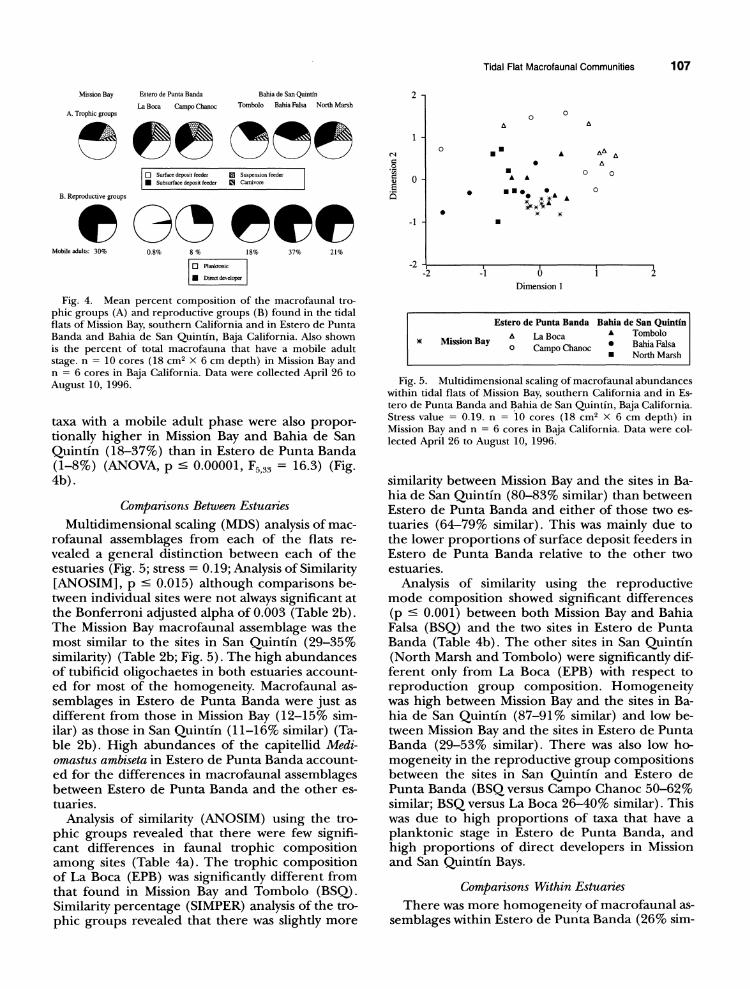
Fig. 4. Mean percent composition of the macrofaunal tro- phic groups (A) and reproductive groups (B) found in the tidal flats of Mission Bay, southern California and in Estero de Punta Banda and Bahia de San Quintin, Baja California. Also shown is the percent of total macrofauna that have a mobile adult stage. n = 10 cores (18 cm2 X 6 cm depth) in Mission Bay and n = 6 cores in Baja California. Data were collected April 26 to August 10, 1996.
taxa with a mobile adult phase were also propor- tionally higher in Mission Bay and Bahia de San Quintin (18-37%) than in Estero de Punta Banda (1-8%) (ANOVA, p < 0.00001, F5,33 = 16.3) (Fig. 4b).
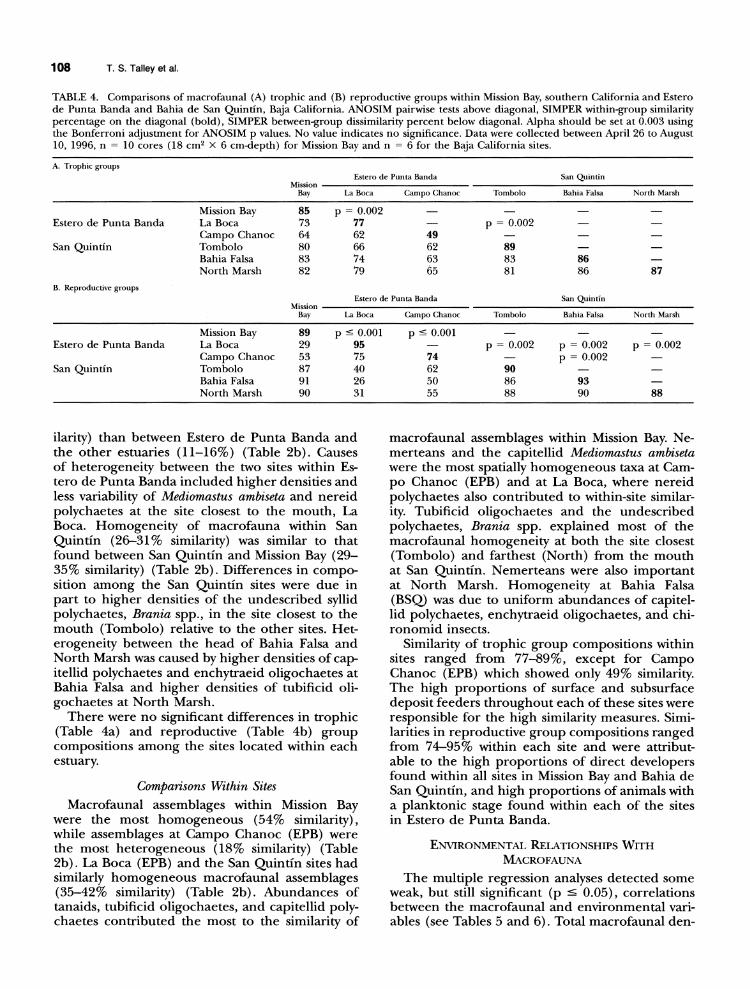
Comparisons Between Estuaries Multidimensional scaling (MDS) analysis of mac-
rofaunal assemblages from each of the flats re- vealed a general distinction between each of the estuaries (Fig. 5; stress = 0.19; Analysis of Similarity [ANOSIM], p < 0.015) although comparisons be- tween individual sites were not always significant at the Bonferroni adjusted alpha of 0.003 (Table 2b). The Mission Bay macrofaunal assemblage was the most similar to the sites in San Quintin (29-35% similarity) (Table 2b; Fig. 5). The high abundances of tubificid oligochaetes in both estuaries account- ed for most of the homogeneity. Macrofaunal as- semblages in Estero de Punta Banda were just as different from those in Mission Bay (12-15% sim- ilar) as those in San Quintin (11-16% similar) (Ta- ble 2b). High abundances of the capitellid Medi- omastus ambiseta in Estero de Punta Banda account- ed for the differences in macrofaunal assemblages between Estero de Punta Banda and the other es- tuaries.
Analysis of similarity (ANOSIM) using the tro- phic groups revealed that there were few signifi- cant differences in faunal trophic composition among sites (Table 4a). The trophic composition of La Boca (EPB) was significantly different from that found in Mission Bay and Tombolo (BSQ). Similarity percentage (SIMPER) analysis of the tro- phic groups revealed that there was slightly more
2 -
1-
0 cn . 0 -
-1
-2
A
U
0
0
0
A
* - A A
* *EMO * A
X X
A
AA A A
0 0
0
.
-2 -1 0 Dimension 1
Estero de Punta Banda Bahia de San Quintin a La Boca A Tombolo
X Mission Bay anoc Bahia Falsa * North Marsh
Fig. 5. Multidimensional scaling of macrofaunal abundances within tidal flats of Mission Bay, southern California and in Es- tero de Punta Banda and Bahia de San Quintin, Baja California. Stress value = 0.19. n = 10 cores (18 cm2 X 6 cm depth) in Mission Bay and n = 6 cores in Baja California. Data were col- lected April 26 to August 10, 1996.
similarity between Mission Bay and the sites in Ba- hia de San Quintin (80-83% similar) than between Estero de Punta Banda and either of those two es- tuaries (64-79% similar). This was mainly due to the lower proportions of surface deposit feeders in Estero de Punta Banda relative to the other two estuaries.
Analysis of similarity using the reproductive mode composition showed significant differences (p - 0.001) between both Mission Bay and Bahia Falsa (BSQ) and the two sites in Estero de Punta Banda (Table 4b). The other sites in San Quintin (North Marsh and Tombolo) were significantly dif- ferent only from La Boca (EPB) with respect to reproduction group composition. Homogeneity was high between Mission Bay and the sites in Ba- hia de San Quintin (87-91% similar) and low be- tween Mission Bay and the sites in Estero de Punta Banda (29-53% similar). There was also low ho- mogeneity in the reproductive group compositions between the sites in San Quintin and Estero de Punta Banda (BSQ versus Campo Chanoc 50-62% similar; BSQ versus La Boca 26-40% similar). This was due to high proportions of taxa that have a planktonic stage in Estero de Punta Banda, and high proportions of direct developers in Mission and San Quintin Bays.
Comparisons Within Estuaries There was more homogeneity of macrofaunal as-
semblages within Estero de Punta Banda (26% sim-
I I I I
i
108 T. S. Talley et al.
TABLE 4. Comparisons of macrofaunal (A) trophic and (B) reproductive groups within Mission Bay, southern California and Estero de Punta Banda and Bahia de San Quintin, Baja California. ANOSIM pairwise tests above diagonal, SIMPER within-group similarity percentage on the diagonal (bold), SIMPER between-group dissimilarity percent below diagonal. Alpha should be set at 0.003 using the Bonferroni adjustment for ANOSIM p values. No value indicates no significance. Data were collected between April 26 to August 10, 1996, n = 10 cores (18 cm2 X 6 cm-depth) for Mission Bay and n = 6 for the Baja California sites.
A. Trophic groups Estero de Punta Banda San Quintin
Mission Bay La Boca Campo Chanoc Tombolo Bahia Falsa North Marsh
Mission Bay 85 p = 0.002 - - - - Estero de Punta Banda La Boca 73 77 - p = 0.002 -
Campo Chanoc 64 62 49 - - San Quintin Tombolo 80 66 62 89 -
Bahia Falsa 83 74 63 83 86 North Marsh 82 79 65 81 86 87
B. Reproductive groups Estero de Punta Banda San Quintin
Mission Bay La Boca Campo Chanoc Tombolo Bahia Falsa North Marsh
Mission Bay 89 p c 0.001 p < 0.001 - Estero de Punta Banda La Boca 29 95 - p = 0.002 p = 0.002 p - 0.002
Campo Chanoc 53 75 74 - p = 0.002 San Quintin Tombolo 87 40 62 90
Bahia Falsa 91 26 50 86 93 North Marsh 90 31 55 88 90 88
ilarity) than between Estero de Punta Banda and the other estuaries (11-16%) (Table 2b). Causes of heterogeneity between the two sites within Es- tero de Punta Banda included higher densities and less variability of Mediomastus ambiseta and nereid polychaetes at the site closest to the mouth, La Boca. Homogeneity of macrofauna within San Quintin (26-31% similarity) was similar to that found between San Quintin and Mission Bay (29- 35% similarity) (Table 2b). Differences in compo- sition among the San Quintin sites were due in part to higher densities of the undescribed syllid polychaetes, Brania spp., in the site closest to the mouth (Tombolo) relative to the other sites. Het- erogeneity between the head of Bahia Falsa and North Marsh was caused by higher densities of cap- itellid polychaetes and enchytraeid oligochaetes at Bahia Falsa and higher densities of tubificid oli- gochaetes at North Marsh.
There were no significant differences in trophic (Table 4a) and reproductive (Table 4b) group compositions among the sites located within each estuary.
Comparisons Within Sites Macrofaunal assemblages within Mission Bay
were the most homogeneous (54% similarity), while assemblages at Campo Chanoc (EPB) were the most heterogeneous (18% similarity) (Table 2b). La Boca (EPB) and the San Quintin sites had similarly homogeneous macrofaunal assemblages (35-42% similarity) (Table 2b). Abundances of tanaids, tubificid oligochaetes, and capitellid poly- chaetes contributed the most to the similarity of
macrofaunal assemblages within Mission Bay. Ne- merteans and the capitellid Mediomastus ambiseta were the most spatially homogeneous taxa at Cam- po Chanoc (EPB) and at La Boca, where nereid polychaetes also contributed to within-site similar- ity. Tubificid oligochaetes and the undescribed polychaetes, Brania spp. explained most of the macrofaunal homogeneity at both the site closest (Tombolo) and farthest (North) from the mouth at San Quintin. Nemerteans were also important at North Marsh. Homogeneity at Bahia Falsa (BSQ) was due to uniform abundances of capitel- lid polychaetes, enchytraeid oligochaetes, and chi- ronomid insects.
Similarity of trophic group compositions within sites ranged from 77-89%, except for Campo Chanoc (EPB) which showed only 49% similarity. The high proportions of surface and subsurface deposit feeders throughout each of these sites were responsible for the high similarity measures. Simi- larities in reproductive group compositions ranged from 74-95% within each site and were attribut- able to the high proportions of direct developers found within all sites in Mission Bay and Bahia de San Quintin, and high proportions of animals with a planktonic stage found within each of the sites in Estero de Punta Banda.
ENVIRONMENTAL RELATIONSHIPS WITH MACROFAUNA
The multiple regression analyses detected some weak, but still significant (p - 0.05), correlations between the macrofaunal and environmental vari- ables (see Tables 5 and 6). Total macrofaunal den-
Tidal Flat Macrofaunal Communities 109
TABLE 5. Results of linear stepwise multiple regressions of macrofaunal taxa richness and abundances, and environmental properties from the tidal flats of Mission Bay, southern California; Estero de Punta Banda and San Quintin, Baja California. Data were collected between April and August 1996. n = 13 cores (18 cm2 X 6 cm-deep). Environmental variables include organic matter content, sand content, belowground biomass, and percent cover of Zostera marina. +/- = positive (+) or negative (-) correlation.
Dependent Variable Independent Variable +/- R2 or r2 p F df
Taxa richness % Zostera cover + 0.28 0.002 7.4 2, 38 Organic matter content -
Oligochaeta Enchytraeidae Sand content - 0.34 0.0004 9.6 2,38
% Zostera cover - Naididae Sand content - 0.27 0.002 7.2 2,38
Organic matter content Insecta Sand content - 0.26 0.004 6.6 2,38
% Zostera cover -
Polychaeta Mediomastus ambiseta Sand content + 0.11 0.04 4.8 1,39 Nereidae Sand content + 0.22 0.002 10.7 1,39 Opheliidae Organic matter content - 0.18 0.02 4.1 2,38
% Zostera cover + Syllidae Belowground biomass + 0.31 0.001 8.4 2, 38
Organic matter content
Peracarid crustacea Gammaridea Belowground biomass + 0.24 0.005 6.1 2,38
(non-Corophiids) Organic matter content Isopods % Zostera cover + 0.57 1 X 10⁻⁷ 24.9 2,38
Organic matter content Mollusca Organic matter content - 0.20 0.004 9.5 1,39
Gastropoda Organic matter content - 0.16 0.01 7.5 1,39
sity appeared unaffected by the environmental var- iables measured, while taxa richness tended to be positively related to Zostera cover and negatively re- lated to percent organic matter (Table 5). Densi- ties of enchytraeid oligochaetes and insects were negatively correlated with sand content. Densities of the capitellid Mediomastus ambiseta and of nereid polychaetes were positively correlated with sand content, while opheliid and syllid polychaetes were negatively correlated with organic matter and pos- itively associated with the presence of Zostera (per- cent cover and plant belowground biomass). Den- sities of isopods and gammaridean amphipods (not including corophiids) were positively corre- lated with presence of Zostera, (percent cover and/ or belowground biomass) and negatively associated with organic matter content.
When distance from the mouth of the estuary was added to the multiple regression models using only data from San Quintin, density of total mac- rofauna remained uncorrelated with any of the en- vironmental variables and number of taxa was still negatively correlated with organic matter content (Table 6). Tubificid oligochaete density was posi- tively correlated, while density of naidid oligo- chaetes was negatively correlated with distance from the mouth of the estuary. Capitellid, spionid, and syllid polychaete densities all showed negative correlations with the distance from the mouth.
Discussion Southern California coastal systems lack pristine
reference sites making it difficult to define anthro- pogenic impacts. Coastal ecologists are therefore challenged to evaluate the cumulative impacts on natural systems, often with only short-time series comparisons within and between areas, or with comparisons of areas subjected to different types and levels of disturbance (see Tegner and Dayton 1997; Dayton et al. 1998). Selecting the less de- graded estuaries of northern Baja California as ref- erence sites for the degraded wetlands of southern California seems to be a natural choice, yet de- pending upon which site was chosen in this study, we would have drawn very different conclusions. If Mission Bay had been compared only to Estero de Punta Banda, we might have hypothesized that higher organic enrichment on the Mission Bay tid- al flat may have contributed to higher proportions of tubificid oligochaetes, which are known to be associated with high organic sediment content (Diaz 1980). The higher proportion of animals with direct development may have been hypothe- sized as a result of the isolation of the Mission Bay tidal flat (e.g., resulting in restricted larval recruit- ment from other marshes) relative to the flats in Estero de Punta Banda. The similarity between the degraded Mission Bay and the relatively pristine Bahia de San Quintin demonstrates that there is a
110 T.S. Talley et al.
TABLE 6. Results of forward stepwise multiple regressions of macrofaunal taxa richness and abundances, and environmental prop- erties from the tidal flats of San Quintin, Baja California. Data were collected between April 28 and June 22, 1996, n = 13 cores (18 cm2 x 6 cm-deep). Environmental variables include organic matter content, sand content, belowground biomass, and percent cover of Zostera marina and distance from the mouth of each estuary. Distance was highly correlated with the sediment properties so the residuals of distance (the effects of sand removed) were used. +/- = positive (+) or negative (-) correlation.
Dependent Variable Independent Variable +/- R2 or r2 p F df
Taxa richness Organic matter content - 0.34 8.8 1,17 Oligochaeta
Tubificidae Distance from mouth + 0.25 0.028 5.8 1,17 Naididae Distance from mouth - 0.23 0.039 5 1,17
Insecta % Zostera cover - 0.56 0.001 10.4 2,16 Sand content
Polychaeta Capitellidae Distance from mouth - 0.47 0.001 15.0 1,17 Spionidae Distance from mouth - 0.36 0.006 9.6 1,17 Syllidae % Zostera cover + 0.86 7 X 10⁻⁶ 21.9 4,14
Organic matter content + Sand content + Distance from mouth
Decapod crustacea Sand content + 0.23 0.036 5.2 1,17 Peracarid crustacea Isopods % Zostera cover + 0.55 0.002 9.6 2,16
Organic matter content Mollusca
Gastropoda Organic matter content - 0.56 0.0002 21.7 1,17
lack of close coupling between the benthos and the assumed anthropogenic impact. This signifies that these systems are more complex than we first thought, and that they respond to a variety of fac- tors, acting on different temporal and spatial scales, that contribute to the distribution of mac- rofaunal assemblages.
SCALES OF COMMUNITY STRUCTURE IN SPACE AND TIME
Spatial Scales In addition to large-scale (101-102 km), among-
estuary variations in macrofaunal community struc- ture and environmental variables, mid-scale (101- 102 m) spatial variations (within-estuary) also exist. Spatial variation of the environmental and some of the macrofaunal properties observed in this study was higher within than among estuaries. On a small spatial scale (1-10 m), variation may be ob- served due to microhabitat differences (e.g., vary- ing abundances of higher plants). Sampling at each of these spatial scales would be ideal to prop- erly describe the tidal flat habitat, and was attempt- ed here at the cost of the number of replicates (cores) within each site. Low numbers of replicates can cause loss of resolution of trends, thus making it more difficult to demonstrate significant differ- ences between sites (Thrush et al. 1994; Hewitt et al. 1998). Despite our low number of replicates, we detected significant relationships between sites and between measured variables. Although higher numbers of replicates should be used to properly determine amounts of spatial variability (see Hew-
itt et al. 1993), the data presented here give an idea of the general patterns of macrofaunal and associated environmental properties within and among these estuaries.
Temporal Scales
Seasonal changes in community structures are an important consideration when making compar- isons between dates or systems. Densities of tem- perate, intertidal, soft-bottom invertebrates are well documented to peak in the spring, decline throughout the summer, and often experience a second, usually smaller, peak in the fall before de- clining again into the winter (e.g., Levin 1984; Frid and James 1989; Marsh and Tenore 1990; True- blood et al. 1994; Sarda et al. 1995). The Mexican sites in this study were sampled during the spring and early summer (April 26-July 6, 1996) when densities and species richness of benthic inverte- brates are at their peak (Calderon-Aguilera 1992). Mission Bay was sampled in late summer (August 10, 1996) when the peaks had presumably de- clined, yet both density and taxa richness in Mis- sion Bay were found to be among the highest rel- ative to the other sites.
Macrofaunal data based on samples collected in April and July 1996 from the same mudflat with a similar sized core (0.001 m2 X 2 cm deep) are pre- sented in Crooks (1998), who found that species richness did not change dramatically between April and July 1996 (c. 13-15 species). Estimates of macrofaunal density were about 65% lower in the summer than in the spring (Crooks 1998) sug-
Tidal Flat Macrofaunal Communities 111
gesting that our density estimates may be low for Mission Bay. Based on the macrofaunal density shifts presented in Crooks (1998), the relative abundance of polychaetes estimated in this study (22%) may be about half as much as it would have been in the spring, while oligochaetes (27%) may have been more abundant by a factor of two. Per- acarid crustaceans, the dominant taxon in Mission Bay in this study did not seem to show a seasonal pattern between spring and summer (Crooks 1998). Using these estimates of fluctuations in pro- portional abundances, the proportions of poly- chaetes in Mission Bay that are reported here would increase to within the range of those re- ported in San Quintin, and proportions of oligo- chaetes would remain intermediate and similar to the values found in two of the San Quintin sites. In Mission Bay, the same infaunal species or taxa have been found on the mudflat across seasons, but the abundances of each change (e.g., Levin 1984; Crooks 1998; Levin et al. 1998). The vari- ability between the estuaries, and even between sites within the estuaries, was greater than the var- iability between late spring and summer on the Mission Bay mudflat.
RELATIONSHIPS BETWEEN MACROFAUNA AND THEIR ENVIRONMENT
Distribution Gradients
The estuaries examined in this study are char- acteristic of arid Mediterranean climates and are considered seasonally inverse estuaries (Largier et al. 1997). High evaporation and a lack of fresh- water inputs during the dry season (Levin 1983; Largier et al. 1997) result in inverse salinity and temperature gradients within the estuaries. Such conditions often occur year-round in the Mexican estuaries (Chavez de Nishikawa and Alvarez-Bor- rego 1974; Alvarez-Borrego et al. 1975). Despite the documented presence of this inverse gradient in the bay water, the pore-water salinities in these areas were all found to be about that of seawater (35-38%o). In wetter climates, macrofaunal distri- bution gradients in estuaries are believed to be due in part to decreasing salinity from the mouth to the head of the estuary (see Levinton 1982; Mc- Lusky et al. 1993; Ysebaert et al. 1993). Oligo- chaetes (especially the family Tubificidae) and in- sects are often the dominant taxa in the low-salin- ity, upper reaches, while polychaetes and molluscs have been associated with the lower reaches of es- tuaries (McLusky et al. 1993; Ysebaert et al. 1993). Despite the lack of a salinity gradient in Bahia de San Quintin, we found similar patterns, with tubi- ficid oligochaetes positively correlated, and three dominant polychaete families negatively correlat-
ed, with distance from the mouth (independent of sediment properties). Possible explanations for the similar macrofaunal distribution patterns found in San Quintin include decreasing gradients of tidal amplitude (Moreira et al. 1993) and changing hy- drodynamics (e.g., reduced wave energy and flush- ing) from mouth to head of the estuary. Condi- tions specific to Bahia de San Quintin may also play a role in the macrofaunal distributions. These include seasonal runoff from agricultural fields into the bay and a breakdown of the typical in- verse-estuary currents by overriding uni-directional winds (Farreras and Cabrera 1979). These physical factors could, in turn, affect the amounts of adult and larval dispersal and recruitment, and environ- mental conditions (e.g., sediment organic matter and particle size) throughout the estuary. High wind or wave energy has been observed to influ- ence benthic macrofaunal community structures within estuaries through sediment disturbance and post-larval dispersal (Commito et al. 1995; Turner et al. 1995; Schaffner 1999).
Sediment and Vegetation Effects While mouth to back bay energy gradients may
indirectly affect macrofaunal distributions through the structuring of sediment properties, the rela- tionship between macrofauna and sediment prop- erties, independent of distance from the mouth, was examined, as was the relationship with Zostera cover. Sediment properties including particle size and organic matter (Sanders 1958; Pearson and Rosenberg 1978; Whitlatch 1980; McLusky et al. 1993; Snelgrove and Butman 1994), and the pres- ence and absence of seagrass (Orth 1977; Stoner 1980a,b; Edgar et al. 1994) are known to influence density, species richness, and composition of mac- rofaunal assemblages. The sediment properties measured in this study appear to be important to macrofauna as they were related to the densities of members of all the major taxonomic groups. The presence of Zostera was correlated with a few taxa of macrofauna, but only in combination with sed- iment properties (see Table 5). The influence of Zostera on sedimentary and macrofaunal properties in this study appears to be less compared to other areas (e.g., effects on sediment: Ginsburg and Low- enstam 1958; Scoffin 1970; effects on macrofauna: Orth 1977, 1984; Reise 1978; Lewis and Stoner 1983; Summerson and Peterson 1984). The cover and height of Zostera was relatively low in our study areas, so we did not expect strong Zostera effects.
FEASIBILITY OF COMPARISONS
Since a lack of pristine reference sites in south- ern California has left us with the need to evaluate ecological impacts by comparing the same system
112 T. S. Talley et al.
through time, or by making comparisons between systems of different disturbance levels and types, it is important to find feasible ways in which to make these comparisons. There was a greater similarity of macrofaunal assemblages between San Quintin and Mission Bay than between these estuaries and Estero de Punta Banda, but many lower taxonom- ic-level macrofaunal differences still exist. Group- ing taxa into higher taxonomic or functional groups (e.g., trophic and reproductive) may re- duce variability (Warwick 1988) and reveal general patterns between systems. The range of similarity between Bahia de San Quintin and Mission Bay using taxa abundance data was 29-35% (see Table 6b), while similarity using reproductive groups (87-91%) or trophic groups (80-83%) (see Table 4a and b) was much higher. All three estuaries var- ied little from each other with respect to trophic group composition. However, Bahia de San Quin- tin and Mission Bay were similar to each other, and both were different from Estero de Punta Banda with respect to reproductive groups (direct devel- opers or those species with planktonic larvae) and proportion of macrofauna that have a mobile adult stage. Examples of mobile adults include dipteran insects (Wirth and Stone 1963), the oligochaete Paranais litoralis, which lives at the sediment sur- face and may swim (Levinton et al. 1995) or be easily carried by bedload transport, and peracarid crustaceans, many of which are capable of swim- ming (Morris et al. 1980) or rafting on plant ma- terial (Highsmith 1985; Holmquist 1994). This higher level grouping also aids in sorting out the general cause of observed differences. For exam- ple, the similarity in trophic groups between Mis- sion Bay and Bahia de San Quintin may imply that the systems have similar benthic food web struc- tures or food (e.g., organic matter) sources. Dif- ferences in reproductive groups between Estero de Punta Banda and the other sites may indicate dif- ferences in conditions that influence dispersal or recruitment such as water column or hydrologic conditions (e.g., currents, upwelling, retention time, plankton, etc) (e.g., Farreras and Cabrera 1979; Lara-Lara et al. 1980; Alvarez-Borrego and Alvarez-Borrego 1982).
It is likely that large-scale oceanographic pro- cesses are responsible for the recruitment of ani- mals into each bay, while physical disturbance and microhabitat environmental gradients within these estuaries are important to the structure and distri- bution of macrofaunal assemblages at smaller scales in space and time. Local structures such as the presence or absence of plant shoots or roots may control abundances of some taxa on even smaller scales. The decoupling of the benthos from the apparent indicators of environmental degra-
dation could result from these particular indicators acting on different scales than, or not strongly af- fecting, the macrofauna or their associated envi- ronmental properties (e.g., sediment properties or within-bay energy gradients). The effects of envi- ronmental disturbances, including urban and ag- ricultural development, on macrofaunal assem- blages should not be generalized, as they might be site-dependent or scale-dependent. The selection of both a reference site and the variables to be sampled should be based on the suspected distur- bance with careful consideration to scale. One pos- sible alternative approach for dealing with the sit- uation encountered in this study, where the macro- infaunal assemblages in the disturbed and refer- ence site were fairly similar, would be to examine an indicator species that responds to the specific hypothesized stress.
ACKNOWLEDGMENTS
We would like to thank D. M. Talley for his help with the trips to the study sites and his unconditional dedication while there, we would also like to thank K. Bailey, D. Fruetel, A. A. Larson, P. Moberg, A. Robles-Bustamante, K. Riser, E. B. Scripps-D., M. Sigala, and L. I. Vilchis for their help in the field and the lab- oratory, E. Montiel for help with library research, J. Griffin for her graphics expertise, M. Graham, J. Hewitt, and L. Levin for data analysis advice, J. Hewitt for her data analysis assistance and imperturbable nature, J. Crooks and L. Levin for reviewing an earlier version of the manuscript, and L. Levin for intellectual input. Also appreciated was taxonomic assistance was provided by J. Crooks, K. Coates, L. Harris, B. Healy, K. Fitzhugh, C. Martin, M. Milligan, T. Phillips, and E. Vetter. We additionally would like to thank J. Hughes and two anonymous reviewers for critically reviewing the manuscript. This work was funded by a Pew Conservation Fellowship awarded to P. K. Dayton.
LITERATURE CITED
ADAM, P. 1990. Saltmarsh Ecology. Cambridge University Press. New York.
ALVAREZ-BORREGO, J. AND S. ALVAREZ-BORREGO. 1982. Temporal and spatial variability of temperature in two coastal lagoons. California Cooperative Oceanic Fisheries Investigations Report XXIII:188-197.
ALVAREZ-BORREGO, S., G. BALLESTEROS-GRIJALVA, AND A. CHEE- BARRAGAN. 1975. Study of some surface physico-chemical fac- tors in the San Quintin Bay, during summer, autumn and winter. Ciencias Marinas 2:1-9.
BARNARD, J. L. 1964. Marine amphipoda of Bahia de San Quin- tin, Baja California. Pacific Naturalist 4:55-139.
BARNARD, J. L. 1970. Benthic ecology of Bahia de San Quintin Baja California. Smithsonian Contributions to Zoology 44:1-63.
BRETADo-AGUIRRE, J. 1987. Variaciones estacionales de los iso- podos marinos (Crustacea: Peracarida) de la Bahia de San Quintin. Licenciatura en Biologia, Universidad Autonoma de Baja California.
CALDERON-AGUILERA, L. E. 1992. Analysis of.the benthic infauna from Bahia de San Quintin, Baja California, with emphasis on its use in impact assessment studies. Ciencias Marinas 18: 27-46.
CANTU-MARTiNEZ, P. C. 1987. Sistematica y distribuci6n de los oligoquetos marinos (Annelida: Oligochaeta) de la Bahia de San Quintin, Baja California, Mexico. Revista de Biologia Trop- ical 35:135-137.
Tidal Flat Macrofaunal Communities 113
CHAVEZ DE NISHIKAWA, A. G. AND S. ALVAREZ-BORREGO. 1974.
Hidrologia de la Bahia de San Quintin, Baja California, en invierno y primavera. Ciencias Marinas 1:31-62.
CLARKE, K. R. 1993. Non-parametric multivariate analyses of changes in community structure. Australian Journal of Ecology 18:117-143.
CLARKE, K. R. AND R. H. GREEN. 1988. Statistical design and analysis for a 'biological effects' study. Marine Ecology Progress Series 46:213-226.
CLARKE, K. R. AND R. M. WARWICK. 1994. Change in Marine Communities: An Approach to Statistical Analysis and Inter- pretation. Natural Environmental Research Council. United Kingdom.
COMMITO,J. A., S. F. THRUSH, R. D. PRIDMORE,J. E. HEWITT, AND V. J. CUMMINGS. 1995. Dispersal dynamics in a wind-driven benthic system. Limnology and Oceanography 40:1513-1518.
COOK, D. G. 1974. The systematics and distribution of marine Tubificidae (Annelida: Oligochaeta) in the Bahia de San Quintin, Baja California, with descriptions of five new species. Bulletin of the Southern California Academy of Sciences 73:126-140.
CROOKS, J. A. 1996. The population ecology of an exotic mussel, Musculista senhousia, in a southern California Bay. Estuaries 19: 42-50.
CROOKS, J. A. 1998. Habitat alteration and community-level ef- fects of an exotic mussel, Musculista senhousia. Marine Ecology Progress Series 162:137-152.
DAYTON, P. K., M. J. TEGNER, P. B. EDWARDS, AND K. L. RISER. 1998. Sliding baselines, ghosts and reduced expectations in kelp forest communities. Ecological Applications 8:309-322.
DE ITA-GARGALLO, G. 1982. Estudio sobre superposicion de ni- cho, su relacion con el sedimento y espectro de tamao grano consumido en tres especies de callinasidos (Crustacea: De- capoda: Thallassidae). Licenciatura en Oceanologia. Univer- sidad Aut6noma de Baja California.
DEXTER, D. M. 1983. Soft bottom infaunal communities in Mis- sion Bay. California Fish and Game 69:5-17.
DIAZ, R. 1980. Ecology of tidal freshwater and estuarine Tubi- ficidae (Oligochaeta), p. 319-330. In R. 0. Brinkhurst and D. G. Cook (eds.), Aquatic Oligochaete Biology. Plenum Press, New York.
DiAZ-CASTANEDA, V. AND V. RODRiGUEZ-VILLANUEVA. 1998. Poly- chaete fauna from San Quintin Bay, Baja California, Mexico. Bulletin of the Southern California Academy of Sciences 97:9-32.
DROEGE, S., A. CYR, AND J. LARIVEE. 1998. Checklists: An under- used tool for the inventory and monitoring of plants and an- imals. Conservation Biology 12:1134-1138.
EDGAR, G. J., G. WATSON, L. S. HAMMOND, AND C. SHAW. 1994. Comparisons of species richness, size-structure and produc- tion of benthos in vegetated and unvegetated habitats in West- ern Port, Victoria. Journal of Experimental Marine Biology and Ecology 176:201-226.
FARRERAS, S. AND H. CABRERA. 1979. Dispersion and circulation in the Estero de Punta Banda and San Quintin Bay, Baja Cal- ifornia, Mexico. Transactions from the Meeting of the Centros de Investigaci6n de Baja California and Scripps Institution of Ocean- ography 5:185-201.
FAUCHALD, K. AND P. JUMARS. 1979. The diet of worms: A study of polychaete feeding guilds. Oceanography and Marine Biology Annual Review 17:193-284.
FRID, C. AND R. JAMES. 1989. The marine invertebrate fauna of a British coastal salt marsh. Holarctic Ecology 12:9-15.
GIERE, 0. AND 0. PFANNKUCHE. 1982. Biology and ecology of marine oligochaeta, a review. Oceanography and Marine Biology Annual Review 20:173-308.
GINSBURG, R. N. AND H. A. LOWENSTAM. 1958. The influence of marine bottom communities on the depositional environ- ment of sediments. Journal of Geology 66:310-318.
GRAHAM, M. H. 1997. Factors determining the upper limit of giant kelp, Macrocystis pyrifera Agardh, along the Monterey
Peninsula, central California, USA. Journal of Experimental Ma- rine Biology and Ecology 218:127-149.
GRIFFIS, R. B. AND F. L. CHAVEZ. 1988. Effects of sediment type on burrows of Callianassa californiensis Dana and C. gigas Dana. Journal of Marine Biology and Ecology 117:239-253.
HEWITT,J. E., G. B. MCBRIDE, R. D. PRIDMORE, AND S. F. THRUSH. 1993. Patchy distributions: Optimising sample size. Environ- mental Monitoring and Assessment 27:95-105.
HEWITT, J. E., S. F. THRUSH, V. J. CUMMINGS, AND S. J. TURNER. 1998. The effect of changing sampling scales on our ability to detect effects of large-scale processes on communities.Jour- nal of Experimental Marine Biology and Ecology 227:251-264.
HIGHSMITH, R. C. 1985. Floating and algal rafting as potential dispersal mechanisms in brooding invertebrates. Marine Ecol- ogy Progress Series 25:169-179.
HOLMQUIST, J. G. 1994. Benthic macroalgae as a dispersal mech- anism for fauna: Influence of a marine tumbleweed. Journal of Experimental Marine Biology and Ecology 180:235-251.
HURLBERT, S. 1971. The nonconcept of species diversity: A cri- tique and alternative parameters. Ecology 52:577-586.
IBARRA-OBANDO, S. E. AND M. POUMIAN-TAPIA. 1991. The effects of tidal exclusion on salt marsh vegetation in Baja California, Mexico. Wetlands Ecology and Management 1:131-148.
KEEN, A. M. 1962. A new west Mexican subgenus and new spe- cies of Montacutidae (Mollusca: Pelecypoda), with a list of Mollusca from Bahia de San Quintin. Pacific Naturalist 3:321- 328.
KNEIB, R. T. 1997. The role of tidal marshes in the ecology of estuarine nekton. Oceanography and Marine Biology Annual Re- view 35:163-220.
LARA-LARA, J. R., S. ALVAREZ-BORREGO, AND L. F. SMALL. 1980. Variability and tidal exchange of ecological properties in a coastal lagoon. Journal of Estuarine, Coastal and Shelf Science 11: 613-637.
LARGIER, J. L., J. T. HOLLIBAUGH, AND S. V. SMITH. 1997. Season- ally hypersaline estuaries in Mediterranean-climate regions. Estuarine, Coastal and Shelf Science 45:789-797.
LASSERRE, P. 1971. The marine Enchytraeidae (Annelida, Oli- gochaeta) of the eastern coast of North America with notes on their geographical distribution and habitat. Biological Bul- letin 140:440-460.
LEVIN, L. A. 1981. Dispersion, feeding, behavior and competi- tion in two spionid polychaetes. Journal of Marine Research 39: 99-117.
LEVIN, L. A. 1982a. Interspecific interactions among tube-dwell- ing polychaetes in a dense infaunal assemblage. Journal of Ex- perimental Marine Biology and Ecology 65:107-119.
LEVIN, L. A. 1982b. The roles of life history, dispersal and in- terference competition in the population and community structure of a dense infaunal polychaete assemblage. Ph.D. Dissertation, University of California, San Diego, California.
LEVIN, L. A. 1983. Drift tube studies of bay-ocean water ex- change and implications for larval dispersal. Estuaries 6:364- 371.
LEVIN, L. A. 1984. Life history and dispersal patterns in a dense infaunal polychaete assemblage: Community structure and re- sponse to disturbance. Ecology 65:1185-1200.
LEVIN, L. A., T. S. TALLEY, AND J. HEWITT. 1998. Macrobenthos of Spartina foliosa (Pacific cordgrass) salt marshes in Southern California: Community structure and comparison to a Pacific mudflat and Spartina alterniflora (Atlantic smooth cordgrass) marsh. Estuaries 21:129-144.
LEVINTON, J. S. 1982. Marine Ecology. Prentice Hall Inc., Engle- wood Cliffs, New Jersey.
LEVINTON,J. S., P. NILSSON, ANDJ. P. KURDZIEL. 1995. Emigration and spatial population dynamics in an oligochaete. 23rd An- nual Benthic Ecology Meetings Abstracts. March 1995. New Bruns- wick, New Jersey.
LEVINTON, J. S. AND S. STEWART. 1988. Effects of sediment or-
114 T. S. Talley et al.
ganics, detrital input, and temperature on demography, pro- duction, and body size of a deposit feeder. Marine Ecology Pro- gress Series 49:259-266.
LEWIS, F. G. AND A. W. STONER. 1983. Distribution of macrofauna within seagrass beds: An explanation for patters of abun- dance. Bulletin of Marine Science 33:296-304.
MACDONALD, K. B. 1969a. Molluscan faunas of the Pacific Coast salt marshes and tidal creeks. The Veliger 11:399-405.
MACDONALD, K. B. 1969b. Quantitative studies of the salt marsh mollusc faunas from the North American Pacific Coast. Eco- logical Monographs 39:33-60.
MARSH, A. G. AND K. R. TENORE. 1990. The role of nutrition in regulating the population dynamics of opportunistic, surface deposit feeders in a mesohaline community. Limnology and Oceanography 35:710-724.
MCLUSKY, D. S, S. C. HULL, AND M. ELLIOT. 1993. Variations in the intertidal and subtidal macrofauna and sediments along a salinity gradient in the upper Forth Estuary. NetherlandsJour- nal of Aquatic Science 27:101-109.
MOREIRA, M. H., H. QUEIROGA, M. M. MACHADO, AND M. R. CUN- HA. 1993. Environmental gradients in a southern Europe es- tuarine system: Ria de Aveiro, Portugal: Implications for soft bottom macrofauna colonization. NetherlandsJournal of Aquatic Science 27:465-482.
MORRIS, R. H., D. P. ABBOTT, AND E. C. HADERLIE. 1980. Inter- tidal Invertebrates of California. Stanford University Press, Stanford, California.
ORTH, R. J. 1977. The importance of sediment stability in sea- grass communities, p. 281-300. In B. C. Coull (ed.), Ecology of Marine Benthos. University of South Carolina Press, Co- lumbia, South Carolina.
ORTH, R.J. 1984. Faunal communities in seagrass beds: A review of the influence of plant structure and prey characteristics on predator-prey relationships. Estuaries 7:339-350.
PEARSON, T. H. AND R. ROSENBERG. 1978. Macrobenthic succes- sion in relation to organic enrichment and pollution of the marine environment. Oceanography and Marine Biology Annual Review 16:229-311.
REISE, K. 1978. Experiments on epibenthic predation in the Wadden Sea. Helgolander Wissenschaftliche Meeresuntersuchungen 31:55-101.
REISH, D. J. 1963. A quantitative study of the benthic polychae- tous annelids of Bahia de San Quintin, Baja California. Pacific Naturalist 3:99-136.
SANDERS, H. L. 1958. Benthic studies in Buzzards Bay. I. Animal- sediment relationships. Limnology and Oceanography 3:245-258.
SARDA, R., K. FOREMAN, AND I. VALIELA. 1995. Macroinfauna of a southern New England salt marsh: Seasonal dynamics and production. Marine Biology Berlin 121:431-445.
SCHAFFNER, L. C. 1999. Physical sediment disturbance processes along the estuarine gradient: Implications for benthic com- munity structure and function. 28th Annual Benthic Ecology Meetings Abstracts. March 1999. Baton Rouge, Louisiana.
SCHOENHERR, A. A. 1992. A Natural History of California. Uni- versity of California Press, Los Angeles, California.
SCOFFIN, T. P. 1970. The trapping and binding of subtidal car- bonate sediments by marine vegetation in Bimini Lagoon, Ba- hamas. Journal of Sedimentary Petrology 40:249-273.
SNELGROVE, P. V. R. AND C. A. BUTMAN. 1994. Animal-sediment
relationships revisited: Cause versus effect. Oceanography and Marine Biology Annual Review 32:111-177.
STONER, A. W. 1980a. Perception and choice of substratum by epifaunal amphipods associated with seagrasses. Marine Ecol- ogy Progress Series 3:105-111.
STONER, A. W. 1980b. Abundance, reproductive seasonality and habitat preferences of amphipod crustaceans in seagrass meadows of Apalachee Bay, Florida. Contributions to Marine Sci- ence, University of Texas 23:63-77.
SUMMERSON, H. C. AND C. H. PETERSON. 1984. Role of predation in organizing benthic communities of a temperate-zone sea- grass bed. Marine Ecology Progress Series 15:63-77.
TEGNER, M. J. AND P. K. DAYrON. 1997. Shifting baselines and the problem of reduced expectations in nearshore fisheries, p 119-128. In 0. T. Magoon, H. Converse, B. Baird, and M. Miller-Henson (eds.), California and the World Ocean '97: Proceedings of the Conference. American Society of Civil En- gineers, San Diego, California.
THOMPSON, B., J. DIXON, S. SCHROETER, AND D. J. REISH. 1993. Benthic invertebrates, p. 369-458. In M. D. Dailey, D.J. Reish, and J. W. Anderson (eds.), Ecology of the Southern California Bight. University of California Press, Los Angeles.
THRUSH, S. F., R. D. PRIDMORE, AND J. E. HEWITT. 1994. Impacts on soft-sediment macrofauna: The effects of spatial variation on temporal trends. Ecological Applications 4:31-41.
TRUEBLOOD, D. D., E. D. GALLAGHER, AND D. M. GOULD. 1994. Three stages of seasonal succession on the Savin Hill Cove mudflat, Boston Harbor. Limnology and Oceanography 39:1140- 1454.
TURNER, S. J., S. F. THRUSH, R. D. PRIDMORE, J. E. HEWITT, V. J. CUMMINGS, AND M. MASKERY. 1995. Are soft-sediment com- munities stable? An example from a windy harbour. Marine Ecology Progress Series 120:219-230.
VON SON-GALLUT, J. A. 1991. Estructuras biogenicas modernas en la laguna costera "Estero de Punta Banda" Baja California, Mexico. Maestro en Ciencias en Oceanografia, Universidad Autonoma de Baja California.
WAUMAN-ROJAS, D. 1998. Macrofauna bentica del Estero de Pun- ta Banda, Ensenada, Baja California, Mexico. Maestro en Ciencias en Oceanografia, Universidad Autonoma de Baja California.
WARWICK, R. M. 1988. Analysis of community attributes of the macrobenthos of Frierfjord/Langesundfjord at taxonomic levels higher than species. Marine Ecology Progress Series 46:167- 170.
WHITLATCH, R. B. 1980. Patterns of resource utilization and co- existence in marine intertidal deposit-feeding communities. Journal of Marine Research 38:743-765
WILSON, W. H. 1991. Sexual reproductive modes in polychaetes: Classification and diversity. Bulletin of Marine Science 48:500- 516.
WIRTH, W. W. AND A. STONE. 1963. Aquatic Diptera, p. 372-482. In R. L. Usinger (ed.), Aquatic Insects of California. Univer- sity of California Press, Los Angeles.
YSEBAERT, T., P. MEIRE, D. MAES, ANDJ. BuIJS. 1993. The benthic macrofauna along the estuarine gradient of the Schelde Es- tuary. Netherlands Journal of Aquatic Ecology 27:327-341.
Received for consideration, July 28, 1998 Accepted for publication, August 17, 1999