
The Benthic Macrofaunal Community and Sediment Quality ...
62
Tampa Bay Estuary Program Technical Publication # 05-09 The Benthic Macrofaunal Community and Sediment Quality Conditions in Clam Bayou, Pinellas County, Florida FINAL REPORT March 2009
Transcript of The Benthic Macrofaunal Community and Sediment Quality ...

Tampa Bay Estuary Program Technical Publication # 05-09
The Benthic Macrofaunal Community and Sediment Quality Conditions in Clam
Bayou, Pinellas County, Florida
FINAL REPORT
March 2009

The Benthic Macrofaunal Community
and Sediment Quality Conditions in Clam Bayou,
Pinellas County, Florida
David J. Karlen, Thomas L. Dix, Barbara K. Goetting & Sara E. Markham
Environmental Protection Commission of Hillsborough County
Data Report prepared for:
Tampa Bay Estuary Program
March 2009

ii
Acknowledgements
The Pinellas County Department of Environmental Management collected the benthic samples and field
data for this study. The PCDEM personnel involved with the field work were: Melissa Harrison, Cindy
Meyer, Susan Meyers, Robert McWilliams, Natasha Dickrell, Anamarie Rivera, and Ryan Ryczek. Cindy
Meyer of PCDEM generated the sampling coordinates for this study.
Laboratory processing of the silt/clay samples and benthic macrofauna samples was done by the
Environmental Protection Commission of Hillsborough County. In addition to the authors, Helen Phillips,
Matt Kolmann, and Kieley Hurf (EPCHC lab staff) assisted in the sample sorting and data entry. Sample
analysis for sediment contaminants was conducted by the EPCHC’s chemistry lab under the direction of
Joe Barron. Lab personnel involved were Steve Perez (metals), Shanin Shapiro (pesticides and PCBs),
Kendra Cole (PAHs) and Dawn Jaspard (Data Management).
Brandt Henningsen (SWFWMD) and Peggy Morgan (FDEP) provided data from the 2001 FDEP
sampling at Clam Bayou. Funding was provided by the Tampa Bay Estuary Program as part of the annual
bay-wide Tampa Bay Benthic Monitoring Program.

iii
Table of Contents
Acknowledgements ....................................................................................................................................... ii
Table of Contents.......................................................................................................................................... iii
List of Figures ................................................................................................................................................ v
List of Tables ............................................................................................................................................... vii
Introduction ................................................................................................................................................... 1
Materials and Methods .................................................................................................................................. 1
Site Selection ............................................................................................................................................. 1
Field Collection ......................................................................................................................................... 1
Sediment Chemistry .............................................................................................................................. 3
Laboratory Procedures ............................................................................................................................... 3
Field data ............................................................................................................................................... 3
Sediment Chemistry .............................................................................................................................. 3
Benthic Community Analysis ................................................................................................................ 4
Data Analysis ............................................................................................................................................. 4
Data Categorization ............................................................................................................................... 4
Univariate Statistical Analysis .............................................................................................................. 4
Multivariate Statistical Analysis and Benthic Community Indices ....................................................... 4
Comparison with 2001 FDEP Samples ................................................................................................. 5
Spatial and Graphical Analysis ............................................................................................................. 5
Results ........................................................................................................................................................... 6
Benthic Macrofaunal Community Analysis .............................................................................................. 6
Physical Parameters ................................................................................................................................. 11
Sediment Contaminants ........................................................................................................................... 17
Comparison on Biological and Physical Variables. ................................................................................ 29
Comparison with TBEP Baseline and 2001 FDEP data. ......................................................................... 29

iv
Discussion and Conclusions ........................................................................................................................ 46
Literature Cited ............................................................................................................................................ 48
Appendix A: Clam Bayou 2008 Benthic Macrofaunal Data ....................................................................... 50

v
List of Figures
Figure 1 TBEP 2008 Clam Bayou sampling locations and Bray-Curtis Similarity grouping. .................... 2
Figure 2 Bray-Curtis Similarity dendrogram of 2008 TBEP Clam Bayou sampling sites. ......................... 7
Figure 3 Clam Bayou 2008 benthic species richness. .................................................................................. 9
Figure 4 Clam Bayou 2008 benthic abundance. ........................................................................................... 9
Figure 5 Clam Bayou 2008 Shannon diversity index. ................................................................................ 10
Figure 6 Clam Bayou 2008 Simpson’s diversity index. ............................................................................. 10
Figure 7 Clam Bayou 2008 sample depth. ................................................................................................. 14
Figure 8 Clam Bayou 2008 bottom salinities. ............................................................................................ 14
Figure 9 Clam Bayou 2008 bottom dissolved oxygen. .............................................................................. 15
Figure 10 Clam Bayou 2008 bottom pH. ................................................................................................... 15
Figure 11 Clam Bayou 2008 sediment percent silt + clay. ........................................................................ 16
Figure 12 Clam Bayou 2008 metals:aluminum regressions. ....................................................................... 20
Figure 13 Clam Bayou 2008 sediment total PCBs concentrations (µg/kg). .............................................. 23
Figure 14 Clam Bayou 2008 sediment lindane concentrations (µg/kg). .................................................... 23
Figure 15 Clam Bayou 2008 sediment dieldrin concentrations (µg/kg). ................................................... 24
Figure 16 Clam Bayou 2008 sediment total chlordane concentrations (µg/kg). ........................................ 24
Figure 17 Clam Bayou 2008 sediment p,p’-DDD concentrations (µg/kg). ............................................... 25
Figure 18 Clam Bayou 2008 sediment p,p’-DDE concentrations (µg/kg). ................................................ 25
Figure 19 Clam Bayou 2008 sediment p,p’-DDT concentrations (µg/kg). ................................................ 26
Figure 20 Clam Bayou 2008 sediment total DDT concentrations (µg/kg). ............................................... 26
Figure 21 Clam Bayou 2008 sediment low molecular weight PAH concentrations (µg/kg). .................... 28
Figure 22 Clam Bayou 2008 sediment high molecular weight PAH concentrations (µg/kg). ................... 28
Figure 23 Clam Bayou 2008 sediment total PAH concentrations (µg/kg). ............................................... 29
Figure 24 Clam Bayou 2008 and 2001 FDEP Bray-Curtis similarity analysis. ......................................... 31
Figure 25 Clam Bayou 2008 and TBEP reference Bray-Curtis similarity analysis. .................................. 32

vi
Figure 26 Clam Bayou 2001 vs. 2008 species richness. ............................................................................ 33
Figure 27 Clam Bayou 2008 vs. TBEP reference sites species richness. .................................................. 33
Figure 28 Clam Bayou 2001 vs. 2008 benthic abundance. ........................................................................ 34
Figure 29 Clam Bayou 2008 vs. TBEP reference sites benthic abundance. .............................................. 34
Figure 30 Clam Bayou 2001 vs. 2008 Shannon diversity index. ............................................................... 35
Figure 31 Clam Bayou 2008 vs. TBEP reference sites Shannon diversity index. ..................................... 35
Figure 32 Clam Bayou 2001 vs. 2008 Tampa Bay Benthic Index. ............................................................ 36
Figure 33 Clam Bayou 2008 vs. TBEP reference sites Tampa Bay Benthic Index. .................................. 36
Figure 34 Sediment cadmium concentrations (mg/kg) by sampling event. ................................................ 38
Figure 35 Sediment copper concentrations (mg/kg) by sampling event. ................................................... 38
Figure 36 Sediment lead concentrations (mg/kg) by sampling event. ....................................................... 39
Figure 37 Sediment zinc concentrations (mg/kg) by sampling event. ....................................................... 39
Figure 38 Clam Bayou 2008 vs. TBEP reference sites sediment PCB concentrations (µg/kg). ................ 40
Figure 39 Clam Bayou 2008 vs. TBEP reference sites sediment lindane concentrations (µg/kg). ........... 40
Figure 40 Clam Bayou 2008 vs. TBEP reference sites sediment dieldrin concentrations (µg/kg). ........... 41
Figure 41 Clam Bayou 2008 vs. TBEP reference sites sediment total chlordane concentrations (µg/kg). 41
Figure 42 Clam Bayou 2008 vs. TBEP reference sites sediment p,p’-DDD concentrations (µg/kg). ....... 42
Figure 43 Clam Bayou 2008 vs. TBEP reference sites sediment p,p’-DDE concentrations (µg/kg). ....... 42
Figure 44 Clam Bayou 2008 vs. TBEP reference sites sediment p,p’-DDT concentrations (µg/kg). ....... 43
Figure 45 Clam Bayou 2008 vs. TBEP reference sites sediment total DDT concentrations (µg/kg). ....... 43
Figure 46 Clam Bayou 2008 vs. TBEP reference sites sediment low molecular weight PAH
concentrations (µg/kg). .............................................................................................................. 44
Figure 47 Clam Bayou 2008 vs. TBEP reference sites sediment high molecular weight PAH
concentrations (µg/kg). .............................................................................................................. 44
Figure 48 Clam Bayou 2008 vs. TBEP reference sites sediment total PAH concentrations (µg/kg). ....... 45
vii
List of Tables
Table 1 Clam Bayou 2008 benthic community summary metrics. .............................................................. 8
Table 2 Clam Bayou 2008 relative abundance of benthic taxa. ................................................................. 12
Table 3 Clam Bayou 2008 bottom physical and sediment parameters. ..................................................... 13
Table 4 Clam Bayou 2008 sediment metals concentrations (mg/kg). ........................................................ 18
Table 5 Clam Bayou 2008 sediment PCB congener and total PCB concentrations (µg/kg). ................... 21
Table 6 Clam Bayou 2008 sediment chlorinated pesticide concentrations (µg/kg). .................................. 22
Table 7 Clam Bayou 2008 sediment polycyclic aromatic hydrocarbon (PAH) concentrations (µg/kg). .. 27

1
Introduction
The Tampa Bay Estuary Program (TBEP) started the annual bay-wide Tampa Bay Benthic Monitoring
Program in 1993 to evaluate and monitor the health of the sediment environment of Tampa Bay.
Monitoring in Boca Ciega Bay was added to the program in 1995. The program is a cooperative effort
between the Environmental Protection Commission of Hillsborough County (EPCHC), the Manatee
County Department of Environmental Management (MCDEM), and the Pinellas County Watershed
Management Department (PCWMD). Each agency assists in the annual field sampling within their
respective jurisdictions in Tampa Bay. Sample processing and data analysis is conducted by the EPCHC.
The benthic monitoring program’s objectives and sampling design were reevaluated in 2003 (Janicki
Environmental, 2003). As a result of this assessment, the reporting period was increased from one year to
four years and the number of samples collected annually was cut in half (from 124 to 64 samples per
year). This reduced sampling allowed for the redirecting of efforts towards collecting samples from areas
of concern (“Special Studies”) and typically two such sites are picked each year. Clam Bayou was chosen
as one of the Special Study site in 2008 because of recent concerns about increased siltation in the bayou
and because it is a current restoration site for the Southwest Florida Water Management District/ Surface
Water Improvement Program (SWFWMD/SWIM). This data report details the results from the 2008
Clam Bayou special study and compares these results with previous data collected by the Florida
Department of Environmental Protection in 2001 and with selected past sites from the Tampa Bay
Benthic Monitoring Program that have similar physical parameters.
Materials and Methods
Site Selection
Ten sites were selected for sampling in Clam Bayou by PCWMD staff. Six of the sites roughly
corresponded to the six locations sampled by FDEP in 2001. The remaining four sites were selected from
randomly generated coordinates. In order to compare the 2008 Clam Bayou benthic community with
expected baseline conditions in Tampa Bay, samples were chosen from past benthic monitoring sites
which most closely matched the Clam Bayou sites based on their sediment and salinity characteristics.
This was determined by calculating the 25th and 75th percentile values for the percent silt + clay and
bottom salinity at the Clam Bayou sites and searching the EPCHC benthic monitoring database for past
sites which fell within those ranges for both parameters. A total of nine sites sampled between 1995-2007
were found in the database; eight from Boca Ciega Bay and one from Lower Tampa Bay.
Field Collection
The field collection of sediment samples and water quality data was conducted by PCWMD staff.
Samples were collected at 10 sites (Figure 1) on three dates: 14 August 2008 (sites #4, 5, and 10), 26
August 2008 (sites# 1,2,7,8, and 12), and 26 September 2008 (sites #3 and 6). The disjunction in the field
collections was due in part to weather delays and low tides inhibiting boat access to several sites.

2
Figure 1 TBEP 2008 Clam Bayou sampling locations and Bray-Curtis Similarity grouping.
3
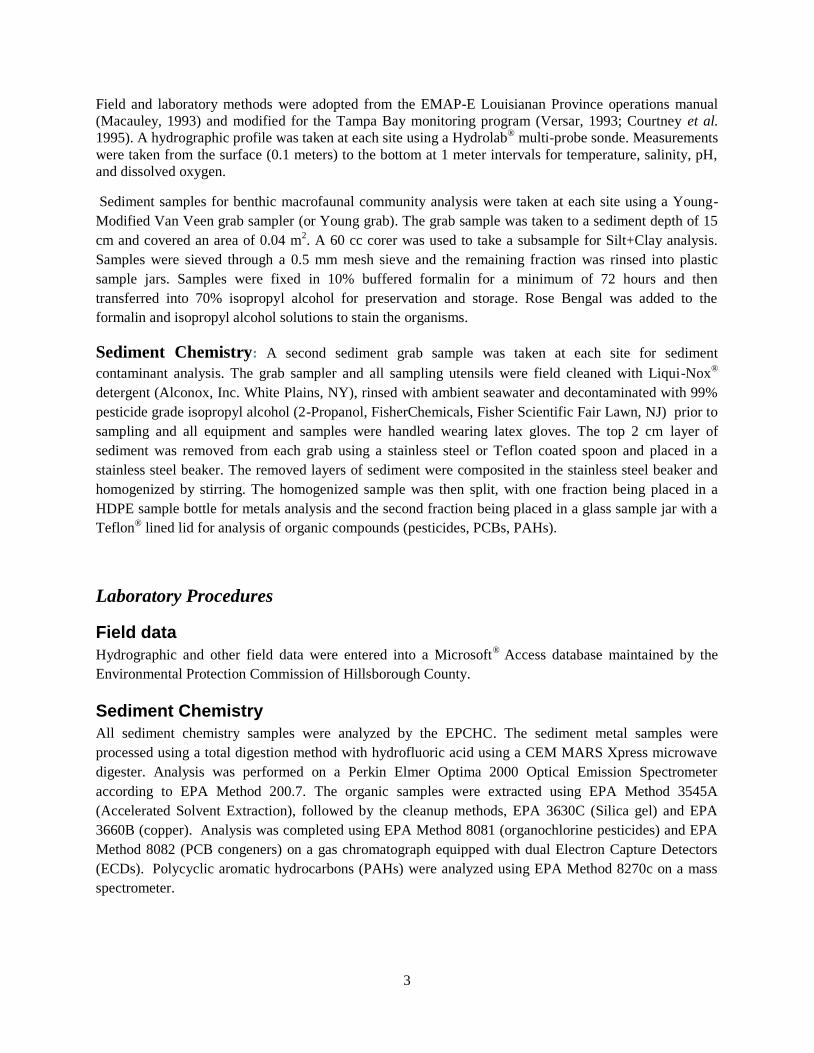
Field and laboratory methods were adopted from the EMAP-E Louisianan Province operations manual
(Macauley, 1993) and modified for the Tampa Bay monitoring program (Versar, 1993; Courtney et al.
1995). A hydrographic profile was taken at each site using a Hydrolab® multi-probe sonde. Measurements
were taken from the surface (0.1 meters) to the bottom at 1 meter intervals for temperature, salinity, pH,
and dissolved oxygen.
Sediment samples for benthic macrofaunal community analysis were taken at each site using a Young-
Modified Van Veen grab sampler (or Young grab). The grab sample was taken to a sediment depth of 15
cm and covered an area of 0.04 m2. A 60 cc corer was used to take a subsample for Silt+Clay analysis.
Samples were sieved through a 0.5 mm mesh sieve and the remaining fraction was rinsed into plastic
sample jars. Samples were fixed in 10% buffered formalin for a minimum of 72 hours and then
transferred into 70% isopropyl alcohol for preservation and storage. Rose Bengal was added to the
formalin and isopropyl alcohol solutions to stain the organisms.
Sediment Chemistry: A second sediment grab sample was taken at each site for sediment
contaminant analysis. The grab sampler and all sampling utensils were field cleaned with Liqui-Nox®
detergent (Alconox, Inc. White Plains, NY), rinsed with ambient seawater and decontaminated with 99%
pesticide grade isopropyl alcohol (2-Propanol, FisherChemicals, Fisher Scientific Fair Lawn, NJ) prior to
sampling and all equipment and samples were handled wearing latex gloves. The top 2 cm layer of
sediment was removed from each grab using a stainless steel or Teflon coated spoon and placed in a
stainless steel beaker. The removed layers of sediment were composited in the stainless steel beaker and
homogenized by stirring. The homogenized sample was then split, with one fraction being placed in a
HDPE sample bottle for metals analysis and the second fraction being placed in a glass sample jar with a
Teflon® lined lid for analysis of organic compounds (pesticides, PCBs, PAHs).
Laboratory Procedures
Field data
Hydrographic and other field data were entered into a Microsoft® Access database maintained by the
Environmental Protection Commission of Hillsborough County.
Sediment Chemistry
All sediment chemistry samples were analyzed by the EPCHC. The sediment metal samples were
processed using a total digestion method with hydrofluoric acid using a CEM MARS Xpress microwave
digester. Analysis was performed on a Perkin Elmer Optima 2000 Optical Emission Spectrometer
according to EPA Method 200.7. The organic samples were extracted using EPA Method 3545A
(Accelerated Solvent Extraction), followed by the cleanup methods, EPA 3630C (Silica gel) and EPA
3660B (copper). Analysis was completed using EPA Method 8081 (organochlorine pesticides) and EPA
Method 8082 (PCB congeners) on a gas chromatograph equipped with dual Electron Capture Detectors
(ECDs). Polycyclic aromatic hydrocarbons (PAHs) were analyzed using EPA Method 8270c on a mass
spectrometer.

4
Benthic Community Analysis
Benthic sorting and identification work was conducted by EPCHC staff. Benthic sediment samples were
rough sorted under a dissecting microscope into general taxonomic categories (Annelids, Molluscs,
Crustaceans, and Miscellaneous Taxa). Resorting was done on 10% of the samples completed by each
technician for QA/QC. The sorted animals were identified to the lowest practical taxonomic level
(species level when possible) and counted. Taxonomic identifications were conducted using available
identification keys and primary scientific literature. All identification and count data were recorded on
laboratory bench sheets and entered into a Microsoft Access® database maintained by the EPCHC.
Data Analysis
Data Categorization
Potential toxicity levels for sediment contaminants followed the sediment quality guidelines established
for Florida coastal waters and utilized the Threshold Effects Levels (TELs) and Probable Effects Levels
(PELs) established for individual contaminants (MacDonald 1994; MacDonald et al. 1996). The
metal:aluminum ratio was used to determine if individual sediment metals were elevated relative to
background levels (Schropp et al. 1990). The Tampa Bay Benthic Index (TBBI) was calculated for each
site following the methods established in Janicki Environmental (2005) and Malloy et al. (2007). The
TBBI threshold scores for “Degraded” ( < 73), “Intermediate” (between 73 to 87) and “Healthy” (> 87 )
benthic habitats were established by Janicki Environmental (2005) and Malloy et al. (2007) .
Univariate Statistical Analysis
Parametric and non-parametric statistical analysis was done with SigmaStat ® 3.5 (SYSTAT Software,
Inc. 2006a). Data were transformed for normality where needed for the parametric tests. Analysis of
Variance (ANOVA) with a Holm-Sidak method pair-wise post hoc test was used to test for differences
between sampling events. Where the assumptions of the ANOVA could not be met by the data
transformation, a non-parametric Kruskal Wallace test was used along with a Dunn’s Pairwise Multiple
Comparison test.
Multivariate Statistical Analysis and Benthic Community Indices
PRIMER v6 software (PRIMER-E, Ltd. 2006; Clarke and Gorley 2006) was used for all multivariate
statistical analysis and for calculating univariate biological metrics (species richness, abundance, Shannon
diversity index and Simpson diversity index). Species richness (S) was defined as the total number of
taxa. Abundance (N) was expressed as the number of individuals per m2 (calculated as the raw count x
25) except for colonial organisms which were counted as present/absent. The Shannon diversity index
(H’) calculations employed the natural logarithm opposed to log base 2 (Clarke and Warwick 2001). The
zero-adjusted Bray-Curtis similarity (Clarke et al. 2006) was calculated on square root transformed
abundance data and the resulting similarity matrix was used for running Cluster Analysis, Non-metric
Multi-Dimensional Scaling (MDS), Similarity Percentage (SIMPER), and Analysis of Similarity
(ANOSIM). The BIO-ENV procedure (Clarke and Ainsworth 1993) was used to find correlations
between the environmental parameters and benthic community structure. All environmental parameters
were normalized and log transformed prior to analysis.

5
Comparison with 2001 FDEP Samples
Only the six 2008 sites which corresponded to the 2001 FDEP sites were used in the analysis. In order to
compare the 2008 Clam Bayou benthic community results with the results from the 2001 FDEP survey,
the 2008 species identifications were modified to more closely match the 2001 species list. Modifications
to the dataset included eliminating taxonomic groups which were not identified by the FDEP (e.g.
Bryozoa), updating taxonomic names in the 2001 dataset to match the current taxonomic nomenclature,
and contracting some of the 2008 identifications to a higher taxonomic level (e.g. Nemertea) to match the
2001 species list.
The FDEP raw count data was converted to densities (#/m2) to standardize it with the 2008 data. The
FDEP samples were collected with a smaller grab sampler (petite ponar) and each sample was a
composite of three combined grabs. The total surface area sampled was calculated as the area of the petite
ponar grab (0.023m2 x 3 = 0.069m2) and the raw counts were converted to densities by multiply by 14.5.
The modified dataset was then used to recalculate the benthic community indices and for further
comparative analysis.
Spatial and Graphical Analysis
Graphs were generated using SigmaPlot® 10.0 software (Systat Software, Inc. 2006b). Maps were
generated by the Environmental Protection Commission of Hillsborough County using ArcGIS 9.2 (ESRI
2006).

6
Results
Benthic Macrofaunal Community Analysis
Cluster analysis arranged the ten sites into five distinct groups (Figures 1 and 2). The red branches of the
dendrogram display the results from a similarity profile (SIMPROF) test and indicate statistically
significant groupings of sites (Clarke and Gorley 2006). The first group, designated as group “A”,
consisted of sites 08CLB02 and 08CLB03. The remaining eight sites formed group “B” which was
further divided into groups “B1” and “B2”. The “B1” group split into two additional subgroups: Group
“B1a” consisting of site 08CLB05; and Group “B1b” consisting of sites 08CLB04, 08CLB01, and
08CLB12. Group “B2” also split into two subgroups designated as “B2a” and “B2b”. Group “B2a”
consisted of sites 08CLB06 and 08CLB08 while Group “B2b” consisted of sites 08CLB07 and 08CLB10.
Further details on this analysis will be presented below. The organization of the following data tables and
figures in this report are based on these site groupings.
A total of 108 taxa were identified in the 2008 Clam Bayou samples (excluding unidentified
damaged/juvenile Gastropoda, Bivalvia and Tellininae) (Appendix A). The polychaete Mediomastus sp.
also is not included in this total since it may represent incomplete specimens of M. californiensis which
was also present. Polychaetes were the most speciose taxonomic group with 41 taxa identified (38% of
the total). Bivalves and Gastropods were the next most speciose groups with 19 and 15 taxa respectively.
Species richness (S) ranged from 2 taxa at site 08CLB02 to 44 taxa at site 08CLB06 (Table 1; Figure 3)
with a median of 27 taxa/site. The Group “A” sites had the lowest species richness while the highest
numbers of taxa were present within the B2 group (Table 1; Figure 3).
The overall abundance (raw count) was 1,745 individual organisms. Oligochaetes (Tubificinae) were the
dominate taxon, accounting for 13.41% of the abundance followed by the polychaete Laeonereis culveri
and an unidentified gastropod (Rissooidea) with each accounting for 9.8% of the abundance.
Sample densities (N) ranged from 225/m2 at site 08CLB03 to 9,625/m2 at site 08CLB04 (Table 1) with a
median value of 3,763/m2. The lowest abundances were at the Group “A” sites and the highest
abundances were within the B1 group sites (Table 1; Figure 4).
Two indices were calculated to evaluate the species diversity at the Clam Bayou sites: the
Shannon (or Shannon – Wiener) diversity index (H’), and the Simpson index (expressed as 1-λ’).
Both indices are based on the proportional abundance of each species present in the sample
(Clarke and Warwick 2001). The species diversity indices generally followed the same trend that
was observed with species richness, with lowest values at the two Group “A” sites and highest
values at the Group “B2a” sites (Table 1, Figure 5 & Figure 6). The Tampa Bay Benthic Index
(TBBI) scores were generally near or below the “Degraded” threshold value of 73 and none were
above the “Healthy” threshold value of 87 (Table 1). The lowest TBBI scores were at the B2a
sites, despite relatively high species richness and diversity values at these two locations (Table
1).

7
Clam Bayou 2008 Special StudyBenthic Macroinvertebrate Similarity
08
CL
B0
2
08
CL
B0
3
08
CL
B0
5
08
CL
B0
4
08
CL
B0
1
08
CL
B1
2
08
CL
B0
6
08
CL
B0
8
08
CL
B0
7
08
CL
B1
0
Samples
100
80
60
40
20
0
Sim
ilari
ty
Transform: Square root
Resemblance: S17 Bray Curtis similarity (+d)
A B
B1 B2
B1a B1b
B2a B2b
Figure 2 Bray-Curtis Similarity dendrogram of 2008 TBEP Clam Bayou sampling sites.

8
Table 1 Clam Bayou 2008 benthic community summary metrics.
Bray-Curtis
Similarity
Grouping
A
B
B1 B2
B1a B1b B2a B2b
Site 08CLB02 08CLB03 08CLB05 08CLB04 08CLB01 08CLB12 08CLB06 08CLB08 08CLB07 08CLB10
Species Richness
(S)
[number of taxa]
2 5 14 30 24 31 44 32 42 22
Abundance (N)
[Density = #/m2]
650 225 9425 9625 3750 4900 5601 3776 3750 1925
Shannon-Wiener
Diversity
H'(loge)
0.16 1.30 1.92 2.38 2.82 2.97 3.17 3.01 2.89 2.70
Simpson Index
(1-λ')
0.07 0.64 0.76 0.84 0.93 0.93 0.94 0.93 0.90 0.91
Tampa Bay
Benthic Index 64.69 72.38 76.38 72.24 76.61 71.70 62.75 38.56 84.86 81.51

9
2008 Clam Bayou
Sample
08CLB
02
08CLB
03
08CLB
05
08CLB
01
08CLB
04
08CLB
12
08CLB
06
08CLB
08
08CLB
07
08CLB
10
Nu
mb
er
of
Ta
xa
(S
)
0
10
20
30
40
50
A
B1a
B1b
B2a
B2b
Figure 3 Clam Bayou 2008 benthic species richness.
2008 Clam Bayou
Sample
08CLB
02
08CLB
03
08CLB
05
08CLB
01
08CLB
04
08CLB
12
08CLB
06
08CLB
08
08CLB
07
08CLB
10
Ab
un
da
nce
(N
= #
/m2)
0
1000
2000
3000
4000
5000
6000
7000
8000
9000
10000
A
B1a
B1b
B2a
B2b
Figure 4 Clam Bayou 2008 benthic abundance.

10
2008 Clam Bayou
Sample
08CLB
02
08CLB
03
08CLB
05
08CLB
01
08CLB
04
08CLB
12
08CLB
06
08CLB
08
08CLB
07
08CLB
10
Sha
nn
on
Div
ers
ity I
nd
ex
H' (log
e)
0.0
0.5
1.0
1.5
2.0
2.5
3.0
3.5
A
B1a
B1b
B2a
B2b
Figure 5 Clam Bayou 2008 Shannon diversity index.
2008 Clam Bayou
Sample
08CLB
02
08CLB
03
08CLB
05
08CLB
01
08CLB
04
08CLB
12
08CLB
06
08CLB
08
08CLB
07
08CLB
10
Sim
pson
's D
ivers
ity I
nd
ex (
1-
0.0
0.2
0.4
0.6
0.8
1.0
A
B1a
B1b
B2a
B2b
Figure 6 Clam Bayou 2008 Simpson’s diversity index.

11
The dominate taxa based on relative abundance at each site are presented in Table 2. Unidentified
tubificinae oligochaetes were dominate at both Group “A” sites, however the low species richness and
abundances at those sites did inflate the relative abundance values at those sites. The single site in Group
“B1a” was dominated by unidentified Rissooidea gastropods, which comprised nearly 45% of the relative
abundance at that site (Table 2). The three sites that comprise Group “B1b” had an average Bray-Curtis
similarity of 56% and all were characterized by relatively high abundances of the polychaete Laeonereis
culveri, although it was not the most abundant species. The similarity among these sites was also due to
the presence of the gastropod Acteocina canaliculata. Site 08CLB04 was the least diverse of these sites,
although it had relatively high species richness and the highest abundance (Table 1). This site was
dominated by unidentified tubificinae oligochaetes and L. culveri which together accounted for over 52%
of the relative abundance at that site (Table 2). Site 08CLB01 was unique in that it was dominated by
aquatic insect larvae (Dolichopodidae). The two Group “B2a” sites had an average Bray-Curtis similarity
of 48% and were characterized by the polychaete Prionospio heterobranchia. Site 08CLB06 was
dominated by Laeonereis culveri and the isopod crustacean Erichsonella attenuate, which each comprised
12.5% of the relative abundance. Site 08CLB08 was dominated by polychaetes and oligochaetes, with the
polychaetes Capitella capitata and Prionospio heterobranchia accounting for over 25% of the relative
abundance combined (Table 2). The two Group “B2b” sites were largely represented by bivalve mollusks
along with polychaetes and oligochaetes. Site 08CLB07 was dominated by the polychaete Monticellina
dorsobranchialis, which made up 24% of the relative abundance. Unidentified juvenile or damaged
bivalve mollusks dominated site 08CLB10 along with the oligochaete Tubificoides wasselli and the
bivalves Mysella planulata and Macoma cerina (Table 2).
Physical Parameters
The water quality measurements and silt/clay results are presented in Table 3. The site depths ranged
from 0.42 to 1.26 meters with a median value of 0.9 meters. The Group “A” and B2b sites tended to be
deeper relative to the other Clam Bayou sites (Table 3; Figure 7). Bottom water temperatures ranged from
25.9 to 31.7°C (Table 3). The lower temperature measurements were at the sites sampled on 26
September 2008. Bottom salinities ranged between 33.18 to 35.61 psu with a median of 34.4 psu. The
salinities were highest at the B2a sites near the mouth of Clam Bayou (Table 3; Figure 8). The bottom
dissolved oxygen ranged from 1.61 to 6.14 mg/l with a median value of 3.53 mg/l. Most of the sites had
dissolved oxygen values which were above the 2 mg/l threshold for hypoxia, but fell below the 4 mg/l
threshold for normoxic conditions (Figure 9). Only site 08CLB05 had a dissolved oxygen level in the
hypoxic range (Table 3; Figure 9). The highest dissolved oxygen levels were at the two B2a sites (Table
3; Figure 9). Bottom pH levels were below the normal value for seawater (~ 8) at most of the Clam Bayou
sites and ranged between 7.6 and 8.24 with a median value of 7.91. The lowest pH occurred at site
08CLB05 while pHs were highest at the B2a sites (Table 3; Figure 10). The percent silt+clay values
ranged from 2.2 to 51.3% with a median value of 8.7%. The highest silt+clay values were at the Group
“A” sites (Table 3; Figure 11). The percent silt+clay values were also relatively high at site 08CLB10
while the remaining sites all had values well below 25% (Table 3; Figure 11).

12
Table 2 Clam Bayou 2008 relative abundance of benthic taxa.
A
B
B1 B2
B1a B1b B2a B2b
08CLB02 08CLB03 08CLB05 08CLB04 08CLB01 08CLB12 08CLB06 08CLB08 08CLB07 08CLB10
Tubificinae
(96.15%)
Tubificinae
(55.56%)
Rissooidea
(44.83%)
Tubificinae
(32.31%)
Dolichopodidae
(13.33%)
Xenanthura
brevitelson
(13.27%)
Laeonereis
culveri
(12.50%)
Capitella capitata
spp. complex
(13.24%)
Monticellina
dorsobranchialis
(24.00%)
Bivalvia
(16.88%)
Tubificinae
(11.67%)
Laeonereis
culveri
(19.74%)
Laeonereis
culveri
(10.67%)
Acteocina
canaliculata
(9.69%)
Erichsonella
attenuate
(12.50%)
Prionospio
heterobranchia
(11.92%)
Eurytellina sp. A
of EPC
(13.33%)
Tubificoides
wasselli
(14.29%)
Acteocina
canaliculata
(9.33%)
Laeonereis
culveri
(9.18%)
Heteromastus
filiformis
(10.71%)
Tubificinae
(8.61%)
Tellininae
(12.67%)
Mysella
planulata
(10.39%)
Eurytellina sp. A
of EPC
(9.33%)
Parastarte
triquetra
(9.18%)
Prionospio
heterobranchia
(7.59%)
Mediomastus sp.
(7.28%)
Macoma
cerina
(9.09%)
Actiniaria
(8.00%)
Heteromastus
filiformis
(7.14%)
Erycina
floridana
(4.91%)
Tubificoides
wasselli
(6.62%)
Leitoscoloplos
foliosus
(6.12%)
Magelona
pettiboneae
(4.46%)
Monticellina
dorsobranchialis
(5.96%)

13
Table 3 Clam Bayou 2008 bottom physical and sediment parameters.
Bray-Curtis Similarity Grouping A
B
B1 B2
B1a B1b B2a B2b
Site 08CLB02 08CLB03 08CLB05 08CLB04 08CLB01 08CLB12 08CLB06 08CLB08 08CLB07 08CLB10
Depth (meters) 1.08 1.26 0.49 0.82 0.55 0.42 0.80 0.98 1.20 1.14
Bottom Temp. (°C) 30.53 25.89 28.35 28.37 30.91 31.73 26.95 27.11 31.06 28.48
Bottom Salinity (psu) 34.34 35.28 33.87 34.46 33.71 33.18 35.61 35.53 33.85 34.74
Bottom Dissolved Oxygen (mg/l) 3.33 4.06 1.61 2.19 3.25 3.90 6.14 5.34 3.72 2.42
Bottom pH 7.91 8.03 7.60 7.68 7.90 7.94 8.24 8.20 7.81 7.73
% SILT+CLAY 44.2 51.3 7.1 3.2 8.4 9.0 15.8 2.2 6.2 37.2

14
2008 Clam Bayou
Sample
08CLB
02
08CLB
03
08CLB
05
08CLB
01
08CLB
04
08CLB
12
08CLB
06
08CLB
08
08CLB
07
08CLB
10
De
pth
(m
ete
rs)
0.0
0.2
0.4
0.6
0.8
1.0
1.2
1.4
A
B1a
B1b
B2a
B2b
Mean Depth
Figure 7 Clam Bayou 2008 sample depth.
2008 Clam Bayou
Sample
08CLB
02
08CLB
03
08CLB
05
08CLB
01
08CLB
04
08CLB
12
08CLB
06
08CLB
08
08CLB
07
08CLB
10
Salin
ity (
psu)
30
31
32
33
34
35
36
37
38
A
B1a
B1b
B2a
B2b
Mean Salinity
Figure 8 Clam Bayou 2008 bottom salinities.

15
2008 Clam Bayou
Sample
08CLB
02
08CLB
03
08CLB
05
08CLB
01
08CLB
04
08CLB
12
08CLB
06
08CLB
08
08CLB
07
08CLB
10
Dis
so
lve
d O
xyge
n (
mg/l)
0
1
2
3
4
5
6
7
A
B1a
B1b
B2a
B2b
Normoxic > 4 mg/l
Hypoxic < 2 mg/l
Figure 9 Clam Bayou 2008 bottom dissolved oxygen.
2008 Clam Bayou
Sample
08CLB
02
08CLB
03
08CLB
05
08CLB
01
08CLB
04
08CLB
12
08CLB
06
08CLB
08
08CLB
07
08CLB
10
pH
6.0
6.5
7.0
7.5
8.0
8.5
9.0
A
B1a
B1b
B2a
B2b
Mean pH
Figure 10 Clam Bayou 2008 bottom pH.

16
2008 Clam Bayou
Sample
08CLB
02
08CLB
03
08CLB
05
08CLB
01
08CLB
04
08CLB
12
08CLB
06
08CLB
08
08CLB
07
08CLB
10
% S
ilt +
Cla
y
0
10
20
30
40
50
60
A
B1a
B1b
B2a
B2b
Silt + Clay > 25%
Figure 11 Clam Bayou 2008 sediment percent silt + clay.

17
Sediment Contaminants
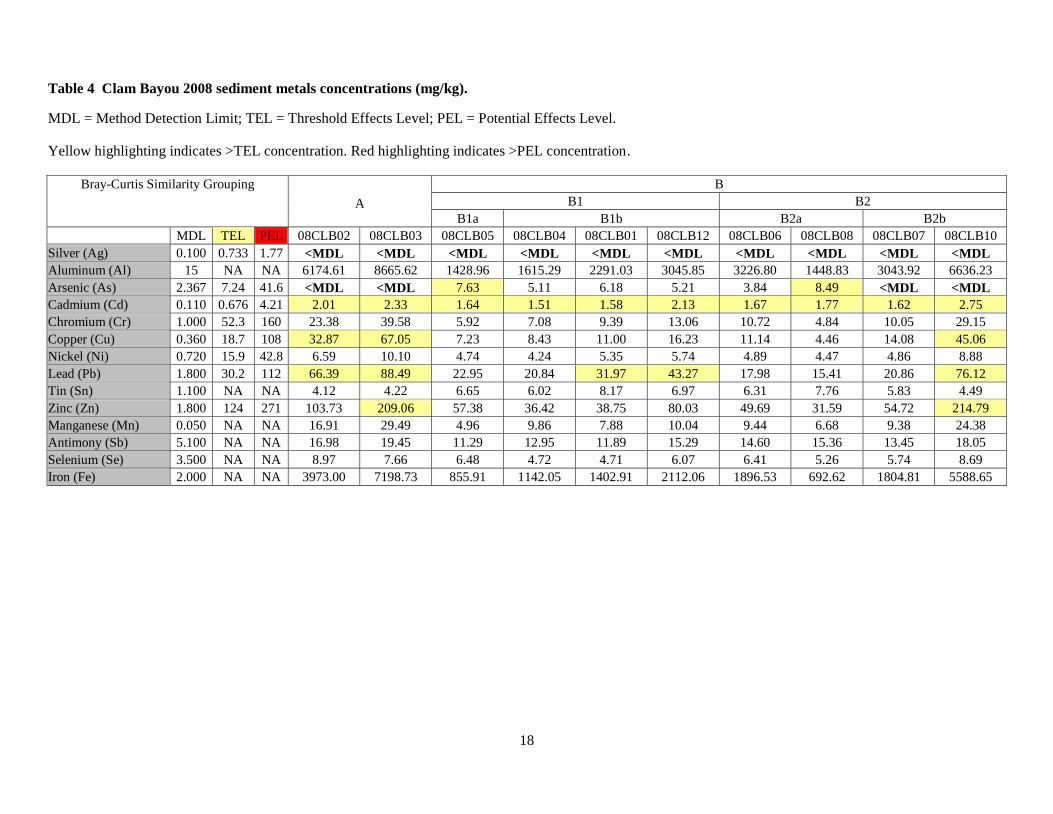
The results from the metals analysis are presented in Table 4. All of the metal:aluminum regressions
shown in Figure 12 suggest that the metals concentrations in Clam Bayou were not elevated above natural
levels. Generally, metals values were highest at the two Group “A” sites and at site 08CLB10. Most
metals were below their established TEL concentrations with a few exceptions and silver was below the
method detection limit (<MDL) at all sites. Arsenic was above its TEL at sites 08CLB05 and 08CLB08,
but was <MDL at both of the Group “A” and Group “B2b” sites. Cadmium was above its TEL at all ten
sites, however the Cd:Al regression (Figure 12) did not indicate that these levels were anthropogenically
enriched. Copper and lead were above their TEL concentrations at both Group “A” sites and at 08CLB10.
Lead also exceeded its TEL at two of the Group B1b sites: 08CLB01 and 08CLB12. Zinc was above its
TEL at 08CLB03 and 08CLB10.
Polychlorinated Biphenyls (PCBs) concentrations are shown in Table 5 and Figure 13. The Total PCB
concentrations were above the established TEL at four sites including 08CLB05, 08CLB06, and both of
the Group B2b sites (08CLB07 and 08CLB10).
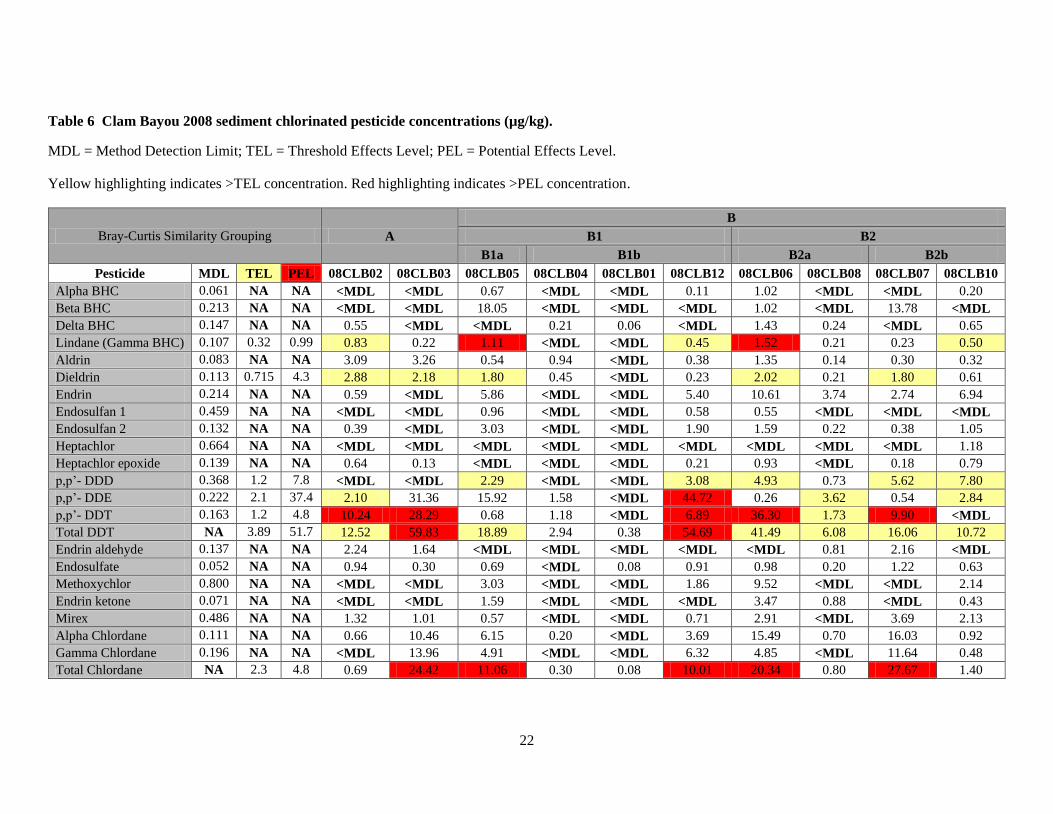
Chlorinated pesticide concentrations are shown in Table 6. Only seven of the measured pesticides have
established sediment quality guidelines and eight of the ten sites showed elevated levels for several of
these pesticides. The two sites that did not have high pesticide levels (08CLB04 and 08CLB01) both were
in the B1b similarity group (Table 6). Lindane levels were high at half of the sites and exceeded the PEL
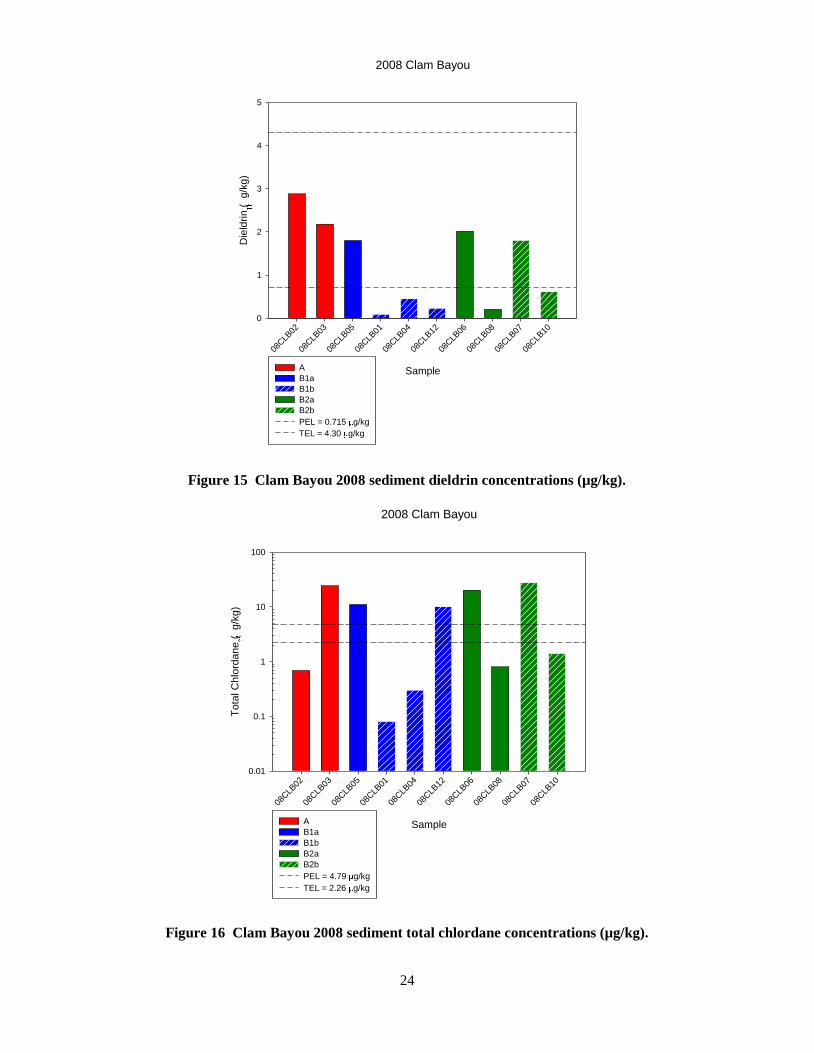
at sites 08CLB05 and 08CLB06 (Table 6; Figure 14). Dieldrin concentrations were above its TEL at five
sites, but did not have any PEL exceedences (Table 6; Figure 15). Total Chlordane exceeded its PEL at
five sites (Table 6; Figure 16). DDT or one of its breakdown compounds (p,p’-DDT, DDE, DDD) were
elevated at eight of the ten sites with highest concentrations at 08CLB03 and 08CLB12 (Table 6; Figures
17-20).
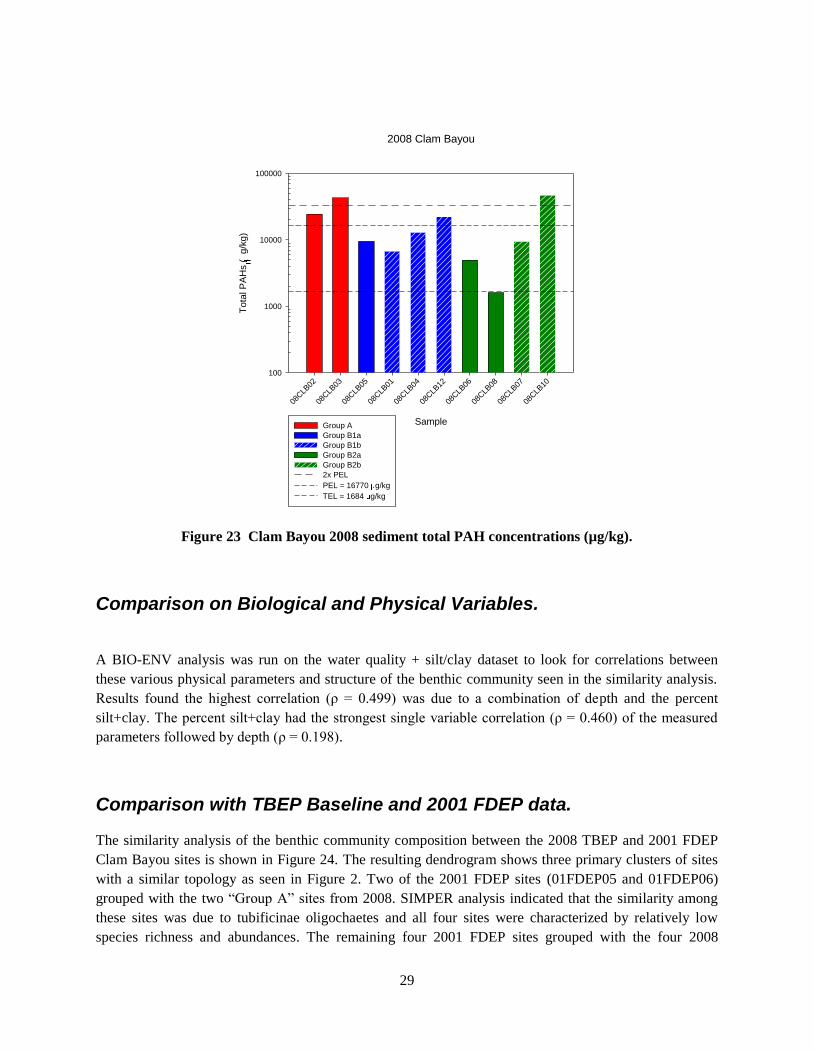
Polycyclic aromatic hydrocarbons (PAHs) exhibited high concentrations at all sites (Table 7). Low
molecular weight PAH (LMW PAH) levels were generally lower than the high molecular weight PAH
(HMW PAH) levels (Table 6). The total LMW PAHs exceeded its PEL at three sites and had highest
concentrations at sites 08CLB10 and 08CLB03 (Table 6; Figure 21). The LMW PAH phenanthrene was
particularly high and was above its PEL at six sites (Table 6). The six constituent HMW PAHs all
exceeded their PEL concentrations at eight or nine of the ten sites (Table 6) and the total HMW PAH
levels were above its PEL at seven sites and exceeded its TEL at the remaining three sites (Table 6;
Figure 22). Total PAHs (sum of the LMW and HMW PAHs) exceeded the TEL at five sites and the PEL
at four sites (Table 6; Figure 23). Sites 08CLB03 and 08CLB10 had the highest PAH levels overall, and
concentrations at both of these sites were twice the PEL concentration for total PAHs (Table 6; Figure
23). Site 08CLB08 was the only site which did not exceed the SQG for total PAHs. The LMW PAHs at
this site were generally low with only anthracene being above the TEL concentration, while all of the
HMW PAHs exceeded their TELs, none were above their PEL concentrations at this site (Table 6).
18
Table 4 Clam Bayou 2008 sediment metals concentrations (mg/kg).
MDL = Method Detection Limit; TEL = Threshold Effects Level; PEL = Potential Effects Level.
Yellow highlighting indicates >TEL concentration. Red highlighting indicates >PEL concentration.
Bray-Curtis Similarity Grouping
A
B
B1 B2
B1a B1b B2a B2b
MDL TEL PEL 08CLB02 08CLB03 08CLB05 08CLB04 08CLB01 08CLB12 08CLB06 08CLB08 08CLB07 08CLB10
Silver (Ag) 0.100 0.733 1.77 <MDL <MDL <MDL <MDL <MDL <MDL <MDL <MDL <MDL <MDL
Aluminum (Al) 15 NA NA 6174.61 8665.62 1428.96 1615.29 2291.03 3045.85 3226.80 1448.83 3043.92 6636.23
Arsenic (As) 2.367 7.24 41.6 <MDL <MDL 7.63 5.11 6.18 5.21 3.84 8.49 <MDL <MDL
Cadmium (Cd) 0.110 0.676 4.21 2.01 2.33 1.64 1.51 1.58 2.13 1.67 1.77 1.62 2.75
Chromium (Cr) 1.000 52.3 160 23.38 39.58 5.92 7.08 9.39 13.06 10.72 4.84 10.05 29.15
Copper (Cu) 0.360 18.7 108 32.87 67.05 7.23 8.43 11.00 16.23 11.14 4.46 14.08 45.06
Nickel (Ni) 0.720 15.9 42.8 6.59 10.10 4.74 4.24 5.35 5.74 4.89 4.47 4.86 8.88
Lead (Pb) 1.800 30.2 112 66.39 88.49 22.95 20.84 31.97 43.27 17.98 15.41 20.86 76.12
Tin (Sn) 1.100 NA NA 4.12 4.22 6.65 6.02 8.17 6.97 6.31 7.76 5.83 4.49
Zinc (Zn) 1.800 124 271 103.73 209.06 57.38 36.42 38.75 80.03 49.69 31.59 54.72 214.79
Manganese (Mn) 0.050 NA NA 16.91 29.49 4.96 9.86 7.88 10.04 9.44 6.68 9.38 24.38
Antimony (Sb) 5.100 NA NA 16.98 19.45 11.29 12.95 11.89 15.29 14.60 15.36 13.45 18.05
Selenium (Se) 3.500 NA NA 8.97 7.66 6.48 4.72 4.71 6.07 6.41 5.26 5.74 8.69
Iron (Fe) 2.000 NA NA 3973.00 7198.73 855.91 1142.05 1402.91 2112.06 1896.53 692.62 1804.81 5588.65

19
2008 Clam Bayou
Aluminum (mg/kg)
1000 10000
Ca
dm
ium
(m
g/k
g)
0.1
1
10
2008 Clam Bayou
Aluminum (mg/kg)
1000 10000
Ch
rom
ium
(m
g/k
g)
1
10
100
1000
2008 Clam Bayou
Aluminum (mg/kg)
1000 10000
Co
pp
er
(mg/k
g)
1
10
100
1000
2008 Clam Bayou
Aluminum (mg/kg)
1000 10000
Ma
nga
ne
se
(m
g/k
g)
1
10
100
2008 Clam Bayou
Aluminum (mg/kg)
1000 10000
Nic
ke
l (m
g/k
g)
1
10
100

20
2008 Clam Bayou
Aluminum (mg/kg)
1000 10000
Le
ad
(m
g/k
g)
1
10
100
1000
2008 Clam Bayou
Aluminum (mg/kg)
1000 10000
An
tim
on
y (
mg/k
g)
1
10
100
2008 Clam Bayou
Aluminum (mg/kg)
1000 10000
Se
len
ium
(m
g/k
g)
1
10
100
2008 Clam Bayou
Aluminum (mg/kg)
1000 10000
Tin
(m
g/k
g)
1
10
100
2008 Clam Bayou
Aluminum (mg/kg)
1000 10000
Zin
c (
mg/k
g)
10
100
1000
Figure 12 Clam Bayou 2008 metals:aluminum regressions.

21
Table 5 Clam Bayou 2008 sediment PCB congener and total PCB concentrations (µg/kg).
MDL = Method Detection Limit; TEL = Threshold Effects Level; PEL = Potential Effects Level.
Yellow highlighting indicates >TEL concentration. Red highlighting indicates >PEL concentration.
Bray-Curtis Similarity Grouping A
B
B1 B2
B1a B1b B2a B2b
Congener MDL TEL PEL 08CLB02 08CLB03 08CLB05 08CLB04 08CLB01 08CLB12 08CLB06 08CLB08 08CLB07 08CLB10
PCB_8 0.511 NA NA 1.08 0.78 1.43 <MDL <MDL <MDL <MDL <MDL <MDL <MDL
PCB_18 0.453 NA NA 1.54 1.64 <MDL <MDL <MDL <MDL <MDL <MDL <MDL <MDL
PCB_28 0.412 NA NA 0.55 0.38 <MDL <MDL <MDL <MDL <MDL <MDL <MDL <MDL
PCB_44 0.354 NA NA <MDL <MDL <MDL <MDL 1.62 <MDL <MDL <MDL <MDL <MDL
PCB_52 0.340 NA NA <MDL <MDL <MDL <MDL <MDL <MDL 12.66 <MDL <MDL 4.33
PCB_66 0.272 NA NA 4.87 4.13 <MDL 0.93 <MDL <MDL 1.57 <MDL 0.30 2.79
PCB_101 0.319 NA NA <MDL 0.32 7.65 <MDL <MDL 4.01 0.70 0.53 9.04 1.60
PCB_105 0.258 NA NA 5.47 3.53 0.36 0.55 <MDL 1.96 3.62 <MDL 7.65 15.78
PCB_118 0.283 NA NA 1.27 1.02 1.20 0.06 0.07 1.59 1.87 <MDL 10.15 0.70
PCB_153 0.349 NA NA 2.10 1.57 <MDL 0.08 <MDL 1.55 <MDL 0.64 5.35 9.54
PCB_170 0.354 NA NA 1.21 1.12 2.69 <MDL <MDL 1.48 9.34 0.64 7.34 23.78
PCB_180 0.403 NA NA 0.88 <MDL 2.00 <MDL <MDL 1.90 5.12 0.60 3.09 11.85
PCB_195 1.341 NA NA <MDL <MDL 2.27 <MDL <MDL <MDL 4.47 <MDL <MDL 2.06
PCB_206 0.153 NA NA <MDL <MDL 8.04 <MDL <MDL 4.19 2.91 <MDL 1.86 4.48
Total PCB NA 21.6 189 19.96 15.78 26.73 3.93 3.53 18.52 43.30 4.60 46.49 77.78
22
Table 6 Clam Bayou 2008 sediment chlorinated pesticide concentrations (µg/kg).
MDL = Method Detection Limit; TEL = Threshold Effects Level; PEL = Potential Effects Level.
Yellow highlighting indicates >TEL concentration. Red highlighting indicates >PEL concentration.
Bray-Curtis Similarity Grouping A
B
B1 B2
B1a B1b B2a B2b
Pesticide MDL TEL PEL 08CLB02 08CLB03 08CLB05 08CLB04 08CLB01 08CLB12 08CLB06 08CLB08 08CLB07 08CLB10
Alpha BHC 0.061 NA NA <MDL <MDL 0.67 <MDL <MDL 0.11 1.02 <MDL <MDL 0.20
Beta BHC 0.213 NA NA <MDL <MDL 18.05 <MDL <MDL <MDL 1.02 <MDL 13.78 <MDL
Delta BHC 0.147 NA NA 0.55 <MDL <MDL 0.21 0.06 <MDL 1.43 0.24 <MDL 0.65
Lindane (Gamma BHC) 0.107 0.32 0.99 0.83 0.22 1.11 <MDL <MDL 0.45 1.52 0.21 0.23 0.50
Aldrin 0.083 NA NA 3.09 3.26 0.54 0.94 <MDL 0.38 1.35 0.14 0.30 0.32
Dieldrin 0.113 0.715 4.3 2.88 2.18 1.80 0.45 <MDL 0.23 2.02 0.21 1.80 0.61
Endrin 0.214 NA NA 0.59 <MDL 5.86 <MDL <MDL 5.40 10.61 3.74 2.74 6.94
Endosulfan 1 0.459 NA NA <MDL <MDL 0.96 <MDL <MDL 0.58 0.55 <MDL <MDL <MDL
Endosulfan 2 0.132 NA NA 0.39 <MDL 3.03 <MDL <MDL 1.90 1.59 0.22 0.38 1.05
Heptachlor 0.664 NA NA <MDL <MDL <MDL <MDL <MDL <MDL <MDL <MDL <MDL 1.18
Heptachlor epoxide 0.139 NA NA 0.64 0.13 <MDL <MDL <MDL 0.21 0.93 <MDL 0.18 0.79
p,p’- DDD 0.368 1.2 7.8 <MDL <MDL 2.29 <MDL <MDL 3.08 4.93 0.73 5.62 7.80
p,p’- DDE 0.222 2.1 37.4 2.10 31.36 15.92 1.58 <MDL 44.72 0.26 3.62 0.54 2.84
p,p’- DDT 0.163 1.2 4.8 10.24 28.29 0.68 1.18 <MDL 6.89 36.30 1.73 9.90 <MDL
Total DDT NA 3.89 51.7 12.52 59.83 18.89 2.94 0.38 54.69 41.49 6.08 16.06 10.72
Endrin aldehyde 0.137 NA NA 2.24 1.64 <MDL <MDL <MDL <MDL <MDL 0.81 2.16 <MDL
Endosulfate 0.052 NA NA 0.94 0.30 0.69 <MDL 0.08 0.91 0.98 0.20 1.22 0.63
Methoxychlor 0.800 NA NA <MDL <MDL 3.03 <MDL <MDL 1.86 9.52 <MDL <MDL 2.14
Endrin ketone 0.071 NA NA <MDL <MDL 1.59 <MDL <MDL <MDL 3.47 0.88 <MDL 0.43
Mirex 0.486 NA NA 1.32 1.01 0.57 <MDL <MDL 0.71 2.91 <MDL 3.69 2.13
Alpha Chlordane 0.111 NA NA 0.66 10.46 6.15 0.20 <MDL 3.69 15.49 0.70 16.03 0.92
Gamma Chlordane 0.196 NA NA <MDL 13.96 4.91 <MDL <MDL 6.32 4.85 <MDL 11.64 0.48
Total Chlordane NA 2.3 4.8 0.69 24.42 11.06 0.30 0.08 10.01 20.34 0.80 27.67 1.40

23
2008 Clam Bayou
Sample
08CLB
02
08CLB
03
08CLB
05
08CLB
01
08CLB
04
08CLB
12
08CLB
06
08CLB
08
08CLB
07
08CLB
10
To
tal P
CB
s (
g/k
g)
1
10
100
1000
A
B1a
B1b
B2a
B2b
PEL = 189 g/kg
TEL = 21.6 g/kg
Figure 13 Clam Bayou 2008 sediment total PCBs concentrations (µg/kg).
2008 Clam Bayou
Sample
08CLB
02
08CLB
03
08CLB
05
08CLB
01
08CLB
04
08CLB
12
08CLB
06
08CLB
08
08CLB
07
08CLB
10
Lin
da
ne
(g/k
g)
0.0
0.2
0.4
0.6
0.8
1.0
1.2
1.4
1.6
A
B1a
B1b
B2a
B2b
PEL = 0.99 g/kg
TEL = 0.32 g/kg
Figure 14 Clam Bayou 2008 sediment lindane concentrations (µg/kg).
24
2008 Clam Bayou
Sample
08CLB
02
08CLB
03
08CLB
05
08CLB
01
08CLB
04
08CLB
12
08CLB
06
08CLB
08
08CLB
07
08CLB
10
Die
ldrin (
g/k
g)
0
1
2
3
4
5
A
B1a
B1b
B2a
B2b
PEL = 0.715 g/kg
TEL = 4.30 g/kg
Figure 15 Clam Bayou 2008 sediment dieldrin concentrations (µg/kg).
2008 Clam Bayou
Sample
08CLB
02
08CLB
03
08CLB
05
08CLB
01
08CLB
04
08CLB
12
08CLB
06
08CLB
08
08CLB
07
08CLB
10
To
tal C
hlo
rda
ne
(g/k
g)
0.01
0.1
1
10
100
A
B1a
B1b
B2a
B2b
PEL = 4.79 g/kg
TEL = 2.26 g/kg
Figure 16 Clam Bayou 2008 sediment total chlordane concentrations (µg/kg).

25
2008 Clam Bayou
Sample
08CLB
02
08CLB
03
08CLB
05
08CLB
01
08CLB
04
08CLB
12
08CLB
06
08CLB
08
08CLB
07
08CLB
10
p,p
' -
DD
D (
g/k
g)
0.1
1
10
100
A
B1a
B1b
B2a
B2b
PEL = 7.81 g/kg
TEL = 1.22 g/kg
Figure 17 Clam Bayou 2008 sediment p,p’-DDD concentrations (µg/kg).
2008 Clam Bayou
Sample
08CLB
02
08CLB
03
08CLB
05
08CLB
01
08CLB
04
08CLB
12
08CLB
06
08CLB
08
08CLB
07
08CLB
10
p,p
' -
DD
E (
g/k
g)
0.1
1
10
100
A
B1a
B1b
B2a
B2b
PEL = 37.4 g/kg
TEL = 2.07 g/kg
Figure 18 Clam Bayou 2008 sediment p,p’-DDE concentrations (µg/kg).

26
2008 Clam Bayou
Sample
08CLB
02
08CLB
03
08CLB
05
08CLB
01
08CLB
04
08CLB
12
08CLB
06
08CLB
08
08CLB
07
08CLB
10
p,p
' -
DD
T (
g/k
g)
0.1
1
10
100
A
B1a
B1b
B2a
B2b
PEL = 4.77 g/kg
TEL = 1.19 g/kg
Figure 19 Clam Bayou 2008 sediment p,p’-DDT concentrations (µg/kg).
2008 Clam Bayou
Sample
08CLB
02
08CLB
03
08CLB
05
08CLB
01
08CLB
04
08CLB
12
08CLB
06
08CLB
08
08CLB
07
08CLB
10
Tota
l D
DT
(g/k
g)
0.1
1
10
100
A
B1a
B1b
B2a
B2b
PEL = 51.7 g/kg
TEL = 3.89 g/kg
Figure 20 Clam Bayou 2008 sediment total DDT concentrations (µg/kg).

27
Table 7 Clam Bayou 2008 sediment polycyclic aromatic hydrocarbon (PAH) concentrations (µg/kg).
MDL = Method Detection Limit; TEL = Threshold Effects Level; PEL = Potential Effects Level.
Yellow highlighting indicates >TEL concentration. Red highlighting indicates >PEL concentration. Blue highlighting indicates MDL>TEL.
Bray-Curtis Similarity Grouping A
B
B1 B2
B1a B1b B2a B2b
PAH MDL TEL PEL 08CLB02 08CLB03 08CLB05 08CLB04 08CLB01 08CLB12 08CLB06 08CLB08 08CLB07 08CLB10
Low Molecular Weight PAHs
Acenaphthene 11.9 6.7 88.9 <MDL <MDL <MDL <MDL <MDL 51.98 <MDL <MDL <MDL 99.23
Acenaphthylene 12.15 5.9 128 <MDL <MDL <MDL <MDL <MDL <MDL <MDL <MDL <MDL <MDL
Anthracene 23.07 46.9 245 138.65 216.33 70.31 100.81 43.48 178.22 <MDL 70.51 52.17 258.00
Fluorene 10.85 21.2 144 50.42 <MDL <MDL 28.23 <MDL 44.55 <MDL <MDL <MDL 79.38
Naphthalene 11.45 34.6 391 44.12 81.12 <MDL <MDL 13.59 21.63 <MDL <MDL <MDL 78.74
Phenanthrene 19.33 86.7 544 1171.33 2040.73 631.51 866.02 371.36 1469.01 186.21 69.22 500.87 2340.54
Total LMW PAHs NA 312 1440 1416.55 2355.64 725.01 1012.82 445.89 1771.47 230.23
162.92 576.23 2861.97
High Molecular Weight PAHs
Benzo(a)anthracene 23.81 74.8 693 2691.11 3948.08 914.04 1254.03 703.79 2472.77 520.83 173.08 984.76 4624.12
Benzo(a)pyrene 22.57 88.8 763 4140.65 6557.60 1320.28 1693.55 1005.41 3415.84 923.61 250.00 1480.40 7204.10
Chrysene 21.15 108 846 4002.00 7071.39 1460.90 1915.32 1135.84 3215.35 840.28 256.41 1480.40 6946.10
Dibenzo(a,h)anthracene 14.98 6.2 135 1020.98 1527.85 367.18 463.71 304.34 920.79 270.83 83.33 410.86 2024.29
Fluoranthene 28.41 113 1490 5388.52 10735.53 2609.31 3669.35 1676.59 5175.74 1076.39 365.38 2295.59 11272.53
Pyrene 23.27 153 1400 5873.80 10586.80 2156.20 2971.77 1508.11 5183.17 1118.06 326.92 2256.47 12225.13
Total HMW PAHs NA 655 6680 23117.06 40427.25 8827.91 11967.73 6334.08 20383.66 4750.00 1455.12 8908.48 44296.27
Total PAHs NA 1680 16800 24533.61 42782.89 9552.92 12980.55 6779.97 22155.13 4980.23 1618.04 9484.71 47158.24
Other PAHs
Benzo(b)fluoranthene 16.74 NA NA 5319.19 7815.04 1578.09 2213.71 1339.64 3274.75 1354.17 320.51 1897.78 9744.38
Benzo(k)fluoranthene 17.07 NA NA 3327.65 4813.41 1226.53 1302.42 872.26 2910.89 763.89 256.41 1147.80 6013.34
Indeno(1,2,3-c,d)pyrene 17.05 NA NA 2842.37 4583.56 1007.79 1177.42 828.78 2205.45 784.72 237.18 1154.32 5457.65
Benzo(g,h,i)perylene 17.84 NA NA 2905.39 4624.12 937.48 1173.39 850.52 2079.21 756.94 250.00 1108.67 5398.11
Retene 20.17 NA NA 214.28 <MDL <MDL <MDL <MDL 103.96 <MDL <MDL <MDL 337.38
Coronene 20.27 NA NA 1707.94 2555.44 546.86 637.10 472.81 987.62 340.28 121.79 547.81 2460.90

28
2008 Clam Bayou
Sample
08CLB
02
08CLB
03
08CLB
05
08CLB
01
08CLB
04
08CLB
12
08CLB
06
08CLB
08
08CLB
07
08CLB
10
Tota
l Lo
w M
ole
cula
r W
eig
ht
PA
Hs (
g/k
g)
100
1000
10000
100000
A
B1a
B1b
B2a
B2b
PEL = 1442 g/kg
TEL = 312 g/kg
Figure 21 Clam Bayou 2008 sediment low molecular weight PAH concentrations (µg/kg).
2008 Clam Bayou
Sample
08CLB
02
08CLB
03
08CLB
05
08CLB
01
08CLB
04
08CLB
12
08CLB
06
08CLB
08
08CLB
07
08CLB
10
To
tal H
igh
Mo
lecu
lar
We
igh
t P
AH
s (
g/k
g)
100
1000
10000
100000
A
B1a
B1b
B2a
B2b
PEL = 6676 g/kg
TEL = 655 g/kg
Figure 22 Clam Bayou 2008 sediment high molecular weight PAH concentrations (µg/kg).
29
2008 Clam Bayou
Sample
08CLB
02
08CLB
03
08CLB
05
08CLB
01
08CLB
04
08CLB
12
08CLB
06
08CLB
08
08CLB
07
08CLB
10
To
tal P
AH
s (
g/k
g)
100
1000
10000
100000
Group A
Group B1a
Group B1b
Group B2a
Group B2b
2x PEL
PEL = 16770 g/kg
TEL = 1684 g/kg
Figure 23 Clam Bayou 2008 sediment total PAH concentrations (µg/kg).
Comparison on Biological and Physical Variables.
A BIO-ENV analysis was run on the water quality + silt/clay dataset to look for correlations between
these various physical parameters and structure of the benthic community seen in the similarity analysis.
Results found the highest correlation (ρ = 0.499) was due to a combination of depth and the percent
silt+clay. The percent silt+clay had the strongest single variable correlation (ρ = 0.460) of the measured
parameters followed by depth (ρ = 0.198).
Comparison with TBEP Baseline and 2001 FDEP data.
The similarity analysis of the benthic community composition between the 2008 TBEP and 2001 FDEP
Clam Bayou sites is shown in Figure 24. The resulting dendrogram shows three primary clusters of sites
with a similar topology as seen in Figure 2. Two of the 2001 FDEP sites (01FDEP05 and 01FDEP06)
grouped with the two “Group A” sites from 2008. SIMPER analysis indicated that the similarity among
these sites was due to tubificinae oligochaetes and all four sites were characterized by relatively low
species richness and abundances. The remaining four 2001 FDEP sites grouped with the four 2008

30
“Group B1” sites from Figure 2. Within this grouping, site 01FDEP07 fell out from the rest of the sites
(Figure 24) due possibly to the dominance of mollusks at this site. The SIMPER analysis showed that the
similarity within this grouping was largely due to the presence of Laeonereis culveri. The remaining four
2008 sites followed the same clustering pattern as Group B2 and its subgroups B2a and B2b as seen in
Figure 2.
The similarity analysis between the 2008 TBEP and the selected TBEP reference sites is shown in
Figure 25. One reference site grouped with the two Group A sites from Clam Bayou. SIMPER analysis
showed that these three sites were grouped based on the presence of tubifid oligochaetes. One of the
reference sites (06LTB02) fell out as an outlier to the remaining sites. This site was dominated by the
bivalve Anadara transversa and polychaete Prionospio multibranchiata. The remaining sites formed two
groups with the 2008 Clam Bayou samples separating out from the TBEP reference sites (Figure 25), with
a single Clam Bayou site (08CLB07) grouping with the TBEP reference sites. The SIMPER analysis
indicated that similarity among the Clam Bayou group was due to Laeonereis culveri, and the topology
within this cluster was basically the same as Figure 2. The grouping of the TBEP reference sites plus
08CLB07 was due to the polychaetes Monticellina cf. dorsobranchialis and Carazziella hobsonae.
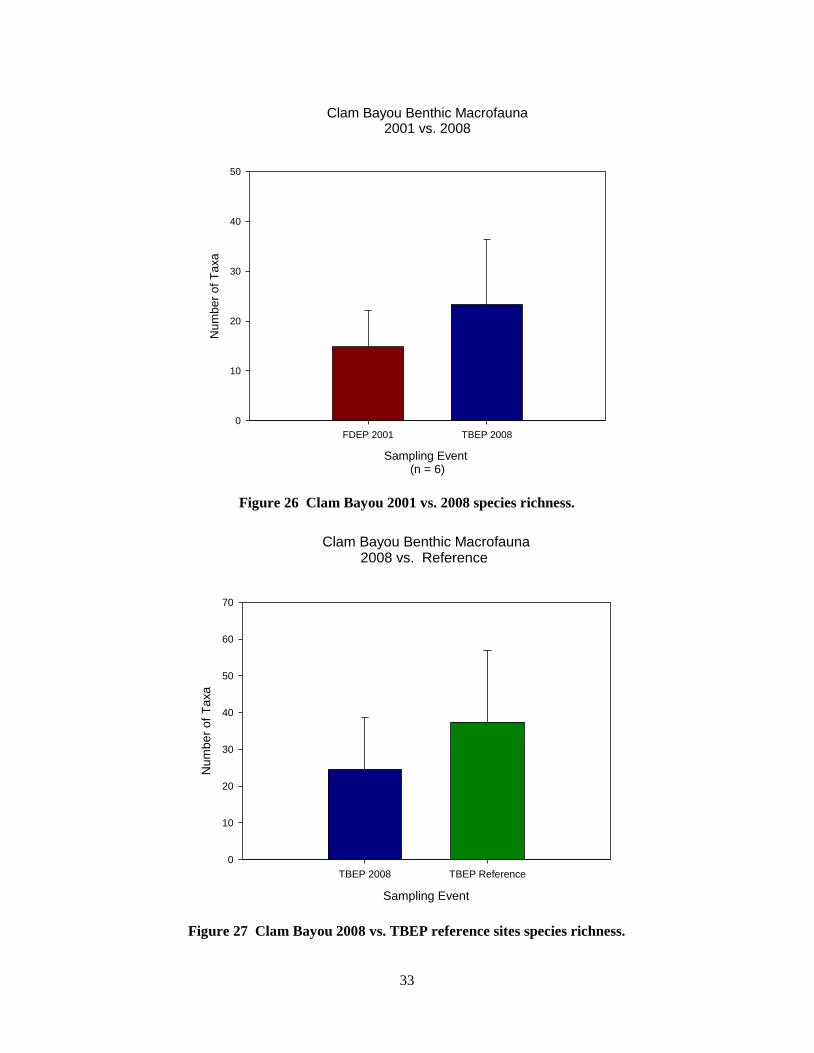
The 2008 Clam Bayou sites had more taxa present than the 2001 FDEP samples (Figure 26), but the mean
number of taxa was not significantly higher (t-test; p = 0.194). The mean number of taxa at the 2008
Clam Bayou sites was lower relative to the TBEP reference sites (Figure 27), however the mean values
were not found to be significantly different (t-test; p=0.115). It should be noted that the statistical power
(1-ß) for both t-tests were low (0.337 and 0.228 respectively), suggesting the observed differences in
species richness may actually be significant but cannot be determined due to small sample size or high
variability in the data.
The macrofaunal abundance at the Clam Bayou sites was apparently higher in 2008 than in 2001 (Figure
28). The mean values were not found to be significantly different (t-test; p=0.539), however the statistical
power of the t-test was low (1-ß = 0.05). The 2008 Clam Bayou macrofaunal abundance was lower than
at the TBEP reference sites (Figure 29), however the mean values were not significantly different (MW;
0.391).
The Shannon diversity index values were higher in 2008 relative to the 2001 FDEP samples (Figure 30).
The mean values were not found to be significantly different (t-test; p=0.051), however the statistical
power of the t-test was low (1-ß = 0.421). There was no significant difference in the Shannon diversity
index between the 2008 Clam Bayou sites and the TBEP reference sites (MW; p = 0.653) although the
Clam Bayou sites were relatively lower (Figure 31). Pielou’s evenness index (J’) was significantly higher
at the 2008 Clam Bayou sites than at the 2001 FDEP sites (t-test; p=0.003; 1-ß = 0.942). There was no
significant difference in J’ between the 2008 Clam Bayou and TBEP reference sites (MW; p=0.438).
The mean Tampa Bay Benthic Index score for the 2008 Clam Bayou sites was lower than at the 2001
FDEP sites (Figure 32) and at the TBEP reference sites (Figure 33). There was no significant difference
found in the mean TBBI scores between the 2008 Clam Bayou sites and either the 2001 FDEP sites (t-
test; p = 0.062) or the TBEP reference sites (t-test; p=0.302). In both cases however, the statistical power
of the t-tests were low.

31
Clam Bayou
FDEP 2001 vs. TBEP 2008 Benthic Community Structure
01F
DE
P 5
01F
DE
P 6
08C
LB
02
08C
LB
03
01F
DE
P 7
08C
LB
05
08C
LB
04
08C
LB
01
08C
LB
12
01F
DE
P 4
01F
DE
P 1
01F
DE
P 3
08C
LB
06
08C
LB
08
08C
LB
07
08C
LB
10
Samples
100
80
60
40
20
0
Sim
ilarity
Transform: Square root
Resemblance: S17 Bray Curtis similarity
Sampling EventFDEP 2001
TBEP 2008
Figure 24 Clam Bayou 2008 and 2001 FDEP Bray-Curtis similarity analysis.

32
Clam Bayou
TBEP 2008 CLB vs TBEP Reference
01B
CB
6001
08C
LB
02
08C
LB
03
08C
LB
05
08C
LB
04
08C
LB
01
08C
LB
12
08C
LB
10
08C
LB
06
08C
LB
08
05B
CB
06
05B
CB
09
07B
CB
06
96B
CB
08
08C
LB
07
97B
CB
57-1
02B
CB
0020
95B
CB
17
06LT
B02
Samples
100
80
60
40
20
0
Sim
ilarity
Transform: Square root
Resemblance: S17 Bray Curtis similarity (+d)
Sampling EventClam Bayou 2008
TBEP Reference
Figure 25 Clam Bayou 2008 and TBEP reference Bray-Curtis similarity analysis.
33
Clam Bayou Benthic Macrofauna2001 vs. 2008
Sampling Event (n = 6)
FDEP 2001 TBEP 2008
Num
be
r of
Taxa
0
10
20
30
40
50
Figure 26 Clam Bayou 2001 vs. 2008 species richness.
Clam Bayou Benthic Macrofauna2008 vs. Reference
Sampling Event
TBEP 2008 TBEP Reference
Num
be
r of
Taxa
0
10
20
30
40
50
60
70
Figure 27 Clam Bayou 2008 vs. TBEP reference sites species richness.

34
Clam Bayou Benthic Macrofauna2001 vs. 2008
Sampling Event (n = 6)
FDEP 2001 TBEP 2008
Ben
thic
Abu
nd
an
ce (
N =
#/m
2)
0
2000
4000
6000
8000
10000
12000
Figure 28 Clam Bayou 2001 vs. 2008 benthic abundance.
Clam Bayou Benthic Macrofauna2008 vs. Reference
Sampling Event
TBEP 2008 TBEP Reference
Be
nth
ic A
bu
nd
an
ce
(N
= #
/m2)
0
2000
4000
6000
8000
10000
12000
Figure 29 Clam Bayou 2008 vs. TBEP reference sites benthic abundance.

35
Clam Bayou Benthic Macrofauna2001 vs. 2008
Sampling Event (n = 6)
FDEP 2001 TBEP 2008
Sha
nn
on
Div
ers
ity I
nd
ex (
H'; log
e)
0.0
0.5
1.0
1.5
2.0
2.5
3.0
3.5
Figure 30 Clam Bayou 2001 vs. 2008 Shannon diversity index.
Clam Bayou Benthic Macrofauna2008 vs. Reference
Sampling Event
TBEP 2008 TBEP Reference
Sh
an
no
n D
ive
rsity I
nd
ex (
H'; lo
ge)
0.0
0.5
1.0
1.5
2.0
2.5
3.0
3.5
Figure 31 Clam Bayou 2008 vs. TBEP reference sites Shannon diversity index.

36
Clam Bayou Benthic Macrofauna2001 vs. 2008
Sampling Event
FDEP 2001 TBEP 2008
Tam
pa
Bay B
en
thic
Ind
ex
50
60
70
80
90
100
Figure 32 Clam Bayou 2001 vs. 2008 Tampa Bay Benthic Index.
Clam Bayou Benthic Macrofauna2008 vs. Reference
Sampling Event
TBEP 2008 TBEP Reference
Tam
pa
Bay B
en
thic
Ind
ex
50
60
70
80
90
100
Figure 33 Clam Bayou 2008 vs. TBEP reference sites Tampa Bay Benthic Index.

37
Sediment metals results for four of the metal contaminants (Cd, Cu, Pb, Zn) which were above their
respective TEL threshold concentrations at several of the 2008 Clam Bayou sites are shown in
Figures 34-37. Concentrations were generally higher in the 2008 samples than in either the 2001 FDEP
or TBEP reference samples. For Cd and Cu the 2008 levels were significantly higher than the 2001 FDEP
samples but were not significantly different from the TBEP reference sites (KW; p<0.001). The 2008
samples were significantly higher in Pb and Zn than both the 2001 FDEP samples and the TBEP
reference sites. There were no significant differences found between the 2001 FDEP and TBEP reference
sites.
Organic sediment contaminants (PCBs, pesticides, PAHs) at the 2008 Clam Bayou sites were compared
with the TBEP reference sites but the 2001 FDEP sampling event did not test for these contaminants. The
mean concentration of PCBs in the 2008 Clam Bayou samples was greater than the TEL concentration
(Figure 38) and significantly higher than at the TBEP reference sites (MW; p<0.001). The pesticide
lindane (Figure 39) was significantly higher in Clam Bayou by an order of magnitude (MW; p=0.003),
with a mean concentration exceeding the TEL. Dieldrin (Figure 40) was also significantly higher in Clam
Bayou (MW; p>0.001), where the mean value exceeded its TEL concentration and was an order of
magnitude higher than at the reference sites (Figure 40). Total chlordane levels in Clam Bayou were two
orders of magnitude greater than at the TBEP reference sites (MW; p=0.002) and the mean value
exceeded the PEL threshold concentration (Figure 41). The three measured DDT break-down products
and total DDT all were significantly higher in the Clam Bayou sediments compared to the reference sites
(MW; P<0.001). Levels of p,p’-DDD (Figure 42) were an order of magnitude higher in Clam Bayou and
the mean concentration was above its TEL. The mean concentration of p,p’-DDE in Clam Bayou was
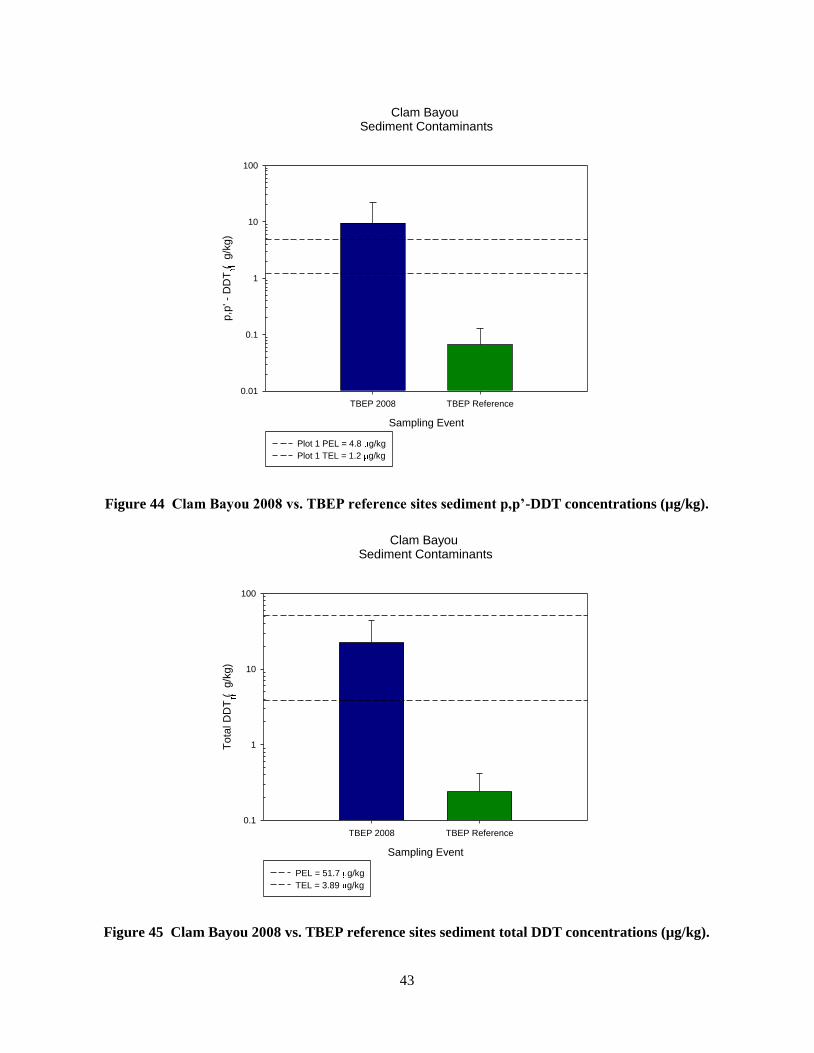
above its TEL and was two orders of magnitude higher than at the reference sites (Figure 43). The mean
concentration of p,p’-DDT in Clam Bayou exceeded its PEL threshold and was also two orders of
magnitude greater than at the reference sites (Figure 44). Total DDT concentrations were also two orders
of magnitude higher in Clam Bayou relative to the reference sites, and the mean concentration in Clam
Bayou was above the TEL (Figure 45).
Polycyclic aromatic hydrocarbons (PAHs) levels were greatly elevated in Clam Bayou and both the low
molecular weight and high molecular weight PAH’s were generally two orders of magnitude higher than
at the reference sites (Figures 46-48). The low molecular weight PAHs (figure 46) had a mean value in
Clam Bayou above its TEL and was significantly higher than at the reference sites (MW; p<0.001). Mean
concentrations for both the high molecular weight (Figure 47) and for total PAHs (Figure 48) were above
their PELs and were significantly higher than at the TBEP reference sites (MW; p<0.001).

38
Clam Bayou Sediment Metals
Sampling Event
TBEP 2008 TBEP Reference FDEP 2001
Cadm
ium
(m
g/k
g)
0
1
2
3
4
5
PEL = 4.21 mg/kg
TEL = 0.676 mg/kg
Figure 34 Sediment cadmium concentrations (mg/kg) by sampling event.
Clam Bayou Sediment Metals
Sampling Event
TBEP 2008 TBEP Reference FDEP 2001
Copp
er
(mg/k
g)
0.1
1
10
100
PEL = 108 mg/kg
TEL = 18.7 mg/kg
Figure 35 Sediment copper concentrations (mg/kg) by sampling event.

39
Clam Bayou Sediment Metals
Sampling Event
TBEP 2008 TBEP Reference FDEP 2001
Le
ad
(m
g/k
g)
1
10
100
PEL =112 mg/kg
TEL = 30.2 mg/kg
Figure 36 Sediment lead concentrations (mg/kg) by sampling event.
Clam Bayou Sediment Metals
Sampling Event
TBEP 2008 TBEP Reference FDEP 2001
Zin
c (
mg/k
g)
1
10
100
PEL = 271 mg/kg
TEL = 124 mg/kg
Figure 37 Sediment zinc concentrations (mg/kg) by sampling event.

40
Clam Bayou Sediment Contaminants
Sampling Event
TBEP 2008 TBEP Reference
To
tal P
CB
s (
g/k
g)
0.1
1
10
100
1000
PEL = 189 g/kg
TEL = 21.6 g/kg
Figure 38 Clam Bayou 2008 vs. TBEP reference sites sediment PCB concentrations (µg/kg).
Clam Bayou Sediment Contaminants
Sampling Event
TBEP 2008 TBEP Reference
Lin
da
ne
(g/k
g)
0.01
0.1
1
10
PEL = 0.99 g/kg
TEL = 0.32 g/kg
Figure 39 Clam Bayou 2008 vs. TBEP reference sites sediment lindane concentrations (µg/kg).

41
Clam Bayou Sediment Contaminants
Sampling Event
TBEP 2008 TBEP Reference
Die
ldrin
(g/k
g)
0.01
0.1
1
10
PEL = 4.3 g/kg
TEL = 0.715 g/kg
Figure 40 Clam Bayou 2008 vs. TBEP reference sites sediment dieldrin concentrations (µg/kg).
Clam Bayou Sediment Contaminants
Sampling Event
TBEP 2008 TBEP Reference
To
tal C
hlo
rda
ne
(g/k
g)
0.1
1
10
PEL = 4.8 g/kg
TEL = 2.3 g/kg
Figure 41 Clam Bayou 2008 vs. TBEP reference sites sediment total chlordane concentrations
(µg/kg).

42
Clam Bayou Sediment Contaminants
Sampling Event
TBEP 2008 TBEP Reference
p,p
'- D
DD
(g/k
g)
0.01
0.1
1
10
PEL = 7.8 g/kg
TEL = 1.2 g/kg
Figure 42 Clam Bayou 2008 vs. TBEP reference sites sediment p,p’-DDD concentrations (µg/kg).
Clam Bayou Sediment Contaminants
Sampling Event
TBEP 2008 TBEP Reference
p,p
' -
DD
E (
g/k
g)
0.01
0.1
1
10
100
PEL = 37.4 g/kg
TEL = 2.1 g/kg
Figure 43 Clam Bayou 2008 vs. TBEP reference sites sediment p,p’-DDE concentrations (µg/kg).
43
Clam Bayou Sediment Contaminants
Sampling Event
TBEP 2008 TBEP Reference
p,p
' -
DD
T (
g/k
g)
0.01
0.1
1
10
100
Plot 1 PEL = 4.8 g/kg
Plot 1 TEL = 1.2 g/kg
Figure 44 Clam Bayou 2008 vs. TBEP reference sites sediment p,p’-DDT concentrations (µg/kg).
Clam Bayou Sediment Contaminants
Sampling Event
TBEP 2008 TBEP Reference
To
tal D
DT
(g/k
g)
0.1
1
10
100
PEL = 51.7 g/kg
TEL = 3.89 g/kg
Figure 45 Clam Bayou 2008 vs. TBEP reference sites sediment total DDT concentrations (µg/kg).

44
Clam Bayou Sediment Contaminants
Sampling Event
TBEP 2008 TBEP Reference
To
tal L
ow
Mo
lecu
lar
We
igh
t P
AH
s (
g/k
g)
10
100
1000
10000
PEL = 1440 g/kg
TEL = 312 g/kg
Figure 46 Clam Bayou 2008 vs. TBEP reference sites sediment low molecular weight PAH
concentrations (µg/kg).
Clam Bayou Sediment Contaminants
Sampling Event
TBEP 2008 TBEP Reference
Tota
l H
igh M
ole
cula
r W
eig
ht
PA
Hs (
g/k
g)
10
100
1000
10000
100000
PEL = 6680 g/kg
TEL = 655 g/kg
Figure 47 Clam Bayou 2008 vs. TBEP reference sites sediment high molecular weight PAH
concentrations (µg/kg).

45
Clam Bayou Sediment Contaminants
Sampling Event
TBEP 2008 TBEP Reference
Tota
l P
AH
s (
g/k
g)
10
100
1000
10000
100000
PEL = 16800 g/kg
TEL = 1680 g/kg
Figure 48 Clam Bayou 2008 vs. TBEP reference sites sediment total PAH concentrations (µg/kg).

46
Discussion and Conclusions
Two sites in particular, 08CLB02 and 08CLB 03, were unique in that they had low numbers of taxa and
abundances relative to the other 2008 sites and were dominated by oligochaetes. These two sites were
characterized by sediments with high silt+clay content and were associated with dredged channels.
Sediment composition was the primary factor influencing the benthic community composition in Clam
Bayou. The remaining site similarity groupings generally matched their geographic location within the
bayou (Figure 1). The 2008 Clam Bayou benthic community overall was dominated by polychaetes and
molluscs, while crustaceans comprised a relatively minor proportion of the species richness and
abundance. This finding matches the results seen in the 2001 FDEP samples. Both the 2008 and 2001
datasets had many of the same taxa in common, which is reflected in the similarity analysis between the
two sampling events (Figure 24). The selected reference sites were also dominated by several polychaete
species, but had more taxa and higher overall diversity. The reference sites also had a different overall
species composition as seen in the similarity analysis results with the 2008 Clam Bayou sites (Figure 25)
and represented a healthier benthic community relative to Clam Bayou.
Most of the benthic community indices were higher for the 2008 Clam Bayou sites relative to the 2001
FDEP data suggesting an improving benthic community over time. The Tampa Bay Benthic Index,
conversely, showed the opposite trend and the mean TBBI score for the 2008 sites was below the
threshold value for “Degraded” benthic habitats. These observed trends may be in part explained by the
higher salinities observed in 2008, which ranged between 33.2 -35.6 psu and reflected the drought
conditions experienced over the summer of 2008. In contrast, the average salinity at the 2001 FDEP sites
was 22 psu. Species richness and diversity are positively correlated with salinity. The TBBI calculation
takes this into account and is based in part on the observed number of taxa vs. the expected number of
taxa given the sample salinity. Therefore, even though the observed number of taxa was higher in 2008, it
was still relatively low compared to the expected number of taxa that should be found at the observed
salinities. All of the 2008 Clam Bayou benthic community indices were lower compared to the TBEP
reference sites and this comparison may be a better reflection of the current conditions in Clam Bayou.
The sediment metals tended to be higher at the 2008 Clam Bayou sites relative to both the 2001 FDEP
sites and the TBEP reference sites and suggest an accumulation of metals over time. Most of the sites
however did not show evidence of anthropogenic enrichment for metals based on their metal:aluminum
ratios. A few of the metals had concentrations in excess of their TELs, most notably cadmium and lead.
Copper and zinc levels were also relatively high at a few of the sites that had higher percent silt + clay.
The 2001 FDEP study did not include organic sediment contaminants, but the 2008 Clam Bayou sites had
higher concentrations of PCBs, pesticides and PAHs relative to the TBEP reference sites. The levels of
several pesticides including DDT products and chlordane were particularly high. Since these substances
are currently either banned or restricted the high concentrations observed in Clam Bayou represents
historical deposition, possibly from agricultural runoff which occurred before the current urbanization of
the surrounding watershed.

47
The concentration of PAHs in Clam Bayou sediments were particularly high and levels were twice the
PEL concentration for total PAHs at some sites and one to two orders of magnitude higher than at the
TBEP reference sites. The probable source of these contaminants is from stormwater runoff from the
surrounding roads and urban development (Ngabe et al. 2000; Van Dolah et al. 2005). Stormwater runoff
is channeled into Clam Bayou through the Clam Bayou Drain, which is located at the upper northeast end
of the bayou (Figure 1; Pinellas County Water Atlas) and through surface runoff along the shoreline.
Clam Bayou has shown signs of continued influx of contaminants since 2001, which is probably due to
runoff from the surrounding roads and urban areas. The accumulation of sediment contaminants further
impacts the benthic community, particularly in areas of high silt+clay deposition. Possible methods to
reduce the influx of containments from nonpoint sources that enters Clam Bayou is to increase the
vegetative buffer zones around the shoreline and through the retention and treatment of storm water
before it reaches the Clam Bayou.
48
Literature Cited
Clarke, R.K and Ainsworth, M. 1993. A method of linking multivariate community structure to
environmental variables. Marine Ecology Progress Series 92: 205-219.
Clarke, K.R. and Gorley, R.N. 2006. PRIMER v6: User Manual/Tutorial. PRIMER-E Ltd. Plymouth, U.K.
Clarke, K.R., and Warwick, R.M. 2001. Change in marine communities: an approach to statistical analysis
and interpretation, 2nd edition. PRIMER-E ltd. Plymouth, U.K.
Clarke, K.R., Somerfield, P.J. and Chapman, M.G. 2006. On resemblance measures for ecological studies,
including taxonomic dissimilarities and a zero-adjusted Bray-Curtis coefficient for denuded assemblages.
Journal of Experimental Marine Biology and Ecology 330: 55-80.
Courtney, C.M., Grabe, S.A., Karlen, D.J., Brown, R. and Heimbuch, D. 1995. Field operations manual
for a synoptic survey of benthic macroinvertebrates of the Tampa Bay estuaries. EPCHC Technical
Document. November 1995. 55pp.
ESRI. (2006) ArcGIS 9.2. Redlands, CA.
Janicki Environmental, Inc. 2003. Tampa Bay Benthic Monitoring Program redesign assessment. Final
Report. TBEP Tech. Pub #06-03.
Janicki Environmental, Inc. 2005. Development of a benthic index to establish sediment quality targets
for the Tampa Bay estuary. Final Report. TBEP Tech. Pub. #01-06.
Macauley, J.M. 1993. Environmental Monitoring and Assessment Program Estuaries – Louisianian
Province: 1993 Sampling. Field Operations Manual. United States Environmental Protection Agency
ERL/GB NO SR119. [DRAFT 4/22/93].
MacDonald, D.D. 1994. Approach to the Assessment of Sediment Quality in Florida Coastal Waters
Volume 1 - Development and Evaluation of Sediment Quality Assessment Guidelines. Florida
Department of Environmental Protection. 124pp.

49
MacDonald, D.D., Carr, R.S., Calder, F.D., Long, E.R., and Ingersoll, C.G. 1996. Development and
evaluation of sediment quality guidelines for Florida coastal waters. Ecotoxicology 5: 253-278.
Malloy, K.J., Wade, D. Janicki, A. Grabe, S.A., and Nijbroek, R. 2007. Development of a benthic index
to assess sediment quality in the Tampa Bay Estuary. Marine Pollution Bulletin 54: 22-31.
Ngabe, B., Bidleman, T.F., and Scott, G.I. 2000. Polycyclic aromatic hydrocarbons in storm runoff from
urban and coastal South Carolina. The Science of the Total Environment 255: 1-9.
Pinellas County Water Atlas (2009). http://www.pinellas.wateratlas.usf.edu.PRIMER-E Ltd. 2006.
PRIMER v6. Plymouth, U.K.
Schropp, S.J., Lewis, F.G., Windom, H.L., Ryan, J.D., Calder, F.D., and Burney, L.C. 1990.
Interpretation of metal concentrations in estuarine sediments of Florida using aluminum as a reference
element. Estuaries 13: 227-235.
SYSTAT Software, Inc. 2006a. SigmaStat® 3.5. Richmond, CA.
SYSTAT Software, Inc. 2006b. SigmaPlot 10.0. Richmond CA.
Van Dolah, R.F., Riekerk, G.H.M., Levisen, M.V., Scott, G.I., Fulton, M.H., Bearden, D., Sivertsen, S.,
Chung, K.W., and Sanger, D.M. 2005. An evaluation of polycyclic aromatic hydrocarbon (PAH) runoff
from highways into estuarine wetlands of South Carolina. Archives of Environmental Contamination and
Toxicology 49: 362-370.
Versar, Inc. 1993. Tampa Bay National Estuary Program Benthic Project Field and Laboratory Methods
manual. Technical Document prepared for TBNEP March 1993. 32pp.
50
Appendix A: Clam Bayou 2008 Benthic Macrofaunal Data

51
Taxon 08CLB01 08CLB02 08CLB03 08CLB04 08CLB05 08CLB06 08CLB07 08CLB08 08CLB10 08CLB12
CAMPANULARIIDAE 0 0 0 0 0 0 0 1 0 0
ACTINIARIA 300 0 0 50 0 0 0 0 0 25
Eustylochus meridianalis 0 0 0 0 0 0 0 0 0 25
ARCHINEMERTEA sp. A of
EPC 0 0 0 0 0 25
0 25
0 0
Amphiporus bioculatus 0 0 0 75 0 0 0 0 0 0
Eteone heteropoda 25 0 0 100 0 0 0 0 0 0
Phyllodoce arenae 0 0 0 0 0 0 25 0 0 0
Microphthalmus sp. 0 0 0 25 25 0 0 0 0 0
Parahesione luteola 0 0 0 0 0 0 0 0 100 0
Ophiodromus obscurus 0 0 0 25 0 0 0 0 25 0
Podarkeopsis levifuscina 0 0 0 25 0 75 50 50 50 0
Synelmis ewingi 0 0 0 0 0 25 25 25 0 0
Exogone dispar 0 0 0 25 0 0 0 0 0 0
Neanthes acuminata 0 0 0 0 0 0 0 25 0 0
Laeonereis culveri 400 0 0 1900 600 700 0 125 100 450
Stenoninereis martini 0 0 25 150 925 0 0 0 0 0
Glycera americana 0 0 0 0 0 0 25 0 0 0
Glycinde solitaria 0 0 0 0 0 0 25 0 25 0
Kinbergonuphis simoni 0 0 0 0 0 125 25 50 0 0
Lumbrineris tenuis 0 0 0 0 0 75 0 0 0 25
Drilonereis magna 0 0 0 0 0 25 0 0 0 0
Ophryotrocha sp. A of EPC 0 0 25 0 0 0 0 0 0 50
Dorvillea cf. rudolphi 0 0 0 0 0 0 75 0 150 0
Scoloplos rubra 0 0 0 0 0 0 25 0 0 0
Leitoscoloplos foliosus 175 0 0 25 0 0 0 0 0 300
Leitoscoloplos robustus 0 0 0 0 0 25 0 100 0 0
Aricidea cerrutii 0 0 0 0 0 0 25 0 0 0
Aricidea philbinae 0 0 0 0 0 125 0 150 0 0
Dipolydora socialis 0 0 0 0 0 25 0 0 0 0
Polydora cornuta 0 0 0 50 0 0 0 0 0 0
Prionospio heterobranchia 0 0 0 0 0 425 0 450 0 0
Paraprionospio pinnata 0 0 0 0 0 0 25 0 0 0

52
Taxon 08CLB01 08CLB02 08CLB03 08CLB04 08CLB05 08CLB06 08CLB07 08CLB08 08CLB10 08CLB12
Scolelepis texana 0 0 0 0 0 0 0 25 0 0
Carazziella hobsonae 0 0 0 0 0 0 200 0 0 0
Magelona pettiboneae 0 0 0 0 0 250 0 200 0 25
Spiochaetopterus costarum 0 0 0 0 0 0 25 0 0 0
Monticellina dorsobranchialis 25 0 0 25 50 175 900 225 25 50
Capitella capitata complex 150 0 0 175 250 200 50 500 50 75
Capitella jonesi 0 0 0 0 0 75 0 100 0 0
Heteromastus filiformis 50 0 0 675 0 600 25 75 0 350
Notomastus n. sp? of EPC 0 0 0 0 0 0 50 0 0 0
Mediomastus sp. 0 0 0 25 0 25 0 275 0 25
Mediomastus californiensis 0 0 0 0 0 0 0 50 0 0
Axiothella mucosa 0 0 0 0 0 50 0 0 0 0
Pectinaria gouldii 0 0 0 0 0 0 25 0 0 0
Melinna maculata 0 0 0 0 0 0 0 0 25 0
Fabricinuda trilobata 0 0 0 0 0 0 0 25 0 100
TUBIFICINAE 50 625 125 3100 1100 100 100 325 125 200
Tubificoides brownae 0 0 0 0 0 100 0 50 0 0
Tubificoides wasselli 25 0 0 0 0 225 100 250 275 125
GASTROPODA 0 0 0 50 550 0 0 0 50 25
RISSOOIDEA 0 0 0 50 4225 0 0 0 0 0
Sayella hemphillii 0 0 0 0 0 25 0 0 0 0
Teinostoma biscaynense 0 0 0 0 0 0 25 0 0 0
Caecum pulchellum 0 0 0 0 0 25 0 0 0 0
CERITHIIDAE 0 0 0 0 225 0 0 0 0 0
Bittiolum varium 0 0 0 0 0 25 0 0 0 0
Crepidula ustulatulina 0 0 0 0 0 25 0 0 0 0
Melongena corona corona 0 0 0 25 0 0 0 0 0 0
Nassarius vibex 0 0 0 0 0 25 0 0 25 0
Jaspidella blanesi 0 0 0 0 0 0 250 0 0 0
Olivella pusilla 0 0 0 0 0 0 25 25 0 0
Prunum apicinum 0 0 0 0 0 0 0 25 0 0
Turbonilla (Strioturbonilla) sp. 0 0 0 0 0 25 0 0 0 0

53
Taxon 08CLB01 08CLB02 08CLB03 08CLB04 08CLB05 08CLB06 08CLB07 08CLB08 08CLB10 08CLB12
Acteocina canaliculata 350 0 0 350 300 0 0 50 0 475
Haminoea succinea 0 0 0 0 0 0 25 0 0 0
BIVALVIA 100 0 25 175 0 0 0 25 325 75
Solemya occidentalis 0 0 0 0 0 0 0 0 25 0
Amygdalum papyrium 0 0 0 0 0 50 0 0 25 0
Mysella planulata 0 0 0 0 0 0 100 0 200 0
Erycina floridana 0 0 0 0 0 275 25 0 0 0
Macoma sp. 0 0 0 150 0 0 0 0 0 0
Macoma tenta 0 0 0 0 0 0 25 0 0 0
Macoma cerina 100 0 0 0 0 150 25 0 175 50
Macoma nr. cerina 0 25 0 0 0 0 0 0 0 0
TELLININAE 200 0 0 175 0 0 475 150 0 250
Angulus cf. versicolor 0 0 0 0 0 0 25 0 0 0
Angulus texanus 0 0 0 0 0 0 75 50 0 0
Angulus nr. tampaensis 25 0 0 0 0 0 0 125 0 100
Eurytellina sp. A of EPC 350 0 0 475 0 175 500 50 0 0
Angulus sp. 0 0 0 0 0 0 25 0 0 0
Tagelus sp. 0 0 0 0 0 0 0 0 0 75
Tagelus plebeius 0 0 0 175 0 0 0 0 0 25
Tagelus divisus 0 0 0 0 0 0 75 0 0 0
Mercenaria campechiensis 0 0 0 0 0 0 25 0 0 0
Anomalocardia cuneimeris 75 0 0 0 0 0 0 0 0 25
Parastarte triquetra 275 0 0 225 450 100 25 0 50 450
Balanus cf. amphitrite 0 0 0 0 25 0 0 0 0 0
Balanus improvisus 0 0 25 0 0 0 0 0 0 0
Almyracuma bacescui 150 0 0 875 0 0 0 0 0 100
Cyclaspis cf. varians 0 0 0 0 0 0 25 0 0 0
Leptochelia sp. 100 0 0 150 425 50 0 0 0 225
Cyathura polita 200 0 0 100 275 0 0 0 0 250
Amakusanthura magnifica 0 0 0 0 0 25 0 0 0 0
Xenanthura brevitelson 0 0 0 0 0 0 0 0 0 650

54
Data presented as density (#/m2) = raw count x 25, except for colonial taxa which are presented as present = 1.
Taxon 08CLB01 08CLB02 08CLB03 08CLB04 08CLB05 08CLB06 08CLB07 08CLB08 08CLB10 08CLB12
Erichsonella attenuata 0 0 0 0 0 700 0 0 0 0
Edotia triloba 0 0 0 0 0 0 25 0 0 0
Ampelisca abdita 0 0 0 0 0 150 0 0 50 0
Ampelisca holmesi 0 0 0 0 0 0 50 150 0 0
Monocorophium acherusicum 0 0 0 0 0 0 25 0 0 0
Americorophium ellisi 50 0 0 0 0 0 0 0 0 200
Grandidierella bonnieroides 50 0 0 200 0 50 0 0 0 50
Gammarus mucronatus 0 0 0 0 0 25 0 0 0 0
Farfantepenaeus duorarum 0 0 0 0 0 25 0 0 0 0
DOLICHOPODIDAE 500 0 0 0 0 0 0 0 0 0
Phascolion cryptum 25 0 0 0 0 100 50 0 25 50
Phascolion cf. caupo 0 0 0 0 0 50 0 0 0 0
Phoronis sp. 0 0 0 0 0 0 0 25 0 0
Bowerbankia cf. gracilis 0 0 0 0 0 1 0 0 0 0
Amphiodia atra 0 0 0 0 0 0 25 0 0 0
Ophiophragmus filograneus 0 0 0 0 0 25 25 0 25 0
Amphioplus thrombodes 0 0 0 0 0 50 0 0 0 0


