TI-83 Plus Science Tools
89
(8/16/01) © 2001 Texas Instruments ti TI-83 Plus Science Tools Application How to… Use Significant Figures Calculator Use Unit Converter Tool Use Data & Graphs Wizard Use Vector Calculator Examples Significant Figures: Rules Significant Figures: Add, Subtract, Multiply, Divide, Powers Unit Converter: Converting a Value Data/Graphs Wizard: Entering and Editing Data Data/Graphs Wizard: Plotting Data Vector Calculator: Creating a Vector Vector Calculator: Add, Subtract, and Multiply Vectors More Information Error Messages Customer Support
Transcript of TI-83 Plus Science Tools

(8/16/01) © 2001 Texas Instruments
tiTI-83 Plus Science Tools Application
How to… Use Significant Figures Calculator
Use Unit Converter Tool
Use Data & Graphs Wizard
Use Vector Calculator
Examples Significant Figures: Rules
Significant Figures: Add, Subtract, Multiply, Divide, Powers
Unit Converter: Converting a Value
Data/Graphs Wizard: Entering and Editing Data
Data/Graphs Wizard: Plotting Data
Vector Calculator: Creating a Vector
Vector Calculator: Add, Subtract, and Multiply Vectors
More Information Error Messages Customer Support

TI-83 Plus Science Tools Application Page 2
Important Information Texas Instruments makes no warranty, either expressed or implied, including but not limited to any implied warranties of merchantability and fitness for a particular purpose, regarding any programs or book materials and makes such materials available solely on an "as-is" basis.
In no event shall Texas Instruments be liable to anyone for special, collateral, incidental, or consequential damages in connection with or arising out of the purchase or use of these materials, and the sole and exclusive liability of Texas Instruments, regardless of the form of action, shall not exceed any applicable purchase price of this item or material. Moreover, Texas Instruments shall not be liable for any claim of any kind whatsoever against the use of these materials by any other party.
Graphing product applications (Apps) are licensed. See the terms of the license agreement for this product.
TI-GRAPH LINK and TI-Cares are trademarks of Texas Instruments.
All other trademarks are the property of their respective owners.
Revision_Information
TI-83 Plus Science Tools Application WWW English 16 Aug 2001, Rev A

TI-83 Plus Science Tools Application Page 3
What Is the Science Tools Application? The Science Tools application consists of four tools:
• Use the Sig-Fig Calculator tool to:
Display the significant figures of entered values
Perform mathematical operations using either decimal or scientific notation, and display the result with the correct number of significant figures
Convert entries in decimal notation to scientific notation, or vice versa
• Use the Unit Converter tool to:
Display the numerical value and default units of pre-defined constants
Convert displayed constants into other consistent units
Convert any numerical value from one pre-defined unit to another consistent unit
Export displayed or converted values to the calculator home screen

TI-83 Plus Science Tools Application Page 4
• Use the Data/Graphs Wizard tool to:
Enter, view, or edit data
View and analyze data graphically
Find a best-fit function for data
Perform basic statistical analysis of data
• Use the Vector Calculator tool to:
Construct vectors
Perform basic vector operations
TI-83 Plus Science Tools Application Page 5
What You Need To install and run the Science Tools application, you need:
• A TI-83 Plus calculator with version 1.13 or later of the operating system software to optimize the performance of your calculator and the application. You can download a free copy of the latest operating system software from education.ti.com/softwareupdates.
• TI-GRAPH LINK™ computer-to-calculator cable. If you do not have this cable, call your educational dealer, or order the cable online from TI's online store.
• 9-pin to 25-pin cable adapter (required only if you are connecting to a 25-pin serial port on the computer).
• TI-GRAPH LINK software that is compatible with the TI-83 Plus. You can download a free copy of this software from education.ti.com/softwareupdates.
Where to Find Installation Instructions Detailed instructions on installing this and other applications are available at education.ti.com/guides. Follow the link to Flash installation instructions.

TI-83 Plus Science Tools Application Page 6
Sig-Fig Calculator Tool Calculations that involve measurements include a certain amount of error. The precision of the measurement determines which digits (known as significant digits or significant figures) should be included when you report measurement results. However, you will often encounter measurement values reported with arbitrary precision. The Sig-Fig Calculator tool lets you:
• Display the significant figures of entered values.
• Perform mathematical operations using either decimal or scientific notation and display the result with the correct number of significant digits.
• Convert entries in decimal notation to scientific notation.
• Convert entries in scientific notation to decimal notation.
Selecting the Sig-Fig Calculator Tool
If the Science Tools application is not already running:
1. Press n to display a list of applications on your calculator.
2. Use the arrow keys to highlight SciTools, and then press ¯ to select it. The information screen is displayed.

TI-83 Plus Science Tools Application Page 7
3. Press any key to continue. The SELECT A TOOL menu is displayed.
4. Press ¯ to select SIG-FIG CALCULATOR. The SIG-FIG
CALCULATOR screen is displayed.
If the Science Tools application is already running:
1. If necessary, press \ � until the SELECT A TOOL menu is displayed.
2. Press ¯ to select SIG-FIG CALCULATOR. The SIG-FIG
CALCULATOR screen is displayed.
If the Fundamental Topics in Science application is running:
1. Select UP as many times as necessary to display the SCIENCE CHAPTERS screen.
2. Select SCIENCE TOOLS.
3. Press ¯ to select SIG-FIG CALCULATOR. The SIG-FIG
CALCULATOR screen is displayed.
Note If you have the international version of Science Tools installed on your calculator, you must exit Fundamental Topics in Science, and then use the n menu to select Science Tools.

TI-83 Plus Science Tools Application Page 8
Sig-Fig Calculator Tool Features
The Sig-Fig Calculator performs calculations using addition, subtraction, multiplication, division, and by raising a value to a power. You can use scientific or decimal notation.
If an operation contains more than 15 operands, you have to divide it into separate operations to calculate it. Rounding is performed at the end of each operation. If a long operation is divided into many sub-operations, rounding is performed multiple times, which has an impact on the final result.
You cannot use parentheses in the Sig-Fig Calculator tool. See Example 2 under Combined Operations for instructions on performing calculations that require parentheses.
Like any other real-life measuring or calculating instrument, the Sig-Fig Calculator tool has limited precision. The final result of a calculation is displayed with the correct number of significant figures up to the maximum of 16 characters, which includes the decimal point, negation sign(s), E (denotes scientific notation), and exponents.
See the Significant Figure Rules used to round the final result.

TI-83 Plus Science Tools Application Page 9
The number of significant figures displayed in brackets to the right of the processed result matches the number of significant figures actually displayed in the final processed value.
The exponent function of the Sig-Fig Calculator tool is intended for integer exponents only. Entering non-integer exponents may produce unexpected results.
Addition and Subtraction
To add or subtract numbers in the Sig-Fig Calculator:
1. Enter the numbers and operators in the order the operations should be performed.
2. Press ¯ to calculate the result. The result is rounded to the correct number of significant figures.
Result based on your entries, followed by the result rounded to the correct number of significant figures
Number of significant figures
Exact value designator
Operands and the operations performed on them (add, subtract, multiply, divide, raise to a power)

TI-83 Plus Science Tools Application Page 10
� Example: A force of 15.8 newtons and another force of 10.357 newtons are acting in the same direction. Find the sum of these two forces.
Multiplication and Division
To multiply or divide numbers in the Sig-Fig Calculator:
1. Enter the numbers and operators in the order the operations should be performed.
2. Press ¯ to calculate the result. The result is rounded to the correct number of significant figures.
For addition and subtraction, the rounded result has the same decimal-place precision as the least precise term. In this case, 15.8 is precise to tenths, so the result is also precise to tenths.
TI-83 Plus Science Tools Application Page 11
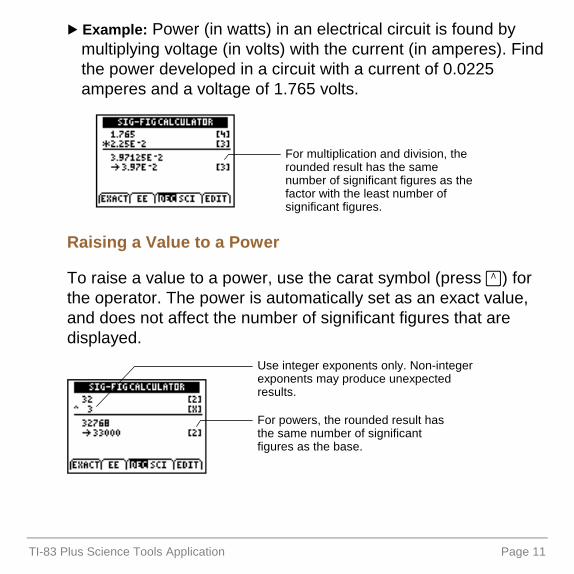
� Example: Power (in watts) in an electrical circuit is found by multiplying voltage (in volts) with the current (in amperes). Find the power developed in a circuit with a current of 0.0225 amperes and a voltage of 1.765 volts.
Raising a Value to a Power
To raise a value to a power, use the carat symbol (press }) for the operator. The power is automatically set as an exact value, and does not affect the number of significant figures that are displayed.
For multiplication and division, the rounded result has the same number of significant figures as the factor with the least number of significant figures.
For powers, the rounded result has the same number of significant figures as the base.
Use integer exponents only. Non-integer exponents may produce unexpected results.
TI-83 Plus Science Tools Application Page 12
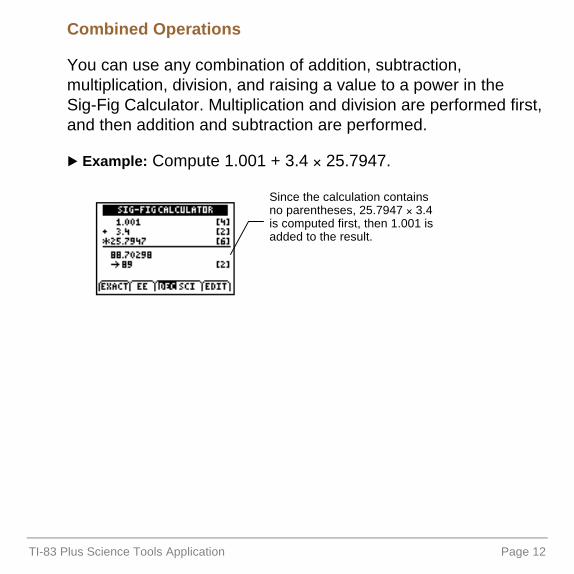
Combined Operations
You can use any combination of addition, subtraction, multiplication, division, and raising a value to a power in the Sig-Fig Calculator. Multiplication and division are performed first, and then addition and subtraction are performed. � Example: Compute 1.001 + 3.4 4 25.7947.
Since the calculation contains no parentheses, 25.7947 4 3.4 is computed first, then 1.001 is added to the result.

TI-83 Plus Science Tools Application Page 13
You cannot use parentheses in the Sig-Fig Calculator. To perform calculations that would normally include parentheses, you must perform the operations separately. � Example: An electric circuit has three resistances: 14.2 ohms,
101.23 ohms, and 4.65 ohms connected in series. The current, I, through the circuit is 3.55 amperes. Find the voltage drop across the three resistors, V = IR.
First, add the ohms to find the cumulative resistance.
Next, press �. The result from the previous screen is pasted into a new screen. Multiply the result by the current to find the voltage.

TI-83 Plus Science Tools Application Page 14
Significant Figures Options
Several options are displayed across the bottom of the Sig-Fig Calculator screen. To select an option, press the graphing key directly under the option.
Option Lets you:
EXACT Set a value as “exact” so that it will not be subject to rounding.
EE Enter a value in scientific notation.
DEC or SCI
Specify whether results are displayed in decimal notation (DEC) or scientific notation (SCI).
EDIT Edit the previous calculation.
R S T U V

TI-83 Plus Science Tools Application Page 15
Setting a Value as Exact
Some values, such as defined or counted quantities, are exact. They should not be rounded and should not affect the rounding of other numbers.
To set a value as exact:
1. Enter the value in the Sig-Fig Calculator.
2. Select EXACT.� Example: 1K of computer memory consists of exactly 1024 bytes. How many bytes are there in a 256K computer?
If you set 1024 and 256 as exact, the answer is not rounded.
If you do not use exact values, the answer is rounded to 3 significant figures.

TI-83 Plus Science Tools Application Page 16
Entering a Value in Scientific Notation
1. Enter the number.
2. Select EE. An E is displayed on the screen to denote scientific notation.
3. Enter the exponent.
Tip Although you can enter a number in scientific notation at any time, if the current mode setting is DEC, that number is displayed in decimal notation. Also, numbers between 0 and 1 are always displayed in scientific notation.
� Example: Enter the number 2.56 4 10/8

TI-83 Plus Science Tools Application Page 17
Displaying Results in Decimal or Scientific Notation
DEC (decimal) or SCI (scientific) is highlighted to indicate the current mode. Press either T or U to change the mode. The mode change does not apply to a calculation currently displayed; it applies to the next entry you make. Example Display
Multiply 1234567891 by exactly 1.Be sure to select EXACT after typing 1.
Decimal notation is retained.
Multiply 12345678901 by exactly 1.
Number is converted to scientific notation because the entry exceeds the number of characters that can be displayed.
Multiply 0.0123 by exactly 1.
Any number 01 < x < 1, except 0, is always displayed in scientific notation, regardless of the display mode

TI-83 Plus Science Tools Application Page 18
� Example: Calculate 1.74 x 372564 in scientific notation.
1. Select SCI.
2. Enter 1.74 � 372564, and then press ¯.
To convert a calculation from one notation type to the other, use the EDIT option as follows.
TI-83 Plus Science Tools Application Page 19
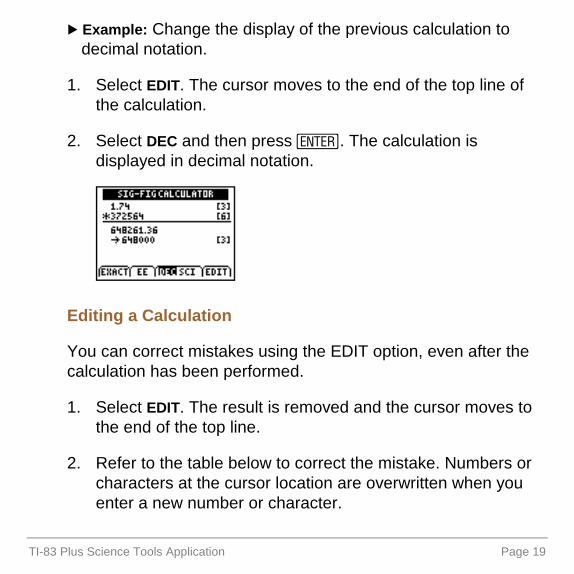
� Example: Change the display of the previous calculation to decimal notation.
1. Select EDIT. The cursor moves to the end of the top line of the calculation.
2. Select DEC and then press ¯. The calculation is displayed in decimal notation.
Editing a Calculation
You can correct mistakes using the EDIT option, even after the calculation has been performed.
1. Select EDIT. The result is removed and the cursor moves to the end of the top line.
2. Refer to the table below to correct the mistake. Numbers or characters at the cursor location are overwritten when you enter a new number or character.
TI-83 Plus Science Tools Application Page 20
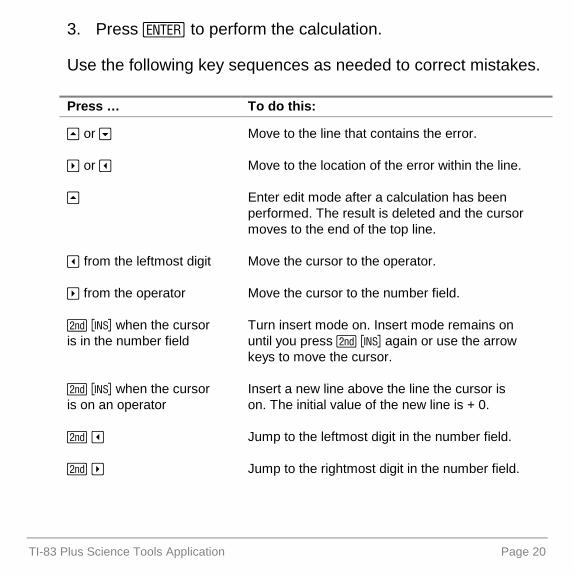
3. Press ¯ to perform the calculation.
Use the following key sequences as needed to correct mistakes. Press … To do this:` or h Move to the line that contains the error.
a or _ Move to the location of the error within the line.
` Enter edit mode after a calculation has been performed. The result is deleted and the cursor moves to the end of the top line.
_ from the leftmost digit Move the cursor to the operator.
a from the operator Move the cursor to the number field.
\ � when the cursor is in the number field
Turn insert mode on. Insert mode remains on until you press \ � again or use the arrow keys to move the cursor.
\ � when the cursor is on an operator
Insert a new line above the line the cursor is on. The initial value of the new line is + 0.
\ _ Jump to the leftmost digit in the number field.
\ a Jump to the rightmost digit in the number field.

TI-83 Plus Science Tools Application Page 21
Press … To do this:s when the cursor is in a number field
Clear the field, leaving the operator. If you do not enter a new number, the previous number is restored when you press an arrow key or ¯.
s when the cursor is on an operator
Clear the operator. If you do not enter a new operator, the previous operator is restored when you press an arrow key or ¯.
^ when the cursor is on a number or character
Delete that number or character.
^ when the cursor is on an operator
Delete the entire line.

TI-83 Plus Science Tools Application Page 22
� Example: Find the distance an object falls in 4.023 seconds if its velocity is 256 meters per second.
The computation should have been 256 4 4.023.
Select EDIT. The cursor moves to the end of the top line.
Press h _ \ � to move the cursor to the correct location and prepare to insert the correct numbers.
Enter 02, and then press ¯ to perform the calculation.
Significant Figures Rules
The Sig-Fig Calculator tool uses the following commonly employed rules to determine which figures are significant.
TI-83 Plus Science Tools Application Page 23
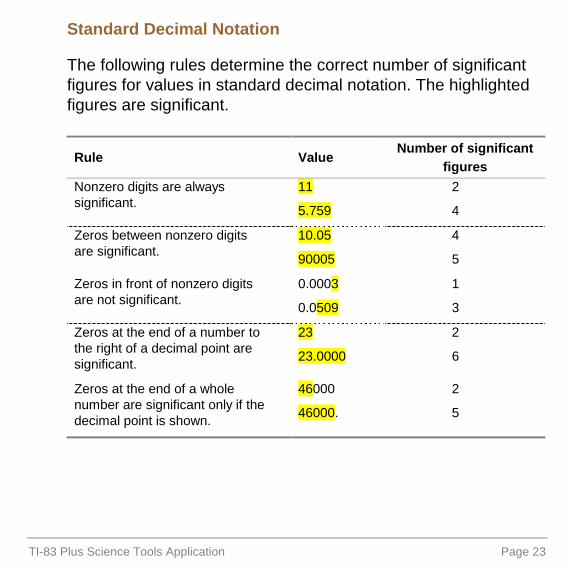
Standard Decimal Notation
The following rules determine the correct number of significant figures for values in standard decimal notation. The highlighted figures are significant.
Rule ValueNumber of significant
figures
Nonzero digits are always significant.
11
5.759
2
4
Zeros between nonzero digits are significant.
10.05
90005
4
5
Zeros in front of nonzero digits are not significant.
0.0003
0.0509
1
3
Zeros at the end of a number to the right of a decimal point are significant.
23
23.0000
2
6
Zeros at the end of a whole number are significant only if the decimal point is shown.
46000
46000.
2
5

TI-83 Plus Science Tools Application Page 24
Scientific Notation
Only significant figures are included when writing a number in scientific notation. For example, 3 4 10^6 contains 1 significant figure; 3.00 4 10^6 contains 3 significant figures.
Significant Figures in Arithmetic Operations
When you perform calculations that involve measurements, the answer can be no more precise than the least precise measurement. A conventional calculator does not consider precision; it shows results with the maximum number of digits that it can display. To maintain the precision of the measurements, these calculated results should be rounded to the correct number of significant figures. The Sig-Fig Calculator tool automatically applies the following common rounding rules.

TI-83 Plus Science Tools Application Page 25
Rounding Rules
To round numbers to the correct number of significant figures, the digit following the last digit to be retained is examined. In the following examples, the numbers are rounded to 3 significant figures. The highlighted digit is the last to be retained. Rule Example
If the digit following the last digit retained is d 5, the last digit is raised by 1.
6.318 6.32
If the digit following the last digit retained is < 5, the last digit remains the same.
0.94728 0.947

TI-83 Plus Science Tools Application Page 26
Addition and Subtraction Rules
Addition and subtraction are performed in floating-point mode. The result is rounded so that the decimal-place value of the rightmost significant digit in the result is the same as that of the term whose rightmost significant digit has the greatest decimal-place value. For example, if the least precise term is precise to the nearest tenth, then the final result is rounded to the nearest tenth. � Example 1:
3.95 (precise to hundredths)
+ 213.6 (precise to tenths)
+ 2.879 (precise to thousandths)
220.429 220.4 (precise to tenths)
� Example 2:
29000 (precise to thousands)
+ 6.0 (precise to tenths)
29006 29000 (precise to thousands)

TI-83 Plus Science Tools Application Page 27
Multiplication, Division, and Power Rules
Multiplication and division are performed in floating-point mode. The final result is rounded so that the number of significant figures in the result is the same as the number of significant figures in the factor having the least number of significant figures. � Example:
12.257 (5 significant figures)
4 1.36 (3 significant figures)
16.66952 16.7 (3 significant figures)
When you raise a value to a power, the base is the factor that determines the number of significant figures in the result. The exponent is always an exact value in the calculation. � Example:
33 (2 significant figures)
^ 2 (treated as exact)
1089 1100 (2 significant figures)

TI-83 Plus Science Tools Application Page 28
Note The Sig-Fig Calculator tool evaluates a number with a negative sign as a single element. Therefore, certain operations on negative numbers may result in errors. For example, if you evaluate /8^.5 on the TI�83 Plus home screen, the result is /1.109569472 (the square root of 8 is evaluated first, and then the negative sign is applied). However, since /8 is evaluated as a single element, the result is an arithmetic error because the square root of a negative number is non-real (complex).
Rounding Mixed Operations
All calculations are performed in floating-point mode, and all digits are retained in intermediate steps. � Example:
6 (precise to ones)
+ 2.31 (precise to hundreths)
4 4.8 (2 significant figures)
17.088 17 (precise to ones)
If a mixed operation involves addition or subtraction, the final result is rounded according to the Addition and Subtraction Rules. Otherwise, the result is rounded according to the Multiplication, Division, and Power Rules.
TI-83 Plus Science Tools Application Page 29
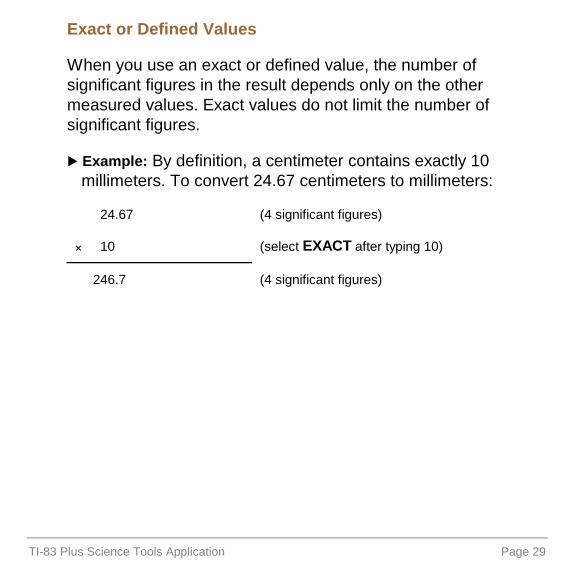
Exact or Defined Values
When you use an exact or defined value, the number of significant figures in the result depends only on the other measured values. Exact values do not limit the number of significant figures. � Example: By definition, a centimeter contains exactly 10
millimeters. To convert 24.67 centimeters to millimeters:
24.67 (4 significant figures)
4 10 (select EXACT after typing 10)
246.7 (4 significant figures)

TI-83 Plus Science Tools Application Page 30
Unit Converter Tool The Unit Converter tool lets you:
• Display the numerical value and default units of pre-defined constants.
• Convert displayed constants into other consistent units.
• Convert any numerical value from one pre-defined unit to another consistent unit.
• Export displayed or converted values to the calculator home screen.
The values of constants, converted values, and values you input are displayed in scientific notation.
The values of constants in the Unit Converter tool are the latest values recommended by the Committee on Data for Science and Technology (CODATA) and the National Institute of Standards and Technology (NIST). For more information, check the NIST web site at http://physics.nist.gov/.
TI-83 Plus Science Tools Application Page 31
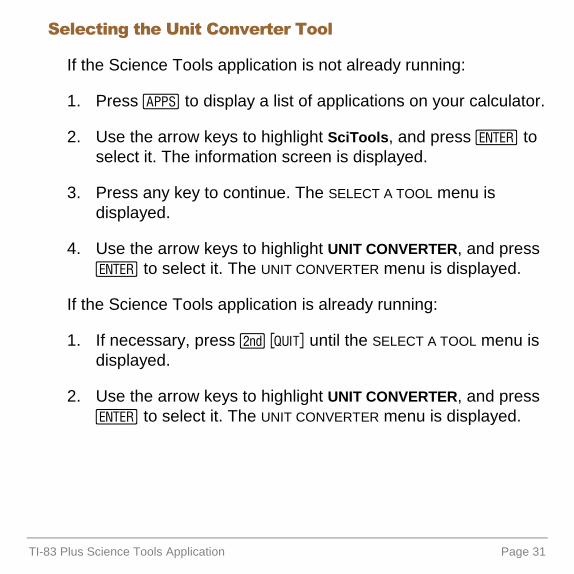
Selecting the Unit Converter Tool
If the Science Tools application is not already running:
1. Press n to display a list of applications on your calculator.
2. Use the arrow keys to highlight SciTools, and press ¯ to select it. The information screen is displayed.
3. Press any key to continue. The SELECT A TOOL menu is displayed.
4. Use the arrow keys to highlight UNIT CONVERTER, and press ¯ to select it. The UNIT CONVERTER menu is displayed.
If the Science Tools application is already running:
1. If necessary, press \ � until the SELECT A TOOL menu is displayed.
2. Use the arrow keys to highlight UNIT CONVERTER, and press ¯ to select it. The UNIT CONVERTER menu is displayed.

TI-83 Plus Science Tools Application Page 32
If the Fundamental Topics in Science application is running:
1. Select UP as many times as necessary to display the SCIENCE CHAPTERS screen.
2. Select SCIENCE TOOLS.
3. Select UNIT CONVERTER.
Note If you have the international version of the Science Tools application installed on your calculator, you must exit Fundamental Topics in Science, and then use the n menu to select SCIENCE TOOLS.
Converting a Value
1. Choose the conversion category.
2. Enter the value.
3. Select the units to convert from, and then press ¯.
4. Select the units to convert to, and then press ¯.

TI-83 Plus Science Tools Application Page 33
The result is displayed at the bottom of the screen. You can edit the result, or select EXPT to paste (export) it to the home screen. � Example: Convert 250 kilometers to fathoms.
1. Select LENGTH from the UNIT CONVERTER menu. The LENGTH conversions screen is displayed, listing the available units.
Tip You can press the number (or e plus the letter) corresponding
to the conversion category to select it.
2. Enter 250, the numerical value to convert.
3. Use the arrow keys to select km, the conversion unit to convert from, and then press ¯.
4. Use the arrow keys to select fath, the conversion unit to convert to, and then press ¯. The result is displayed.
Entries and results are shown in scientific notation.

TI-83 Plus Science Tools Application Page 34
Conversion Screen Options
The conversion screen displays the following options at the bottom of the screen. To select an option, press the graphing key below the option.
Option Description
CONSTANT Displays the CONSTANTS menu.
EXPT Pastes (exports) the converted value to the home screen. You must exit the application to view the home screen.
COPY Displays the UNIT CONVERTER menu. After you select another conversion category, the converted value is pasted into the conversions screen.
EDIT Lets you edit the converted value.
To paste the result you just converted into a new 'convert from' workspace, press \ =.
R S T U V
For example, press either R or S to select CONSTANT.

TI-83 Plus Science Tools Application Page 35
Conversion Units
The Unit Converter tool converts the following units: Conversion Type
Units
Length fm(femtometer)
A(Angstrom)
mm(millimeter)
cm(centimeter)
m(meter)
km(kilometer)
Mil in(inch)
ft(foot)
yd(yard)
fath(fathom)
rd(rod)
mi(mile)
Nmi(nautical mile)
ltyr(lightyear)
Area cm2
(square centimeter)
m2
(square meter)
ha(hectare)
km2
(square kilometer)
in2
(square inch)
ft2
(square foot)
yd2
(square yard)
acre mi2
(square mile)
Volume cm3
(cubic centimeter)
mL(milliliter)
L(liter)
m3
(cubic meter)
tsp(teaspoon)
tbsp(tablespoon)
in3
(cubic inch)
ozuk(UK ounce)
oz(fluid ounce)
cup
pt(pint)
qt(quart)
gal(gallon)
galuk(UK gallon)
ft3
(cubic foot)

TI-83 Plus Science Tools Application Page 36
Conversion Type
Units
Time ns(nanosecond)
Ps(microsecond)
ms(millisecond)
s(second)
min(minute)
h(hour)
day week yr(year)
Temperature �C(degrees Celsius)
K(Kelvin)
�F(degrees Fahrenheit)
�R(degrees Rankine)
Velocity m/s(meter per second)
km/h(kilometer per hour)
ft/s(foot per second)
mi/h(mile per hour)
knot
Mass u(atomic mass unit)
g(gram)
kg(kilogram)
lbm(pound mass)
slug
ton mton(metric ton)
Force/Weight dyne N(newton)
kgf(kilogram of force)
lbf(pound of force)
tonf(ton of force)
Pressure Pa(Pascal)
kPa(kiloPascal)
bar mmH2O(millimeter of water)
mmHg(millimeter of Mercury)
inH2O(inch of water)
inHg(inch of Mercury)
lb/in2
(pound per square inch)
atm(atmosphere)

TI-83 Plus Science Tools Application Page 37
Conversion Type
Units
Energy/Work eV(electron volt)
erg J(Joule)
ft-lbf(foot-pound)
cal(calorie)
l-atm(liter atmosphere)
Btu(British thermal unit)
kwh(kilowatt hour)
Power W(Watt)
ft-lbf/s(foot-pound per second)
cal/s(calorie per second)
Btu/min(British thermal unit per minute)
hp(horsepower)
SI Prefixes f(femto)
p(pico)
n(nano)
P(micro)
m(milli)
c(centi)
d(deci)
base(unit value of 1, or 100)
k(kilo)
M(mega)
G(giga)
T(tera)
P(peta)
E(exa)
Using a Constant Value
1. Select CONSTANT.
2. Move the cursor to highlight the constant.
3. Select COPY to copy the constant to a conversion screen, or select EXPT to paste (export) the constant to the home screen.

TI-83 Plus Science Tools Application Page 38
Constants Screen Options
The constants screen displays the following options at the bottom of the screen. To select an option, press the graphing key below the option.
Option Description
CONVERT Returns to the UNIT CONVERTER menu.
EXPT Pastes (exports) the constant to the home screen. You must exit the application to view the home screen.
EDIT Copies the constant to a conversion screen. If the constant corresponds to a conversion category, the category is automatically selected. (For example, when you select the proton mass constant, it is pasted automatically into the MASS conversion screen.) If the constant does not correspond to a conversion category, the UNIT CONVERTER menu is displayed. After you select a conversion category, the constant is pasted into the conversion screen.
R S T U V
For example, press either R or S to select CONVERT.

TI-83 Plus Science Tools Application Page 39
� Example: Convert the gravitational acceleration from m/s2 to ft/s2.
1. From the UNIT CONVERTER menu, or from any conversion screen, select CONSTANT. The CONSTANTS menu is displayed.
2. Use the arrow keys to select g, the gravitational acceleration constant. The constant’s name and value are displayed at the bottom of the screen.
3. Select COPY to display the UNIT CONVERTER menu.
4. Select LENGTH. The gravitational acceleration constant is displayed on the LENGTH conversion screen.
5. Use the arrow keys to select m, the conversion unit to convert from, and then press ¯.
6. Use the arrow keys to select ft, the conversion unit to convert to, and then press ¯. The result is displayed.

TI-83 Plus Science Tools Application Page 40
� Example: Convert the electron mass constant from kg to g.
1. From the UNIT CONVERTER menu, or from any conversion screen, select CONSTANT. The CONSTANTS menu is displayed.
2. Use the arrow keys to select me, the electron mass constant. The constant’s name and value are displayed at the bottom of the screen.
3. Select COPY to copy the constant into the MASS conversion screen. The constant is pasted with its unit of measure.
4. Use the arrow keys to select g, the conversion unit to convert to, and then press ¯. The result is displayed.

TI-83 Plus Science Tools Application Page 41
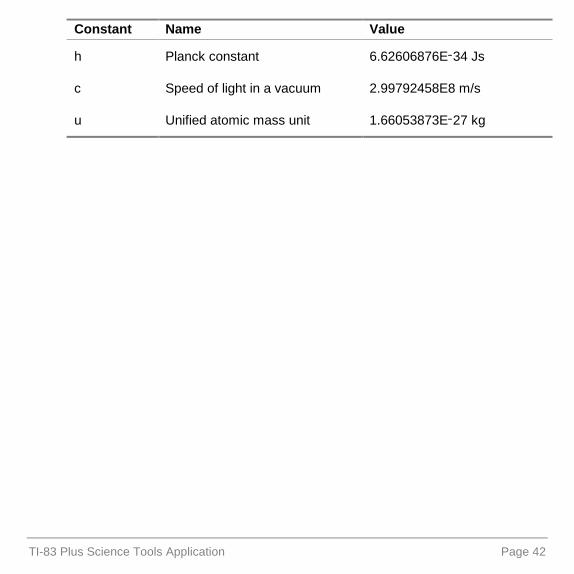
Constants
The Unit Converter tool contains the following constants. Constant Name Value
Na Avogadro constant 6.02214199E23 mol/1kB Boltzman constant 1.3806503E/23 J/K
kc Coulomb constant 8.987551787E9 Nm2/C2
e0 Elementary charge 1.602176462E/19 C
R Molar gas constant 8.314472E0 J/molK
G Universal gravitational constant
6.673E/11 Nm2/kg2
g Gravitational acceleration 9.80665E0 m/s2
me Electron mass 9.10938188E/31 kg
mp Proton mass 1.67262158E/27 kg
mn Neutron mass 1.67492716E/27 kg
P0 Magnetic constant 1.256637061E/6 N/A2
+0 Electric constant 8.854187817E/12 C2/Nm2
TI-83 Plus Science Tools Application Page 42
Constant Name Value
h Planck constant 6.62606876E/34 Js
c Speed of light in a vacuum 2.99792458E8 m/s
u Unified atomic mass unit 1.66053873E/27 kg

TI-83 Plus Science Tools Application Page 43
Data and Graphs Wizard Tool The Data and Graphs Wizard tool provides an easy way to perform basic, common tasks associated with:
• Entering, viewing, or editing data
• Viewing and analyzing data graphically
• Finding a best-fit function for the data
• Performing basic statistical analysis of the data
Selecting the Data and Graphs Wizard
If the Science Tools application is not already running:
1. Press n to display a list of applications on your calculator.
2. Use the arrow keys to highlight SciTools, and press ¯ to select it. The information screen is displayed.
3. Press any key to continue. The SELECT A TOOL menu is displayed.
4. Use the arrow keys to highlight DATA/GRAPHS WIZARD, and press ¯ to select it. The DATA/GRAPHS WIZARD screen is displayed.

TI-83 Plus Science Tools Application Page 44
If the Science Tools application is already running:
1. If necessary, press \ � until the SELECT A TOOL menu is displayed.
2. Use the arrow keys to highlight DATA/GRAPHS WIZARD, and press ¯ to select it. The DATA/GRAPHS WIZARD screen is displayed.
If the Fundamental Topics in Science application is running:
1. Select UP as many times as necessary to display the SCIENCE CHAPTERS screen.
2. Select SCIENCE TOOLS.
3. Select DATA/GRAPHS WIZARD.
Note If you have the international version of the Science Tools application installed on your calculator, you must exit Fundamental Topics in Science, and then use the n menu to select SCIENCE TOOLS.

TI-83 Plus Science Tools Application Page 45
Selecting an Option
The DATA/GRAPHS WIZARD main screen lists the main components of the Data and Graphs Wizard tool. To select an option, press the graphing key directly below it.
Option Lets you:
DATA Enter or edit data in lists
Plot data
STAT Analyze data
To exit the Data and Graphs Wizard tool, press \ �.
R S T U V
For example, press R to select DATA.

TI-83 Plus Science Tools Application Page 46
Entering or Editing Data
• Select DATA to enter data into the calculator’s list editor.
• Press \ � to return to the Data and Graphs Wizard tool.
The list editor displays data in a column-and-row format. Each column contains one list of data. The lists are labeled L1, L2, L3, L4, L5, and L6. The labels can be changed, and more lists can be added to the list editor. Each row in a list contains one data element. Each list can contain up to 999 rows. Basic information about lists and the list editor is given below. Also see the TI�83 Plus guidebook.
Each list must contain at least three elements. If the list contains fewer than three elements, it is not displayed in the selection menu when you plot data.
Note FREQ and RESID are reserved list names. You cannot plot data in lists that have these names. Any data stored in these lists will be overwritten.
Working with Lists
• Data elements are rounded to six characters for display, although the list variable contains the entire value. For example, 123.4567 displays as 123.46.

TI-83 Plus Science Tools Application Page 47
• The row label and its value are displayed on the entry/edit line at the bottom of the screen.
• If a value is already in the list row, any new entry replaces the entire previous value.
• Pressing ¯ completes the current cell entry and moves the cursor to the next row in the list.
• Use a _ to move from one list to another.
• Use ` h to move from one row to another in a list.
• The default lists are blank unless data already exists.
• The list element at the current cursor position—the active cell—is highlighted and is available for entry or editing.
List Header Operations
When the list header (L1, L2, etc.) is the active cell:
• To enter a named list, press \ �. The Name = prompt is displayed, and the calculator is in alpha-lock mode so that you can enter the list name. The list name can contain up to five characters.

TI-83 Plus Science Tools Application Page 48
• To insert a formula for the list, such as L2=L1^2, you can:
− Press \ ¢, \ £, \ ¤, etc., to enter the list name. − Use any of the following operators: ¥, �, �, �, ®, }, y, �, \ &, �, \ *, �, \ -, \ '.
• The list contents are generated by applying the formula entered at the list header level to each cell in the referenced lists.
• Cell contents of a formula-generated list do not change if the formula-referenced list is changed unless the formula was entered in quotation marks. For example, L2="L1^2".
• Press s to delete the list contents when the active cell is the cell header. For example, to delete the contents of L1, move the cursor to the cell header (which shows L1) and press s and then ¯.
Plotting Data
You can plot data for lists you have created. Each list must contain at least three elements.
After the plot is drawn, you can explore its values by pressing the arrow keys (free-moving cursor), or by pressing U and then pressing the arrow keys (cursor is positioned only at the data elements of the plotted lists).

TI-83 Plus Science Tools Application Page 49
After you plot a function, you can display the equation of that function by pressing U and then pressing ` or h.
Note The Data and Graphs Wizard does not reset graph settings. For example, if you previously set y1 to shade below the expression, that setting is still active. To change graph settings after you plot the data, press R to display the Y= editor.
To plot data:
1. Select to display the CHOOSE A PLOT TYPE menu.
2. Select a plot type by pressing the graphing key that corresponds to the plot type.
3. Select the list that corresponds to the independent (x) variable.
R S T U V
For example, press R to select for a scatterplot.

TI-83 Plus Science Tools Application Page 50
4. Select the list that corresponds to the dependent (y) variable. The plot is displayed.
Note • The only lists displayed in the dependent variable (y) pick list
are those that contain the same number of elements as the list chosen from the independent variable (x) pick list.
• Only the first 18 lists that contain valid data for plotting are displayed. Any other lists are not shown.
Plotting option Description
= SCATTERPLOT (2 VAR) Plots the points independently on the graphing screen. You must have two lists of data (one for x values; one for y values).
= XY LINE (2 VAR) Plots the points and connects them with a line. You must have two lists of data (one for x values; one for y values).
= MOD. BOXPLOT (1 VAR) Graphs the min, max, median, and third quartiles of the data.
= HISTOGRAM (1 VAR) Displays a histogram of the data.

TI-83 Plus Science Tools Application Page 51
Displaying a Scatter Plot
A scatter plot lets you graphically view the relationship between two corresponding data sets. Choose one data list as the independent (x) data set and a second list as the dependent (y) data set. The first element of each list is treated as one coordinate pair and plotted as the first data point, and so on through all the elements. � Example: Consider the relationship between a certain
individual’s age and weight. Using the Data and Graphs Wizard tool, enter age (in years) in list L1; enter weight (in pounds) in list L2.
L1={0,2,4,6,8,10,12,14,16,18} L2={7,27,35,44,55,71,92,110,123,124}
1. Enter the data above into lists L1 and L2.
2. Press \ � to return to the DATA/GRAPHS WIZARD screen.

TI-83 Plus Science Tools Application Page 52
3. Select from the DATA/GRAPHS WIZARD screen.
4. Select .
5. Select list L1, which represents the independent x data set.
6. Select list L2, which represents the dependent y data set. The plot is displayed.
7. To display the (x,y) values of each point on the scatter plot, press U, and then press _ and a to move the cursor along the plot. The (x,y) coordinates are displayed at the bottom of the screen.
Note The plot initially displays with the viewing window automatically adjusted to include all data points (ZoomStat). To adjust the viewing window, either:
• Press S and then change the window parameters or
• Press T and then select a Zoom option.
Previous window parameters are not restored when you exit the Data and Graphs Wizard.

TI-83 Plus Science Tools Application Page 53
8. Press \ � to exit the graph. The CHOOSE A FIT METHOD menu is displayed.
9. Press \ � to return to the DATA/GRAPHS WIZARD screen, or see Fitting a Graph to a Regression for more information about regressions.
Displaying an XY Line
An xy line plot also shows the graphical relationship between two corresponding data sets. The difference between the xy line and the scatter plot is that the xy line draws line segments between consecutive data points.
Note You might think that you are viewing a piecewise linear graph when you view an xy line. However, this is not necessarily the case. The xy line simply helps you see the trend of the plot.
� Example: View the data from the previous scatter plot graph as an xy line.
1. Select from the DATA/GRAPHS WIZARD screen.
2. Select .
3. Select list L1, which represents the independent x data set.

TI-83 Plus Science Tools Application Page 54
4. Select list L2, which represents the dependent y data set. The graph is displayed.
5. To display the (x,y) values of each point on the scatter plot, press U, and then press _ and a to move the cursor along the plot. The (x,y) coordinates are displayed at the bottom of the screen.
6. Press \ � to exit the graph. The CHOOSE A FIT METHOD menu is displayed.
7. Press \ � to return to the DATA/GRAPHS WIZARD screen, or see Fitting a Graph to a Regression for more information about regressions.

TI-83 Plus Science Tools Application Page 55
Displaying a Modified Box Plot
A modified box plot lets you view the distribution of elements within a single data set. Choose one data list as the independent (x) data set. The resulting plot resembles a rectangular box with “whiskers” extending to the left and right, dividing the data into four groups. Each data group contains 25% of the data elements.
• The left whisker extends from the minimum value minX to the first quartile value Q1 (represented by the left edge of the box).
• The left portion of the box extends from Q1 to the median value Med (represented by the vertical line within the box).
• The right portion of the box extends from Med to the third quartile value Q3 (represented by the right edge of the box).
• The right whisker extends from Q3 to the maximum value maxX (represented by the tip of the right whisker).
• The width of the rectangle and the length of the whiskers indicate how tightly the data is clustered around the median value.

TI-83 Plus Science Tools Application Page 56
� Example: Consider the distribution of the weight of a group of 14 year old students. Using the Data and Graphs Wizard tool, enter weight (in pounds) in list L3.
L3={120,92,104,132,114,110,145,85,116,108}
1. Enter the data above into list L3.
2. Press \ � to return to the DATA/GRAPHS WIZARD screen.
3. Select from the DATA/GRAPHS WIZARD screen.
Left whisker
minX
Q1
Right whisker
Med
Q3
maxX

TI-83 Plus Science Tools Application Page 57
4. Select .
5. Select list L3, which represents the independent x data set. The plot is displayed.
Note The plot initially displays with the viewing window automatically
adjusted to include all data points (ZoomStat). To adjust the viewing window, either:
• Press S and then change the window parameters or
• Press T and then select a Zoom option.
Previous window parameters are not restored when you exit the Data and Graphs Wizard.
6. To display the values minX, Q1, Med, Q3, and maxX, press U, and then press _ and a to move the cursor along the plot. The plot values are displayed at the bottom of the screen.
Note The whiskers do not extend to the statistical outliers, defined as those data points greater than 1.54(Q31Q1) from the right or left edge of the box. Outliers are plotted as distinct points.
Outlier

TI-83 Plus Science Tools Application Page 58
7. Press \ � to exit the graph and return to the DATA/GRAPHS WIZARD screen.
Displaying a Histogram
A histogram lets you graphically view the distribution of elements within a single data set. Choose one data list as the independent (x) data set. The resulting plot shows how many data elements (n) fall within certain equally-spaced intervals. � Example: View the data from the previous box plot graph as a
histogram.
1. Select from the DATA/GRAPHS WIZARD screen.
2. Select .

TI-83 Plus Science Tools Application Page 59
3. Select L3, which represents the independent x data set. The graph is displayed.
Note The plot initially displays with the viewing window automatically
adjusted to include all data points (ZoomStat). To adjust the viewing window, either:
• Press S and then change the window parameters or
• Press T and then select a Zoom option.
Previous window parameters are not restored when you exit the Data and Graphs Wizard.
4. To display the values min, max, and n for each interval in the histogram, press U, and then press _ and a to move the cursor along the plot. The plot values are displayed at the bottom of the screen. Notice that the greatest occurrence of weight values is in the interval d 100 and < 115.
5. Press \ � to exit the graph and return to the DATA/GRAPHS WIZARD screen.

TI-83 Plus Science Tools Application Page 60
Fitting a Graph to a Regression
After you graph a scatter plot or an xy line, you can fit that graph to a regression to see how the data fits into a curve.
Note Regressions are stored to Y1. If you have a function stored in Y1, it will not be restored when you exit the Science Tools application.
1. Display the graph of a scatter plot or xy line.
2. Press \ � to exit the graph and display the CHOOSE A
FIT METHOD screen.
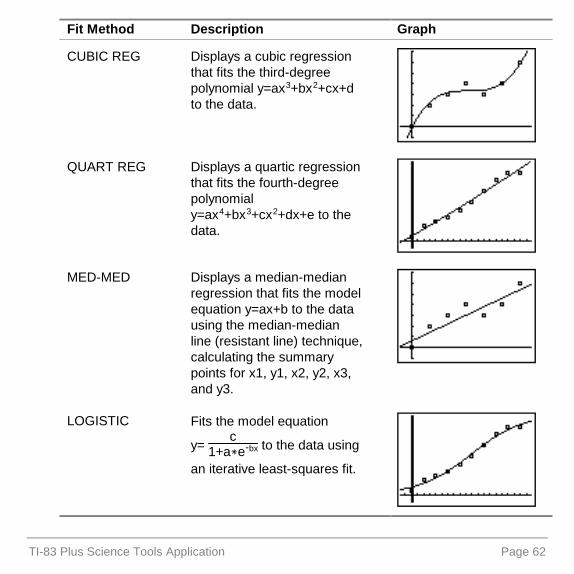
3. Select a fit method. Fit Method Description Graph
LIN REG Displays a linear regression that fits the model y=ax+b to the data using a least-squares fit.

TI-83 Plus Science Tools Application Page 61
Fit Method Description Graph
EXP REG Displays an exponential regression that fits the model equation y=abx to the data using a least-squares fit and transformed values x and ln(y).
LN REG Displays a logarithmic regression that fits the model equation y=a+b ln(x) to the data using a least-squares fit and transformed values ln(x) and y.
PWR REG Displays a power regression that fits the model equation y=axb to the data using a least-squares fit and transformed values ln(x) and ln(y).
QUAD REG Displays a quadratic regression that fits the second-degree polynomial y=ax2+bx+c to the data.
TI-83 Plus Science Tools Application Page 62
Fit Method Description Graph
CUBIC REG Displays a cubic regression that fits the third-degree polynomial y=ax3+bx2+cx+d to the data.
QUART REG Displays a quartic regression that fits the fourth-degree polynomial y=ax4+bx3+cx2+dx+e to the data.
MED-MED Displays a median-median regression that fits the model equation y=ax+b to the data using the median-median line (resistant line) technique, calculating the summary points for x1, y1, x2, y2, x3, and y3.
LOGISTIC Fits the model equation
y= c
1+ahe0bx to the data using
an iterative least-squares fit.

TI-83 Plus Science Tools Application Page 63
Analyzing Data
The STAT option performs statistical calculations on a single data set. Choose a data list as the independent (x) data set, then compute and display the following values for that data set. Abbreviation Description
x Mean of x values*x Sum of x values*x2 Sum of x2 values
Sx Sample standard deviation of xVx Population standard deviation of x
n Number of data points
minX Minimum of x values
Q1 First quartile
Med Median
Q3 Third quartile
maxX Maximum of x values

TI-83 Plus Science Tools Application Page 64
� Example: View the 1-variable statistics from the previous box plot graph.
1. If necessary, press \ � to return to the DATA/GRAPHS
WIZARD screen.
2. Select STAT.
3. Select L3, which represents the independent X data set. The analysis is displayed.
4. Press h to display the second screen of values.
5. Press \ � to return to the DATA/GRAPHS WIZARD screen.
The down arrow indicates that additional values are on the next screen.

TI-83 Plus Science Tools Application Page 65
Vector Calculator Tool The Vector Calculator tool allows you to construct vectors and perform basic vector operations. Vectors are graphically displayed on the screen and are stored to V1 through V9. After you create vectors, you can edit or delete them as needed or perform these vector operations: addition, subtraction, scalar multiplication (dot product), or vector multiplication (cross product).
Selecting the Vector Calculator Tool
If the Science Tools application is not already running:
1. Press n to display a list of applications on your calculator.
2. Use the arrow keys to highlight SciTools, and press ¯ to select it. The information screen is displayed.
3. Press any key to continue. The SELECT A TOOL menu is displayed.
4. Use the arrow keys to highlight VECTOR CALCULATOR, and press ¯ to select it. The VECTOR CALCULATOR screen is displayed.
TI-83 Plus Science Tools Application Page 66
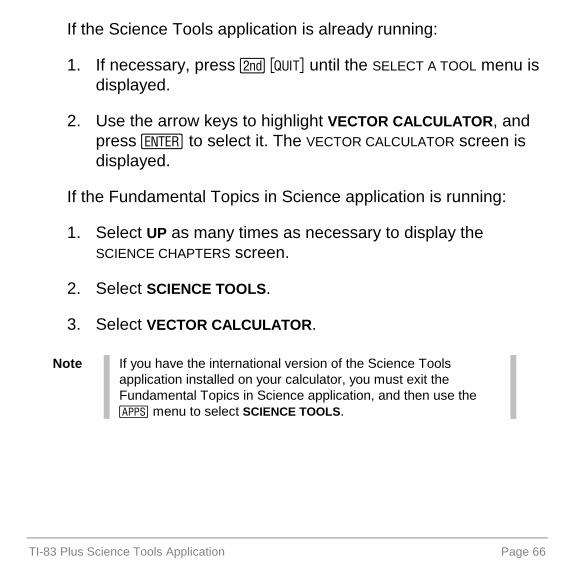
If the Science Tools application is already running:
1. If necessary, press \ � until the SELECT A TOOL menu is displayed.
2. Use the arrow keys to highlight VECTOR CALCULATOR, and press ¯ to select it. The VECTOR CALCULATOR screen is displayed.
If the Fundamental Topics in Science application is running:
1. Select UP as many times as necessary to display the SCIENCE CHAPTERS screen.
2. Select SCIENCE TOOLS.
3. Select VECTOR CALCULATOR.
Note If you have the international version of the Science Tools application installed on your calculator, you must exit the Fundamental Topics in Science application, and then use the n menu to select SCIENCE TOOLS.

TI-83 Plus Science Tools Application Page 67
Selecting an Option
Options are displayed at the bottom of the screen to help you navigate and perform specific tasks. To select an option, press the graphing key directly below it.
Option Lets you:
X/Y Enter x and y coordinates for the head of the vector
r/T Enter r and T coordinates for the head of the vector
PREV Display the previous vector screen
NEXT Display the next vector screen
MATH Display the vector math operators at the bottom of the screen (+, -, �, and 4)
VIEW Display all of the values for the vector (x, y, r, and T)
PICK Select the current vector for a vector math operation
For example, press R to select X/Y.
R S T U V

TI-83 Plus Science Tools Application
Creating a Vector
In the Vector Calculator tool, all vectors are drawn from the origin. Therefore, the tail of each vector is fixed at the coordinates x=0, y=0. You create a vector by specifying the coordinates of its head in either of two ways:
• Move the cursor to the coordinates.
• Directly enter the (x,y) or (r,T) values.
The TI�83 Plus displays angles using 0� to 180�, and 0� to 0180�notation. If you enter an angle of 210�, for example, the Vector Calculator tool displays 0150, not 210.
x
y
0�
90�
090�
180�0180� 210�0150�
Page 68

TI-83 Plus Science Tools Application Page 69
Creating a Vector Graphically
1. Use the arrow keys to move the cursor to the (x,y) coordinates of the vector's head and press ¯. The (x,y) and (r,T) values are displayed on the left side of the screen as you move the cursor.
2. Select NEXT and then create another vector, or select MATH to perform vector math.
Tip You can also press ¯ instead of selecting NEXT to display the next vector entry screen.

TI-83 Plus Science Tools Application Page 70
Creating a Vector by Directly Entering Coordinates
Note You must enter integer values _ 0 and ^ 10,000 for x, y, r or T.
1. Select r/TT or X/Y to move the cursor to the appropriate field.
2. Enter the values for (x,y) or (r,T). Press ¯ to move from the first field to the second, and then press ¯ again to complete the vector.
Tip • Select r/TT to move the cursor to the r field to edit the entries.
• Select X/Y to move the cursor to the X field to edit the entries.
• Select VIEW to view r/TT and X/Y values.
3. Select NEXT, and then create another vector following steps 1 and 2 above, or select MATH to perform vector math.

TI-83 Plus Science Tools Application Page 71
Editing a Vector
You can change any vector that you create, or reset all of its values to 0.
1. Select PREV or NEXT to display the vector you want to edit.
2. You can either use the cursor keys to change the vector, or you can directly enter values for (x,y) or (r,T). —or— Press s to reset all values to 0.
You can use the following key sequences to edit the vector. Press … To do this:^ Delete the character at the cursor location.
\ � Turn on insert mode. Insert mode remains on until you press \ � again or move the cursor to another field.
s Clear the coordinate field.
h or ` Move from one field to another.

TI-83 Plus Science Tools Application Page 72
Adding, Subtracting, and Multiplying Vectors
You can add, subtract, or multiply vectors. When you multiply vectors, you can find the dot (scalar) or cross (vector) product of two vectors. The resultant vector is stored to V9.
Note A vector that has an x or y component > 10,000 as a result of a math operation cannot be correctly displayed graphically. However, the (x,y) and (r,T) coordinates are displayed correctly. The vector is not stored to V9.
Adding or Subtracting Vectors
Vector addition and subtraction is graphically displayed using the head-to-tail method. That is, if two vectors V1 and V2 are added, the tail of V2 is translated to the head of V1. The resultant is drawn from the origin (0,0) to the head of V2.
Note All three vectors (the resultant plus the two constituent vectors) are displayed unless they cannot all be shown with the same scale factor. When the scale factors are different, only the resultant vector is displayed. In Figure 1 below, all three vectors are shown. In Figure 2, only the resultant vector is shown.
Figure 1 Figure 2

TI-83 Plus Science Tools Application Page 73
� Example: A child is playing with a toy truck on the floor of a train that is moving westward. While the train travels 10.0 meters, the child pushes the truck 1.5 meters southward on the floor of the train. What is the resulting displacement of the truck?
Create a vector for the train and a vector for the child’s truck, and then add the vectors to find the resulting displacement. This example uses V1 for the train and V2 for the child’s truck.
1. On the V1 screen, select X/Y and enter the (x,y) coordinates for the train, X = 0010; Y = 0.
2. Select NEXT to display V2.
3. Select X/Y and enter the (x,y) coordinates for the child’s truck, X = 0; Y = 001.5.
4. Select VIEW to display the (x,y) and (r,T) values for V2. This also displays the MATH option.
5. Select MATH to perform vector math. V1 is displayed.
6. Select PICK to choose V1. The operators are displayed at the bottom of the screen.
7. Select + .

TI-83 Plus Science Tools Application Page 74
8. Select NEXT to display V2, and then select PICK to choose it. The resulting vector is displayed.
Subtract 171.469 from 180 to find the resulting displacement of 8.53� south of west.
9. Press \ � twice to return to the first screen.
Calculating a Dot Product
The dot (scalar) product of two vectors V1 and V2 is a scalar whose magnitude is calculated by the equation
( )( ) �cosV2V1V2V1 =⋅ , where E is the angle between V1 and V2.
Work is a scalar quantity defined by the scalar (dot) product of a force vector and a displacement vector: SFW
rr⋅= .

TI-83 Plus Science Tools Application Page 75
� Example: A child pulls a wagon 50 m along level ground by pulling with a force of 15 N on the wagon handle, which is inclined 30 degrees from the ground. Find the work done by the child.
Create a vector for the force and a vector for the distance that the wagon was pulled, and then find the dot product to find the work done. This example uses V3 for the force and V4 for the distance that the wagon was pulled.
1. On the V3 screen, select r/TT to enter the polar coordinatesr = 15 and TT = 30.
2. Select NEXT to display V4.
3. Select r/TT to enter the polar coordinates r = 50 and TT = 0.
4. Select VIEW to display the (x,y) and (r,T) values for V4. This also displays the MATH option.
30�F=15 N
50 m

TI-83 Plus Science Tools Application Page 76
5. Select MATH to perform vector math. V1 is displayed.
6. Select NEXT two times to display V3, and then select PICK to choose it. The operators are displayed at the bottom of the screen.
7. Select � .8. Select NEXT to display V4, and then select PICK to choose it.
The magnitude of the scalar result is displayed.
Note The units of measure are not displayed. You can determine these units as force times distance. For this problem, you have units of work = (units of force) (units of distance) = N�m.

TI-83 Plus Science Tools Application Page 77
Calculating a Cross Product
The cross (vector) product of two vectors V1 and V2 is a vector whose magnitude is calculated by the equation
( )( ) �sinV2V1V2V1 =× , where E is the angle between V1 and V2.
When you find a cross product of two vectors, the resulting vector is not displayed graphically because that requires 3-dimensional plotting capability. However, the magnitude of the vector is displayed. If the magnitude is a negative value, the vector lies along the negative z-axis. If the magnitude is positive, the vector lies along the positive z-axis.
Torque is a vector quantity defined by the cross product of a position vector and a force vector, FR2 rrr
×= , where R is the radius about the axis of rotation. � Example: Find the magnitude and direction of the torque
imparted to a nut by applying a force of 20 N perpendicularly at the end of a 10 cm wrench.
10 cm
20 N of force

TI-83 Plus Science Tools Application Page 78
Create a vector for position and a vector for the force. Find the cross product of these vectors to determine the magnitude and direction of the torque. This example uses V5 for the position vector and V6 for the force vector.
1. On the V5 screen, select X/Y to enter the coordinates of the position vector X = 0010 and Y = 0. Press ¯ to complete the vector.
2. Select NEXT to display V6.
3. Select X/Y to enter the coordinates for the force vector, X = 0 and Y = 0020.
4. Select VIEW to display the (x,y) and (r,T) values for V6. This also displays the MATH option.
5. Select MATH to perform vector math. V1 is displayed.
6. Select NEXT to display V5, and then select PICK to choose it. The operators are displayed at the bottom of the screen.

TI-83 Plus Science Tools Application Page 79
7. Select X.
8. Select NEXT to display V6, and then select PICK to choose it. The magnitude of the scalar result is displayed.
Note The units of measure are not displayed. You can determine these units as force times distance. For this problem, you have units of torque = (units of force) (units of distance) = N�cm. Since N�cm is not a proper derived SI unit, you can use the Constants and Conversions tool to convert 200 N�cm to N�m.
The magnitude is a positive value, indicating that the vector lies along the positive z-axis.
TI-83 Plus Science Tools Application Page 80
Deleting the Science Tools Application Deleting the Science Tools application completely removes the application from your calculator.
Be sure to exit the application. Then:
1. Press \ / to display the MEMORY menu.
2. Select Mem Mgmt/Del.
3. Use h or ` to select Apps, and then press ¯.
4. Use h or ` to select SciTools (the arrow points to SciTools).
5. Press ^.
6. Select Yes.

TI-83 Plus Science Tools Application Page 81
Science Tools Error Messages
Arithmetic Error
This is a general error caused by a limitation error (such as an overflow error when a result is _ 1E100) or a mathematical error (such as divide-by-zero).
Err: Memory
This error occurs when the TI-83 Plus does not have enough free RAM to perform the operation. Also, if the unit has less than 1024 bytes, the application will not start.
Fit Error
This error occurs when a regression fit cannot be performed on a scatterplot or xyline plot because the data in the lists is not compatible with that type of regression. The error also occurs if you press « to break (stop) a regression fit calculation in progress.

TI-83 Plus Science Tools Application Page 82
Input Error
This error occurs when an invalid entry is entered in an editor field. For example, an error occurs if you enter 1..2 instead of 1.2.
Stat Error
This error occurs if you select STAT to perform a one-variable statistical calculation on a list containing data that is incompatible with one-variable analysis.
Errors While Downloading
Low Battery Condition
Do not attempt a Flash download if the low-battery message appears on the calculator. Low-battery indication is shown on the initial screen. If you receive this error during an installation, change the batteries before trying again.

TI-83 Plus Science Tools Application Page 83
Archive Full
This error occurs when the TI�83 Plus does not have sufficient memory for the application. To make room for another application, you must delete an application and/or archived variables from the TI�83 Plus. Before you delete an application, you can back it up by using the TI�GRAPH LINK™ software for the TI�83 Plus. You can reload it to the TI�83 Plus later using the TI�GRAPH LINK software.
Link Transmission Error
This error indicates that the TI�GRAPH LINK software is unable to communicate with the TI�83 Plus. The problem is usually associated with the TI�GRAPH LINK cable and its connection to the TI�83 Plus and/or to the computer. Make sure the cable is firmly inserted in the calculator I/O port and the computer. Verify that the correct cable type is selected in the TI�GRAPH LINK link settings.
If this does not correct the problem, try a different TI�GRAPH LINK cable and reboot your computer. If you continue to get this error, please contact TI-Cares™ Customer Support for assistance.

TI-83 Plus Science Tools Application Page 84
Error in Xmit
This problem is usually associated with the TI�GRAPH LINK™ cable and its connection between the TI�83 Plus calculators. Make sure the cable is firmly inserted in the I/O port of each calculator.
If you continue to get this error, please contact TI-Cares™ Customer Support.
Invalid Signature or Certificate
Either this calculator does not have a certificate to run the application, or electrical interference caused a link to fail. Try to install the application again. If you continue to receive this error, contact TI-Cares Customer Support.

TI-83 Plus Science Tools Application Page 85
Checking Version Numbers and Free Space
Verifying the Operating System Version and ID Number
The Science Tools application is compatible with the TI�83 Plus operating system 1.13 and higher.
To verify the TI�83 Plus operating system version number:
1. From the home screen, press \ /.
2. Select ABOUT.
The operating system version number is displayed below the calculator name and has the format x.yy. The ID number appears on the line below the product number.
TI-83 Plus Science Tools Application Page 86
Verifying the Flash Application Version
1. Press n.
2. Select SciTools. The information screen is displayed.
The version number appears on the information screen below the application name.
Checking the Amount of Flash Application Free Space
1. From the home screen, press \ /.
2. Select Mem Mgmt/Del.
The Science Tools application requires at least 32,768 bytes of ARC FREE (Flash) to load the application.
For more information about memory and memory management, refer to the TI�83 Plus manual.

TI-83 Plus Science Tools Application Page 87
Texas Instruments (TI) Support and Service Information
For General Information
E-mail: [email protected]
Phone: 1-800-TI-CARES (1-800-842-2737) For US, Canada, Mexico, Puerto Rico, and Virgin Islands only
Home page: http://education.ti.com
For Technical Questions
Phone: 1-972-917-8324
For Product (Hardware) Service
Customers in the US, Canada, Mexico, Puerto Rico, and Virgin Islands: Always contact TI Customer Support before returning a product for service.
All other customers: Refer to the leaflet enclosed with your product (hardware) or contact your local TI retailer/distributor.

TI-83 Plus Science Tools Application Page 88
End-User License Agreement BY INSTALLING THIS SOFTWARE YOU AGREE TO ABIDE BY THE FOLLOWING PROVISIONS.
1. LICENSE: Texas Instruments Incorporated (“TI”) grants you a license to use and copy the software program(s) (“License Materials”) contained on this diskette/CD/web site. You, and any subsequent user, may only use the Licensed Materials on Texas Instruments calculator products.
2. RESTRICTIONS: You may not reverse-assemble or reverse-compile the Licensed Materials. You may not sell, rent, or lease copies that you make.
3. COPYRIGHT: The Licensed Materials and any accompanying documentation are copyrighted. If you make copies, do not delete the copyright notice, trademark, or protective notices from the copies.
4. WARRANTY: TI does not warrant that the Licensed Materials or documentation will be free from errors or that they will meet your specific requirements. THE LICENSED MATERIALS ARE PROVIDED “AS IS” TO YOU OR ANY SUBSEQUENT USER.
5. LIMITATIONS: TI makes no warranty or condition, either expressed or implied, including but not limited to any implied warranties of merchantability and fitness for a particular purpose, regarding the Licensed Materials.
IN NO EVENT SHALL TI OR ITS SUPPLIERS BE LIABLE FOR ANY INDIRECT, INCIDENTAL, OR CONSEQUENTIAL DAMAGES, LOSS OF PROFITS, LOSS OF USE OR DATA, OR INTERRUPTION OF BUSINESS, WHETHER THE ALLEGED DAMAGES ARE LABELED IN TORT, CONTRACT, OR INDEMNITY.
SOME STATES OR JURISDICTIONS DO NOT ALLOW THE EXCLUSION OR LIMITATION OF INCIDENTAL OR CONSEQUENTIAL DAMAGES, SO THE ABOVE LIMITATION MAY NOT APPLY.
IF YOU AGREE TO BE BOUND BY THIS LICENSE, CLICK ON THE “ACCEPT” BUTTON; IF YOU DO NOT AGREE TO BE BOUND BY THIS LICENSE, CLICK ON THE “DECLINE” BUTTON TO EXIT THE INSTALLATION.

TI-83 Plus Science Tools Application Page 89
Page Reference
This PDF document contains electronic bookmarks designed for easy on-screen navigation. If you decide to print this document, please use the page numbers below to find specific topics.
Important Information............................................................................................ 2
What Is the Science Tools Application? ............................................................... 3
What You Need .................................................................................................... 5
Where to Find Installation Instructions ................................................................. 5
Sig-Fig Calculator Tool ......................................................................................... 6
Unit Converter Tool............................................................................................. 30
Data and Graphs Wizard Tool ............................................................................ 43
Vector Calculator Tool ........................................................................................ 65
Deleting the Science Tools Application............................................................... 80
Science Tools Error Messages........................................................................... 81
Errors While Downloading .................................................................................. 82
Checking Version Numbers and Free Space ..................................................... 85
Verifying the Operating System Version and ID Number ................................... 85
Verifying the Flash Application Version .............................................................. 86
Checking the Amount of Flash Application Free Space ..................................... 86
Texas Instruments (TI) Support and Service Information................................... 87
End-User License Agreement............................................................................. 88