Through air drying - DiVA portal742455/FULLTEXT01.pdf · Through air drying - The influence of ......
46
Through air drying The influence of formation and pulp type on non-uniform drying and air flow Aron Tysén LICENTIATE THESIS | Karlstad University Studies | 2014:49 Chemical Engineering Faculty of Health, Science and Technology
Transcript of Through air drying - DiVA portal742455/FULLTEXT01.pdf · Through air drying - The influence of ......

Through air dryingThe influence of formation and pulp type on non-uniform drying and air flow
Aron Tysén
LICENTIATE THESIS | Karlstad University Studies | 2014:49
Chemical Engineering
Faculty of Health, Science and Technology
Aron Tysén | T
hrough air drying | 2014:49
Through air drying
The removal of water is an integral part of tissue paper production. Through air drying (TAD) is used for water removal when producing premium tissue grade products, however, at the price of higher energy demand. A better understanding of TAD may therefore lower the energy demand.
The objective was to investigate the influence of formation, pulp type and grammage on non-uniform drying and air flow through sheets. A laboratory method, based on infrared thermography, was used to determine drying time and area-specific and mass-specific drying rates. Air flow rate and pressure drop were used to determine flow resistance and modified permeability.
Pulp type had a large influence on the air flow through the sheet. Modified permeability, i.e. the material property describing the air flow through the fibre network, was strongly dependent on grammage for lower grammages, while it approached a constant value for higher grammages. In contrast to that, mass-specific drying rates were similar for the different pulp types at lower grammages, but proved to be grammage-dependent for higher grammages. Formation did not influence the drying speed to any large extent.
The results illustrate that industrial TAD processes operate under very special process conditions due to the low grammage sheets.
LICENTIATE THESIS | Karlstad University Studies | 2014:49
ISSN 1403-8099
ISBN 978-91-7063-585-4

LICENTIATE THESIS | Karlstad University Studies | 2014:49
Through air dryingThe influence of formation and pulp type on non-uniform drying and air flow
Aron Tysén
urn:nbn:se:kau:diva-33515
Distribution:Karlstad University Faculty of Health, Science and TechnologyDepartment of Engineering and Chemical SciencesSE-651 88 Karlstad, Sweden+46 54 700 10 00
© The author
ISBN 978-91-7063-585-4
Print: Universitetstryckeriet, Karlstad 2014
ISSN 1403-8099
Karlstad University Studies | 2014:49
LICENTIATE THESIS
Aron Tysén
Through air drying - The influence of formation and pulp type on non-uniform drying and air flow
WWW.KAU.SE

i
Abstract
The removal of water is an integral part of tissue production. Through air
drying (TAD) is used for premium tissue grade products. Improved product
properties are obtained at the price of high energy demand. A better
understanding of the TAD process may lower energy demand.
The objective of the work in this thesis was to investigate the influence of
formation, grammage, and pulp type on drying and air flow through sheets. A
method was developed, based on infrared thermography, to determine local
drying time of laboratory sheets on a sub mm-scale, while monitoring air flow
and pressure drop of the TAD process. Samples with good and bad formation
and samples from different pulp types with grammages ranging between 15 and
60 g/m² were evaluated.
Modified permeability was used to evaluate air flow characteristics. Samples
with lower grammages had significantly higher modified permeability. The
permeability decreased as the grammage increased and approached a constant
value for the highest grammages. The grammage-dependency at lower
grammages was considered to be either an effect of a change in pore structure
or an edge effect at the sheet surfaces. When comparing the permeability
obtained for the different pulp types, it was found to be linearly decreasing with
sheet density and increasing with the fibre wall thickness.
Almost all samples had a linear relationship between the amount of removed
water and drying time. Thus, the area-specific drying rate was similar for most
samples. A mass-specific drying rate was introduced, which for low grammages
was independent of the modified permeability, i.e. the flow through the fibre
network at a given grammage, of the different pulps. However, for higher
grammages, the mass-specific drying rate became dependent on the modified
permeability to an increasing extent. Despite a large variation in local
grammage, i.e. formation, only relatively small differences in drying time non-
uniformity were observed.
In conclusion, the properties of sheets, with a grammage typical for the
industrial TAD-process for tissue manufacturing, differed significantly in terms
of modified permeability and mass-specific drying rate, from those of sheets
with higher grammages.

ii
Sammanfattning
Avlägsnandet av vatten är en fundamental del av mjukpapperproduktion.
Genomblåsningstorkning (TAD) används för högkvalitativa produkter.
Förbättrade produktegenskaper uppnås, men till priset av hög energiåtgång. En
djupare förståelse av TAD-processen skulle kunna leda till sänkt energibehov.
Målet med arbetet för denna avhandling var att undersöka inverkan av
formation, ytvikt och massatyp, på torkning och luftflöden genom ark. En
metod utvecklades, där termografi användes för att bestämma lokal torktid i
mindre än mm-skala hos laboratorieark, samtidigt som luftflöde och tryckfall
mättes, under en TAD-process. Ark med bra och dålig formation och ark från
olika massatyper med ytvikter mellan 15 och 60 g/m² tillverkades för
utvärdering.
Modifierad permeabilitet användes för att utvärdera luftflödesegenskaper.
Prover med lägre ytvikter hade signifikant högre modifierad permeabilitet.
Permeabiliteten minskade när ytvikten ökade och närmade sig ett konstant
värde för de högsta ytvikterna. Ytviktsberoendet vid lägre ytvikter antogs vara
antingen en effekt av en förändring i porstruktur, eller en kanteffekt vid arkens
ytor. När permeabiliteten för de olika massatyperna jämfördes, visade den sig
vara linjärt minskande med arkdensitet och ökande med fiberväggtjocklek.
Nästan alla prover hade ett linjärt samband mellan mängden borttaget vatten
och torktid. Således var den area-specifika torkningshastigheten likartad för de
flesta prover. En mass-specifik torkningshastighet introducerades, som för låga
ytvikter var oberoende av den modifierade permeabiliteten, d.v.s. flödet genom
arket vid en given ytvikt, hos de olika massorna. För högre ytvikter blev dock
den mass-specifika torkningshastigheten beroende av den modifierade
permeabiliteten i allt större utsträckning. Trots en stor variation i lokal ytvikt,
d.v.s. formation, uppmättes relativt små skillnader i ojämn lokal torktid mellan
alla ark.
Sammanfattningsvis är arkegenskaper vid ytvikter typiska för den industriella
TAD-processen för mjukpapperstillverkning signifikant skilda, vad gäller
modifierad permeabilitet och mass-specifik torkningshastighet, från egenskaper
hos ark med högre ytvikter.

iii
List of papers
The following publications are included in this licentiate thesis.
Paper I
Tysén, A., Vomhoff, H. (2014): Method for the quantification of in-plane
drying non-uniformity, Submitted to Nordic Pulp and Paper Research Journal.
Paper II
Tysén, A., Vomhoff, H. (2014): The influence of formation on air flow through
and non-uniform drying of low grammage sheets, Innventia Report 546.
Paper III
Tysén, A., Vomhoff, H., Nilsson, L. (2014): The influence of pulp type on
through air drying, Innventia Report 548.
Results related to this thesis have been presented at the following conference:
1. Tysén, A., Östlund, C., Vomhoff, H.: Investigation of non-uniform
drying of paper using IR and NIR imaging, Poster presentation, The
15th Fundamental Research Symposium, Robinson College, Cambridge,
England, 10th of September 2013.

iv
The thesis author’s contribution to the papers
Paper I.
Most of the method development, most of the experimental work, the
entire analysis of the experiments, and the writing of the report was carried
out by Aron Tysén. The basis of the measurement method for the airflow
was originally developed by Peter Åslund. The sheet making was carried out
by summer students at Innventia.
Paper II.
The experimental work, the entire analysis of the experiments, and the
writing of the report was carried out by Aron Tysén. The formation
measurement was carried out by Margareta Lind.
Paper III.
The experimental work, the entire analysis of the experiments, and the
writing of the report was carried out by Aron Tysén. The formation
measurement was carried out by Margareta Lind.

v
Table of contents
Abstract ...........................................................................................................................i
Sammanfattning ........................................................................................................... ii
List of papers ............................................................................................................... iii
The thesis author’s contribution to the papers ................................................... iv
Table of contents ......................................................................................................... v
1. Introduction ............................................................................................................. 1
1.1. Tissue paper, properties and raw materials ................................................... 1
1.2. Tissue production process ............................................................................... 3
1.3. Dewatering ........................................................................................................ 5
1.4. Earlier work related to through air drying .................................................... 6
2. Objective ................................................................................................................. 10
3. Materials and methods .......................................................................................... 11
3.1. Laboratory drying equipment ....................................................................... 11
3.2. Thermographic method ................................................................................. 12
3.3. Flow measurements........................................................................................ 14
3.4. Raw materials and samples ............................................................................ 16
3.5. Formation ........................................................................................................ 17
4. Results ..................................................................................................................... 20
4.1. Air flow ............................................................................................................ 20
4.2. Mean drying time ............................................................................................ 24
4.3. Non-uniformity in drying .............................................................................. 27
4.4. Energy efficiency evaluation ......................................................................... 28
5. Conclusions ............................................................................................................ 30
6. Future studies ......................................................................................................... 32
7. Acknowledgements ............................................................................................... 33
8. References ............................................................................................................... 34

vi

1
1. Introduction
Paper is a heterogeneous material based on plant fibres, predominantly from
wood, and sometimes additives if applicable for the process and product. The
production process entails disintegrating wood into individual fibres and
sometimes removing certain components, mainly lignin. The fibres and water
make up a suspension with low concentration. This pulp suspension is
dispersed on a wire and the water is removed, mechanically and by thermal
energy. After that there is a converting stage, where the base paper is cut and
processed into any of the numerous paper products that exist.
1.1. Tissue paper, properties and raw materials
Tissue paper is a quite unique paper product, with many features distinguishing
it from other paper products. Tissue paper mainly comprises toilet paper,
towels and various napkins. Characteristic properties of the products are low
grammages, softness and high bulk, obtained by creping or other out-of-plane
structuring, and selection of raw material. Many products have a multi-ply
structure, which can be beneficial for the intended purpose of the product.
For all the varying tissue products, there is a wide span of properties needed in
the final product. As an example, toilet paper needs softness, but should
disintegrate easily when disposed in water. Towels, on the other hand, should
have high absorption capacity, and high wet strength, as it should not dissolve
during wiping. These properties are obtained by combining suitable raw
materials with appropriate process conditions. The influence of the process can
be substantial. TAD produced paper can for instance have more than twice as
high absorption capacity, due to structural differences obtained during the
process (Gavelin et al. 1999).
1.1.1. Fibre structure and morphology
Wood fibres have a lamellar structure and the main chemical components are
cellulose, hemicelluloses and lignin. The lignin mainly acts as glue, holding the
fibres together, whereas cellulose and hemicelluloses make up the fibre wall, in
layers with different fibrillar angle (orientation of the cellulose fibrils) and ratio
of the constituents. Inside the fibre wall, there is a void called the lumen.

2
Wood fibres are generally divided into two groups, dependent on the species of
the trees. Hardwoods have shorter and thinner fibres, whereas softwoods have
longer and thicker. Typical lengths are ~1 mm for hardwoods and ~2-3 mm for
softwoods, and the width may be ~15-20 µm for hardwoods and ~25-60 µm
for softwoods (Karlsson 2006). Hardwood fibres thus tend to have lower
aspect ratio, which is the ratio of length to width. An important property of the
fibre is the fibre wall thickness, as it will determine to what degree the fibre
tend to collapse. Fibres with a thin fibre wall tend to collapse easy, which leads
to higher density in the paper product (Bristow et al. 1991).
Hardwood fibres give good softness and are therefore often used at the surface
of tissue paper, while softwood fibres give strength and bulk, and thus are
suitable in the centre of the paper. Common species of wood are eucalyptus
and acacia, which are hardwoods, and pine and spruce, which are softwoods.
The properties and morphology of the fibres are also affected by how the fibres
were extracted from the wood. Bleached chemical pulp is usually used for tissue
production (Gavelin et al. 1999).
The structure of the fibre wall is of importance for how water is retained in
paper, since the fibre wall may hold as much water as its own weight, or even
more, depending on fibre type.
1.1.2. Water in fibres
When a fibre web is saturated with water, there are critical differences to the
water depending on where it is located. Water is either retained inside the
porous structure of the fibre wall, in the lumen, or in the larger pores created
between the fibres. The water between fibres is bulk water, with properties
close to the normal conditions found in room temperature at atmospheric
pressure. The water inside the fibre wall is categorised by the size of the pores
containing it, and if there is a molecular bond, or other forces holding it in
place. This water can be very difficult to remove, and is always the last water to
leave the web. This results in an increasing difficulty to remove water during
paper making (Maloney and Paulapuro 1999; Stenström 2004).
The water a fibre can hold is commonly measured by a centrifugal method,
resulting in what is called the water retention value (WRV). It is a simple
method which gives quick information on the fibres ability to hold water. Some
3
caution should be heeded, as the method in some cases may give a misleading
value (Maloney et al. 1999).
1.2. Tissue production process
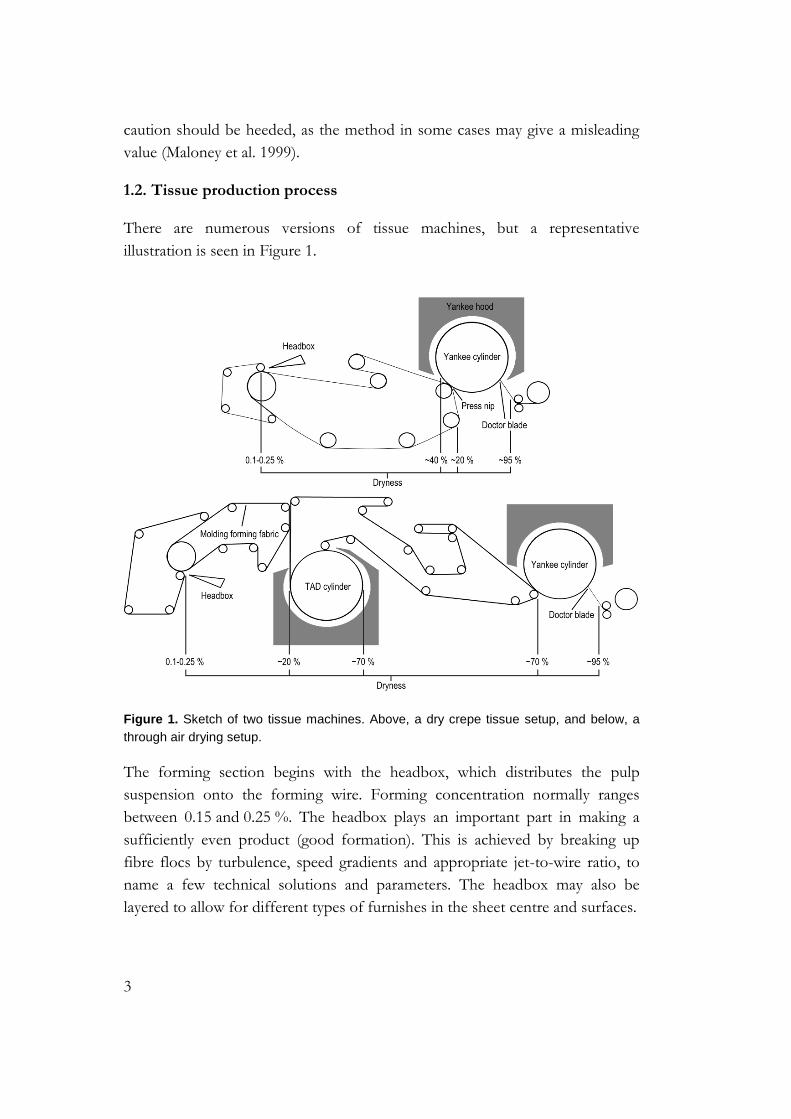
There are numerous versions of tissue machines, but a representative
illustration is seen in Figure 1.
Figure 1. Sketch of two tissue machines. Above, a dry crepe tissue setup, and below, a
through air drying setup.
The forming section begins with the headbox, which distributes the pulp
suspension onto the forming wire. Forming concentration normally ranges
between 0.15 and 0.25 %. The headbox plays an important part in making a
sufficiently even product (good formation). This is achieved by breaking up
fibre flocs by turbulence, speed gradients and appropriate jet-to-wire ratio, to
name a few technical solutions and parameters. The headbox may also be
layered to allow for different types of furnishes in the sheet centre and surfaces.

4
In tissue making it is common to have a crescent former configuration, but
there are also s-wrap formers and c-wrap formers, see Figure 2. The common
configurations are all based on roll forming, where the jet is sprayed in between
either twin wires or a wire and a felt. These configurations are suitable for the
considerable machine speeds used in tissue making, up to 2200 m/min (Gavelin
et al. 1999).
Figure 2. Sketch of common former configurations. “I” is a crescent former, “II” is an s-
wrap former and “III” is a c-wrap former configuration.
The paper web is exposed to gravitational and vacuum dewatering on its way to
the most defining part of the tissue machine, the Yankee cylinder. At the
cylinder, the web is pressed once or twice against the Yankee surface. This
dewaters the web, but also transfers it onto the Yankee cylinder. The cylinder
has three main purposes. Heat is supplied by steam in the centre of the cylinder,
making the cylinder surface close to 100°C, which causes thermal drying of the
web to completion, in combination with impingement drying from the hood. It
also carries the web forward in the machine, and finally plays a part in creping
of the sheet, when the paper is scraped of the cylinder. To accomplish these
functions, the Yankee cylinder is coated with chemicals, designed to first adhere
the web to the cylinder surface, and then to release the dry sheet at the creping
blade (Klerelid and Milosavljevic 2010).
Creping is done by lightly pressing a creping blade, also known as a doctor
blade, towards the Yankee cylinder, which scrapes the paper off. This does not
only remove the paper from the cylinder, it also generates the creped pattern of
the sheet which is characteristic for tissue paper. It consists of micro folds in
the machine direction, giving the sheet stretch and volume. A normal creping
ratio is around 20 %, which is a ratio of the Yankee cylinder speed and the
machine reel speed. The creping increases softness and absorption, and as such

5
is an important part in the generation of suitable properties of tissue products
(Gavelin et al. 1999).
After the creping, the paper is ready for converting, where the base paper is
processed by stacking plies, printing, embossing and cutting, to finalise the
product. Printing on tissue paper is generally a purely aesthetic process, but
embossing is important for the properties of the final product. Embossing,
which is a 3-dimensional out-of-plane deformation of the paper, allow the
production of products with a high bulk, in order to increase the absorption
capacity.
Most tissue paper is produced according to the dry creped tissue (DCT)
method, the process which has just been described. However, through air dried
(TAD) tissue is becoming more and more common, especially in the U.S.
(Uutela 2014). This process involves no pressing and instead has a special
process step, where the wet web (~20 % dryness) is transferred onto a wire
with a three dimensional structure. The wire first passes over a moulding box,
where the web is conformed by the wire. Then, it passes over large, very open,
vacuum or pressurised cylinders, where the sheet is exposed to through air
drying. This allows a three dimensional structure to be permanently formed in
the paper during the drying of the sheet. This structure is partially maintained
even after the tissue product is soaked in water. The large open cylinders
necessitate large volumes of heated gas for the drying to progress to the
required dryness (Klerelid and Milosavljevic 2010).
1.3. Dewatering
The paper making process is in many ways the process of removing water.
Starting with a forming concentration of 0.5 % solids, and ending with 95-97 %
solids, the water removal must be as efficient as possible. On a DCT tissue
machine, water is first removed by centrifugal and gravitational forces, while
aided by vacuum boxes. Then the web is pressed to ~40-45 % dryness. After
that, mechanical dewatering becomes difficult and thermal energy must be
applied. This is achieved by the Yankee cylinder and the hood. The Yankee
cylinder is heated with steam from the inside, resulting in a Yankee surface
temperature of close to 100°C, while the hood is consisting of batteries of
nozzles, supplying impingement drying at several hundred °C. The thermal

6
drying is costly from an energy perspective, and it is therefore highly beneficial
to obtain as high dryness as possible in the pressing stage.
As mentioned before, an alternative method of producing tissue paper is TAD.
No pressing is done here, as it would destroy the three dimensional structure of
the paper web, and by that, losing the superior properties obtained with the
structure. The TAD cylinders are kept at a constant pressure drop and heated
flue gas (100-250°C) is used as drying medium. This kind of drying result in
extremely high area-specific drying rates (170-500 kg/hm²) compared to
conventional drying. The energy and equipment cost are also much higher,
since thermal drying starts at a lower dryness, as the process does not have a
pressing stage (Klerelid and Milosavljevic 2010; Weineisen 2007).
In general, a drying process is often characterised by plotting drying rate as a
function of moisture content. The shape of this drying rate curve is different
for various materials. For paper, the drying rate curve is often divided into three
stages. First there is a period of increasing drying rate, and then there is a period
of constant drying rate, and finally a period of decreasing drying rate. This type
of curve is applicable regardless of drying method. The periods of drying can be
related to where the water being removed is located. Especially the onset of the
period with decreasing drying rate, indicates that the drying is becoming more
difficult, which occurs when little to no free water is left in the web, and the
water in the fibre wall is removed (Weineisen 2007).
1.4. Earlier work related to through air drying
TAD is an uncommon drying technique for paper, and as such not as well
documented as conventional multi-cylinder drying. Much of the work
previously done was either focused on determining drying rate curves, and
understanding the onset of the drying rate periods, or focused on investigating
the applicability of TAD for other paper grades than tissue.
Fundamental studies related to TAD drying have been carried out by many
researchers.
Gummel and Schlünder (1980) developed a drying equipment, where
continuous measurements of the exhaust air humidity and temperature enabled
the drying rate as a function of moisture content to be determined. This is an

7
approach which has been utilized in many of the investigations of through air
drying. From the collected data, mass transfer coefficients could be determined.
Polat (1989), Polat et al. (1991) presented an extensive work on through air
drying where he, and colleagues, investigated the drying rate curves of large sets
of samples with grammages ranging from 25 to 160 g/m², with similar
methodology as Gummel. They also varied air temperature and air flow rate.
The objective was to find at what critical moisture contents the periods of
drying occurred for various types of paper and process conditions. Polat found
that low grammage paper rarely has a constant drying rate. Even at very low air
flow rates the drying rate goes from increasing to decreasing and no period with
a constant drying rate is observed. Polat also deducted that Darcy’s law, often
used to describe the relationship between pressure drop and air flow rate in
packed beds, is not recommended for paper, as the inertial losses have an
impact even at low air flow rates.
Recognising the importance of the drying rate curves from Polat’s work, several
investigations were performed to further the understanding of them. Chen
(1994), Chen and Douglas (1997) studied the combination of impingement
drying and through air drying on the drying rate curve. They related moisture
content to the onset of the drying rate periods for various grammages,
temperatures and air flow rates. Drying rates were not significantly affected by
providing drying as impingement flow.
Gomes et al. (1992) were among the first to study the influence of non-
uniformity in through air drying. The investigation was based on drying data
from Polat’s work and on simulated flocculated sheets. From the simulations it
was concluded that non-uniformity had a detrimental impact on drying.
In several publications by Hashemi et al. (Hashemi et al. 1994; Hashemi and
Douglas 2003; Hashemi and Douglas 2004; Hashemi et al. 1997a; Hashemi et
al. 1997b; Hashemi et al. 2001), the focus was on investigating machine formed
paper, and the possibility to use TAD in combination or replacing cylinder
drying for other grades than tissue. Hashemi also investigated the non-
uniformity of drying both by interrupting drying and spot measuring the
moisture content, and by using a grid of thermocouples mounted immediately
under the sample. Hashemi et al. found that there was a peak in non-uniformity
of drying at 40 g/m², with grammages below acting more like a screen, and

8
grammages above being less influenced by variations due to bulk. They also
found that non-uniform drying was influenced by several process parameters,
where ingoing dryness was one of the few not influencing the drying. They also
found that furnish and sheet structure affected the pressure drop over samples
significantly, but not drying rate curves.
Ryan et al. (2003) and Zuo et al. (2004) used similar setups with thermocouples
to measure influence of non-uniformity on various process parameters. Zuo et
al. also included hot wire anemometers to measure the non-uniformity of air
flow simultaneously as non-uniformity of drying. They found the variation in
air flow to peak earlier than variations in drying, and to be of much lesser
extent.
Weineisen (2007) studied through air drying under conditions more similar to
industrial conditions, and showed a significant influence of air temperature and
pressure drop on drying rate curves. He also developed a model for through air
drying. From the modelling work, he found that pore size distribution was of
paramount importance for the onset of drying rate periods. It was also found to
increase non-uniform drying and creating bypass channels, in areas dried out
first.
Modak et al. (2009) used a modified version of the Forchheimer equation
(Darcy’s law with a term added to account for inertial losses) to study the
influence of process parameters such as refining, pressing and temperature on
the viscous and inertial flow parameters. They found a significant effect of
refining on the viscous and inertial drag coefficients, indicating the importance
of web structure and morphology. The effect diminished as moisture was
removed. They also showed the relative contribution of viscous resistance to
flow as a function of superficial velocity. Going from velocity of <1 m/s to 5
m/s changed to contribution of viscous resistance from ~90 % to somewhere
between 30 and 60 %.
In regards to measurement technology, thermography and near infrared (NIR)
imaging has been suggested by many researchers as a way of indirectly studying
water content in paper (Banerjee 2008; Keränen et al. 2009; Kiiskinen et al.
1997; Rosén and Vomhoff 2010). It is also used as a diagnostics tool in the
industry (Charles 2000; Melkert 2014; Vickery and Atkins 1978). It has
however, not been used in any extensive investigation of through air drying.

9
The influence of pulp type appears not to have been extensively studied. There
seems to be an overlap of possibilities, where spatial non-uniformity of through
air drying is of importance for an effective tissue production, and could be
studied with higher resolution than previously available, if combined with a
thermographic method.

10
2. Objective
The objective of this thesis was to study two aspects of through air drying,
namely:
The influence of formation on non-uniform drying and air flow through
low grammage sheets.
The influence of pulp type on non-uniform drying and air flow through low
grammage sheets.
In order to achieve these objectives, a method based on thermography was
developed in order to study through air drying with a high spatial resolution at
the same time as the important process related parameters were measured.

11
3. Materials and methods
3.1. Laboratory drying equipment
A laboratory drying equipment was developed and used for all measurements in
this thesis. A sketch of the equipment can be seen in Figure 3 and the sample
arrangement in Figure 4.
Figure 3. A sketch of the drying equipment and the measuring equipment (dimensions
are not to scale).

12
Figure 4. Top view (A) and cross section side view (B) of the sample arrangement in the
equipment. The side view illustrates in what order the components were stacked. In the
top view the analysed area (~90×90 mm²) is also drawn (dimensions are not to scale).
A sample (13) was placed on the wire (11) and restrained by the frame (14). A
plastic film (12) between the sample and the wire defined the area to be dried
(100×100 mm²). A fan (10) was connected to the wire and fitted with a
pneumatic valve (8) to allow turning the air flow on and off instantaneously.
This setup enabled the drying of the samples. A Venturi pipe (9) was installed
between the wire and the fan. The differential pressure to the atmosphere was
logged by differential pressure transmitters (5, 6, 7) on two places in the Venturi
pipe for air flow calculations and immediately under the wire, to measure the
pressure drop. The humidity and temperature of the atmosphere was logged by
a humidity and temperature sensor (2). The surface temperature of the sample
was continuously measured by an infrared (IR) camera (1) with a resolution of
640×512 pixels, whereof 316×314 pixels represented the analysed area. Further
details are found in Paper I.
3.2. Thermographic method
The IR-camera captured the entire drying sequence. At the resolution and
distance between the camera and sample used for this work, the pixel size was
0.28 mm². Six arbitrarily chosen frames from a typical drying sequence are
shown in Figure 5.
13
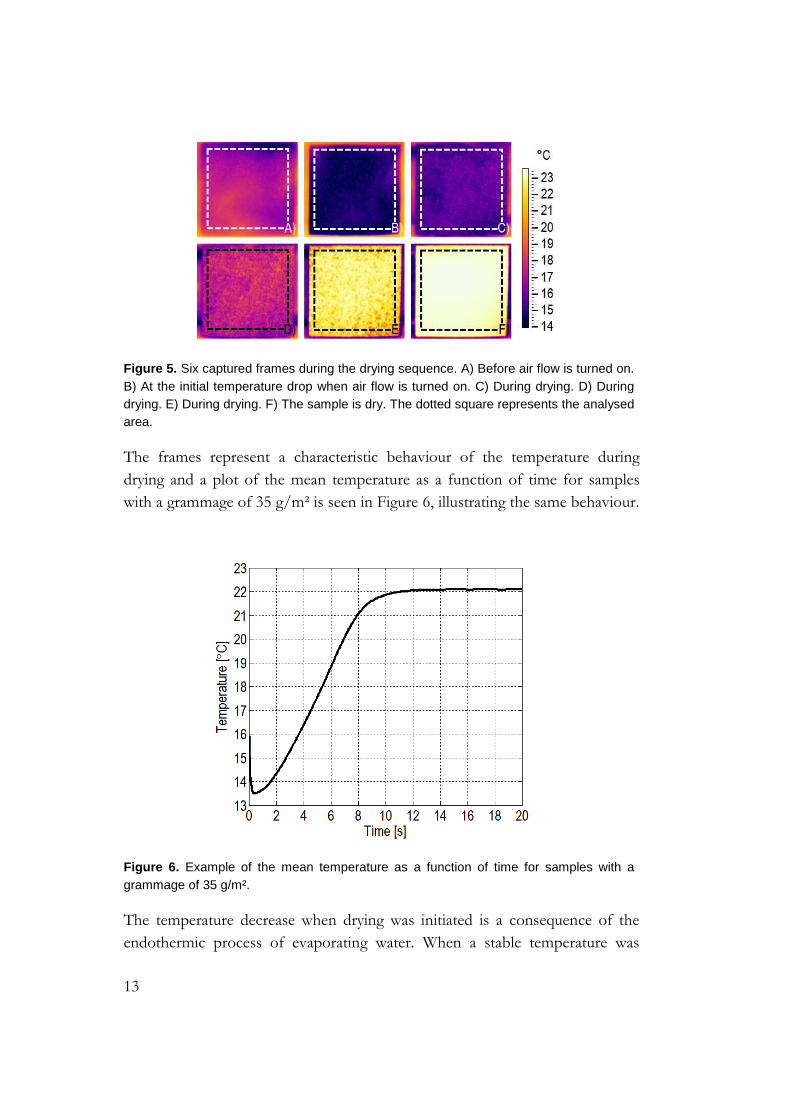
Figure 5. Six captured frames during the drying sequence. A) Before air flow is turned on.
B) At the initial temperature drop when air flow is turned on. C) During drying. D) During
drying. E) During drying. F) The sample is dry. The dotted square represents the analysed
area.
The frames represent a characteristic behaviour of the temperature during
drying and a plot of the mean temperature as a function of time for samples
with a grammage of 35 g/m² is seen in Figure 6, illustrating the same behaviour.
Figure 6. Example of the mean temperature as a function of time for samples with a
grammage of 35 g/m².
The temperature decrease when drying was initiated is a consequence of the
endothermic process of evaporating water. When a stable temperature was
14
reached, it was assumed that drying was concluded and the sample was
considered dry. Thus, a drying criterion was defined as when the temperature
had increased 95 % of the span from minimum temperature to constant
temperature of the dry sample. Using 95 % avoided noise in the signal to
erroneously affect the drying time, but also meant that the absolute drying time
was consistently slightly underestimated. The drying criterion was applied to all
pixels, determining local drying times. The drying time of the analysed area was
determined from the coefficient of variation (CoV) of temperature. When the
sample was dry, there were negligible variations, so when the CoV reached a
constant low value, the analysed area was considered dry. For the investigation
of the influence of formation and fibre morphology, the method was further
developed by applying a moving average over two seconds for all temperature
curves. This increased robustness of the method by minimizing noise without
removing gradients. All assumptions and details of the drying criteria are
presented in Paper I.
From the drying time, initial dryness and dryness after drying, a drying rate was
calculated. This was a classic area-specific drying rate (ASDR), with a unit of
kg/hm². To improve the analysis of the drying rate, a mass-specific drying rate
(MSDR) was introduced, defined as ASDR divided by grammage, with a unit of
(kg water/h)/(kg fibres).
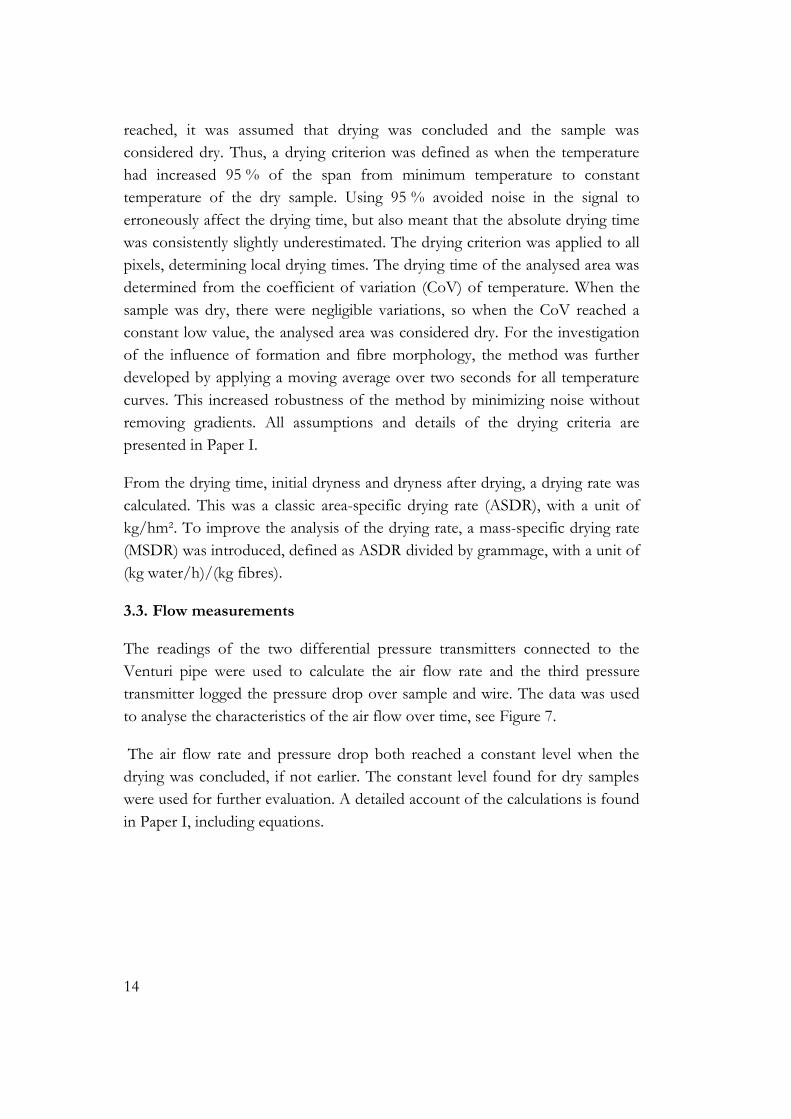
3.3. Flow measurements
The readings of the two differential pressure transmitters connected to the
Venturi pipe were used to calculate the air flow rate and the third pressure
transmitter logged the pressure drop over sample and wire. The data was used
to analyse the characteristics of the air flow over time, see Figure 7.
The air flow rate and pressure drop both reached a constant level when the
drying was concluded, if not earlier. The constant level found for dry samples
were used for further evaluation. A detailed account of the calculations is found
in Paper I, including equations.
15
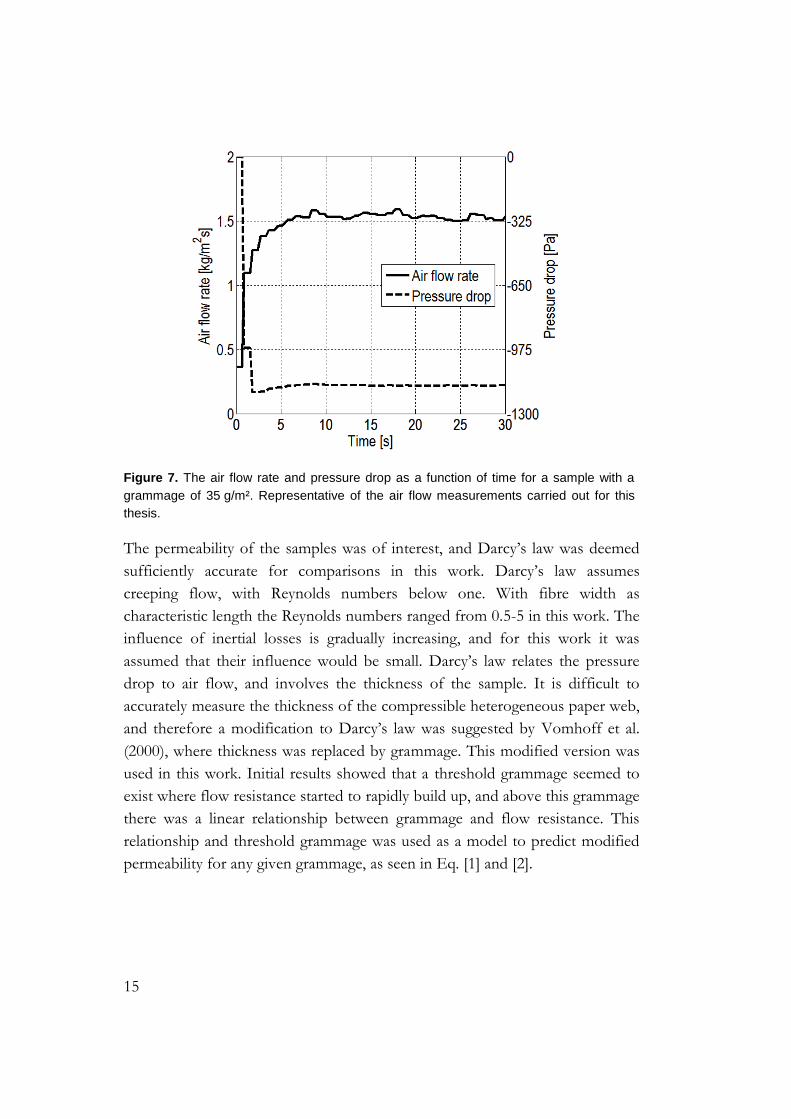
Figure 7. The air flow rate and pressure drop as a function of time for a sample with a
grammage of 35 g/m². Representative of the air flow measurements carried out for this
thesis.
The permeability of the samples was of interest, and Darcy’s law was deemed
sufficiently accurate for comparisons in this work. Darcy’s law assumes
creeping flow, with Reynolds numbers below one. With fibre width as
characteristic length the Reynolds numbers ranged from 0.5-5 in this work. The
influence of inertial losses is gradually increasing, and for this work it was
assumed that their influence would be small. Darcy’s law relates the pressure
drop to air flow, and involves the thickness of the sample. It is difficult to
accurately measure the thickness of the compressible heterogeneous paper web,
and therefore a modification to Darcy’s law was suggested by Vomhoff et al.
(2000), where thickness was replaced by grammage. This modified version was
used in this work. Initial results showed that a threshold grammage seemed to
exist where flow resistance started to rapidly build up, and above this grammage
there was a linear relationship between grammage and flow resistance. This
relationship and threshold grammage was used as a model to predict modified
permeability for any given grammage, as seen in Eq. [1] and [2].

16
1 Tot w
m
V m P P P
A A R R Rw R
k
[1]
0( )m
w
k w wR a w w
[2]
In Eq. [1]-[2], �̇� is the volumetric flow, 𝐴 is the sample area exposed to drying,
�̇� is the mass flow rate, 𝜌1 is the air density, 𝛥𝑃 is the measured pressure drop,
𝑅𝑇𝑜𝑡 is the total flow resistance of the drying equipment and the sample
combined, 𝑅𝑤 is the flow resistance of the sample, ∑ 𝑅 is the contribution to
flow resistance from the equipment, obtained by not placing a sample on the
wire when logging air flow and pressure drop, 𝜇 is the air viscosity, 𝑘𝑚 is the
modified permeability, 𝑤 is the grammage, 𝑤0 is the threshold grammage
where the flow changed in nature, and 𝑎 is the slope of the linear relationship
between grammage and flow resistance.
3.4. Raw materials and samples
There were five pulps used in the work for this thesis. For the investigation of
influence of formation an unrefined bleached chemical birch pulp was used.
For the investigation of influence of fibre morphology two unrefined bleached
chemical hardwood pulps and two unrefined bleached chemical softwood pulps
were used. The hardwoods were eucalyptus from Fibria (EU) and acacia from
April (AC), and the softwoods were spruce from Södra (SB) and a spruce and
pine mix from Stora Enso (SE). In the formation investigation the grammages
used were 15, 25, 35 and 45 g/m², and in the fibre morphology investigation 60
g/m² was also included. Fibre properties are shown in Table 1.
Table 1. Fibre properties of the pulps used in the investigation of influence of pulp type.
Pulp Mean length
[mm]
Mean width
[µm]
Coarseness
[µm/g]
WRV
[g/g]
Calculated
FWT [µm]
AC 0.603 16.7 79.4 0.802 1.08
EU 0.651 18.3 95.4 0.975 1.18
SB 1.799 27.2 214.0 0.876 1.79
SE 1.843 29.3 194.0 0.925 1.48
The mean length (length-weighted), mean width (width-weighted) and
coarseness were measured with the Lorentzen & Wettre Fiber Tester. The
17
water retention value (WRV) was measured by standardised method (ISO
23714). The fibre wall thickness (FWT) was calculated from the coarseness and
fibre width under the assumption that the fibre wall had a density of
1500 kg/m³ and the fibre was a perfect circular pipe.
All samples were made in a Finnish standard (ISO 5269-1) sheet former. The
couching time was prolonged and extra blotting papers were used, compared to
standard procedure, to be able to handle the very low grammage sheets. To
obtain bad formation the delay time after mixing was increased to one minute.
An important factor when studying drying is the dryness. The dryness after
drying was concluded, was very similar for all samples, but the initial dryness
varied. The biggest variation was found in the hardwoods, where initial dryness
varied between 31.5-42.5 %. Especially the higher grammages stood out, having
lower dryness. To avoid this initial variation from influencing the analysis of the
drying data, the amount of removed water per square metre was used instead,
where applicable.
3.5. Formation
Formation is a term used to describe how even a sheet is. It can be readily
explained by holding a sheet to a light source. If the sheet looks uneven, there is
a good chance that the formation is bad. On a more technical level, formation
can be seen as the local variation of grammage in a sheet. Formation is often
measured by light scattering, but this should be used with caution, since for
instance calendering will change light scattering without changing the local
grammage of the sheet (Norman 2008).
In this thesis formation was measured by a β-radiogram method, which is only
affected by mass, and not scattering. The measurement is based on detecting
the amount of β-radiation transmitted through the sample and comparing to a
reference of known grammage. This measurement gives a grammage map, for
which a CoV can be determined as a quantifiable number of the formation. For
paper it has been found that formation of different scales are of interest and
thus, a fast Fourier transform is used to get the contribution of small-scale
variations (0.3-3 mm) and large-scale variations (3-30 mm) to the total
formation of the entire range (0.3-30 mm) (Johansson and Norman 1996;
Norman 2009).

18
The formation numbers as a function of grammage of the samples from the
investigation of the influence of formation on non-uniform drying are shown in
Figure 8 (good formation) and Figure 9 (bad formation).
Figure 8. The formation numbers of samples
with good formation as a function of
grammage (Paper II).
Figure 9. The formation numbers of
samples with bad formation as a function of
grammage (Paper II).
It was evident from the formation measurements that samples with bad
formation had been obtained as intended. When comparing the small-scale and
large-scale formation it was concluded that the major difference occurred in
large-scale formation. It was surprising that formation was improved with
grammage for the normal handsheets. Normally, the increase of forming
concentration would be expected to give worse formation. Interestingly, the
small-scale formation of samples with bad formation behaved similarly to the
samples with good formation. The improved formation with grammage seemed
to be small-scale, while the obtained bad formation due to the prolonged delay
time after mixing seemed to mostly influence the large-scale formation.
The total formation numbers of the samples made from the different pulps
(Paper III) are shown in Figure 10, as a function of grammage.
19
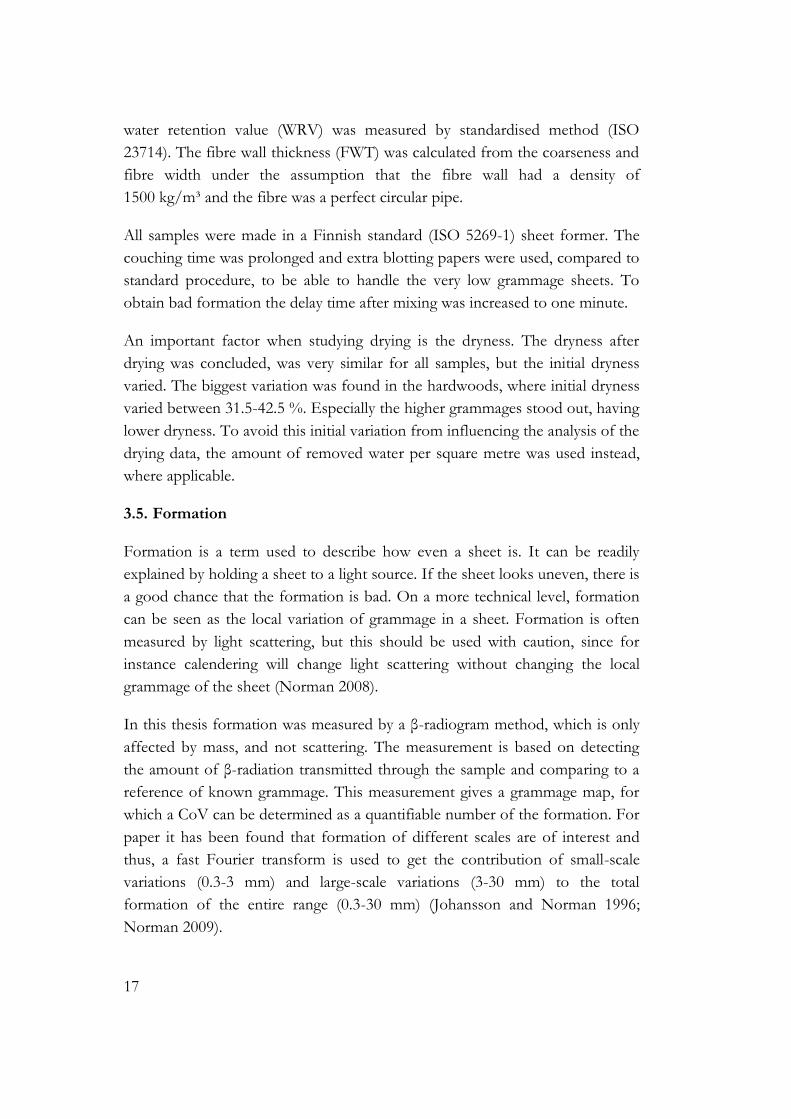
Figure 10. The total formation numbers of all samples
(Paper III).
The total formation numbers decreased with grammage, just as with the
samples with good formation from the study of influence of formation on non-
uniform drying. There was a large difference in formation between the samples
made of hardwood pulps and softwood pulps. With all three formation plots in
mind, it was believed that the draining speed was a key factor for the improving
formation. Hardwood samples dewatered much slower, which could give the
samples time to experience self-healing.

20
4. Results
4.1. Air flow
The air flow rate was determined as a function of grammage, formation, and
pulp type. Figure 11 and Figure 12 show examples of the air flow rate and
pressure drop as a function of time for samples with good formation.
Figure 11. The air flow rate as a function of
time for samples with good formation (Paper
II).
Figure 12. The pressure drop as a function
of time for samples with good formation
(Paper II).
The air flow rate decreased with grammage and pressure drop increased with
grammage, as expected. Both the air flow rate and pressure drop reached a
constant level within the first seconds of drying, well before the drying was
concluded. The continuous removal of water apparently did not change the
permeability of the samples with good or bad formation. The samples with bad
formation had the same trends for air flow rate and pressure drop as the
samples with good formation, but at slightly higher air flow rates and lower
pressure drops for all grammages.
In the study with the different pulp types, some new observations were made.
In Figure 13, the air flow rate and mean temperature of two samples are shown
as function of time. The samples are from acacia and spruce pulps, with a
grammage of 35 g/m². The pressure drop when the samples were dry is shown
in Figure 14 as a function of grammage.

21
Figure 13. Temperature and air flow rate as
a function of time for two pulps at similar
grammages. Spruce and acacia with a
grammage of 35 g/m² (Paper III).
Figure 14. Pressure drop of dry samples
from different pulps, as a function of
grammage (Paper III).
The softwood sample in Figure 13 had similar temperature curve as the samples
in the investigation of the influence of formation, but the air flow rate took
longer time to reach a constant level. In fact, the constant level was not reached
until the sample was very close to its drying time. The hardwood sample
differed even more, as the temperature curve did not immediately start to
increase after reaching its minimum value. The samples displaying this
behaviour were the samples with lowest initial dryness and lowest WRV, and
could therefore be expected to have the most water in between fibres. The air
flow rate again increased slower, and reached its constant level close to the
drying time. Since this meant that air flow rate and pressure drop changed with
time to a much higher degree than the samples with good or bad formation, the
air flow rate and pressure drop of the dry samples were used for further
analysis, to be comparable. As seen in Figure 14, the pressure drop of the
highest grammage of the acacia pulp was very close to the pressure drop
observed when the wire was covered with an impermeable plastic film. This
meant that those samples had very little air flowing through them, and the
contribution of leakage could not be disregarded.
Based on Eq. [1], the total resistance of both supporting wire and sample was
calculated, see Figure 15 and Figure 16.

22
Figure 15. Total flow resistance as a
function of grammage for samples with good
and bad formation (Paper II).
Figure 16. Total flow resistance as a
function of grammage for samples made
from different pulps (Paper III).
The flow resistance of all grammages, pulps and levels of formation showed a
linear relation as grammage was increased. The only deviating point was the
acacia at the highest grammage, which was where leakage was a factor, and thus
that point was discarded from further analysis. An interesting observation was
that the intercept of the flow resistance of the equipment (the line called only
wire in figures) and the extension of the linear relationships appeared at similar
grammages for all samples. It was reasoned that a threshold grammage existed,
where the air flow through the sheet changed in nature.
From the flow resistance of the samples, the modified permeability was
determined. Modified permeability as a function of grammage for all samples is
shown in Figure 17 and Figure 18.

23
Figure 17. Modified permeability as a
function of grammage for samples with good
and bad formation (Paper II).
Figure 18. Modified permeability as a
function of grammage for samples made
from different pulps (Paper III).
A clear general trend was observed. The modified permeability was highest for
low grammages and then decreased until it reached what appeared to be a
constant level. This was interpreted as the diminishing influence of either
changes in pore structure or edge effects at the surfaces of the sheets. When the
webs were thick enough these effects would be negligible, and the modified
permeability would not be dependent on the grammage. This continuum was
considered to have been reached for the two highest grammages of each pulp in
Figure 18, and their mean values were used as a material constant in the further
analysis. The relative accuracy of the model prediction of the modified
permeability for any grammage further suggests that the reasoning of pore
structure changes or edge effects at low grammages might have some credence.
All modified permeabilities of the pulps and grammages in the investigation of
the influence of pulp type, were plotted as a function of density in Figure 19.
The mean modified permeability, mentioned in the previous paragraph, was
plotted as a function of fibre wall thickness in Figure 20.

24
Figure 19. Modified permeability as a
function of density for samples made from
different unrefined pulps (Paper III).
Figure 20. Mean modified permeability as
a function of fibre wall thickness for
selected grammages from different pulps
(Paper III).
The modified permeability linearly decreased with density of the samples. This
seems reasonable as a higher density means the sheets are more compact. It was
however interesting to note, that all the pulps lined up with good correlation in
the range of densities that was investigated. A thinner fibre wall usually leads to
denser sheets due to more collapsed fibres in the fibre network. Thus, it’s not
surprising that there was a relationship between modified permeability and fibre
wall thickness. Fibre width and coarseness did not show the same clear
relationship.
4.2. Mean drying time
Due to a difference in ingoing dryness of the samples, the mean drying time
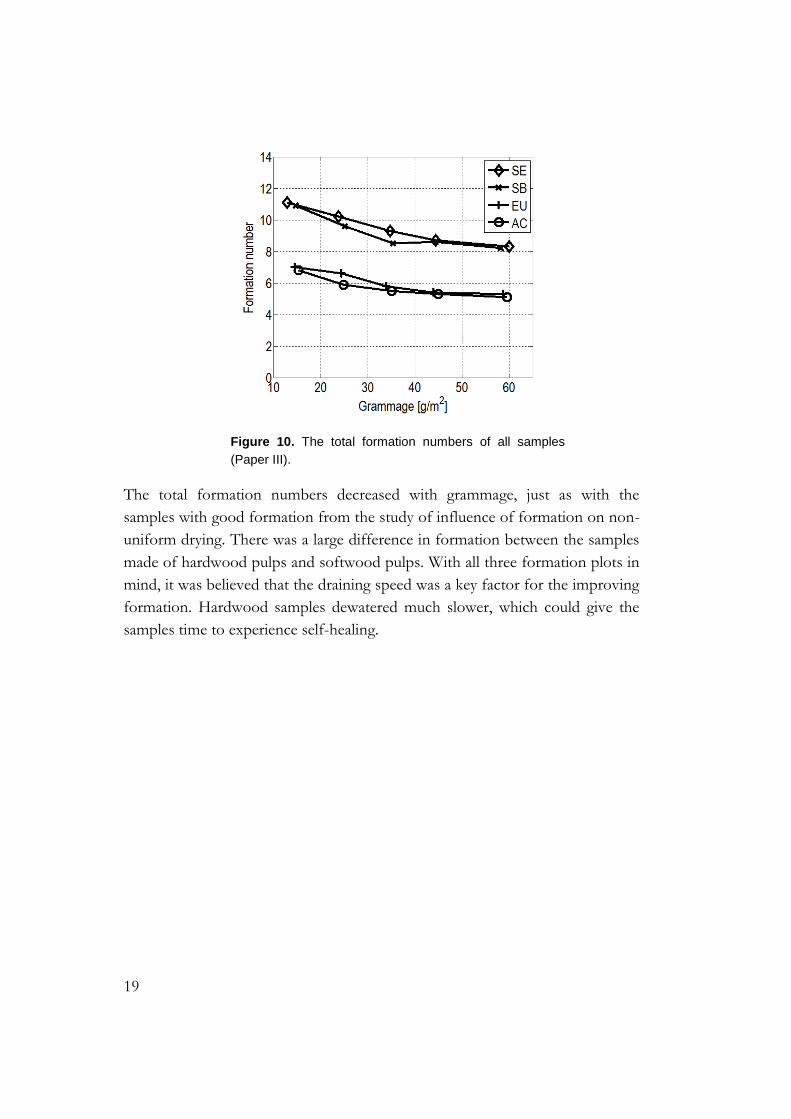
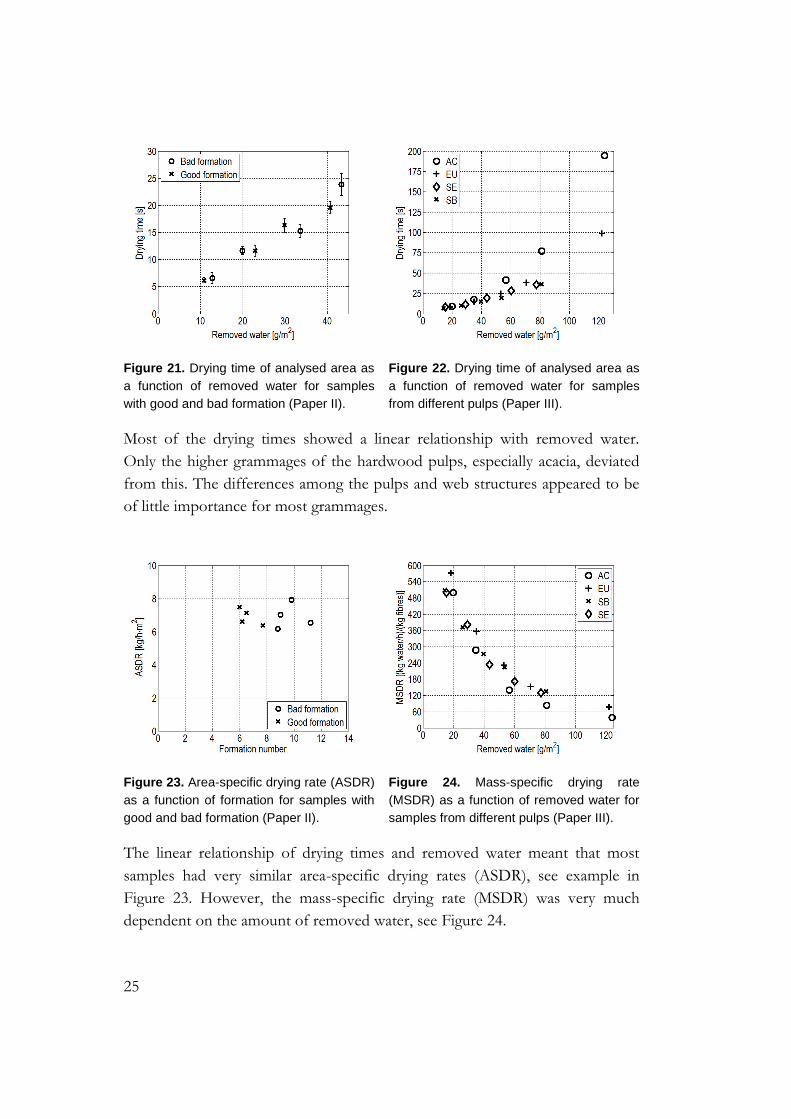
was plotted as a function of removed water, see Figure 21 and Figure 22.
25
Figure 21. Drying time of analysed area as
a function of removed water for samples
with good and bad formation (Paper II).
Figure 22. Drying time of analysed area as
a function of removed water for samples
from different pulps (Paper III).
Most of the drying times showed a linear relationship with removed water.
Only the higher grammages of the hardwood pulps, especially acacia, deviated
from this. The differences among the pulps and web structures appeared to be
of little importance for most grammages.
Figure 23. Area-specific drying rate (ASDR)
as a function of formation for samples with
good and bad formation (Paper II).
Figure 24. Mass-specific drying rate
(MSDR) as a function of removed water for
samples from different pulps (Paper III).
The linear relationship of drying times and removed water meant that most
samples had very similar area-specific drying rates (ASDR), see example in
Figure 23. However, the mass-specific drying rate (MSDR) was very much
dependent on the amount of removed water, see Figure 24.

26
It was somewhat surprising that the ASDR was so similar for almost all of the
pulps, grammages and levels of formation. It also meant that no great influence
of the formation on the mean drying rate was observed. The MSDR however,
decreased significantly with increasing removed water, i.e. grammage. Again, it
was interesting to see that despite the fairly large difference in air flow through
the samples, the results for the different pulps were very close to each other.
This illustrated that the drying rate of each fibre was decreasing when
grammage increased.
The MSDR as a function of modified permeability is shown in Figure 25.
Figure 25. Mass-specific drying rate (MSDR) as
a function of modified permeability for samples
from different pulps. The lines connect the
samples of equal grammage (Paper III).
The MSDR for the pulp types was independent of the modified permeability at
lower grammages. As grammage was increased, the MSDR became increasingly
dependent on modified permeability. The relative differences increased
considerably even though the range of modified permeabilities for a given
grammage decreased significantly. At lower grammages the pore structure or
edge effects appeared to take precedence over the bulk property of the material.

27
4.3. Non-uniformity in drying
The drying time of each individual pixel in a sample was plotted as a grammage
map, as seen in Figure 26 (good formation) and Figure 27 (bad formation).
Figure 26. Drying time map of a sample
with a grammage of 45 g/m² and good
formation.
Figure 27. Drying time map of a sample
with a grammage of 45 g/m² and bad
formation.
The colour represented drying time and the colour bars had the same limits to
illustrate the difference between the sample with good formation and the
sample with bad formation. There was not a big difference between the samples
in terms of fastest and slowest drying pixels. However the patterns were visually
different. The sample with bad formation appeared to have larger spots of
similar drying times, whereas the sample with good formation had a more
varied, small-scale pattern, as might be expected from formation.
The CoV of the drying time of pixels are seen as a function of removed water
for all grammages, pulps and levels of formation in Figure 28 and Figure 29.

28
Figure 28. Coefficient of variation of the
drying time of pixels as a function of
removed water for samples with good and
bad formation (Paper II). The error bars
represents the standard deviation among the
samples of each grammage.
Figure 29. Coefficient of variation of the
drying time of pixels for different pulps
(Paper III). The error bars represents the
standard deviation among the samples of
each grammage.
The variation in drying time among pixels appeared to be quite similar for all
samples. Considering the significant differences in formation and fibre
properties this was very surprising. Formation did not seem to have an impact
on drying non-uniformity with the conditions used in this work.
4.4. Energy efficiency evaluation
From the amount of removed water, a value could be calculated, indicating how
much energy was needed to evaporate said amount. It was speculated that this
might correlate with the added energy from the air, which could be calculated
from an integration of the air flow rate, specific heat capacity of the air and the
temperature difference as a function of time. In Figure 30 the results for
samples from the investigation of the influence of pulps are seen, and Figure 31
shows the same samples, but when only the water equivalent of WRV was
included in the calculation of the required energy.

29
Figure 30. Comparison of energy added by
air, and energy required to evaporate all the
removed water. The line represents the
case where the two energies are equal.
Figure 31. Comparison of energy added by
air, and energy required to evaporate the
removed water equal to WRV. The line
represents the case where the two energies
are equal.
Despite the simple approach, a quite good correlation was found between the
two energies, with a deviation of the order of 20%. However, the deviation
from the line representing equal energies is unrealistic, as it implies that the
supplied energy was lower than the required energy, which is physically not
possible. One possible explanation for this deviation could be related to the
accuracy of the measurements and the calculation of the energies. Another
possible reason could be that at a dryness below the WRV, the free water
located between the fibres was blown out of the samples rather than
evaporated. When only the energy to evaporate water equivalent to the WRV
was calculated, the added energy was higher for most grammages and pulps, see
Figure 31. For the acacia samples, the efficiency of added energy diminished as
grammage was increased.
The result of this comparison implies two things, (1) that the energy transfer
was efficient, and (2), that the surface temperature readings could be used to
relate the transient energy transfer rates to water content, thus allowing the
calculation of drying rate curves with the high spatial resolution of the
thermography.

30
5. Conclusions
A method was developed that enabled high spatial resolution investigations of
the non-uniformity during through air drying. The method successfully
determined local drying times of samples, and it was possible to distinguish
samples with good or bad formation from each other in drying time maps.
There were unexpectedly small differences in mean drying times and drying
time variation between the samples with good and bad formation. Almost all
samples showed a linear relationship of drying time to the amount of removed
water. Thus area-specific drying rates were similar for most samples, which was
unexpected considering the differences in formation, air flow rates and fibre
morphology for the different pulp types. However, when introducing a mass-
specific drying rate, a significant decrease of specific drying rate was observed
with increasing grammage. At low grammages, the mass-specific drying rate was
independent of difference in modified permeability between the different pulps.
However, as grammage was increased, the mass-specific drying rates became
more and more dependent on the modified permeabilities of the different pulp
types.
For all grammages, pulps and formation levels, the non-uniformity of drying
was determined to be surprisingly similar, considering the significant differences
in formation and fibre morphology. Drying time maps showed differences in
patterns between samples of different formation, but this did not seem to affect
the extent of variations in drying time.
The modified permeability of all grammages, pulps and levels of formation
appeared to reach a constant value as grammage was increased. This level can
be considered a material constant. The finding that a certain grammage was
required for the value to be constant, illustrates that sheets with a lower
grammage have deviating properties. The sheet structure of low grammage
sheets could differ significantly from that of sheets with a higher grammage, for
example by being much less 3-dimensional in terms of flow paths. The
explanation could also be found in edge effects at the surface of the samples.
A good correlation was found between the energy added by the air and the
energy required to evaporate the water removed during drying. This indicates
that the spatial, transient heat transport may be calculated from the

31
thermographic measurement. Local drying rate curves with a high spatial
resolution could be obtained.
32
6. Future studies
The high spatial resolution of the developed method and the illustrative drying
time maps could be matched against other measurements, such as grammage
maps. This could lead to greater understanding of connections between, for
instance, grammage variations, moisture variations, and local drying times.
Regarding the TAD process in particular, it would be possible to lower the
pixel size and study the influence of the TAD wire design on the local drying
times.
Considering the surprising finding that air flow rate was not influencing the
mass-specific drying rate to a significant degree at low grammages, it would be
interesting to evaluate the effect of alternative ways of adding energy, for
example infrared heating.
Drying curves with a high spatial resolution can be determined based on the
temperature difference between the air and the measured sheet temperature.
This should allow a better understanding of local drying processes, for example
around artefacts such as wire patterns or fibre flocs. Related to this, it would
also be beneficial to better understand if the measured temperature represents
the temperature of the sheet surface or that of the inner part of the sheet.
Coupled to the temperature measurement, the location of the evaporation
process in the thickness direction is not clear. If heat conduction is sufficiently
fast, evaporation inside the sheet could still be detected as a colder sheet
surface.
33
7. Acknowledgements
First and foremost, I would like to thank my supervisors for their unyielding
support. Dr. Hannes Vomhoff at Innventia, who offered more of his time than
could ever be asked of anyone, to make sure the writing of this thesis was
possible. Dr. Christophe Barbier and Prof. Lars Nilsson at Karlstad University,
who were always prepared to discuss any matter of the work performed, and
gave immaculate support in the writing process.
This study was performed as part of the multidisciplinary Industrial Graduate
School VIPP - Values Created in Fiber Based Processes and Products – at
Karlstad University, with the financial support of the Knowledge Foundation,
Sweden. Thank you to my fellow PhD candidates from VIPP.
Thank you to all the colleagues at Innventia who have helped me, Margareta
Lind, for performing the formation measurements and Bo Norman for valuable
input on their results, everyone in our workshop and in the pulp laboratory for
practical help and guidance. Also thanks to Peter Åslund, who developed the air
flow measurements and Catherine Östlund for fruitful discussions on
thermography.
I’m in gratitude to tech. lic. Caroline Hyll, with whom I’ve shared a room while
at Innventia. Thank you, for your guidance on thermography, and thank you
for countless discussions on any and all subjects, and fantastic support through
some hard times and some more joyous occasions. “Let’s get some tea”.
I would also like to thank the participating companies of the Process Efficiency
and Variability (PrEV) research cluster and the Tissue research cluster at
Innventia for valuable comments and discussion.
A warm thank you to my wife Jenny, who never complains about my long
discussions on paper drying. Also, thank to my brothers and sister with partners
and family, and to my father. Finally, to my mother, who only got to see the
beginning of this journey.

34
8. References
Banerjee, D. (2008): Development of High Resolution Optical Measurement Techniques to Investigate Moisture Content and Thermal Properties of Paper, PhD Thesis, Technische Universität Darmstadt, Darmstadt
Bristow, A., Fellers, C., Mohlin, U.-B., Norman, B., Rigdahl, M. and Ödberg, L. (1991): Råvaror för pappersframställning, Pappersteknik, Ch. 3. Kungliga Tekniska Högskolan, Stockholm, Sweden: 490
Charles, J. A. (2000): Diagnostic Tools for Yankee Dryers, TAPPI Engineering Conference, Atlanta
Chen, G. (1994): Impingement and Through Air Drying, PhD Thesis, McGill University, Montreal, Canada
Chen, G. and Douglas, W. J. M. (1997): Through Drying of Paper, Drying Technology 15(2): 295-314
Gavelin, G., Söder, I. and Jonsson, B. (1999): Mjukpapper, Skogsindustrins Utbildning i Markaryd AB, Markaryd, Sweden
Gomes, V. G., Crotogino, R. H. and Douglas, W. J. M. (1992): The Role of Local Nonuniformity in Through Drying of Paper, International Drying Symposium, Montreal, Elsevier Science Ltd.: 994-1006
Gummel, P. and Schlünder, E. U. (1980): Through air drying of textiles and paper, Drying '80, Montreal, Canada, Hemisphere Publishing, London: 357-366
Hashemi, S. J., Crotogino, R. H. and Douglas, W. J. M. (1994): Through air drying of machine-formed printing papers: Effects of furnish and formation, 9th International Drying Symposium, Gold Coast, Australia: 1263-1270
Hashemi, S. J. and Douglas, W. J. M. (2003): Moisture Nonuniformity in Drying Paper: Measurement and Relation to Process Parameters, Drying Technology 21(2): 329-347
Hashemi, S. J. and Douglas, W. J. M. (2004): Comparative Techniques For Characterizing Drying Nonuniformity in Drying of Paper, International Drying Symposium, São Paulo: 1303-1310
Hashemi, S. J., Gomes, V. G., Crotogino, R. H. and Douglas, W. J. M. (1997a): In-Plane Diffusivity of Moisture in Paper, Drying Technology 15(2): 265-294
35
Hashemi, S. J., Gomes, V. G., Crotogino, R. H. and Douglas, W. J. M. (1997b): Through Air Drying Characteristics of Machine-Formed Semi-Permeable Paper, Drying Technology 15(2): 341-369
Hashemi, S. J., Thompson, S., Bernié, J.-P. and Douglas, W. J. M. (2001): Experimental Technique for Tracking the Evolution of Local Moisture Nonuniformity in Moist Paper From Wet to Dry, 12th Fundamental Research Symposium, Oxford: 975-998
Johansson, P.-Å. and Norman, B. (1996): Methods for evaluating formation, print unevenness and gloss variations developed at STFI, 1996 Process and product quality conference, Cincinnati: 139-145
Karlsson, H. (2006): Fibre Guide - Fibre analysis and process applications in the pulp and paper industry, AB Lorentzen & Wettre, Kista, Sweden
Keränen, J. T., Paaso, J., Timofeev, O. and Kiiskinen, H. T. (2009): Moisture and temperature measurement of paper in the thickness direction, Appita Journal 62(4): 308-313
Kiiskinen, H. T., Kukkonen, H. K., Pakarinen, P. I. and Laine, A. J. (1997): Infrared thermography examination of paper structure, Tappi Journal 80(4): 159-162
Klerelid, I. and Milosavljevic, N. (2010): Drying of tissue, Papermaking Part 2, Drying, Ch. 5. Papermaking Science and Technology. 9: Karlsson, M. Paper Engineers' Association/Paperi ja Puu Oy, Helsinki: 164-209
Maloney, T. C., Laine, J. E. and Paulapuro, H. (1999): Comments on the measurement of cell wall water, Tappi Journal 82(9): 125-127
Maloney, T. C. and Paulapuro, H. (1999): The Formation of Pores in the Cell Wall, Journal of Pulp and Paper Science 25(12): 430-436
Melkert, S. (2014): msquared company web page, Retrieved 10th of April, 2014, from http://www.msquared.eu/index.php
Modak, A., Takagaki, S. S. and Ramaswamy, S. (2009): Integral Flow Parameters and Material Characteristics Analysis in Through Air Drying: Part I, Drying Technology 27(5): 672-684
Norman, B. (2008): Web forming, Papermaking Part 1, Stock Preparation and Wet End, Ch. 6. Papermaking Science and Technology. 8: Paulapuro, H. Paper Engineers' Association/Paperi ja Puu Oy, Helsinki: 216-288

36
Norman, B. (2009): Beta-radiation based grammage formation measurement - Radiogram methods applicable to paper and light weight board, NSP Report 5, Nordic Standardization Programme, Stockholm
Polat, O. (1989): Through Drying of Paper, PhD Thesis, McGill University, Montreal, Canada
Polat, O., Crotogino, R. H. and Douglas, W. J. M. (1991): Drying Rate Periods in Through Drying Paper, Helsinki Symposium on Alternate Methods of Pulp and Paper Drying, Helsinki
Rosén, F. and Vomhoff, H. (2010): The use of infrared thermography to detect in-plane moisture variations in paper, Control Systems 2010, Stockholm
Ryan, M., Modak, A., Zuo, H., Ramaswamy, S. and Worry, G. (2003): Through Air Drying, Drying Technology 21(4): 719-734
Stenström, S. (2004): Product Engineering by the Paper Dryer, 14th International Drying Symposium, São Paulo, Brazil: 89-98
Uutela, E. (2014): New Tissue Supply in the Americas and Impact on Supply/Demand Balance, Tissue World, Miami
Weineisen, H. (2007): Through-Drying of Tissue Paper - Experiments and Modelling, PhD Thesis, Lund University, Lund
Vickery, D. E. and Atkins, J. W. (1978): Infrared thermography - An aid to solving paper machine moisture profile problems, Tappi 61(12): 17-20
Zuo, H., Modak, A., Ryan, M. and Ramaswamy, S. (2004): Experimental analysis of the effect of local non-uniformity on convective heat and mass transfer in porous media, 14th International Drying Symposium, São Paulo, Brazil: 1311-1318
Through air dryingThe influence of formation and pulp type on non-uniform drying and air flow
Aron Tysén
LICENTIATE THESIS | Karlstad University Studies | 2014:49
Chemical Engineering
Faculty of Health, Science and Technology
Aron Tysén | T
hrough air drying | 2014:49
Through air drying
The removal of water is an integral part of tissue paper production. Through air drying (TAD) is used for water removal when producing premium tissue grade products, however, at the price of higher energy demand. A better understanding of TAD may therefore lower the energy demand.
The objective was to investigate the influence of formation, pulp type and grammage on non-uniform drying and air flow through sheets. A laboratory method, based on infrared thermography, was used to determine drying time and area-specific and mass-specific drying rates. Air flow rate and pressure drop were used to determine flow resistance and modified permeability.
Pulp type had a large influence on the air flow through the sheet. Modified permeability, i.e. the material property describing the air flow through the fibre network, was strongly dependent on grammage for lower grammages, while it approached a constant value for higher grammages. In contrast to that, mass-specific drying rates were similar for the different pulp types at lower grammages, but proved to be grammage-dependent for higher grammages. Formation did not influence the drying speed to any large extent.
The results illustrate that industrial TAD processes operate under very special process conditions due to the low grammage sheets.
LICENTIATE THESIS | Karlstad University Studies | 2014:49
ISSN 1403-8099
ISBN 978-91-7063-585-4
urn:nbn:se:kau:diva-33515