Three-dimensional gyrokinetic simulation of the...
15
Three-dimensional gyrokinetic simulation of the relaxation of a magnetized temperature filament R. D. Sydora, 1,a) G. J. Morales, 2 J. E. Maggs, 2 and B. Van Compernolle 2 1 Department of Physics, University of Alberta, Edmonton T6G 2E1, Canada 2 Department of Physics and Astronomy, University of California, Los Angeles, California 90095-1547, USA (Received 20 July 2015; accepted 22 September 2015; published online 7 October 2015) An electromagnetic, 3D gyrokinetic particle code is used to study the relaxation of a magnetized electron temperature filament embedded in a large, uniform plasma of lower temperature. The study provides insight into the role played by unstable drift-Alfv en waves observed in a basic elec- tron heat transport experiment [D. C. Pace et al., Phys. Plasmas 15, 122304 (2008)] in which anomalous cross-field transport has been documented. The simulation exhibits the early growth of temperature-gradient-driven, drift-Alfv en fluctuations that closely match the eigenmodes pre- dicted by linear theory. At the onset of saturation, the unstable fluctuations display a spiral spatial pattern, similar to that observed in the laboratory, which causes the rearrangement of the tempera- ture profile. After saturation of the linear instability, the system exhibits a markedly different behavior depending on the inclusion in the computation of modes without variation along the magnetic field, i.e., k z ¼ 0. In their absence, the initial filament evolves into a broadened tempera- ture profile, self-consistent with undamped, finite amplitude drift-Alfv en waves. But the inclusion of k z ¼ 0 modes causes the destruction of the filament and damping of the drift-Alfv en modes lead- ing to a final state consisting of undamped convective cells and multiple, smaller-scale filaments. V C 2015 AIP Publishing LLC.[http://dx.doi.org/10.1063/1.4932346] I. INTRODUCTION Electron heat transport across a magnetic field remains one of the active research topics within the plasma commu- nity, primarily because of its relevance to achieving con- trolled fusion. 1 Steep cross-field pressure gradients in magnetized plasmas can lead to the spontaneous growth in temperature, density, and magnetic fluctuations once a cer- tain threshold gradient is exceeded. These fluctuations give rise to complex heat transport processes that result in energy losses exceeding predictions based on classical transport due to Coulomb collisions. Because of the worldwide interest in magnetic confine- ment fusion, the majority of the experimental and modeling studies of electron heat transport have addressed toroidal confinement devices (Refs. 2 and 3 and references therein). But due to the complex magnetic topology, multiple heating channels, and boundary conditions associated with the opera- tion of such devices, the description of the transport dynam- ics in such an environment poses a formidable challenge. To simplify the study of electron heat transport, a series of basic experiments have been performed over the past dec- ade in the Large Plasma Device (LAPD) 4 operated by the Basic Plasma Science Facility (BaPSF) at the University of California, Los Angeles (UCLA). Since the details of the ex- perimental arrangement and the major findings have been previously published, 5–11 only a brief description is given to set the background for the present computer simulation study. The generic experiment uses a small (3 mm diameter), single-crystal LaB 6 cathode to inject a low-voltage electron beam into a strongly magnetized (1 kG), cold, afterglow- plasma. The low-voltage beam acts as an ideal heat source that produces a long (8 m), narrow (5 mm in radius) tem- perature filament that is well separated from the walls of the machine. The existence of a transition from a regime of clas- sical transport to one of anomalous transport has been estab- lished through detailed measurements. During the period of classical transport, drift-Alfv en waves grow linearly, driven by the temperature gradient. 12 In an effort to elucidate the morphology of the structures that develop nonlinearly in the temperature filament, Shi et al. 13 studied a simplified convection-diffusion model. It was based on postulating the existence of two, large ampli- tude drift-waves whose spatial pattern was suggested by the linear mode analysis. 12 The highlight of the study was the formation of extended spatio-temporal structures that locally resulted in Lorentzian-shaped temporal pulses of positive and negative polarities in different regions of the temperature profile. The present study utilizes an electromagnetic, 3D gyrokinetic particle simulation code 14 to simulate the self- consistent, spatio-temporal relaxation of an initially pre- scribed temperature filament whose parameters closely match those in the LAPD heat-transport experiments. The principal goals of the present study are: (1) to utilize the diagnostic capabilities of the computer code to shed infor- mation on details of the dynamics that laboratory techni- ques are not able to probe; (2) to test the effectiveness of the gyrokinetic methodologies in simulating a transport experiment having minimal complexities; and (3) to better elucidate the nonlinear physics retained in the gyrokinetic formalism. a) Electronic mail: [email protected] 1070-664X/2015/22(10)/102303/15/$30.00 V C 2015 AIP Publishing LLC 22, 102303-1 PHYSICS OF PLASMAS 22, 102303 (2015) This article is copyrighted as indicated in the article. Reuse of AIP content is subject to the terms at: http://scitation.aip.org/termsconditions. Downloaded to IP: 128.97.43.42 On: Fri, 16 Oct 2015 17:20:25
Transcript of Three-dimensional gyrokinetic simulation of the...

Three-dimensional gyrokinetic simulation of the relaxation of a magnetizedtemperature filament
R. D. Sydora,1,a) G. J. Morales,2 J. E. Maggs,2 and B. Van Compernolle2
1Department of Physics, University of Alberta, Edmonton T6G 2E1, Canada2Department of Physics and Astronomy, University of California, Los Angeles, California 90095-1547, USA
(Received 20 July 2015; accepted 22 September 2015; published online 7 October 2015)
An electromagnetic, 3D gyrokinetic particle code is used to study the relaxation of a magnetized
electron temperature filament embedded in a large, uniform plasma of lower temperature. The
study provides insight into the role played by unstable drift-Alfv�en waves observed in a basic elec-
tron heat transport experiment [D. C. Pace et al., Phys. Plasmas 15, 122304 (2008)] in which
anomalous cross-field transport has been documented. The simulation exhibits the early growth of
temperature-gradient-driven, drift-Alfv�en fluctuations that closely match the eigenmodes pre-
dicted by linear theory. At the onset of saturation, the unstable fluctuations display a spiral spatial
pattern, similar to that observed in the laboratory, which causes the rearrangement of the tempera-
ture profile. After saturation of the linear instability, the system exhibits a markedly different
behavior depending on the inclusion in the computation of modes without variation along the
magnetic field, i.e., kz¼ 0. In their absence, the initial filament evolves into a broadened tempera-
ture profile, self-consistent with undamped, finite amplitude drift-Alfv�en waves. But the inclusion
of kz¼ 0 modes causes the destruction of the filament and damping of the drift-Alfv�en modes lead-
ing to a final state consisting of undamped convective cells and multiple, smaller-scale filaments.VC 2015 AIP Publishing LLC. [http://dx.doi.org/10.1063/1.4932346]
I. INTRODUCTION
Electron heat transport across a magnetic field remains
one of the active research topics within the plasma commu-
nity, primarily because of its relevance to achieving con-
trolled fusion.1 Steep cross-field pressure gradients in
magnetized plasmas can lead to the spontaneous growth in
temperature, density, and magnetic fluctuations once a cer-
tain threshold gradient is exceeded. These fluctuations give
rise to complex heat transport processes that result in energy
losses exceeding predictions based on classical transport due
to Coulomb collisions.
Because of the worldwide interest in magnetic confine-
ment fusion, the majority of the experimental and modeling
studies of electron heat transport have addressed toroidal
confinement devices (Refs. 2 and 3 and references therein).
But due to the complex magnetic topology, multiple heating
channels, and boundary conditions associated with the opera-
tion of such devices, the description of the transport dynam-
ics in such an environment poses a formidable challenge.
To simplify the study of electron heat transport, a series
of basic experiments have been performed over the past dec-
ade in the Large Plasma Device (LAPD)4 operated by the
Basic Plasma Science Facility (BaPSF) at the University of
California, Los Angeles (UCLA). Since the details of the ex-
perimental arrangement and the major findings have been
previously published,5–11 only a brief description is given to
set the background for the present computer simulation
study. The generic experiment uses a small (3 mm diameter),
single-crystal LaB6 cathode to inject a low-voltage electron
beam into a strongly magnetized (1 kG), cold, afterglow-
plasma. The low-voltage beam acts as an ideal heat source
that produces a long (�8 m), narrow (�5 mm in radius) tem-
perature filament that is well separated from the walls of the
machine. The existence of a transition from a regime of clas-
sical transport to one of anomalous transport has been estab-
lished through detailed measurements. During the period of
classical transport, drift-Alfv�en waves grow linearly, driven
by the temperature gradient.12
In an effort to elucidate the morphology of the structures
that develop nonlinearly in the temperature filament, Shi
et al.13 studied a simplified convection-diffusion model. It
was based on postulating the existence of two, large ampli-
tude drift-waves whose spatial pattern was suggested by the
linear mode analysis.12 The highlight of the study was the
formation of extended spatio-temporal structures that locally
resulted in Lorentzian-shaped temporal pulses of positive
and negative polarities in different regions of the temperature
profile.
The present study utilizes an electromagnetic, 3D
gyrokinetic particle simulation code14 to simulate the self-
consistent, spatio-temporal relaxation of an initially pre-
scribed temperature filament whose parameters closely
match those in the LAPD heat-transport experiments. The
principal goals of the present study are: (1) to utilize the
diagnostic capabilities of the computer code to shed infor-
mation on details of the dynamics that laboratory techni-
ques are not able to probe; (2) to test the effectiveness of
the gyrokinetic methodologies in simulating a transport
experiment having minimal complexities; and (3) to better
elucidate the nonlinear physics retained in the gyrokinetic
formalism.a)Electronic mail: [email protected]
1070-664X/2015/22(10)/102303/15/$30.00 VC 2015 AIP Publishing LLC22, 102303-1
PHYSICS OF PLASMAS 22, 102303 (2015)
This article is copyrighted as indicated in the article. Reuse of AIP content is subject to the terms at: http://scitation.aip.org/termsconditions. Downloaded to IP:
128.97.43.42 On: Fri, 16 Oct 2015 17:20:25

The simulation is found to reproduce the predicted linear
growth rate and frequency of the linearly unstable drift-
Alfv�en waves driven by the temperature gradient. The radial
eigenfunctions display a spiral structure consistent with those
observed in the experiment. The growing eigenmodes cause
a rearrangement of the radial temperature gradient that modi-
fies the radial structure of the modes and results in their satu-
ration. But the behavior of the system beyond this saturation
stage is found to depend crucially on whether or not modes
without variation along the confinement field (i.e., kz¼ 0) are
retained in the computation. In the absence of kz¼ 0 modes,
the initial temperature profile broadens, but is not destroyed.
The constraints imposed by the conservation laws inherent in
the gyrokinetic methodology result in a final state in which
finite amplitude Alfv�en waves coexist with the chaotic
motion of the plasma particles. The parallel electron distribu-
tion function displays a flattening in the neighborhood of the
phase velocity of the unstable modes. When kz¼ 0 modes
are retained in the computation, the initial temperature pro-
file is destroyed, the amplitude of the Alfv�en waves is
reduced to a low level, and a final state consisting of
undamped convective cells,15–18 and multiple temperature
filaments is attained.
The outline of the paper is as follows. Section II
describes the gyrokinetic simulation model and the initial
setup of the temperature filament used in the study. Section
III provides an assessment of the growth rate and frequency
of the drift-Alfv�en waves driven unstable by the tempera-
ture gradient. Section IV presents the simulation results
obtained when kz¼ 0 modes are included. Section V illus-
trates the relaxation in the absence of kz¼ 0 modes. Section
VI discusses the various findings and Sec. VII provides
conclusions.
II. SIMULATION MODEL AND SETUP
The simulation model used in this study is based on the
gyrokinetic Vlasov-Poisson-Ampere system for a low-beta
plasma.19 The equations governing particle motion arise
from the characteristics of the gyrokinetic-Vlasov equation.
The self-consistent evolution requires the solution of a
gyrokinetic-Poisson equation to obtain the perpendicular and
parallel electric fields; the magnetic field perturbations aris-
ing from the parallel particle currents are computed via
Ampere’s law. The canonical momentum formulation is
implemented with an electrostatic potential /, and a parallel
vector potential Az in the Coulomb gauge, but the transverse
component of the vector potential, A?, is not included. This
implies that shear Alfv�en waves are retained, but the com-
pressional Alfv�en waves are not, as is appropriate for a low
beta plasma and the experimental conditions of interest to
this study. The detailed equations of motion and field equa-
tions for the full-F kinetic model are described in Ref. 20.
The total energy invariant of the closed system under
consideration,
U ¼X
j
mjv2jjj
2þ ljB
!þð
dV
8pj~Ej2 þ j~Bj2� �
; (1)
consists of the volume integral over the computational box of
the energy densities of the self-consistent electric and mag-
netic fields ð~E; ~BÞ, and the sum of the energy of each jth gyro-
kinetic particle, having conserved magnetic moment lj and
mass mj, for both species (electrons and ions). Equation (1) is
evaluated as the system evolves and serves as a measure of
code fidelity. The total energy is found to vary by less than
0.01% for the results reported here. Also, the field energy and
particle energy are monitored separately, which allows for the
evaluation of energy exchange between each particle species
and the field fluctuations. The self-consistent motion of both
ion and electron species is followed; ions are treated as gyro-
kinetic particles while electrons are treated as drift-kinetic
(i.e., electron gyroradius effects are not included). The simula-
tion box consists of periodic boundaries along the z-direction,
which is taken as the direction of the confinement magnetic
field, B0. The code can be run with the axially uniform modes
(i.e., kz¼ 0) included or suppressed. Perfectly conducting
walls are set at a finite distance along the x and y directions,
transverse to the confinement field. The plasma particles are
specularly reflected when they reach these walls and are peri-
odically re-introduced in the z-direction when they complete
an axial transit. The core of the numerical code has previously
been used to investigate collisionless tearing instabilities and
internal kink modes.14,20
In diagnosing the results of the simulation, various
physical quantities of experimental relevance are generated
from the position, ~rjðtÞ, and velocity, ~vjðtÞ, of each jth-
gyroparticle at time t. An interpolation function Isð~r �~rjðtÞÞ/ ðDVÞ�1
is used to assign a count of the particles of species
“s” found within a computational cell of 3D volume DV¼ DxDyDz and whose center is located at the computational
grid point associated with physical position~r . For the results
reported here Dx ¼ Dy ¼ 0:0625c=xpe, Dz ¼ 69:5c=xpe
with 256� 256� 16 cells and 16 particles per cell.
The density of particle species s is obtained from the
expression
nsð~r; tÞ ¼X
jIsð~r �~rjðtÞÞ; (2)
while the effective scaled “temperature” is found from
Ts ~r; tð ÞTs0
¼
Pj vjjj tð Þ � hvjj ~r ; tð Þi� �2 þ
ljB
ms
� �Is ~r �~rj tð Þ� �
3�v 2s0
PjIs r
*�~rj tð Þ� ;
(3)
where Ts0 is the initial peak temperature of species s with
corresponding thermal velocity �vs0. The average parallel ve-
locity that is subtracted in obtaining the effective tempera-
ture is
hvjjs ~r ; tð Þi ¼P
jvjjj tð ÞIs ~r �~rj tð Þ� �
PjIs ~r �~rj tð Þ� � : (4)
The actual numerical calculations are performed on a
Cartesian grid ðx; y; zÞ, but, because the structure of interest,
i.e., the electron temperature filament, is a cylinder, the
102303-2 Sydora et al. Phys. Plasmas 22, 102303 (2015)
This article is copyrighted as indicated in the article. Reuse of AIP content is subject to the terms at: http://scitation.aip.org/termsconditions. Downloaded to IP:
128.97.43.42 On: Fri, 16 Oct 2015 17:20:25

computational results are interpolated onto a cylindrical
mesh ðr; h; zÞ in order to elucidate the physical processes,
e.g., the wave structures are described as having an azi-
muthal mode number “m” and an eigenfunction that varies
with radial distance from the center of the initial filament. In
figures presented in Sec. IV, various displays are made of the
magnitude of the electrostatic potential of mode-m, jUmj, for
specified values of ðr; zÞ at time t. This quantity is related to
the calculated electrostatic potential / according to
/ðr; z; tÞ ¼X
m
Xn/mnðr; tÞ exp ½iðmhþ 2pnz=LÞ�; (5)
and jUmðr; tÞj ¼X
n½/mn�2
h i1=2
; (6)
where L is the axial length of the computational box.
The simulation is initialized with a spatially uniform
density of ions and electrons (nsð~r; t ¼ 0Þ ¼ n0) but the elec-
tron temperature is non-uniform; it consists of a narrow fila-
ment of elevated temperature embedded in a cold
background plasma, as illustrated in Fig. 1. The initial radial
variation of the electron temperature is chosen to closely
match the quiescent (classical transport phase) experimental
profiles and is given by
TeðrÞ ¼ Tb þ ðTo � TbÞe�r2=ro2
; (7)
with the temperature of the cold background electrons,
Tb¼ 0.25 eV, the peak temperature of the filament,
To¼ 5 eV, and the filament width, ro¼ 0.3 cm, in physical
units (cgs). The initial radial variation in electron tempera-
ture is implemented in the code at the distribution function
level by applying Gaussian random loading with a thermal
velocity width consistent with the electron temperature pro-
file given by Eq. (7). Gaussian random loading is also
applied to the parallel and perpendicular velocities. The ion
temperature is taken to be spatially uniform with value,
Ti¼ 0.1 eV. It is found that over the length of time consid-
ered in this study, the changes in ion temperature are compa-
rable to the level of numerical fluctuations, i.e., ion heating
is not a significant effect in the relaxation process.
In the experiments, the axial length of the temperature
filament is about 8 m and the transverse dimension is about
5 mm, whereas the surrounding plasma is 18 m long and
75 cm in diameter. The scaled simulation parameters are
chosen to match the scaled parameters corresponding to the
experiment and these are obtained from the typical experi-
mental values of electron density (no¼ 1.4 � 1012 cm�3),
magnetic field (B0¼ 1 kG), and temperatures (Te¼ 5 eV,
Ti¼ 0.1 eV). A fundamental scale-length obtained from
these parameters, and used for normalization in the simula-
tion, is the electron skin depth, c/xpe¼ 0.45 cm. The simula-
tion domain in the x-y plane across the magnetic field is
chosen to be large enough to minimize the influence of the
boundaries on the results. From several test runs, it has been
found that the smallest transverse system size that can be
used without significant boundary influence on the drift-
Alfv�en eigenmodes is 8c/xpe � 8c/xpe. The results shown in
this manuscript are obtained with a transverse system size
16c/xpe � 16c/xpe. From the physical parameters the ion
sound gyroradius is qs¼ cs/Xi¼ 1.02c/xpe, where cs is the
ion sound speed using the central electron temperature of the
filament and in terms of the ion gyroradius the transverse
system size is 113.3qi � 113.3qi. The axial periodicity of the
simulation box corresponds to L¼ 5 m in the experiment.
For these parameters, the ratio of the total kinetic energy of
the initial hot filament to the total kinetic energy of the cold
plasma contained within the simulation box is 4 � 10�2.
It should be noted that in this simulation the heating
source (an electron beam), the electron-ion collisions, and
the boundary losses (radial and axial), which are all present
FIG. 1. Schematic of the 3D simula-
tion geometry and temperature fila-
ment embedded in a cold background
plasma. Axial boundary conditions are
periodic. Transverse walls are per-
fectly conducting and ideal particle
reflectors. The x-coordinate in the inset
is scaled to the electron skin-depth;
only 1=4 of the computational box is
shown. Inset arrows (red) refer to vir-
tual probe locations. The temperature
is scaled to the peak temperature of the
filament.
102303-3 Sydora et al. Phys. Plasmas 22, 102303 (2015)
This article is copyrighted as indicated in the article. Reuse of AIP content is subject to the terms at: http://scitation.aip.org/termsconditions. Downloaded to IP:
128.97.43.42 On: Fri, 16 Oct 2015 17:20:25
in the experiment, are not included. Therefore, the present
study addresses only the collisionless relaxation aspects of
the experiment; in the simulation, the initial temperature gra-
dient is relaxed solely by the action of the self-consistent
electric and magnetic field fluctuations. The simulation
includes resonant particle transport, a process that is absent
in the previous diffusion-convection study13 in which only
the fluid ExB drifts are modeled. In the gyrokinetic simula-
tion, each particle has a conserved magnetic moment. This
implies that the total perpendicular energy in the system,
regardless of the complex dynamical processes, is strictly
conserved because in this study the magnetic field is uniform
(the contribution from the perpendicular kinetic energy term,
ljB, in Eq. (1) remains constant in time). This constraint has
consequences for the energetics of the relaxation sampled,
since it is only the parallel wave-particle interactions that
account for the exchange of energy with the fluctuations. For
the conditions investigated, only 1.3% of the total system
energy is available (i.e., the parallel energy of the filament)
to excite fluctuations and heat cold particles. Of course,
cross-field transport occurs simultaneously by E � B convec-
tion, as in the fluid model, but without exchange of energy.
III. TEMPERATURE GRADIENT MODES
It is useful to first consider a simple, local description of
the drift-Alfv�en instability associated with a pure electron
temperature gradient in order to identify the parameter
dependencies. The relevant dispersion relation is given by
Eq. (30) of Ref. 12,
k2hq
2s þ
x2
k2z V2
A
� 1
!x�xþ 1
2Z0 feð Þ
� �¼ 0; (8)
where the local electron diamagnetic drift frequency is x� ¼ kh
V2e=LTXe; with Xe the electron gyrofrequency, fe ¼ x=ðffiffiffi2p
kzVeÞ, LT ¼ jrT=Tj�1is the temperature scale length,
kh ¼ m=r is the local azimuthal wave number, and qs ¼ cs=Xi
is the ion sound gyroradius, defined as the ratio of the ion sound
speed cs to the ion cyclotron frequency Xi. The local electron
thermal velocity is Ve and the Alfv�en speed is VA, while Z0 cor-
responds to the derivative, with respect to argument, of the
standard plasma dispersion function. In Eq. (8), the terms inside
the left bracket describe the zero electron mass (MHD) shear
Alfv�en wave branch, while the terms inside the right bracket
describe the collisionless, drift-wave branch. For small trans-
verse scales (i.e., large kh), as is appropriate for this study, the
two branches are coupled and result in a collective mode known
as the drift-Alfv�en wave, which can become unstable for certain
values of the azimuthal mode number, m, and axial wave num-
ber kz. Because of this coupling, the modes carry electrostatic as
well as magnetic energy as is illustrated in Sec. IV.
The accurate calculation of the linear growth rates and
frequencies requires the solution of coupled differential
equations for the electric and magnetic potentials to deter-
mine the complex eigenfrequencies and the associated eigen-
functions that satisfy the proper boundary conditions. Such
an analysis has been performed for the temperature filament
considered here and the details have been reported in Ref.
12. Figure 2 shows a comparison of those results to modes
that are found to grow exponentially during the early, linear
stage of the simulation. The dependence on azimuthal mode
number of the frequencies and growth rates, scaled to the ion
gyrofrequency, is displayed. Good agreement is obtained
between the gyrokinetic simulation and the predictions of
linear theory. Some noteworthy features are: the range of
excited azimuthal mode numbers is m� 1–6, the frequency
of oscillations is Rex � 0:08Xi, and the higher mode-
numbers show relatively fast growth. The parallel wave-
length of the most unstable mode is 10 m (twice the axial
length of the box) which corresponds to a scaled parallel
phase velocity Rex=kz�ve0 ¼ 0:4, where �ve0 corresponds to
the electron thermal velocity at the peak temperature of the
initial filament. For the parameters of this study, the value of
the Alfv�en speed, VA, is approximately equal to �ve0.
Although not shown here, the shape of the radial eigenfunc-
tions found in the simulation also agree with those predicted
theoretically.12 It should be mentioned here that in order to
obtain the close agreement shown in Fig. 2, low initial noise
levels using quiet-start particle loading procedures (bit-
reversed quasi-random number sequences in velocity space)
and perturbing single azimuthal and axial mode numbers are
employed.
IV. SIMULATION RESULTS
A. Evolution of fluctuations
An overview of the temporal evolution of the fluctua-
tions spontaneously excited by the electron temperature fila-
ment can be obtained from the results displayed in Fig. 3. It
should be emphasized that the results presented in this sec-
tion are obtained with the kz¼ 0 modes included in the com-
putation. A comparison to results with the kz¼ 0 modes
suppressed is given in Sec. V. The top panel, Fig. 3(a), illus-
trates the fractional changes in the various components of
the energy stored in the simulation box, scaled to the initial
FIG. 2. Real and imaginary parts (scaled to ion gyrofrequency) of drift-
Alfv�en modes that grow exponentially during the early stage of the simula-
tion are compared to eigenmode results of Ref. 12 for various azimuthal
mode numbers, and an axial wavelength of 10 m.
102303-4 Sydora et al. Phys. Plasmas 22, 102303 (2015)
This article is copyrighted as indicated in the article. Reuse of AIP content is subject to the terms at: http://scitation.aip.org/termsconditions. Downloaded to IP:
128.97.43.42 On: Fri, 16 Oct 2015 17:20:25

total energy invariant given in Eq. (1), and denoted by
U0 ¼ Uðt ¼ 0Þ. The middle (red) curve corresponds to the
fractional change of the total energy and provides a measure
of the numerical accuracy of the simulation. It shows that,
throughout the time interval displayed (t¼ 1200 X�1i ), it
varies less than 0.01% which is about a factor of 400 smaller
than the total energy in the initial hot filament. The top
(blue) curve shows the evolution of the total field energy
(sum of electric and magnetic field energies) while the bot-
tom curve (green) corresponds to the total particle kinetic
energy (electrons and ions); these curves essentially mirror
each other, as expected from the high accuracy to which the
total energy is conserved. It is noteworthy that for Xit > 600
an asymptotic state is attained in which energy extracted
from the initial hot filament is transformed into undamped
field structures. Figure 3(b) displays, in log-linear format,
the temporal evolution of the total electrostatic energy (top
blue curve), and of the total magnetic energy (bottom green
curve) associated with the fluctuations. These quantities are
scaled to the total initial energy U0 and contain the contribu-
tions from kz¼ 0 modes. The electrostatic energy exhibits an
early, exponentially growing stage corresponding to the lin-
ear instability described in Sec. III. The growth saturates
around Xit � 300 and after saturation this component of the
energy remains nearly constant. As is shown later, the form
in which this energy is stored changes character for
Xit > 400; it transforms from wave energy in the form of
drift-Alfv�en modes into undamped convective cells. The
transformation can be identified from the behavior of the
magnetic energy (bottom green curve in Fig. 3(b)). It is seen
that through the linear growth and saturation stages
(Xit < 400) the behavior of the magnetic energy essentially
follows that of the electrostatic energy, as expected for a
drift-Alfv�en mode. But for Xit > 400 this component of the
energy undergoes a steady damping and eventually achieves
an asymptotic, relatively small level. This decay in the mag-
netic energy signals that the energy stored in the drift-Alfv�en
modes by the linear instability is re-shuffled. From panel
3(a) it is seen that some of this energy is returned to the par-
ticles (bottom green curve), but most of it is transformed into
electrostatic energy, as indicated by the nearly constant level
of the total field energy (top blue curve in 3(a)) for
Xit > 600.
Figure 4 displays the time evolution, in log-linear for-
mat, of the electrostatic potential mode-amplitude given by
Eq. (6), scaled to the peak of the electron temperature,
ejUmðr; tÞj=T0, and radially averaged over the interval
r ¼ 0� 4c=xpe. Shown is the behavior of azimuthal mode
numbers m ¼ 1� 5. In the top panel, Fig. 4(a), the contribu-
tion from modes with axial mode number n¼ 0 is not
included, i.e., the summation in Eq. (6) does not contain
kz¼ 0 modes (but these modes are in the simulation and are
an integral part of the dynamics shown in (a)). The bottom
panel, Fig. 4(b), shows explicitly the behavior of the kz¼ 0
modes, i.e., modes with n 6¼ 0 are not included in theFIG. 3. Temporal evolution of: (a) the fractional change in total energy, ki-
netic energy, and field energy and (b) total electrostatic field energy and the
total magnetic field energy, scaled to U0 the total energy of the system.
FIG. 4. Temporal evolution of the scaled electrostatic mode potential of Eq.
(6): (a) Averaged over finite kz and radius, r¼ 0-4c/xpe, for azimuthal
modes (m¼ 1–5) and (b) the kz¼ 0 modes averaged over the same radius
for azimuthal modes (m¼ 1–5).
102303-5 Sydora et al. Phys. Plasmas 22, 102303 (2015)
This article is copyrighted as indicated in the article. Reuse of AIP content is subject to the terms at: http://scitation.aip.org/termsconditions. Downloaded to IP:
128.97.43.42 On: Fri, 16 Oct 2015 17:20:25

n-summation in Eq. (6). Figure 4(a) shows that for Xit < 200
the kz 6¼ 0 modes grow exponentially in time, as expected
from linear theory. It has been checked, but not shown here,
that modes in both axially traveling directions (i.e., n> 0 and
n< 0) are unstable. The kz 6¼ 0 modes reach saturation at
Xit � 200 and all experience damping for Xit > 330, with
mode m¼ 1 becoming the dominant mode in the asymptotic
state. Figure 4(b) shows that, from the earliest times, all the
kz¼ 0 modes exhibit exponential growth while the kz 6¼ 0
modes still have relatively small amplitude. Also, their growth
rates are comparable to those of the linearly unstable kz 6¼ 0
modes. As shown in Sec. V, in the absence of the kz 6¼ 0
modes, the kz¼ 0 modes experience very small direct amplifi-
cation from the zero-order electron temperature gradient. The
implication of these observations is that the origin of the
kz¼ 0 modes is not a parametric or a modulational instabil-
ity,17,18,21 but rather their direct excitation is caused by the
bilinear beating of the linearly unstable kz 6¼ 0 modes. This
behavior is analogous to the process identified by Cheng and
Okuda16 in an electrostatic simulation of drift waves driven
unstable by a density gradient.
Figure 5 displays, in log-linear format, the time evolu-
tion of the total energy (scaled to U0) associated with kz¼ 0
structures. The curve (blue) achieving the largest value is the
electrostatic field energy and the smaller curve (green) is the
magnetic field energy. It is seen that for Xit < 300 the kz¼ 0
electrostatic energy increases steadily; it is during this inter-
val that drift-Alfv�en modes are linearly unstable. For Xit >300 the energy that has been transferred from the drift-
Alfv�en modes to the kz¼ 0 structures remains unchanged.
From the behavior of the magnetic energy, it is seen that rel-
atively little energy is transferred to field-aligned current fila-
ments, although some excitation of such structures does take
place. This comparison indicates that the kz¼ 0 structures
are essentially electrostatic convective cells that exhibit no
damping after being excited. They contain about 1% of the
parallel kinetic energy of the initial filament.
B. Spatial patterns
Figure 6 shows 2D color contours, across the confine-
ment magnetic field, of the instantaneous electrostatic poten-
tial /ðx; y; z; tÞ, in the left panels, and of the magnitude of
the fluctuating magnetic field jB?ðx; y; tÞj, in the right panels.
It presents a snapshot of these quantities within a transverse
plane located at the axial midpoint of the computational box.
The top two panels, Figs. 6(a) and 6(b), are at time Xit ¼180 during the linear growth stage, while the bottom two
panels, Figs. 6(c) and 6(d), are at the saturation phase,
Xit ¼ 380. Figure 6(c) exhibits an extended m¼ 1 spiral
structure (rotating in the electron diamagnetic direction)
FIG. 5. Temporal evolution of the electrostatic and magnetic energy of the
kz¼ 0 structures, scaled to the total energy U0.
FIG. 6. Color contour displays of
cross-sections of the electrostatic
potential (left panels) and magnitude
of perpendicular magnetic field (right
panels) at fixed times during: (a) and
(b) linear phase (Xit¼ 180), and (c)
and (d) saturation phase (Xit¼ 380).
102303-6 Sydora et al. Phys. Plasmas 22, 102303 (2015)
This article is copyrighted as indicated in the article. Reuse of AIP content is subject to the terms at: http://scitation.aip.org/termsconditions. Downloaded to IP:
128.97.43.42 On: Fri, 16 Oct 2015 17:20:25

quite similar to the structures observed in the experiments,
e.g., Fig. 4 of Ref. 7 and Fig. 5 of Ref. 10. It is seen that the
electrostatic component of the eigenmodes has broader radial
extent than the magnetic counterpart. A closer inspection of
the small-r region of the spiral in Fig. 6(c) shows that small-
scale concentrations of electrostatic potential are embedded
within the more extensive eigenmode. These local enhance-
ments correspond to the convective cells.
Figure 7 displays 2D color contours in the x-z plane of
the instantaneous electrostatic potential /ðx; y; z; tÞ, in the left
panels, and of the y-component Byðx; y; z; tÞ (azimuthal com-
ponent at this position) of the fluctuating magnetic field, in the
right panels. It presents a snapshot of these quantities within a
plane that illustrates the axial structure corresponding to a cut
along a fixed azimuthal angle h ¼ 0. It should be noted that
the axial extent displayed (z-direction) is approximately a fac-
tor of 63 larger than the transverse extent (x-direction), as is
required to capture the filamentary nature of the fluctuations.
The top two panels, Figs. 7(a) and 7(b), correspond to a time
Xit ¼ 180 during the linear growth stage, while the bottom
two panels, Figs. 7(c) and 7(d), are at the saturation phase,
Xit ¼ 380. They complement the transverse view shown in
Fig. 6. From the top panels, Figs. 7(a) and 7(b), it is seen that
the linearly unstable modes have parallel wavelengths compa-
rable to the length of the temperature filament. In the satura-
tion phase, Figs. 7(c) and 7(d), both the electrostatic potential
and the magnetic field develop significant cross-field struc-
tures; they result from the modifications of the temperature
profile. Also, visible elongations in Fig. 7(c) indicate the
development of significant contributions to the total electro-
static potential from kz¼ 0 modes.
C. Profile relaxation
Figure 8 provides a visual summary of the four stages
associated with the relaxation of the temperature filament.
Shown are 2D color contours of the electron temperature on
a plane (x, y) transverse to the confinement field, at an axial
location (z-position) midway in the computational box. The
top-left panel, Fig. 8(a), shows the early stage during which
the drift-Alfv�en modes grow exponentially. The filament
remains essentially circular but has small perturbations. The
top-right panel, Fig. 8(b), corresponds to the stage when
the linear instability has saturated and modest expansion of
the profile takes place. Up to this point, profile expansion
occurs due to E � B flows driven by the large amplitude
drift-Alfv�en modes. The bottom-left panel, Fig. 8(c), hints at
a post-saturation stage in which the profile is undergoing a
fission process in which the large initial filament breaks into
smaller filaments. The fission process is due to the increasing
dominance of the kz¼ 0 modes. The bottom-right panel, Fig.
8(d), illustrates that the fission event results in an asymptotic
state consisting of multiple filaments located far from the ini-
tial filament and having smaller scale. The choice of compu-
tational grid size and number of particles per cell is based on
the parameters of the initial temperature filament. While the
values used are adequate to resolve the linear growth and sat-
uration, they may not be sufficient to resolve the finer spatial
FIG. 7. Color contour displays of elec-
trostatic potential (left panels) and azi-
muthal component of magnetic field
(right panels) for a cross-section in the
Y¼ 0 plane at fixed times (a) and (b)
linear phase (Xit¼ 180), and (c) and
(d) saturation phase (Xit¼ 380).
102303-7 Sydora et al. Phys. Plasmas 22, 102303 (2015)
This article is copyrighted as indicated in the article. Reuse of AIP content is subject to the terms at: http://scitation.aip.org/termsconditions. Downloaded to IP:
128.97.43.42 On: Fri, 16 Oct 2015 17:20:25

scales generated at later times. A detailed quantitative study
of the dynamics of the asymptotic state requires a separate,
high-resolution simulation.
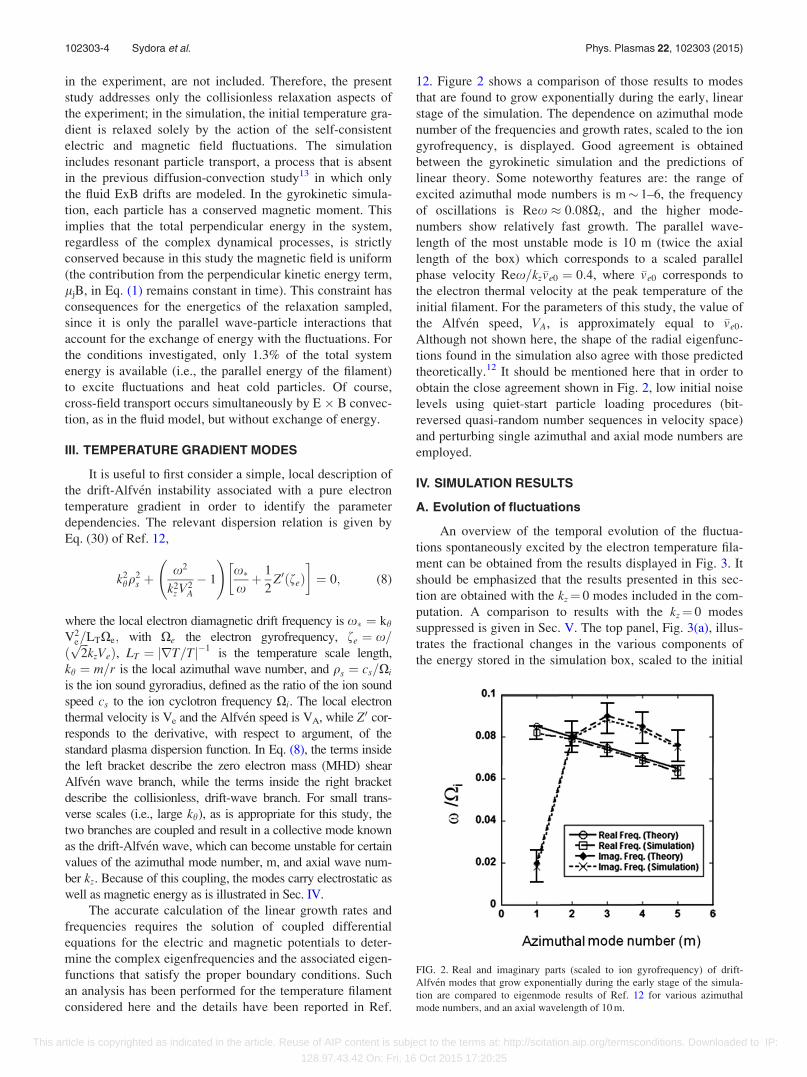
Figure 9 exhibits the details of the radial relaxation of
the initial temperature filament caused by the fluctuations.
The quantity displayed is the effective electron temperature
defined in Eq. (3), but now averaged over the axial direction,
z-axis, and azimuthal angle h, i.e., the radial profile, Te (r, t),scaled to the initial peak temperature T0. The top panel, Fig.
9(a), displays the radial dependence of the profile for differ-
ent times spanning the interval 0 � Xit � 905, covered in
Fig. 8. It is seen that, by the time the fluctuations are well
into the saturation stage, Xit ¼ 380, corresponding to the
green curve, the peak temperature has dropped by about 40%
and the maximum temperature gradient is relaxed by about a
factor of 2. By this time, the spreading of the temperature
extends to about twice the initial width of the filament. But a
drastic collapse of the profile occurs beyond this saturation
phase, as shown by the black curve at Xit ¼ 530 in which
the peak temperature drops by a further factor of 2 and an
outward heat pulse appears. The collapse and radial expan-
sion results in a flattened profile by Xit ¼ 905, as shown by
the lower blue curve.
The bottom panel, Fig. 9(b), documents the temporal
variation of the electron temperature at various radial posi-
tions indicated by the arrows shown at the bottom of the
frame in Fig. 9(a); they span a region extending near the cen-
ter of the initial filament to a location well into the cold
background plasma. It is seen that the interior of the filament
undergoes a gentle relaxation during the early saturation
phase and it is followed by a rapid collapse with a propagat-
ing pulse behavior for times Xit > 300. The speed of
propagation of the heat pulse is approximately Vpulse �0:0075ðc=xpeÞXi which in physical units becomes Vpulse �8:1� 103cm=s for c=xpe ¼ 0:45 cm and Xi ¼ 2:4� 106 s�1,
which is a factor of 10 smaller than the sound speed of the
cold plasma.
Comparing the observed profile relaxation to Figs. 4(a)
and 4(b) indicates that the first stage, consisting of a rela-
tively gentle expansion of the temperature profile, is associ-
ated with the saturation of the linearly unstable drift-Alfv�en
waves. But the drastic collapse of the profile after this satura-
tion is caused by the dominance of fluctuations having kz¼ 0
structure in the interval Xit > 400.
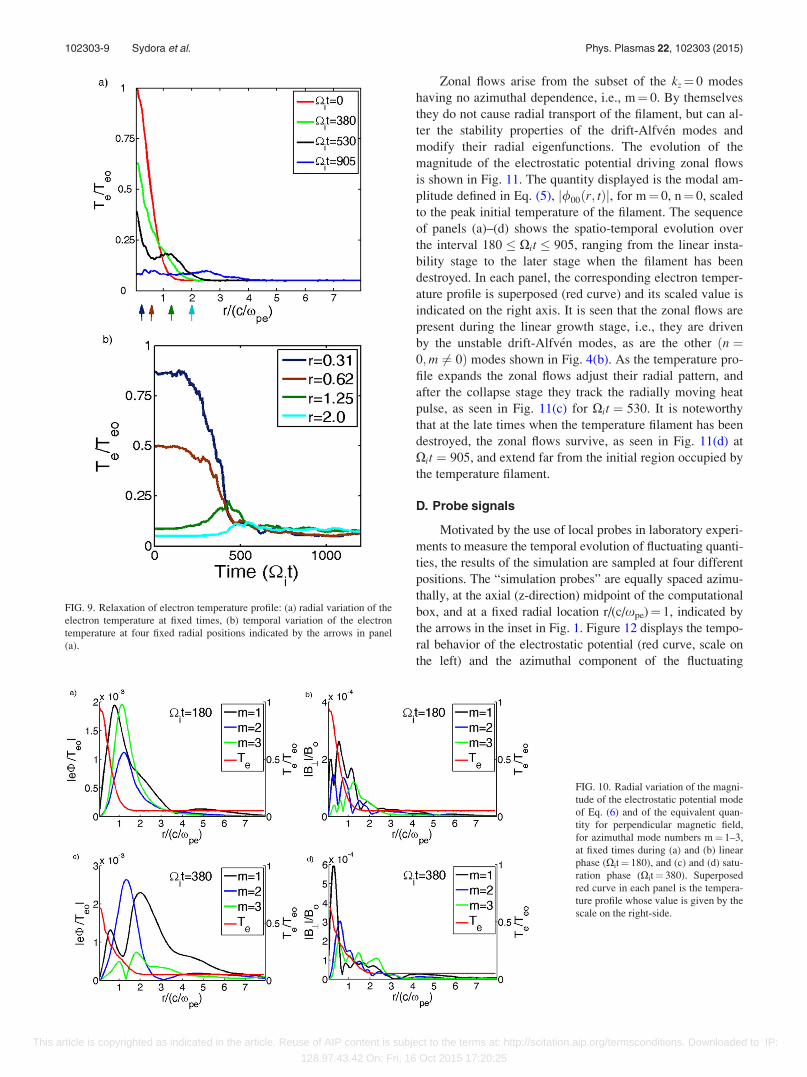
Figure 10 illustrates the radial rearrangement of the
eigenfunctions of the drift-Alfv�en modes, from the linear
stage to the saturation stage before the temperature profile
collapses. The left panels, Figs. 10(a) and 10(c), correspond
to the scaled magnitude of the electrostatic potential for
mode-m given by Eq. (6), i.e., jUmðr; tÞj, and the right pan-
els, Figs. 10(b) and 10(d), to the equivalent quantity for the
magnitude of the perpendicular component of the magnetic
field j ~B?ðm; r; tÞj. Within each panel, modes m¼ 1, 2, and 3
are shown. Superposed in each panel is the corresponding
electron temperature profile Teðr; tÞ (red curve), whose nu-
merical value is shown on the right side. The top panels,
Figs. 10(a) and 10(b), are for the linear stage Xit ¼ 180, and
the bottom panels, Figs. 10(c) and 10(d), are for the saturated
stage Xit ¼ 380. It is seen that in the linear stage the mag-
netic eigenfunctions are more localized than the electrostatic
eigenfunctions, consistent with Fig. 6. As the temperature
profile relaxes, the eigenmodes stretch outward and develop
more radial oscillations (larger perpendicular wave number),
as suggested by the contour displays of Figs. 7(c) and 7(d).
FIG. 8. Color contour displays of elec-
tron temperature across confinement
magnetic field at fixed times: (a)
Xit¼ 180, (b) Xit¼ 380, (c) Xit¼ 530,
and (d) Xit¼ 905.
102303-8 Sydora et al. Phys. Plasmas 22, 102303 (2015)
This article is copyrighted as indicated in the article. Reuse of AIP content is subject to the terms at: http://scitation.aip.org/termsconditions. Downloaded to IP:
128.97.43.42 On: Fri, 16 Oct 2015 17:20:25
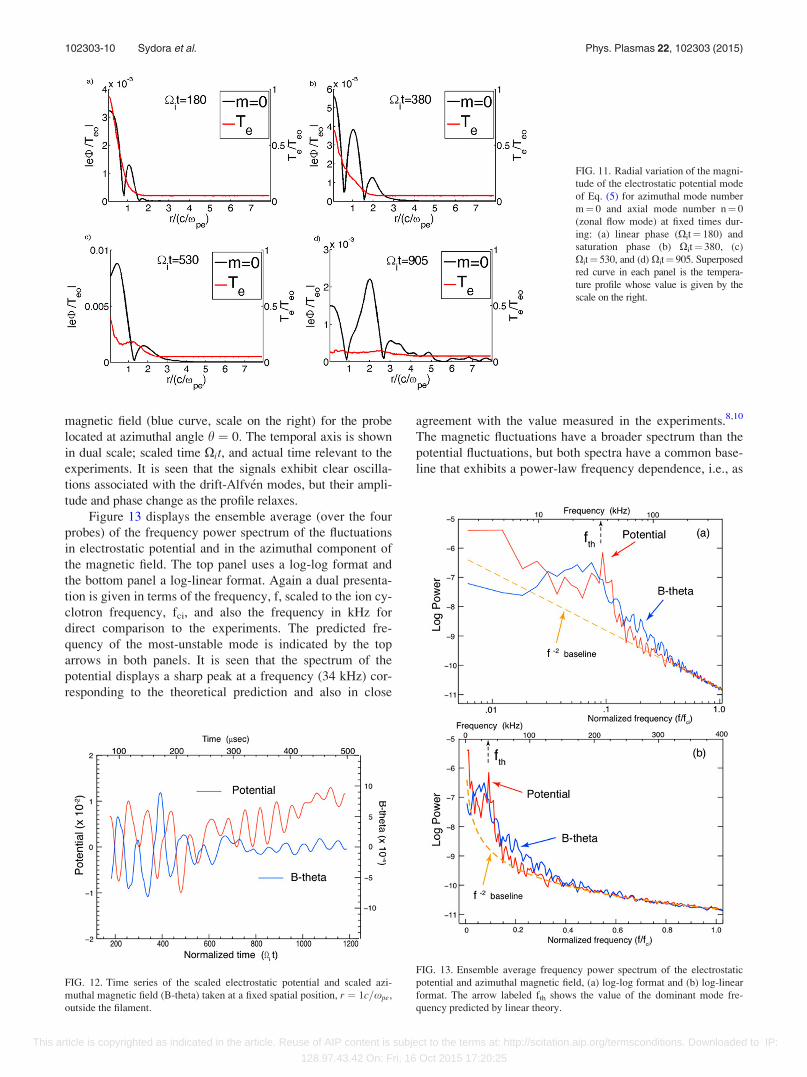
Zonal flows arise from the subset of the kz¼ 0 modes
having no azimuthal dependence, i.e., m¼ 0. By themselves
they do not cause radial transport of the filament, but can al-
ter the stability properties of the drift-Alfv�en modes and
modify their radial eigenfunctions. The evolution of the
magnitude of the electrostatic potential driving zonal flows
is shown in Fig. 11. The quantity displayed is the modal am-
plitude defined in Eq. (5), j/00ðr; tÞj, for m¼ 0, n¼ 0, scaled
to the peak initial temperature of the filament. The sequence
of panels (a)–(d) shows the spatio-temporal evolution over
the interval 180 � Xit � 905, ranging from the linear insta-
bility stage to the later stage when the filament has been
destroyed. In each panel, the corresponding electron temper-
ature profile is superposed (red curve) and its scaled value is
indicated on the right axis. It is seen that the zonal flows are
present during the linear growth stage, i.e., they are driven
by the unstable drift-Alfv�en modes, as are the other ðn ¼0;m 6¼ 0Þ modes shown in Fig. 4(b). As the temperature pro-
file expands the zonal flows adjust their radial pattern, and
after the collapse stage they track the radially moving heat
pulse, as seen in Fig. 11(c) for Xit ¼ 530. It is noteworthy
that at the late times when the temperature filament has been
destroyed, the zonal flows survive, as seen in Fig. 11(d) at
Xit ¼ 905, and extend far from the initial region occupied by
the temperature filament.
D. Probe signals
Motivated by the use of local probes in laboratory experi-
ments to measure the temporal evolution of fluctuating quanti-
ties, the results of the simulation are sampled at four different
positions. The “simulation probes” are equally spaced azimu-
thally, at the axial (z-direction) midpoint of the computational
box, and at a fixed radial location r/(c/xpe)¼ 1, indicated by
the arrows in the inset in Fig. 1. Figure 12 displays the tempo-
ral behavior of the electrostatic potential (red curve, scale on
the left) and the azimuthal component of the fluctuating
FIG. 9. Relaxation of electron temperature profile: (a) radial variation of the
electron temperature at fixed times, (b) temporal variation of the electron
temperature at four fixed radial positions indicated by the arrows in panel
(a).
FIG. 10. Radial variation of the magni-
tude of the electrostatic potential mode
of Eq. (6) and of the equivalent quan-
tity for perpendicular magnetic field,
for azimuthal mode numbers m¼ 1–3,
at fixed times during (a) and (b) linear
phase (Xit¼ 180), and (c) and (d) satu-
ration phase (Xit¼ 380). Superposed
red curve in each panel is the tempera-
ture profile whose value is given by the
scale on the right-side.
102303-9 Sydora et al. Phys. Plasmas 22, 102303 (2015)
This article is copyrighted as indicated in the article. Reuse of AIP content is subject to the terms at: http://scitation.aip.org/termsconditions. Downloaded to IP:
128.97.43.42 On: Fri, 16 Oct 2015 17:20:25
magnetic field (blue curve, scale on the right) for the probe
located at azimuthal angle h ¼ 0. The temporal axis is shown
in dual scale; scaled time Xit, and actual time relevant to the
experiments. It is seen that the signals exhibit clear oscilla-
tions associated with the drift-Alfv�en modes, but their ampli-
tude and phase change as the profile relaxes.
Figure 13 displays the ensemble average (over the four
probes) of the frequency power spectrum of the fluctuations
in electrostatic potential and in the azimuthal component of
the magnetic field. The top panel uses a log-log format and
the bottom panel a log-linear format. Again a dual presenta-
tion is given in terms of the frequency, f, scaled to the ion cy-
clotron frequency, fci, and also the frequency in kHz for
direct comparison to the experiments. The predicted fre-
quency of the most-unstable mode is indicated by the top
arrows in both panels. It is seen that the spectrum of the
potential displays a sharp peak at a frequency (34 kHz) cor-
responding to the theoretical prediction and also in close
agreement with the value measured in the experiments.8,10
The magnetic fluctuations have a broader spectrum than the
potential fluctuations, but both spectra have a common base-
line that exhibits a power-law frequency dependence, i.e., as
FIG. 11. Radial variation of the magni-
tude of the electrostatic potential mode
of Eq. (5) for azimuthal mode number
m¼ 0 and axial mode number n¼ 0
(zonal flow mode) at fixed times dur-
ing: (a) linear phase (Xit¼ 180) and
saturation phase (b) Xit¼ 380, (c)
Xit¼ 530, and (d) Xit¼ 905. Superposed
red curve in each panel is the tempera-
ture profile whose value is given by the
scale on the right.
FIG. 12. Time series of the scaled electrostatic potential and scaled azi-
muthal magnetic field (B-theta) taken at a fixed spatial position, r ¼ 1c=xpe,
outside the filament.
FIG. 13. Ensemble average frequency power spectrum of the electrostatic
potential and azimuthal magnetic field, (a) log-log format and (b) log-linear
format. The arrow labeled fth shows the value of the dominant mode fre-
quency predicted by linear theory.
102303-10 Sydora et al. Phys. Plasmas 22, 102303 (2015)
This article is copyrighted as indicated in the article. Reuse of AIP content is subject to the terms at: http://scitation.aip.org/termsconditions. Downloaded to IP:
128.97.43.42 On: Fri, 16 Oct 2015 17:20:25

f�2. By comparison to thermal runs without the temperature
filament, it has been identified that this component of the fre-
quency power spectrum is a feature of the numerical proce-
dure, i.e., it is not due to a physical process. But the
observed broadening around the unstable frequency, and ris-
ing above the f�2 baseline, is indeed an imprint of the under-
lying dynamics.
To obtain a sense of the nature of the dynamics causing
the broadening of the frequency spectrum, the permutation
entropy analysis (C-H plane technique) developed by Rosso
et al.22 is applied to the probe signals. This technique has
been shown to be an effective method to identify the various
possible dynamical processes (coherent, stochastic, chaotic,
fractional Brownian motion). A compact and practical
description of the concepts associated with the C-H plane
technique is given in Refs. 23 and 24. Figure 14 presents a
characteristic C-H display, with the vertical axis correspond-
ing to the Jensen-Shannon complexity, C, and the horizontal
axis to the normalized Shannon entropy, H. These quantities
are obtained from the Bandt-Pompe probability distribu-
tion25 generated from the time series sampled at each probe
position for a prescribed embedding dimension d, and sub-
sampling rate s. The choice of d is determined by the number
of data points available, and the value of s results from a
compromise between temporal resolution and the natural
scale of the structures contained in the time series. In Fig.
14, the practical choices used are d¼ 5 and s¼ 8 for analyz-
ing the fluctuations in electrostatic potential, /, and azi-
muthal magnetic field, Bth, sampled at each of the four
probes. The electron temperature, Te, calculated at each
probe location, exhibits substantial noise associated with the
discrete nature of the computation. The effects of adding
noise (with known spectral properties) to a chaotic process
has been investigated by Rosso et al.26 Adding noise to a
chaotic process moves the location in the C-H plane towards
the location of the pure noise signal along a path that roughly
parallels the maximum complexity curve. The change in the
C-H plane location depends upon the character of the noise
and the ratio of the noise amplitude to that of the chaotic
process (see Fig. 7 of Rosso et al.26 for details). To amelio-
rate the contribution of computational noise to the electron
temperature signals, the signal from each probe location is
averaged over four neighboring grid points to obtain a spa-
tially averaged temperature that has a lower noise content.
The C-H plane location of the temperature displayed in Fig.
14 is for the un-subsampled, spatially averaged temperature
(i.e., d¼ 5, s¼ 1). It is found that all these signals fall in the
region, within the C-H plane, associated with chaotic proc-
esses, i.e., above the fractional Brownian motion curve (la-
beled “fBm”) and having moderate entropy. The location of
these simulation signals in the C-H plane is consistent with
the results shown in Fig. 6 of Ref. 23 for the experimental
observations, and also for the results of a chaotic advection
model of the filament evolution.
E. Particle orbits
To explore how individual particles are affected by the
growing fluctuations and how their motion eventually results
in the relaxation of the temperature filament, the orbits of a
select group of self-consistent particles, not test particles, are
monitored. For this purpose a group of 104 electrons and 104
ions is chosen before the simulation is run; their velocity dis-
tribution is essentially Maxwellian. The initial positions lie
inside a cylindrical region having radius 0.5c/xpe from the
center of the simulation domain and uniformly distributed
along the axial direction. Figure 15 displays a sequence of
instantaneous particle positions in the x-y plane (i.e., across
the magnetic field), for the electron ensemble. The top left-
panel, Fig. 15(a), shows a uniform disk corresponding to the
starting positions. The top-right, Fig. 15(b), indicates that
during the linear growth stage, Xit ¼ 180, the disk broadens
FIG. 14. C-H (complexity-entropy) plane display of fluctuations in electro-
static potential, azimuthal magnetic field, and electron temperature sampled
by four different probes, equally spaced azimuthally, at radial position,
r ¼ 1c=xpe, as indicated in Fig. 1. All the signals are found to be in the
region associated with chaotic dynamics.
FIG. 15. Positions across the confinement magnetic field (x-y plane) of 104
electrons that initially were located in the central region of the temperature
filament. Times shown are: (a) Xit¼ 0, (b) Xit¼ 180, (c) Xit¼ 380, and (d)
Xit¼ 800.
102303-11 Sydora et al. Phys. Plasmas 22, 102303 (2015)
This article is copyrighted as indicated in the article. Reuse of AIP content is subject to the terms at: http://scitation.aip.org/termsconditions. Downloaded to IP:
128.97.43.42 On: Fri, 16 Oct 2015 17:20:25
and develops outstretched arms mirroring the structure of
drift-Alfv�en modes. The bottom left-panel, Fig. 15(c), during
the saturation phase Xit ¼ 380, shows a broad spreading of
the particles whose shape neither reflects the shape of the ini-
tial filament nor the structure of the drift-Alfv�en modes. The
bottom right-panel, Fig. 15(d), at Xit ¼ 800, after the col-
lapse shown in Fig. 8(b) occurs, shows several well-
separated patches that are uniformly populated. They give
the impression of a system undergoing internal mixing but
subjected to rapid fission into fragments, akin to the splitting
of a liquid into drops.
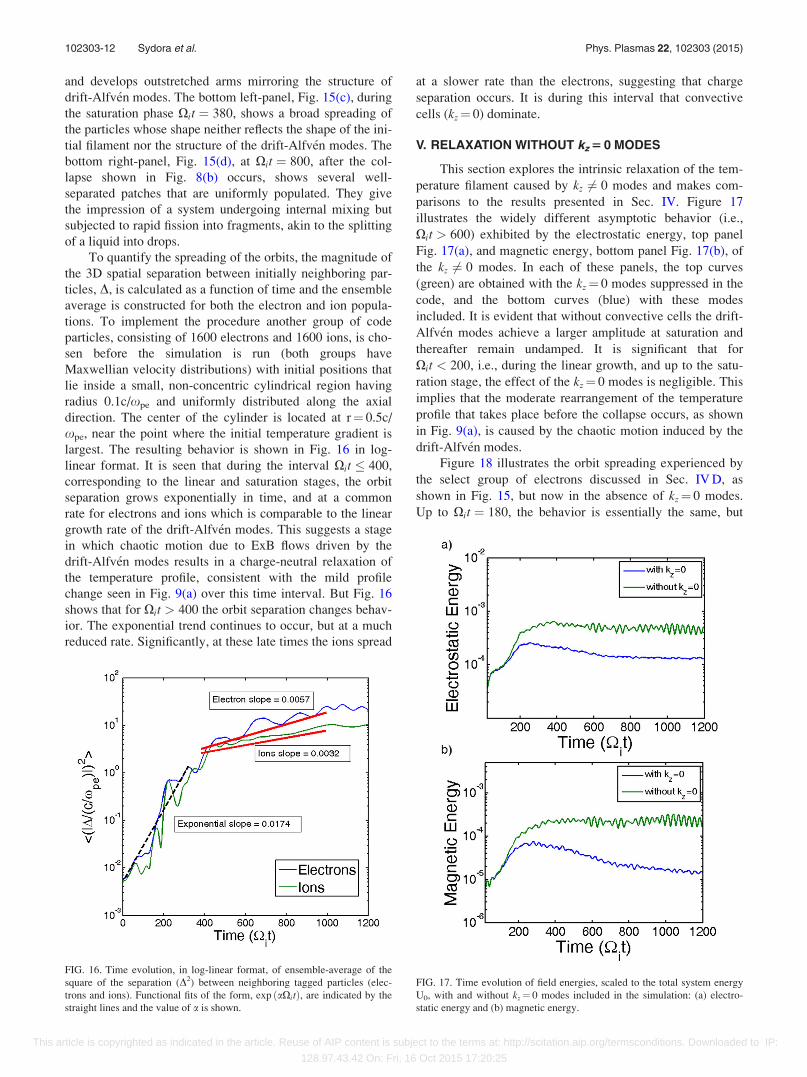
To quantify the spreading of the orbits, the magnitude of
the 3D spatial separation between initially neighboring par-
ticles, D, is calculated as a function of time and the ensemble
average is constructed for both the electron and ion popula-
tions. To implement the procedure another group of code
particles, consisting of 1600 electrons and 1600 ions, is cho-
sen before the simulation is run (both groups have
Maxwellian velocity distributions) with initial positions that
lie inside a small, non-concentric cylindrical region having
radius 0.1c/xpe and uniformly distributed along the axial
direction. The center of the cylinder is located at r¼ 0.5c/
xpe, near the point where the initial temperature gradient is
largest. The resulting behavior is shown in Fig. 16 in log-
linear format. It is seen that during the interval Xit � 400,
corresponding to the linear and saturation stages, the orbit
separation grows exponentially in time, and at a common
rate for electrons and ions which is comparable to the linear
growth rate of the drift-Alfv�en modes. This suggests a stage
in which chaotic motion due to ExB flows driven by the
drift-Alfv�en modes results in a charge-neutral relaxation of
the temperature profile, consistent with the mild profile
change seen in Fig. 9(a) over this time interval. But Fig. 16
shows that for Xit > 400 the orbit separation changes behav-
ior. The exponential trend continues to occur, but at a much
reduced rate. Significantly, at these late times the ions spread
at a slower rate than the electrons, suggesting that charge
separation occurs. It is during this interval that convective
cells (kz¼ 0) dominate.
V. RELAXATION WITHOUT kz 5 0 MODES
This section explores the intrinsic relaxation of the tem-
perature filament caused by kz 6¼ 0 modes and makes com-
parisons to the results presented in Sec. IV. Figure 17
illustrates the widely different asymptotic behavior (i.e.,
Xit > 600) exhibited by the electrostatic energy, top panel
Fig. 17(a), and magnetic energy, bottom panel Fig. 17(b), of
the kz 6¼ 0 modes. In each of these panels, the top curves
(green) are obtained with the kz¼ 0 modes suppressed in the
code, and the bottom curves (blue) with these modes
included. It is evident that without convective cells the drift-
Alfv�en modes achieve a larger amplitude at saturation and
thereafter remain undamped. It is significant that for
Xit < 200, i.e., during the linear growth, and up to the satu-
ration stage, the effect of the kz¼ 0 modes is negligible. This
implies that the moderate rearrangement of the temperature
profile that takes place before the collapse occurs, as shown
in Fig. 9(a), is caused by the chaotic motion induced by the
drift-Alfv�en modes.
Figure 18 illustrates the orbit spreading experienced by
the select group of electrons discussed in Sec. IV D, as
shown in Fig. 15, but now in the absence of kz¼ 0 modes.
Up to Xit ¼ 180, the behavior is essentially the same, but
FIG. 16. Time evolution, in log-linear format, of ensemble-average of the
square of the separation (D2) between neighboring tagged particles (elec-
trons and ions). Functional fits of the form, exp ðaXitÞ, are indicated by the
straight lines and the value of a is shown.
FIG. 17. Time evolution of field energies, scaled to the total system energy
U0, with and without kz¼ 0 modes included in the simulation: (a) electro-
static energy and (b) magnetic energy.
102303-12 Sydora et al. Phys. Plasmas 22, 102303 (2015)
This article is copyrighted as indicated in the article. Reuse of AIP content is subject to the terms at: http://scitation.aip.org/termsconditions. Downloaded to IP:
128.97.43.42 On: Fri, 16 Oct 2015 17:20:25
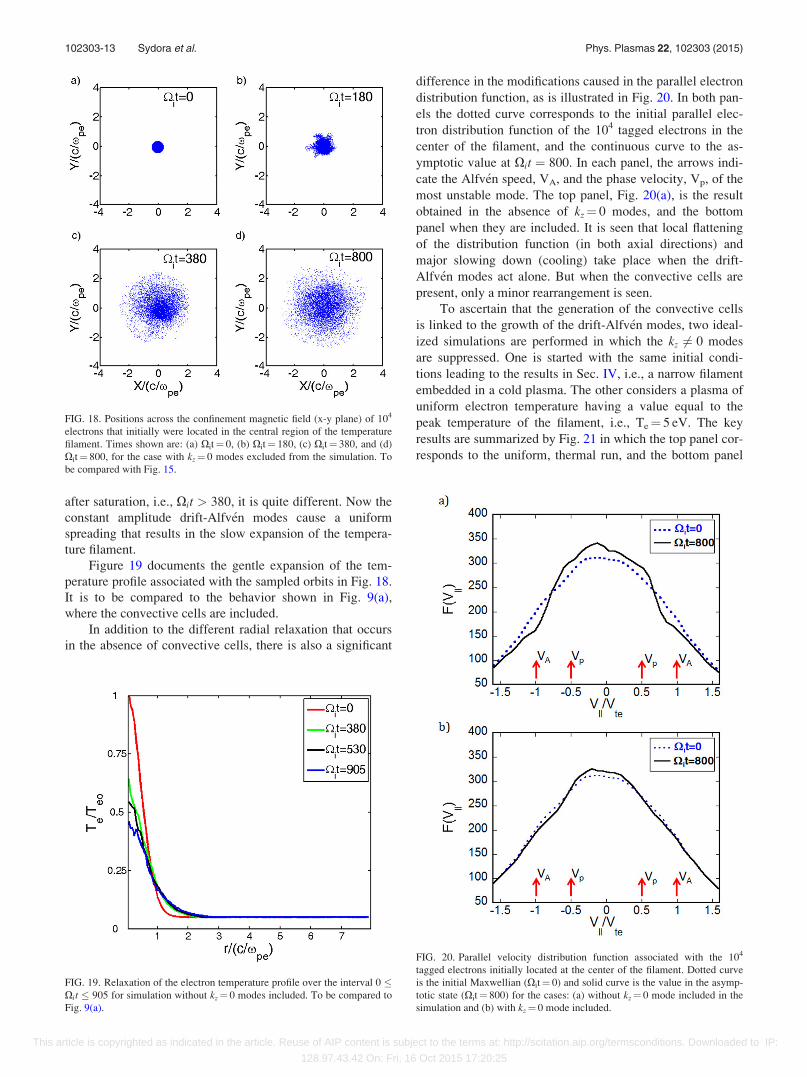
after saturation, i.e., Xit > 380, it is quite different. Now the
constant amplitude drift-Alfv�en modes cause a uniform
spreading that results in the slow expansion of the tempera-
ture filament.
Figure 19 documents the gentle expansion of the tem-
perature profile associated with the sampled orbits in Fig. 18.
It is to be compared to the behavior shown in Fig. 9(a),
where the convective cells are included.
In addition to the different radial relaxation that occurs
in the absence of convective cells, there is also a significant
difference in the modifications caused in the parallel electron
distribution function, as is illustrated in Fig. 20. In both pan-
els the dotted curve corresponds to the initial parallel elec-
tron distribution function of the 104 tagged electrons in the
center of the filament, and the continuous curve to the as-
ymptotic value at Xit ¼ 800. In each panel, the arrows indi-
cate the Alfv�en speed, VA, and the phase velocity, Vp, of the
most unstable mode. The top panel, Fig. 20(a), is the result
obtained in the absence of kz¼ 0 modes, and the bottom
panel when they are included. It is seen that local flattening
of the distribution function (in both axial directions) and
major slowing down (cooling) take place when the drift-
Alfv�en modes act alone. But when the convective cells are
present, only a minor rearrangement is seen.
To ascertain that the generation of the convective cells
is linked to the growth of the drift-Alfv�en modes, two ideal-
ized simulations are performed in which the kz 6¼ 0 modes
are suppressed. One is started with the same initial condi-
tions leading to the results in Sec. IV, i.e., a narrow filament
embedded in a cold plasma. The other considers a plasma of
uniform electron temperature having a value equal to the
peak temperature of the filament, i.e., Te¼ 5 eV. The key
results are summarized by Fig. 21 in which the top panel cor-
responds to the uniform, thermal run, and the bottom panel
FIG. 18. Positions across the confinement magnetic field (x-y plane) of 104
electrons that initially were located in the central region of the temperature
filament. Times shown are: (a) Xit¼ 0, (b) Xit¼ 180, (c) Xit¼ 380, and (d)
Xit¼ 800, for the case with kz¼ 0 modes excluded from the simulation. To
be compared with Fig. 15.
FIG. 19. Relaxation of the electron temperature profile over the interval 0 �Xit � 905 for simulation without kz¼ 0 modes included. To be compared to
Fig. 9(a).
FIG. 20. Parallel velocity distribution function associated with the 104
tagged electrons initially located at the center of the filament. Dotted curve
is the initial Maxwellian (Xit¼ 0) and solid curve is the value in the asymp-
totic state (Xit¼ 800) for the cases: (a) without kz¼ 0 mode included in the
simulation and (b) with kz¼ 0 mode included.
102303-13 Sydora et al. Phys. Plasmas 22, 102303 (2015)
This article is copyrighted as indicated in the article. Reuse of AIP content is subject to the terms at: http://scitation.aip.org/termsconditions. Downloaded to IP:
128.97.43.42 On: Fri, 16 Oct 2015 17:20:25

to the case with the temperature filament present. The curves
in Fig. 21 are the potential mode-amplitudes given by Eq.
(6), scaled to the peak of the electron temperature,
ejUmðr; tÞj=T0, and radially averaged over the interval
r ¼ 0� 4c=xpe, as done in Fig. 4, but now the summation
over the axial mode numbers has only the contribution from
n¼ 0 (kz¼ 0). The range of azimuthal mode numbers
m¼ 1–5 is shown. It is seen that in the uniform temperature
plasma there is a finite level of convective-cell fluctuations.
After an initial transient they settle to an essentially constant
level which is two-orders of magnitude smaller than that
shown in Fig. 4(b). The bottom panel, Fig. 21(b), shows that
the temperature filament can cause the growth of convective
cells, but at a relatively small growth rate (<0:005 X�1i ) that
cannot result in the large amplitude fluctuations in Fig. 4(b),
where the drift-Alfv�en modes are active.
VI. DISCUSSION
As mentioned in the Introduction, this study aims to pro-
vide insight into the LAPD heat transport experiments, to
assess the capabilities of the gyrokinetic model, and to
elucidate related nonlinear processes. In this section, a dis-
cussion is presented of what has been learned in the pursuit
of these goals.
Although it is evident from the outset that the simulation
model does not contain important elements present in the
LAPD experiments, such as Coulomb collisions, open axial
boundaries, and a heating source, it is found that several fea-
tures measured in the laboratory are well-reproduced. A cen-
tral one is the linear instability of drift-Alfv�en waves. The
unstable modes display a radial eigenmode structure similar
to that observed in the experiments, having both an electro-
static and a magnetic character, even at the relatively small
value of the plasma-beta parameter considered. The fre-
quency of the dominant mode in the simulation power spec-
trum is 34 kHz, which is to be compared to the value of
38 kHz measured in the early study by Burke et al.8 and of
30 kHz in the more recent experiment by Pace et al.10 In the
saturation stage, the simulation shows that the cross-field
fluctuations are dominated by an m¼ 1 spiral structure, as
has been documented in the laboratory.
In the simulation, the power spectrum of the fluctuations
exhibits a relative broadening, but its shape is masked by a
numerical noise floor that follows a power-law frequency de-
pendence of the form f�2. This is in contrast to the broadband
frequency spectrum observed in the laboratory. The experi-
ments display an exponential frequency dependence, i.e., the
power spectrum is proportional to expð�4pf sÞ, where the
time scale s corresponds to the width of Lorentzian-shaped
temporal pulses. It is surmised that the difference in the spec-
tral behavior, aside from the numerical noise floor, arises
from the inability of the simulation to arrive at an equilibrium
in which the radial transport losses are balanced by the input
from the heating source.
The exponential power spectrum observed in the LAPD
heat transport experiments has been shown23,27 to be a signa-
ture of the underlying chaotic dynamics associated with ExB
flows. Thus, the question arises about the nature of the dy-
namics in the simulation since the power spectrum lacks a
clear exponential frequency dependence. To explore this
issue, a C-H plane analysis is applied, as shown in Fig. 14. It
is found that the signals from the simulation occupy the
same chaotic region in the C-H plane as the measurements
from the heat transport experiment, found in Fig. 6 of Ref.
23. The inference is that the underlying dynamics sampled
by the simulation during the finite length of time correspond-
ing to the saturation stage, Xit � 200� 400, are chaotic.
A unique capability of the simulation is the visualization
of the orbits followed by a select group of tagged particles.
The insight gained from this tool is that the orbits of initially
adjacent particles separate exponentially in time during the
stage leading to the saturation of the drift-Alfv�en waves.
This behavior, often viewed as a definition of a chaotic pro-
cess, provides independent support for the result of the C-H
plane analysis in which the fluctuations are found to be
chaotic.
The modest relaxation of the temperature profile seen in
the simulation during the stage, where the drift-Alfv�en waves
have been identified to cause chaotic motion, is representa-
tive of the relaxation observed in the experiments. But the
FIG. 21. Behavior with only kz¼ 0 modes included in the simulation.
Shown is the temporal evolution of the scaled amplitude of the electrostatic
mode potential of Eq. (6) but only for n¼ 0 modes in the summation. As in
Fig. 4(b) the result is averaged in radius, over r¼ 0-4c/xpe, for azimuthal
modes (m¼ 1–5). Top panel (a) is obtained with a uniform electron temper-
ature equal to the peak electron temperature of the filament. Bottom panel
(b) is obtained with the filament considered in the results of Sec. IV. To be
compared with Fig. 4(b).
102303-14 Sydora et al. Phys. Plasmas 22, 102303 (2015)
This article is copyrighted as indicated in the article. Reuse of AIP content is subject to the terms at: http://scitation.aip.org/termsconditions. Downloaded to IP:
128.97.43.42 On: Fri, 16 Oct 2015 17:20:25

rapid collapse that arises in the simulation from the kz¼ 0
convective cells has not been observed, as might be expected
because of the open axial boundary conditions encountered
in the laboratory.
What differs fundamentally between the simulation
results and the laboratory studies is the nature of the asymp-
totic state. In the experiments, a transport equilibrium is
reached in which chaotic advection by ExB flows is balanced
against the power input from the heating source. And, of
course, local thermal equilibrium is maintained due to
Coulomb collisions. In the simulation, two widely different
asymptotic states can be attained depending on the presence
of kz¼ 0 modes. Without them, as is closer to the experimen-
tal situation, the simulation reaches a state in which there is
a broadened temperature profile, resembling that observed in
the laboratory, but its essence is closer to a Bernstein-Green-
Kruskal (BGK) equilibrium. In this state, finite amplitude
drift-Alfv�en waves simultaneously coexist with the broad-
ened temperature profile, and with a modified parallel veloc-
ity distribution function. The asymptotic state reached in the
presence of kz¼ 0 modes is radically different. It is reached
by a fission process that results in a collection of convective
cells and smaller-scale filaments.
In regard to nonlinear processes, it has been found that
drift-Alfv�en waves can drive convective cells to a relative
large level in the absence of zero-order density gradients.
Surprisingly, the combination of these two mode structures
has been found to result in the generation of radially expand-
ing heat pulses, somewhat reminiscent of the blob struc-
tures28 frequently observed at the edge of fusion devices.
VII. CONCLUSIONS
A 3D electromagnetic, gyrokinetic particle code has
been found to quantitatively reproduce some of the principal
features observed in basic experiments on electron heat
transport. This success has been achieved in spite of some
extreme differences with the experimental environment such
as neglect of collisions, periodic boundary conditions, and
lack of an external heat source. It is thus suggestive that it
would be valuable to undertake a future simulation study in
which such effects are included.
The asymptotic state of rapid temperature profile relaxa-
tion, resulting from the combined effect of drift-Alfv�en
waves and convective cells, warrants a dedicated theoretical
and simulation investigation. It would also be of interest to
search for experimental arrangements that may capture some
of these interesting processes.
ACKNOWLEDGMENTS
The work of R.D.S. was supported by the Natural
Science and Engineering Research Council (NSERC) of
Canada and that of G.J.M., J.E.M., and B.V.C. is performed
under the auspices of the Basic Plasma Science Facility
(BaPSF) at UCLA which is supported by a DOE-NSF
cooperative agreement.
1W. Horton, Turbulent Transport in Magnetized Plasmas (World ScientificPublishing Company, 2012), p. 338.
2J. Garc�ıa, J. Dies, F. Castej�on, and K. Yamazaki, Phys. Plasmas 14,
102511 (2007).3F. Ryter, G. Tardini, F. De Luca, H.-U. Fahrbach, F. Imbeaux, A. Jacchia,
K. K. Kirov, F. Leuterer, P. Mantica, A. G. Peeters, G. Pereverzev, W.
Suttrop, and ASDEX Upgrade Team, Nucl. Fusion 43, 1396 (2003).4W. Gekelman, H. Pfister, Z. Lucky, J. Bamber, D. Leneman, and J.
Maggs, Rev. Sci. Instrum. 62, 2875 (1991).5A. T. Burke, J. E. Maggs, and G. J. Morales, Phys. Rev. Lett. 81, 3659
(1998).6A. T. Burke, J. E. Maggs, and G. J. Morales, Phys. Rev. Lett. 84, 1451
(2000).7A. T. Burke, J. E. Maggs, and G. J. Morales, Phys. Plasmas 7, 544 (2000).8A. T. Burke, J. E. Maggs, and G. J. Morales, Phys. Plasmas 7, 1397
(2000).9D. C. Pace, M. Shi, J. E. Maggs, G. J. Morales, and T. A. Carter, Phys.
Rev. Lett. 101, 085001 (2008).10D. C. Pace, M. Shi, J. E. Maggs, G. J. Morales, and T. A. Carter, Phys.
Plasmas 15, 122304 (2008).11J. E. Maggs and G. J. Morales, Plasma Phys. Controlled Fusion 55,
085015 (2013).12J. R. Pe~nano, G. J. Morales, and J. E. Maggs, Phys. Plasmas 7, 144 (2000).13M. Shi, D. C. Pace, G. J. Morales, J. E. Maggs, and T. A. Carter, Phys.
Plasmas 16, 062306 (2009).14H. Naitou, K. Tsuda, W. W. Lee, and R. D. Sydora, Phys. Plasmas 2, 4257
(1995).15H. Okuda and J. M. Dawson, Phys. Fluids 16, 408 (1973).16C. Z. Cheng and H. Okuda, Nucl. Fusion 18, 587 (1978).17R. Z. Sagdeev, V. D. Shapiro, and V. I. Shevchenko, Fiz. Plazmy 4, 551
(1978) [Sov. J. Plasma Phys. 4, 306 (1978)].18K. Mima and Y. C. Lee, Phys. Fluids 23, 105 (1980).19T. S. Hahm, W. W. Lee, and A. Brizard, Phys. Fluids 31, 1940 (1988).20R. D. Sydora, Phys. Plasmas 8, 1929 (2001).21P. K. Shukla, M. Yu, H. U. Rahman, and K. H. Spatschek, Phys. Rev. A
23, 321 (1981).22O. A. Rosso, H. A. Larrondo, M. T. Martin, A. Plastino, and M. A.
Fuentes, Phys. Rev. Lett. 99, 154102 (2007).23J. E. Maggs and G. J. Morales, Plasma Phys. Controlled Fusion 54,
124041 (2012).24J. E. Maggs, T. L. Rhodes, and G. J. Morales, Plasma Phys. Controlled
Fusion 57, 045004 (2015).25C. Bandt and B. Pompe, Phys. Rev. Lett. 88, 174102 (2002).26O. A. Rosso, L. C. Carpi, P. M. Saco, M. G. Ravetti, A. Plastino, and H.
A. Larrondo, Physica A 391, 42 (2012).27J. E. Maggs and G. J. Morales, Phys. Rev. E 86, 015401 (2012).28D. A. D’Ippolito, J. R. Myra, and S J. Zweben, Phys. Plasmas 18, 060501
(2011).
102303-15 Sydora et al. Phys. Plasmas 22, 102303 (2015)
This article is copyrighted as indicated in the article. Reuse of AIP content is subject to the terms at: http://scitation.aip.org/termsconditions. Downloaded to IP:
128.97.43.42 On: Fri, 16 Oct 2015 17:20:25