Three Challenges in the U.S. Labor Market: Participation ...
31
Three Challenges in the U.S. Labor Market: Participation, Inequality, and Fluidity Jason Furman Chairman, Council of Economic Advisers World Bank Group January 28, 2016
Transcript of Three Challenges in the U.S. Labor Market: Participation ...

Three Challenges in the U.S. Labor Market:
Participation, Inequality, and Fluidity
Jason FurmanChairman, Council of Economic Advisers
World Bank GroupJanuary 28, 2016

Overview
1
1. Strength of the Labor Market Recovery
2. Three Long-Standing Challenges:a) Labor Force Participationb) Income Inequalityc) Labor Market Fluidity
3. (Brief) Policy Implications
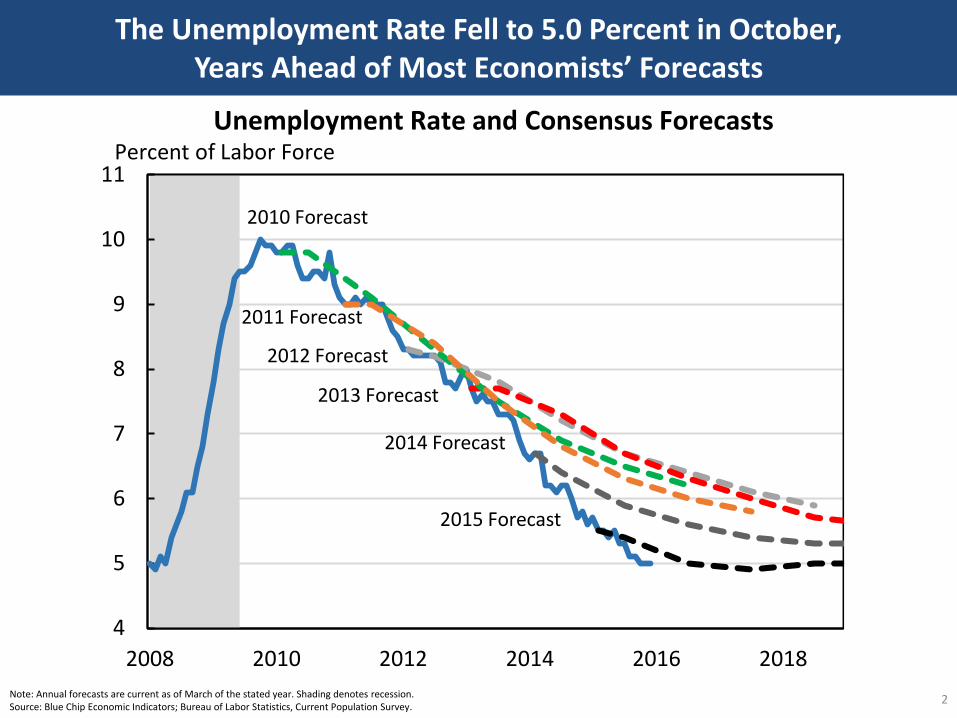
The Unemployment Rate Fell to 5.0 Percent in October,Years Ahead of Most Economists’ Forecasts
2Note: Annual forecasts are current as of March of the stated year. Shading denotes recession.Source: Blue Chip Economic Indicators; Bureau of Labor Statistics, Current Population Survey.
4
5
6
7
8
9
10
11
2008 2010 2012 2014 2016 2018
2012 Forecast
2013 Forecast
2014 Forecast
2011 Forecast
2010 Forecast
Unemployment Rate and Consensus ForecastsPercent of Labor Force
2015 Forecast

Labor Market Recovery is Broad Based, But Still Some Elevation in the Broadest Measures and Long-term Unemployment
3Note: Unemployment rates by education are for persons age 25+. All other rates for persons age 16+ unless noted. Source: Bureau of Labor Statistics; CEA calculations.
91
120
90
102
103
111
103
121
103
109
103
106
326
64
87
84
92
89
99
72
99
74
106
90
28
-13
8
-2
-2
-10
-3
-15
-3
-7
-3
-5
-50 0 50 100 150 200 250 300 350
Long-Term UR
Short-Term UR
U-6 (U-5 + Part-Time for Economic Reasons)
U-5 (U-4 + Other Marginally Attached)
U-4 (U-3 + Discouraged)
Asian UR
Hispanic UR
Black UR
White UR
Female UR
Male UR
Overall Unemployment Rate (UR)
Remaining Elevation as of December 2015 Percent Increase to Great Recession Peak Percent Recovered
Percent Change in Indicator Relative to 2001-07 Average
Tracking the Recovery Across Labor Market IndicatorsAll Data as of December 2015

Nominal Wages are Rising Somewhat Faster Than Earlier in the Recovery, and Low Inflation is Boosting Real Wage Growth
4
Average Hourly Earnings for all Private Workers (Dec-15)
2010-2014Average
Consumer Price Index - All Urban Consumers
(Nov-15)
-0.5
0.0
0.5
1.0
1.5
2.0
2.5
3.0
3.5
4.0
4.5
2010 2011 2012 2013 2014 2015 2016
Average Hourly Earnings Growth and Consumer Inflation12-Month Percent Change
Source: Bureau of Labor Statistics; CEA calculations.

The First Challenge: Labor Force Participation
5Note: Shading denotes recession.Source: Bureau of Labor Statistics.
Employment-Population Ratio
Dec-15
Labor Force Participation Rate
55
60
65
70
1950 1960 1970 1980 1990 2000 2010
Labor Force Participation and Employment-Population RatesPercent

Four Potential Explanations of the Decline in Labor Force Participation
6
The labor force participation rate fell 3.4 percentage points from 2007-Q4 to 2015-Q4. This can be attributed to:
Structural1. Aging of the population. This is the mechanical impact of, for example, having fewer
55-59 year olds (male LFPR = 77%) and more 70-74 year olds (male LFPR = 23%).
2. Non-aging trends. Male participation rates have been declining since the early 1950s and female participation rates have been declining since the late 1990s.
Cyclical3. Normal business cycle. Historically, for every 1 percentage point elevation in the
unemployment rate, the participation rate is 0.1 to 0.2 percentage points lower.
4. Unusual business cycle. The Great Recession was unusually severe and hit a labor market that has undergone structural changes, making the cyclical impact different.
Note – CEA’s statistical analysis combines 2 and 4 as a residual.
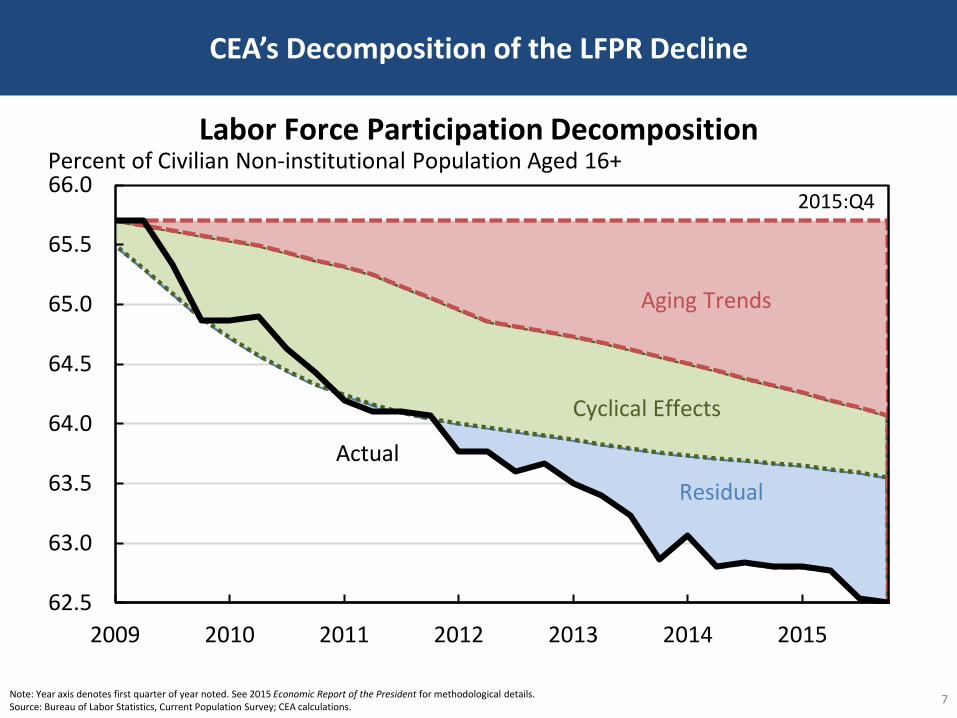
CEA’s Decomposition of the LFPR Decline
7Note: Year axis denotes first quarter of year noted. See 2015 Economic Report of the President for methodological details.Source: Bureau of Labor Statistics, Current Population Survey; CEA calculations.
62.5
63.0
63.5
64.0
64.5
65.0
65.5
66.0
2009 2010 2011 2012 2013 2014 2015
Labor Force Participation DecompositionPercent of Civilian Non-institutional Population Aged 16+
Residual
Aging Trends
Cyclical Effects
Actual
2015:Q4

The Case for the Residual Being Unusual Business Cycle (i.e. Hopefully Cyclical)
8
62.5
63.0
63.5
64.0
64.5
65.0
65.5
66.0
66.5
67.0
2009 2010 2011 2012 2013 2014
Labor Force Participation DecompositionIncluding Mean Duration of Unemployment
Percent
Remaining Residual
Other Effects
Mean Duration
Actual
Unemp.
Gap
Unemp.
Gap (t-4)
Unemp.
Gap (t-8)
Mean
Duration
Mean
Duration
(t-4)
Mean
Duration
(t-8)
-0.0330* 0.00429 0.0151 -0.00406 -0.0142* 0.00222
(0.00914) (0.0146) (0.0114) (0.00534) (0.00524) (0.00527)
Independent Variables (Year-over-Year Differences)
Regression of Quarterly Differences in Detrended Participation Rate
Note: Regression is estimated using data from 1960:Q1 to 2014:Q2. Newey-West standard errors using a maximum lag of 12 are reported in parentheses. Participation rate and unemployment gap are detrended using the procedure described in Appendix A. F-tests are joint significance tests of the disability insurance, mean duration, and schooling variables. * p<0.01.Source: Bureau of Labor Statistics; CEA calculations.

The Case for the Residual Being Non-aging Trends (i.e. Structural)
9Source: Bureau of Labor Statistics; Aaronson et al. (2006); CEA calculations.
Actual (Annual
Average)
2015
Aaronson et al. 2006 Projections Based on
Structural Trends
62
63
64
65
66
67
2004 2005 2006 2007 2008 2009 2010 2011 2012 2013 2014 2015
Labor Force Participation vs. Pre-Crisis Structural ProjectionsPercent of Civilian Non-institutional Population Age 16+
Overall
Men
Dec-15
Female
30
40
50
60
70
80
90
1950 1960 1970 1980 1990 2000 2010
Labor Force Participation by GenderPercent of Civilian Non-institutional Population Age 16+

Structural Declines in Employment-Population Ratios
10Note: Shading denotes recession.Source: Bureau of Labor Statistics; CEA calculations.
Prime-Age (25-54) Female Employment-
Population Ratio
1948-2007Trend
Dec-15
30
40
50
60
70
80
90
1950 1960 1970 1980 1990 2000 2010
Prime-Age Female Employment-Population RatioPercent
2000-2007 Trend
Prime-Age (25-54) Male Employment-Population
Ratio
1948-2007Trend
Dec-15
80
85
90
95
100
1950 1960 1970 1980 1990 2000 2010
Prime-Age Male Employment-Population RatioPercent

Canada
France
Germany
Italy
Japan
2014
United Kingdom
United States
86
88
90
92
94
96
98
100
1990 1995 2000 2005 2010 2015
Prime-Age Male Labor Force Participation RatesPercent
CanadaFrance
2014
Germany
Italy
Japan
United Kingdom
United States
50
60
70
80
90
1990 1995 2000 2005 2010 2015
Prime-Age Female Labor Participation RatesPercent
Prime-Age LFPR Across G-7 Economies
11Source: Organisation for Economic Co-operation and Development.

30
40
50
60
70
80
90
100
Slo
ven
iaSw
eden
Icel
and
Po
rtu
gal
Swit
zerl
and
Au
stri
aN
orw
ayD
enm
ark
Fran
ceFi
nla
nd
Ge
rman
ySp
ain
Ne
the
rlan
ds
Can
ada
Esto
nia
Cze
ch R
epu
blic
Luxe
mb
ou
rgB
elgi
um
Slo
vak
Rep
ub
licU
nit
ed K
ingd
om
Po
lan
dN
ew
Ze
alan
dH
un
gary
Isra
el
Au
stra
liaG
reec
eJa
pan
Un
ited
Sta
tes
Irel
and
Ch
ileIt
aly
Ko
rea
Mex
ico
Turk
ey
Prime-Age Female Labor Force ParticipationPercent of Population
80
85
90
95
100
Cze
ch R
epu
blic
Jap
anSw
itze
rlan
dLu
xem
bo
urg
Mex
ico
Slo
vak
Rep
ub
licSw
eden
Gre
ece
Fran
ceIc
elan
dG
erm
any
Au
stri
aSl
ove
nia
Spai
nC
hile
Esto
nia
Ne
the
rlan
ds
Un
ited
Kin
gdo
mN
ew
Ze
alan
dP
ort
uga
lB
elgi
um
Ko
rea
Can
ada
Den
mar
kA
ust
ralia
Turk
ey
Po
lan
dFi
nla
nd
Irel
and
Hu
nga
ryN
orw
ayU
nit
ed S
tate
sIt
aly
Isra
el
Prime-Age Male Labor Force ParticipationPercent of Population
Prime-Age LFPR Across OECD Economies
12Source: Organisation for Economic Co-operation and Development.

U.S. Labor Market Has High Flexibility But Low Supportiveness
13Source: Organisation for Economic Co-operation and Development.
OECD Measures of Institutional Labor Market SupportUS Percentile Rank
(100=Most Supportive)
Expenditure on Active Labor Market Policies 3
Net Childcare Costs, Lone Parent 6
Implicit Rax on Returning to Work, Lone Parent 9
Unemployment Benefits (1 Year) 11
Unemployment Benefits (5 Years) 11
Number of Weeks Lost Due to Sick Leave 11
Net Childcare Costs, Couples 13
Implicit Tax on Returning to Work, 2nd Earner 13
Tax Wedge: Single Earner vs. Second-Earner Couples 25
Public Expenditure for Childcare 29
OECD Measures of Labor Market FlexibilityUS Percentile Rank
(100=Most Flexible)
Overall Labor Market Regulation 100
Employment Protection for Regular Employment 100
Scope of State Intervention 94
Minimum Cost of Labor 92
Coverage of Collective Bargaining Agreements 90
Labor Taxation 71
Barriers to Entrepreneurship 62
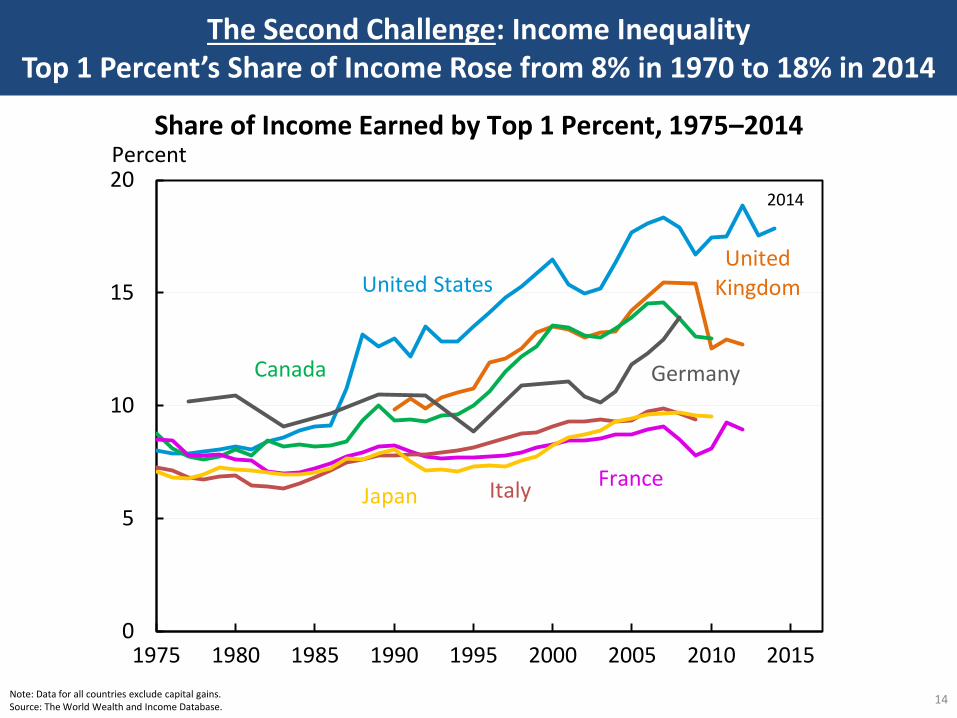
The Second Challenge: Income InequalityTop 1 Percent’s Share of Income Rose from 8% in 1970 to 18% in 2014
14Note: Data for all countries exclude capital gains. Source: The World Wealth and Income Database.
United States
2014
Canada
FranceItalyJapan
Germany
0
5
10
15
20
1975 1980 1985 1990 1995 2000 2005 2010 2015
Share of Income Earned by Top 1 Percent, 1975–2014Percent
United Kingdom

The “Competitive” Explanation of Inequality:Skill-Biased Technical Change, Job Polarization, and Globalization
15Note: Excludes five small outlier occupational categories.Source: Bureau of Labor Statistics, Current Population Survey; CEA calculations.
Machine Operators
Secretaries, Stenographers,
and Typists
Service Occupations, Except Protective
and Household
Technicians and Related Support
Occupations
Teachers, Except Postsecondary
Management-Related Occupations
Executive, Administrative, and Managerial
Occupations
-3,000
-2,000
-1,000
0
1,000
2,000
3,000
4,000
5,000
6,000
7,000
$10 $14 $18 $22 $26 $30Average Hourly Wage, 1989 (in 2014 Dollars)
Change in Employment by Detailed Occupation, 1989–2014Change in Total Employment, Thousands
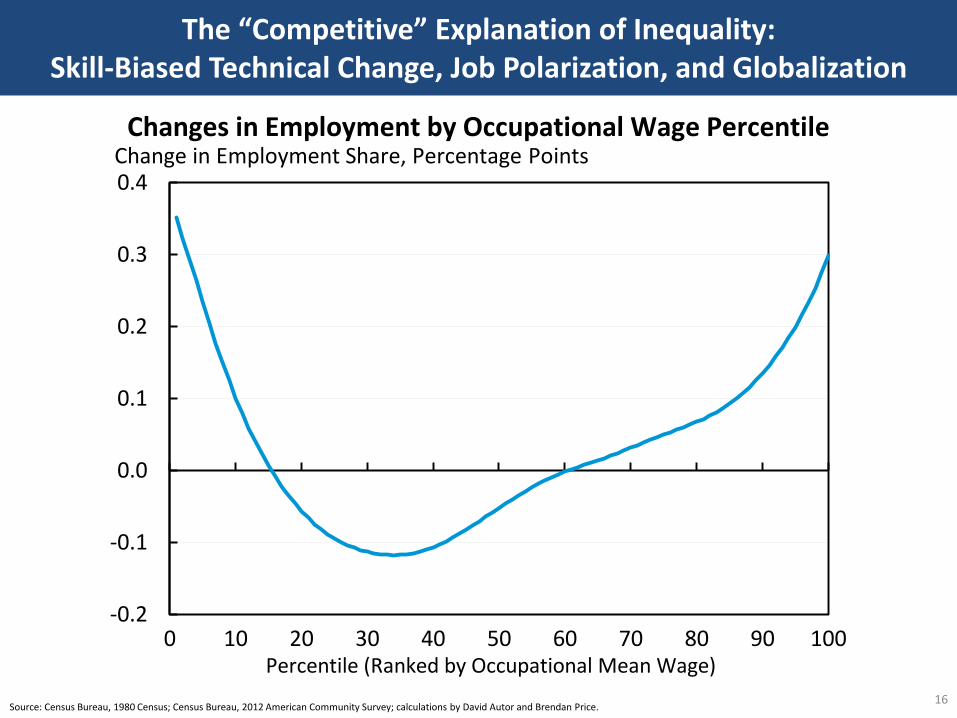
The “Competitive” Explanation of Inequality:Skill-Biased Technical Change, Job Polarization, and Globalization
16
-0.2
-0.1
0.0
0.1
0.2
0.3
0.4
0 10 20 30 40 50 60 70 80 90 100Percentile (Ranked by Occupational Mean Wage)
Changes in Employment by Occupational Wage PercentileChange in Employment Share, Percentage Points
Source: Census Bureau, 1980 Census; Census Bureau, 2012 American Community Survey; calculations by David Autor and Brendan Price.
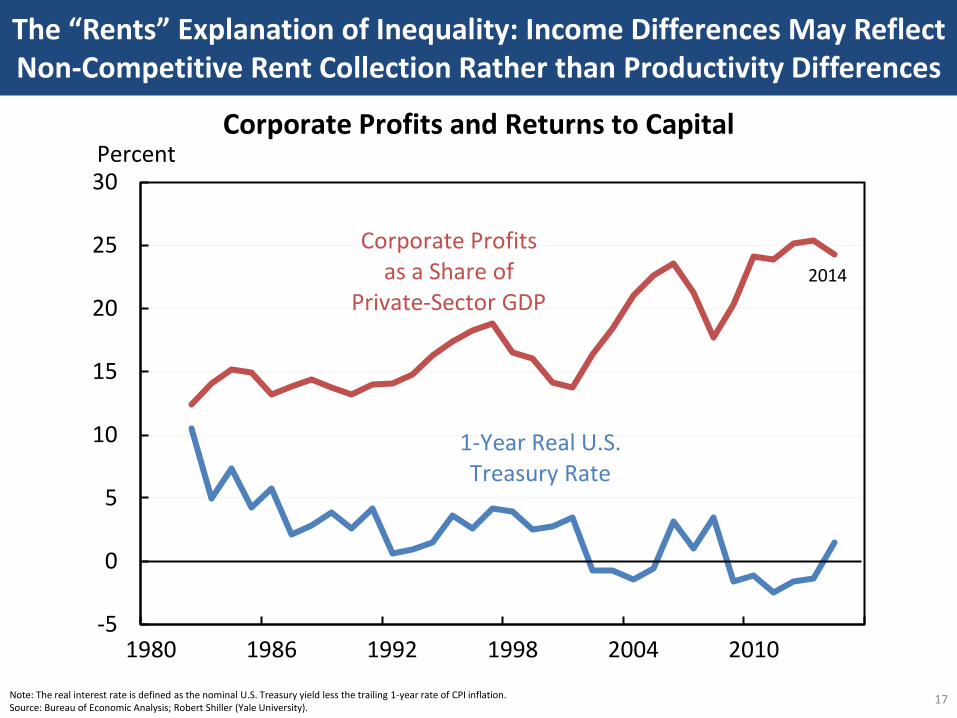
The “Rents” Explanation of Inequality: Income Differences May Reflect Non-Competitive Rent Collection Rather than Productivity Differences
17
1-Year Real U.S. Treasury Rate
Corporate Profits as a Share of
Private-Sector GDP2014
-5
0
5
10
15
20
25
30
1980 1986 1992 1998 2004 2010
Corporate Profits and Returns to CapitalPercent
Source: Bureau of Economic Analysis; Bloomberg Professional Service.Note: The real U.S. Treasury rate is defined as the nominal rate less CPI inflation.
Note: The real interest rate is defined as the nominal U.S. Treasury yield less the trailing 1-year rate of CPI inflation.Source: Bureau of Economic Analysis; Robert Shiller (Yale University).

The “Rents” Explanation of Inequality: Income Differences May Reflect Non-Competitive Rent Collection Rather than Productivity Differences
18
IndustryPercentage Point Change in Revenue Share Earned
by 50 Largest Firms, 1997-2007
Transportation and Warehousing 12.0
Retail Trade 7.6
Finance and Insurance 7.4
Real Estate Rental and Leasing 6.6
Utilities 5.6
Wholesale Trade 4.6
Educational Services 2.7
Accommodation and Food Services 2.6
Professional, Scientific and Technical Services 2.1
Administrative/Support 0.9
Other Services, Non-Public Admin -1.5
Arts, Entertainment and Recreation -2.3
Health Care and Social Assistance -3.7
Source: Census Bureau, Concentration Ratios.

The “Rents” Explanation of Inequality: Declining Union Membership May be Driven by and May Contribute to Rent-Seeking Behavior
19Note: Total employment from 1901 to 1947 is derived from estimates in Weir (1992). For 1948 to 2014, employment data are annual averages from the monthly Current Population Survey.Source: Troy and Sheflin (1985); Bureau of Labor Statistics, Current Population Survey; Weir (1992); CEA calculations.
Troy and Sheflin (1985) CPS:
Membership
2014
0
10
20
30
40
50
60
1917 1937 1957 1977 1997 2017
Union Membership as Share of Total Employment and Share of Income Accruing Top 10 Percent of Income Distrubtion
Percent
Top 10 Percent Share of Income
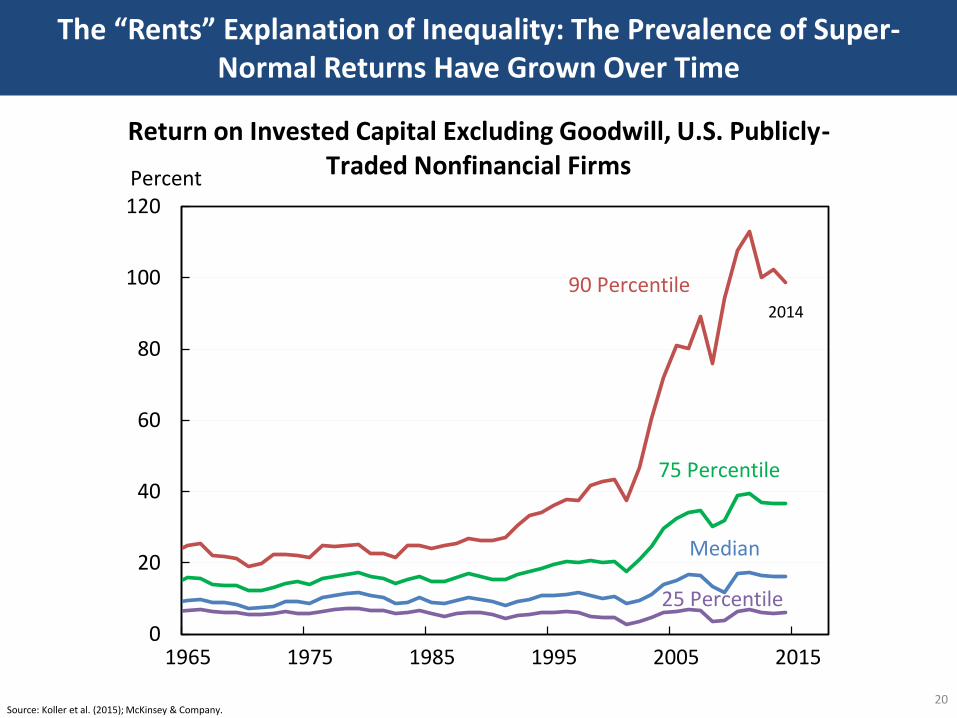
The “Rents” Explanation of Inequality: The Prevalence of Super-Normal Returns Have Grown Over Time
20Source: Koller et al. (2015); McKinsey & Company.
Median
90 Percentile2014
75 Percentile
25 Percentile
0
20
40
60
80
100
120
1965 1975 1985 1995 2005 2015
Return on Invested Capital Excluding Goodwill, U.S. Publicly-Traded Nonfinancial FirmsPercent

25th Percentile
50th Percentile
90th Percentile
Top Percentile
-0.25
0
0.25
0.5
0.75
1978 1983 1988 1993 1998 2003 2008 2013
Individual/Firm: Change in Wage Structure Since 1982Change in Log Real Annual Wage
2012
25th Percentile
50th Percentile
90th Percentile
Top Percentile
2012
-0.25
0
0.25
0.5
0.75
1978 1983 1988 1993 1998 2003 2008 2013
Firms: Change in Wage Structure Since 1982Change in Log Real Annual Wage
The “Rents” Explanation of Inequality: Virtually All of the Rise in Wage Inequality is Due to Inter-Firm as Opposed to Intra-Firm Dispersion
21Source: Song et al. (2015).

The Third Challenge: Labor Market FluidityWorker Flows have been Declining Since the 1990s
22Source: Hyatt and Spletzer (2013); Bureau of Labor Statistics, Current Population Survey; Bureau of Labor Statistics, Job Openings and Labor Turnover Survey; Census Bureau, Longitudinal Employer-Household Dynamics.
CPS Hires
JOLTS Hires
0
5
10
15
20
25
30
35
1995 1997 1999 2001 2003 2005 2007 2009 2011 2013
Trends in Hires and Separations, 1995-2012
2012:Q3
Percent of Total Employment
LEHD Hires

Worker Flows have been Declining Since the 1990s
23Source: Molloy, Smith, and Wozniak (2014).
Occupation Change
Industry Change
Employer Change
2013
0
2
4
6
8
10
12
14
1980 1985 1990 1995 2000 2005 2010 2015
Percent of Total Population Age 16+Employer, Occupation, and Industry Transitions

Worker Flows have been Declining Since the 1990s
24
Number Who
Found a Job
Dec-15
Number Who
Exited Job
2.3
2.4
2.5
2.6
2.7
2.8
1991 1996 2001 2006 2011 2016
Share of Population Finding and Exiting Jobs per MonthPercent
Note: Shading denotes recession.Source: Bureau of Labor Statistics; CEA calculations.

Business Entry Rates Have Also Declined
25Source: Census Bureau, Business Dynamics Statistics; CEA calculations.
Firms
7
9
11
13
15
1975 1980 1985 1990 1995 2000 2005 2010
Firm Entry Rate, 1978-2013Percent of Total Firms
2013

Benefits from Job Switching Have Declined
26
Wage and Earnings Gains Associated with Job Switching
Data
Source Age
Group Time Period Gain to Switching
Jobs
Topel and Ward (1992) LEED 18 to 34 1957:Q1 - 1972:Q4
9%
Molloy, Smith, and Wozniak (2014)
PSID 22 to 29
1983-1994 4%
1995-2001 10%
2003-2011 2%
NLSY 22 to 29
1966-1981 7%
1979-1994 3%
2002-2011 4%
Fallick, Haltiwanger, and McEntarfer (2012)
LEHD 25 to 55
1995:Q2 8%
1999:Q2 14%
2001:Q2 6%
Note: Topel and Ward (1992) and Molloy, Smith, and Wozniak (2014) are wage regression models, while Fallick, Haltiwanger, and McEntarfer (2012) use sample earnings medians from job switchers. All regression estimates are statistically significant, except for the Molloy, Smith, and Wozniak (2014) estimates from the 2000s.

-25.0
-20.0
-15.0
-10.0
-5.0
0.0
All Under Age 35 Age 35 or Older
Between State
Within State
Difference in Migration Rates of Workersin Most vs. Least Licensed Occupations
Percent Di fference
0
5
10
15
20
25
30
1950s 1960s 1970s 1980s 1990s 2000 2008
Share of Workers with a State Occupational License
Percent of the Workforce
Occupational Licensing Has Grown & Interstate Mobility is Much Lower for Workers in Licensed Occupations
27Source: The Council of State Governments (1952); Greene (1969); Kleiner (1990); Kleiner (2006); Kleiner and Krueger (2013), Westat data; Census Bureau, American Community Survey 2010-2013; CEA Calculations. Number on left chart is calculated from an OLS regression controlling for race, citizenship, sex, citizenship, number of children, marital status, education, income, year, and state. Ages 25 to 65 were included.

Housing Supply Constraints Slow Income Convergence
28Source: Ganong and Shoag (2015); CEA calculations.
0.0
0.4
0.8
1.2
1.6
2.0
2.4
2.8
1960-69 1970-79 1980-89 1990-99 2000-10
Less ConstrainedSupply
More ConstrainedSupply
Speed of Income Convergence Across States by Housing SupplyAverage Percent of Income Gap Closed Each Year
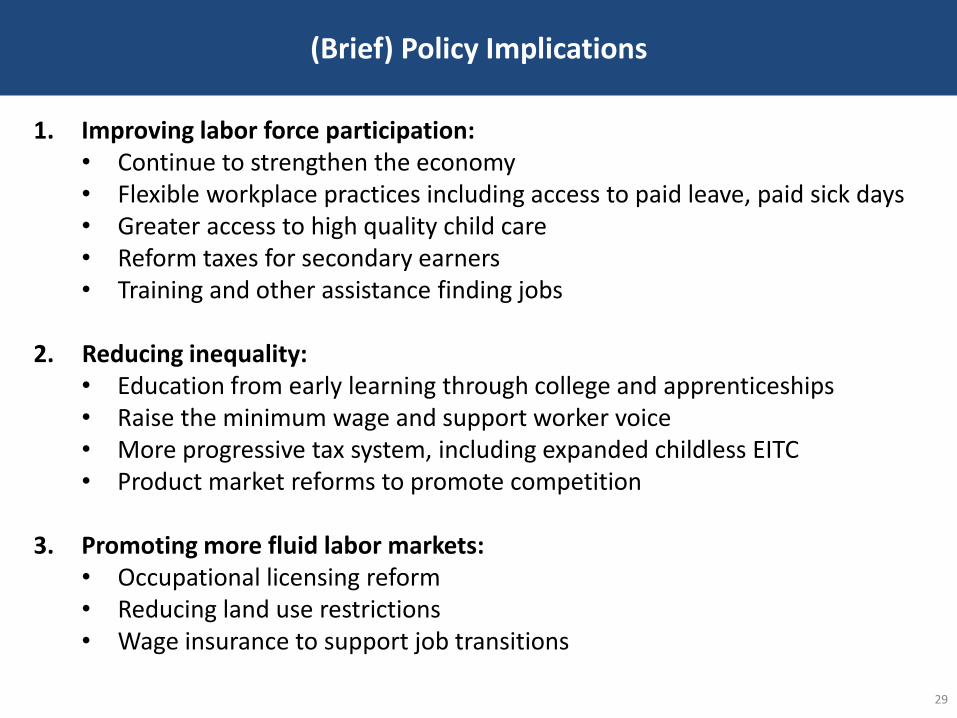
(Brief) Policy Implications
29
1. Improving labor force participation:• Continue to strengthen the economy• Flexible workplace practices including access to paid leave, paid sick days• Greater access to high quality child care• Reform taxes for secondary earners• Training and other assistance finding jobs
2. Reducing inequality:• Education from early learning through college and apprenticeships• Raise the minimum wage and support worker voice• More progressive tax system, including expanded childless EITC• Product market reforms to promote competition
3. Promoting more fluid labor markets:• Occupational licensing reform• Reducing land use restrictions• Wage insurance to support job transitions

Three Challenges in the U.S. Labor Market:
Participation, Inequality, and Fluidity
Jason FurmanChairman, Council of Economic Advisers
World Bank GroupJanuary 28, 2016