This is your reminder that block paragraphs are useddownloads.transportation.org/Pavement_Handbook/8...
35
Handbook for Pavement Design, Construction and Management Pavement Evaluation 8. PAVEMENT EVALUATION Pavement evaluation is a process by which field surveys and testing are carried out to characterize the condition of an existing pavement structure, both structurally and functionally. The structural condition of a pavement refers to its ability to support the current and future traffic loadings, whereas the functional condition refers to its ability to provide a safe, smooth, and quiet riding surface for the traveling public. There are several different approaches to conducting a pavement evaluation, distinguished by the extent of the assessment, the level of the detail collected, and the assessment tools used. At the most detailed level, for example, a project-level investigation is conducted on a single pavement section. A project-level investigation may be conducted as a forensic study to explore the causes and possible solutions to specific performance problems or it may be conducted to obtain the inputs needed to design an appropriate rehabilitation strategy on a pavement that has already been triggered for capital improvement. In either case, project-level evaluations are typically quite detailed and exhaustive, and may use many different destructive and nondestructive testing tools. In contrast to the project-level approach, pavement evaluations may also be carried out at the network level. Network-level evaluations are conducted on pavement sections within the network of pavements for which the agency is responsible, with the general purpose to document current conditions, to identify projects for maintenance, preservation and rehabilitation, to help prioritize projects and allocate budgets, and to help determine funding needs. In addition, the collection of performance data on a pavement network over time provides a valuable tool for tracking pavement performance as well as a mechanism for developing performance models that can be used to predict future conditions (both with and without the application of treatments). Regardless of whether a project-level or network-level evaluation is being conducted, the available resources often drives what 8-1
Transcript of This is your reminder that block paragraphs are useddownloads.transportation.org/Pavement_Handbook/8...
Handbook for Pavement Design, Construction and Management Pavement Evaluation
8. PAVEMENT EVALUATION
Pavement evaluation is a process by which field surveys and testing are carried out to characterize the condition of an existing pavement structure, both structurally and functionally. The structural condition of a pavement refers to its ability to support the current and future traffic loadings, whereas the functional condition refers to its ability to provide a safe, smooth, and quiet riding surface for the traveling public.
There are several different approaches to conducting a pavement evaluation, distinguished by the extent of the assessment, the level of the detail collected, and the assessment tools used. At the most detailed level, for example, a project-level investigation is conducted on a single pavement section. A project-level investigation may be conducted as a forensic study to explore the causes and possible solutions to specific performance problems or it may be conducted to obtain the inputs needed to design an appropriate rehabilitation strategy on a pavement that has already been triggered for capital improvement. In either case, project-level evaluations are typically quite detailed and exhaustive, and may use many different destructive and nondestructive testing tools.
In contrast to the project-level approach, pavement evaluations may also be carried out at the network level. Network-level evaluations are conducted on pavement sections within the network of pavements for which the agency is responsible, with the general purpose to document current conditions, to identify projects for maintenance, preservation and rehabilitation, to help prioritize projects and allocate budgets, and to help determine funding needs. In addition, the collection of performance data on a pavement network over time provides a valuable tool for tracking pavement performance as well as a mechanism for developing performance models that can be used to predict future conditions (both with and without the application of treatments).
Regardless of whether a project-level or network-level evaluation is being conducted, the available resources often drives what activities can be conducted. On project-level evaluations, the size and relative “importance” of a project often dictates the amount of time and funds that can justifiably be spent on pavement evaluation. On network-level evaluations, agencies must recognize what data can be regularly collected so that the pavement management system is kept up to date and the data reflect actual conditions. Thus, an important part of the pavement evaluation process should be the identification of the exact information needed to support the goals and objectives of the pavement evaluation itself.
One approach to determining the types of data needed to support agency decisions is through consideration of different levels of agency data use or need. In the World Bank’s Data Collection Technologies for Road Management (Bennett et al. 2007), this concept is covered through a discussion of Information Quality Levels (IQLs) and the relationship between the amount of data collected and the types of decisions being made; this process is described as follows:
IQL-1 represents fundamental, research, laboratory, theoretical, or electronic data types, where numerous attributes may be measured or identified.
IQL-2 represents a level of detail typical of many engineering analyses for a project-level decision.
8-1

Handbook for Pavement Design, Construction and Management Pavement Evaluation
IQL-3 is a simpler level of detail, typically two or three attributes, which might be used for large production uses like network-level surveys or where simpler data collection methods are appropriate.
IQL-4 is a summary or a key attribute which has use in planning, senior management reports, or in low effort data collection.
IQL-5 represents top level data such as key performance indicators, which typically might combine key attributes from several pieces of information. Still higher levels can be defined as necessary.
Pavement DistressPavement distress is any visible defect or form of deterioration on the surface of a pavement, and is the most basic measure of the performance of an existing pavement. In order to fully describe pavement distress, the following three factors must be considered:
Type—The type of distress is determined primarily by similar mechanisms of occurrence and appearance. By identifying the types of distress, a great deal of information can be inferred regarding the underlying causes of deterioration.
Severity—The severity of distress represents the criticality of the distress in terms of progression; more severe distresses will require more extreme rehabilitation measures.
Amount—The quantity of each type and severity level must be measured and expressed in convenient terms.
At very low levels of occurrence or severity, pavement distress can have little, if any, effect on the ability of the pavement to carry traffic in a safe and efficient manner. However, at higher levels of distress, the overall rideability and structural capacity of the pavement, and perhaps even its safety, can be severely compromised.
To be consistent in how the distress type, severity, and extent are determined during a distress survey, distress measurement protocols need to be adopted by the agency conducting the surveys. In recent years, significant progress has been made in the standardization of distress identification in the form of distress identification manuals. For example, the Federal Highway Administrations (FHWA) Distress Identification Manual for the Long-Term Pavement Performance Program (Miller and Bellinger 2003) was first published in the late 1980s in support of the Strategic Highway Research Program’s Long-Term Pavement Performance (LTPP) project. It was developed as a tool to help researchers around the country collect pavement performance data in a consistent, repeatable manner that was independent of the collector and perhaps even of the collection method, although it was aimed at the manual survey methodology. An intended side benefit was that “the manual will improve communications within the pavement community by fostering more uniform and consistent definitions of pavement distress.” Each distress type is defined in the manual and illustrated both with graphics and photographs; most distresses are subdivided into low, moderate, and high severity levels. Table 8-1 shows the organization of the content of this manual by surface type and distress type.
A second example of a pavement distress identification manual is published as a standard by the American Society for Testing and Materials (ASTM) under ASTM D6433, Standard Practice for Roads and Parking Lots Pavement Condition Index Surveys. The distresses defined in this
8-2

Handbook for Pavement Design, Construction and Management Pavement Evaluation
ASTM standard are a part of a standardized pavement assessment process that results in the calculation of a Pavement Condition Index (PCI), a rating on a scale of 0 to 100 that is widely used by the U.S. Corps of Engineers, the Department of Defense, and various local agencies to quantify pavement conditions. For evaluation purposes, PCI distresses are categorized by pavement type (asphalt pavements and jointed concrete pavements) and rated by severity (low, medium, and high). PCI distresses are summarized in Table 8-2.
Table 8-1. Pavement distresses (after Miller and Bellinger 2003).
Asphalt Concrete Surfaces Jointed Portland Cement Concrete Surfaces
Continuously Reinforced Concrete Surfaces
Cracking Fatigue cracking Block cracking Edge cracking Longitudinal cracking Reflection cracking at joints Transverse cracking
Patching and Potholes Patch/patch deterioration Potholes
Surface Deformation Rutting Shoving
Surface Defects Bleeding Polished aggregate Raveling
Miscellaneous Distresses Lane-to-shoulder dropoff Water bleeding and
pumping
Cracking Corner breaks Durability cracking (“D”
cracking) Longitudinal cracking Transverse cracking
Joint Deficiencies Joint seal damage
- Transverse joint seal damage
- Longitudinal joint seal damage
Spalling of longitudinal joints
Spalling of transverse joints
Surface Defects Map cracking and scaling
- Map cracking- Scaling
Polished aggregate Popouts
Miscellaneous Distresses Blowups Faulting of transverse joints
and cracks Lane-to-shoulder dropoff Lane-to-shoulder separation Patch/patch deterioration Water bleeding and
pumping
Cracking Durability cracking (“D”
cracking) Longitudinal cracking Transverse cracking
Surface Defects Map cracking and scaling
- Map cracking- Scaling
Polished aggregate Popouts
Miscellaneous Distresses Blowups Transverse construction
joint deterioration Lane-to-shoulder dropoff Lane-to-shoulder separation Patch/patch deterioration Punchouts Spalling of longitudinal
joints Water bleeding and
pumping Longitudinal joint seal
damage
8-3

Handbook for Pavement Design, Construction and Management Pavement Evaluation
Table 8-2. Pavement distresses identified for PCI (ASTM 2007).
Distress in Asphalt Pavements Distress in Jointed Concrete Pavements
Alligator cracking (fatigue) Bleeding Block cracking Bumps and sags Corrugation Depression Edge cracking Joint reflection cracking Lane/shoulder drop-off Longitudinal and transverse cracking Patching and utility cut patching Polished aggregate Potholes Railroad crossing Rutting Shoving Slippage cracking Swell Weathering and raveling Ride quality, a separate “distress,” is
actually an input in determining the severity level of bumps, corrugation, railroad crossings, shoving, and swells
Blowup/buckling Corner break Divided slab Durability (“D”) cracking Faulting Joint seal damage Lane/shoulder drop-off Linear cracking (longitudinal, transverse,
and diagonal cracks) Large patching (more than 5.5 ft2) and
utility cuts Small patching (less than 5.5 ft2) Polished aggregate Popouts Pumping Punchout Railroad crossing Shrinkage cracks Scaling, map cracking, and crazing Corner spalling Joint spalling Ride quality is an input in determining
the severity level of blowup/buckling and railroad crossings
In addition to the FHWA and ASTM descriptions of distress, many highway agencies have developed their own distress identification manuals either as a stand-alone reference or to use in conjunction with the FHWA’s manual.
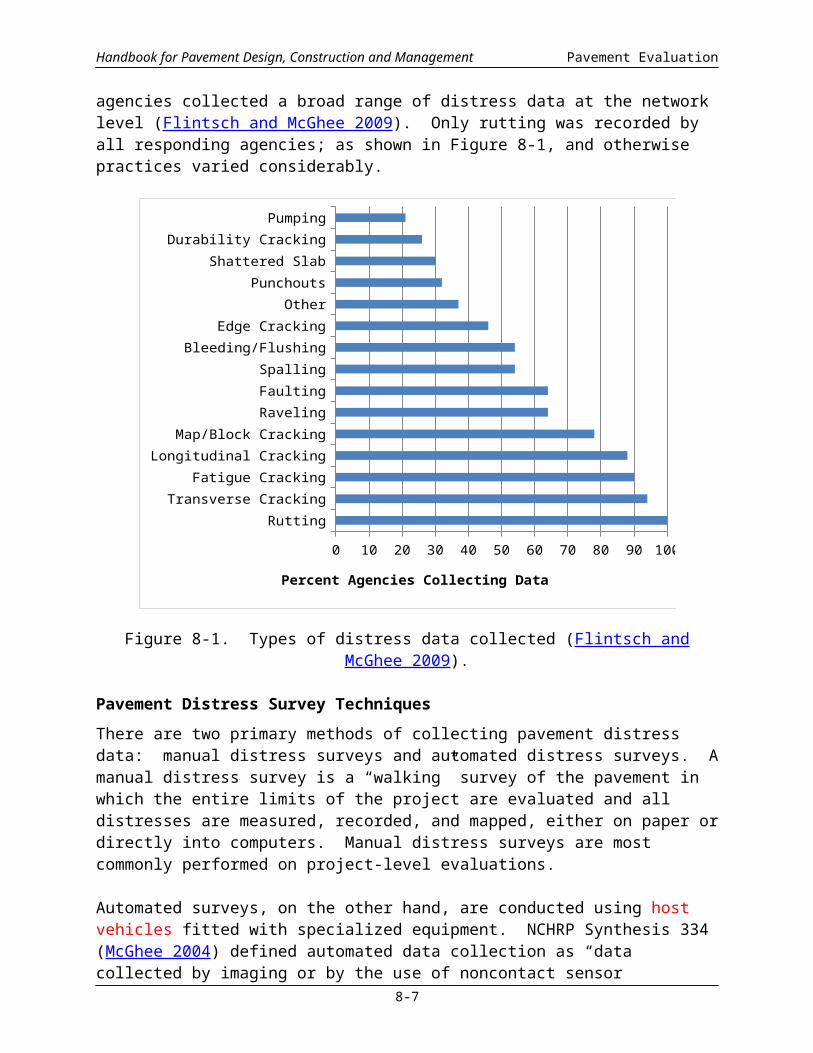
There is no universally used or correct approach to data collection. In a recent survey of agency practice, respondents from 46 States and 9 Canadian provinces indicated that their agencies collected a broad range of distress data at the network level (Flintsch and McGhee 2009). Only rutting was recorded by all responding agencies; as shown in Figure 8-1, and otherwise practices varied considerably.
8-4

Handbook for Pavement Design, Construction and Management Pavement Evaluation
Rutting
Transverse Cracking
Fatigue Cracking
Longitudinal Cracking
Map/Block Cracking
Raveling
Faulting
Spalling
Bleeding/Flushing
Edge Cracking
Other
Punchouts
Shattered Slab
Durability Cracking
Pumping
0 10 20 30 40 50 60 70 80 90 100
Percent Agencies Collecting Data
Figure 8-1. Types of distress data collected (Flintsch and McGhee 2009).
Pavement Distress Survey TechniquesThere are two primary methods of collecting pavement distress data: manual distress surveys and automated distress surveys. A manual distress survey is a “walking” survey of the pavement in which the entire limits of the project are evaluated and all distresses are measured, recorded, and mapped, either on paper or directly into computers. Manual distress surveys are most commonly performed on project-level evaluations.
Automated surveys, on the other hand, are conducted using host vehicles fitted with specialized equipment. NCHRP Synthesis 334 (McGhee 2004) defined automated data collection as “data collected by imaging or by the use of noncontact sensor equipment.” Data collected using automated equipment must be processed to convert it into a usable format. Each agency generally specifies the format in which automated data will be processed. The processing is done using either automated or semi-automated methods. Automated data processing uses computers to interpret, reduce, and/or analyze the data collected in the field without human intervention. Data collected using noncontact sensors is almost always processed automatically because of the volume of the data collected. Distress images may be processed automatically using computer algorithms that use digital recognition software that recognizes and quantifies differences in the grayscale that relate to striations on the pavement surface (McGhee 2004). Data processed in this manner is typically referred to as “fully automated” data collection and processing. Alternatively, the data may be processed at a work station where a human views the images to identify distress information. This approach is referred to as “semi-automated” data collection and processing because it makes use of both automated and manual techniques.
8-5

Handbook for Pavement Design, Construction and Management Pavement Evaluation
Manual surveys rely on raters who identify the distress type, severity, and extent as part of the survey process. This can be a very resource intensive way to collect pavement distress information, but provides a repeatable method of conducting surveys, which is why it was chosen by the FHWA for its research activities. Because of the objectivity of this type of procedure, reasonable estimates of maintenance work requirements can be produced from the results.
Because of the resource requirements associated with survey procedures that require raters to measure distress quantities, for network-level surveys a number of agencies have instead elected to use survey procedures in which the extent of distress is estimated rather than measured. This simplifies the rating procedure considerably, which translates into a process that is less labor intensive. However, there is more subjectivity involved in estimating distress quantities and so unless the raters are well trained, there is the possibility that the results will have more variability than if distress quantities had been measured.
At the network level, issues of data quantity and quality are important. Data quantity, in terms of what and how much is measured, has associated implications of time and cost. Generally, the greater the volume of data collected, or the more detailed the data, the higher the cost of data collection. At the same time, better decisions are expected to result from having more, or more detailed, data available for analysis. As such, there is a trade-off between collecting all of the condition data that might ever be needed to assist in making effective network decisions and collecting enough data to make good decisions, and this trade-off is in large part governed by agency needs and the associated resources.
Manual Surveys
Most project-level surveys employ manual survey procedures, although some agencies may use manual surveys for some network-level surveys. A summary of some of the primary advantages and disadvantages associated with manual surveys are presented in Table 8-3. Since manual surveys include those in which survey personnel walk each pavement section, very detailed distress type, severity, and quantity information can be obtained. The surveys can be relatively subjective, which are easy to conduct, or they can be objective, in which case distress quantities are usually measured to improve accuracy. Manual surveys do not require any specialized equipment and they provide a means of including assets outside the mainline of the roadway, such as culverts, guardrail, or signs. However, because manual surveys are generally conducted at low speeds by two-person crews, they are slow and fairly labor intensive. The slow speeds increase the potential for safety hazards and many agencies have moved towards automated surveys for this reason. Finally, if subjective survey procedures are used there is a high potential for variability in the data unless strong training programs are implemented along with quality control checks as surveys are being conducted.
Table 8-3. Advantages and disadvantages of manual surveys (AASHTO 2006) Used by permission.
Advantages Disadvantages
Detailed distress information can be collected
Fairly simple to conduct No capital expenditures required
Resource intensive High safety risk Slow Potential for high variability in the data
8-6
Handbook for Pavement Design, Construction and Management Pavement Evaluation
Can survey appurtenances that are not viewable from the mainline (e.g. culverts)
without strong training programs and quality control checks
8-7
Handbook for Pavement Design, Construction and Management Pavement Evaluation
Automated Surveys
Many agencies elect to collect pavement condition data using automated equipment using noncontact sensors (e.g., roughness, rutting, and faulting), especially for network-level assessments. As technology for this type of data collection activity advanced in conjunction with improvements in digital images, equipment vendors began outfitting host vehicles with cameras, which would allow them to capture pavement images as well as sensor data. Many agencies began using this type of equipment to reduce the potential safety hazards associated with manual survey procedures. Today, automated data collection equipment is available with fully integrated systems that enable a variety of data to be collected in a single pass of a survey vehicle. In addition to pavement condition information, these vehicles can also obtain right-of way and pavement images, grade and cross-slope information, global positioning system (GPS) coordinates, and 3-D images using Light Detecting and Ranging (LIDAR) technology. As technology continues to improve, it is inevitable that the types of data that can be collected, the speed at which it is collected and processed, and the accuracy of the data will continue to evolve.
The accuracy and reliability of the image-based distress data from automated surveys is dependent on the quality of the images obtained in the field. Therefore, recent enhancements to equipment have focused on improving camera resolution and eliminating the distortions associated with lighting and shadows. Another component of the accuracy and reliability of the image based distress survey is the dependence on robust crack detection and quantification algorithms used to convert the images into distresses. Because agencies that utilize this technology often deal with inconsistencies in the data collected with different equipment, especially when manufacturers upgrade equipment to take advantage of new technologies, it is imperative that agencies develop and implement strong quality control/quality assurance procedures to ensure the collection of meaningful data.
A summary of some of the primary advantages and disadvantages associated with automated surveys are presented in Table 8-4. Automated equipment can capture large amounts of information, which lends itself to collecting information about surface profile and texture characteristics. The right-of-way images allow agencies to collect auxiliary information about the road network beyond what is needed for pavement condition surveys. In agencies that are trying to consolidate data collection activities, this is an important consideration and many agencies have benefited from the availability of roadway images for conducting sign inventories, to review project conditions from the central office, and/or to address customer complaints. The data from these vehicles can be collected at near traffic speeds, so data collection can be done quickly without negatively impacting traffic and causing potential safety hazards.
On the other hand, fully automated equipment is expensive and must be updated regularly to take advantage of new technology. Some agencies contract with the manufacturer to collect data, but costs associated with mobilizing the equipment can be expensive and scheduling must be coordinated with the vendor. The equipment utilizes very sophisticated devices, which requires specialized skills to operate. Automated equipment is only appropriate for data that can be seen from the mainline pavement and there are some limitations to its effectiveness in terms of the types of distress information that can be easily interpreted. For instance, it is difficult to rate weathering and raveling and it is a challenge to rate crack severities that rely on the presence of faulting along the crack as a criteria.
8-8

Step 1: Conduct survey
Step 2: Collect, compress, and store image data. Conduct real time processing of
sensor data
Step 3: Store images and other data
collected in the field Step 5: Conduct quality checks and deliver data
Step 4: Conduct image processing
Handbook for Pavement Design, Construction and Management Pavement Evaluation
Table 8-4. Advantages and disadvantages of automated surveys (AASHTO 2006) Used by permission.
Advantages Disadvantages
Lends itself to capturing large quantities of data (e.g., continuous roughness profiles)
Multiple types of data can be collected at the same time
Data can be collected at near traffic speeds
Images are stored and available for other uses
Safer operation by eliminating exposure to traffic
May require a large capital investment or contracting fees
Specialized skills are required to operate equipment and process data
Data must be viewable from the pavement lanes
Some distress characteristics are difficult to capture (e.g. weathering and raveling, presence of faulting along a crack)
Fully Automated and Semi-Automated Data Processing
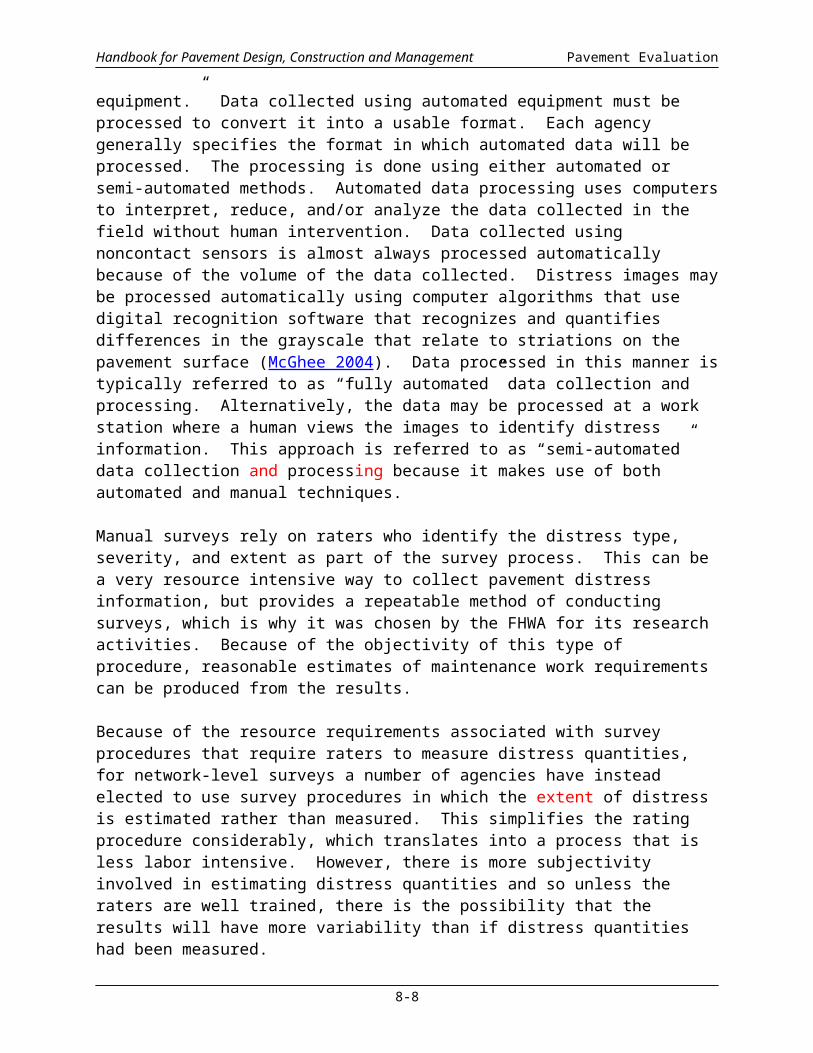
Information collected in the field must be processed so it can be used to report pavement conditions. These activities involve those captured in steps 2, 3, and 4 in Figure 8-1.
Figure 8-1. Steps in data collection and analysis.
8-9

Handbook for Pavement Design, Construction and Management Pavement Evaluation
For the most part, sensor data collected in the field are processed in real-time as it is being collected in the field. The primary products of the sensor data include roughness in terms of International Roughness Index (IRI) (see Surface Characteristics), rut-depth, and faulting measurements. Distress data collected using automated equipment may be processed using either automated or semi-automated methods.
Fully automated methods of distress data processing are typically conducted separately from the data collection activities, although a method of real-time processing has been developed and reported in the literature (Wang et al. 2002). These methods of distress identification require very little human intervention, relying instead on software that can interpret differences in grayscale images to identify cracks and other surface imperfections. Fully automated distress identification methods are very dependent on the quality of the digital images, so image resolution is extremely important. Without high-resolution images, fine, hairline cracks may not be easily detected. Additionally, it is difficult to detect cracks in certain types of pavement surfaces, including chip seals and open-graded friction courses. It is also difficult to develop algorithms for identifying random forms of deterioration (e.g. patching), so most vendors have limited their automated distress interpretation to various forms of cracking.
Because of the limitations associated with fully automated distress identification, some agencies that collect distress images utilize semi-automated processes to quantify distress quantities. As described previously, this approach involves the interaction of a human in the distress identification process. However, rather than having the ratings conducted in the field, they are conducted at a workstation in an office. Therefore, this approach capitalizes on the safety benefits associated with automated surveys and approximates the benefits of a manual survey because a set of eyes is evaluating pavement conditions. Unfortunately, it can be tedious to conduct pavement condition surveys at a workstation for an extended period of time and so data quality can suffer if raters are not provided sufficient breaks.
When processing and analyzing a distress survey at a workstation, several images of the pavement survey are normally viewed at the workstation. The perspective view is provided for identifying the general location and for finding the beginning and end of inspection samples. In addition, downward views of the pavement are provided and it is these images that are used for distress identification. To link images to field locations, images are date, time, and location stamped using GPS data. Most manufacturers have developed programs for conducting pavement condition surveys at a workstation, which allow the rater to point and click on the beginning and end points of a distress and which utilize drop-down boxes and other features for classifying distress type and severity. Most of these software programs are proprietary and specific to the particular manufacturer.
Data Collection Protocols and Standards
In an effort to standardize the many different methods of collecting and analyzing pavement condition data, several national organizations have initiated efforts to develop more uniform terms and methodologies. These organizations recognize the potential benefits associated with consistency in data collection and reporting, including the ability to compare results across agencies and reduce data collection costs. However, because of the historical condition data that many agencies have accumulated using alternate methodologies, some agencies have been hesitant to change their data collection methods. Other agencies have used the existing protocols and standards to some degree, with slight variations to adapt them to local conditions.
8-10

Handbook for Pavement Design, Construction and Management Pavement Evaluation
AASHTO Specifications and Test Methods for Accessing Pavement ConditionThe previously cited FHWA and ASTM documents on distress identification provide useful details on how to identify and rate different types of distress. However, many highway agencies have developed survey procedures that do not follow these methodologies exactly. As a result, there is a great deal of variability in the way distress information is collected and reported.
For much of the past 10 years, AASHTO has been working with an FHWA Expert Task Group on the development and implementation of protocols and standards for pavement data collection. Initially, protocols were developed through an FHWA project, focusing on cracking, roughness, rutting, and faulting (in concrete pavements).
Work on the development of standards continues today, with more of a focus on separating standards for data collection activities with those for the analysis of the data to allow more flexibility and modularity. Today, the following standards have been developed:
AASHTO R 36, Standard Practice for Evaluating Faulting of Concrete Pavements. AASHTO R 43, Standard Practice for Quantifying Roughness of Pavements. AASHTO R 48, Standard Practice for Determining Rut Depth in Pavements. AASHTO R 55, Standard Practice for Quantifying Cracks in Asphalt Pavement
Surfaces. AASHTO PP 67, Standard Practice for Quantifying Cracks in Asphalt Pavement
Surfaces from Collected Images Utilizing Automated Methods. AASHTO PP 68, Standard Practice for Collecting Images of Pavement Surfaces for
Distress Detection. AASHTO PP 69, Standard Practice for Determining Pavement Deformation Parameters
and Cross Slope from Collected Transverse Profiles. AASHTO PP 70, Standard Practice for Collecting the Transverse Pavement Profile.
Originally intended to improve the consistency in measuring and reporting these types of pavement deterioration through standardized process, with the exception of the standard on roughness the overall impact of the provisional protocols on pavement management practices has been marginal. However, with the changes in Highway Performance Monitoring System (HPMS) requirements for the states that began in 2010 and the increased importance of performance measures within highway agencies, it is likely that the importance of consistency in data collection methodologies will increase.
ASTM Specifications and Test Methods for Accessing Pavement ConditionASTM has a Technical Committee on Vehicle-Pavement Systems (E-17) that has been involved in efforts to standardize data collection terminology for many years. In fact, the Committee has 10 Technical Subcommittees with jurisdiction over 65 standards. The relevant technical areas served by this Committee include those listed below:
8-11

Handbook for Pavement Design, Construction and Management Pavement Evaluation
Field methods for measuring tire pavement friction (see also Surface Characteristics). Surface characteristics related to tire pavement slip resistance (see also Surface
Characteristics). Tire and slider characteristics (see also Surface Characteristics). Methods for measuring profile and roughness (see also Surface Characteristics). Methodology for analyzing pavement roughness (see also Surface Characteristics). Pavement testing and evaluation (see also Structural Testing and Analysis). Pavement management and data needs (see also Pavement Management). Measurement and evaluation of pavement-related noise (see also Surface
Characteristics). Vehicle roadside communication. Traffic monitoring.
Sampling for Distress Surveys
Particularly for network-level evaluations, many highway agencies use a sampling approach to evaluate pavement distress conditions as a way to minimize the amount of data collected and to control costs. Very simply, sampling limits the amount of data collected by identifying and inspecting representative areas of pavement that are then used to represent the condition of a larger area. For example, an agency that collects data in the first 500 feet of every mile is using a sampling approach (see Figure 8-2). In this instance, the 500-ft sample is assumed to be representative of the condition of the entire mile. If it is not representative of the entire length, it should not be used for that purpose. Rather, a more representative sample should be identified or a method of accounting for an isolated area with an unusual condition must be developed.
Figure 8-2. Example of a sampling approach.
There are two primary approaches to sampling: sampling as part of a pavement distress survey and the use of sampling as part of an automated condition survey.
Sampling as Part of a Distress SurveySurvey approaches in which distress type, severity, and quantities are reported typically use a sampling approach to reduce resource demands. The PCI procedure is an example of a survey procedure that utilizes a sampling approach.
Since these surveys are being conducted to support network-level decisions, the use of representative samples to characterize the condition of a larger area is assumed to be reasonable. Statistics can be used to determine the number of samples that should be inspected for the data to be truly representative of the area based on the variability between the ratings, the level of confidence desired, and the size of the area. Guidance on determining the number of samples to inspect can be found in the literature (Shahin1994; Schmitt et al. 2006).
8-12
1 mile
500 ft sample

Handbook for Pavement Design, Construction and Management Pavement Evaluation
The PCI procedure requires the calculation of the section area, which is then divided by the size of a sample unit—typically assumed to be 2500 ft2 ± 1000 ft2. Therefore, on a street that is 25 feet wide, a sample unit would be 100 feet long. The number of samples inspected depends on the total size of the section. The total distresses found in the inspected sample units are extrapolated over the remaining area to determine the condition of the section.
Inspection sample units are generally selected at random; however, care should be taken to ensure that they are representative of the condition of the entire section. If not, either a different sample should be selected or a process for considering non-representative samples must be developed. In the PCI procedure referenced earlier, additional (non-random) sample units may be incorporated into the condition survey if the sample represents conditions that are either far better or far worse than the rest of the section. The PCI calculation treats additional sample units differently than randomly selected samples so the distress found in the isolated area are not extrapolated across the entire section.
Sampling as Part of an Automated SurveyAlthough many agencies that utilize automated equipment for conducting pavement condition surveys report that they conduct surveys on 100 percent of their network (implying that no sampling is used), many actually utilize sampling within their procedure. However, instead of identifying sample units as described earlier, these agencies collect data on a limited number of lanes to reduce their data collection costs. Most commonly, agencies collect pavement condition data on a single pavement lane on undivided highways and a single lane in each direction on divided highways. Since all pavements being maintained by the agency are not being inspected, this is a form of sampling. Note that AASHTO PP 67 and PP 68 recommend 100% sampling.
Network-Level Survey FrequencyIn 2004, a survey of practices in state highway agencies found that network-level pavement condition data are collected on 1-, 2-, or 3-year intervals, depending on the type of facility and type of data collected (McGhee 2004). In general, the study found that data that are fairly easy to collect (e.g., roughness) or data needed for national monitoring (e.g., HPMS data) tend to be collected more frequently than other data. The HPMS reporting requirements generally drive the data collection requirements for the National Highway System (NHS), and data on the rest of the network may be collected on the same frequency or a different frequency. Agencies on a 2-year cycle may inspect half of the road network each year, or the entire network each year with a year off between cycles. A similar approach may be used with a 3-year cycle, except that one third of the network may be inspected each year or three years may pass before inspection cycles.
Field Sampling and TestingAs part of the pavement evaluation process, it is often necessary to perform specific field testing in conjunction with pavement distress surveys. This field testing is intended to augment the distress data and is more commonly done on project-level evaluations; however, a few agencies may include a lower level of field testing as part of their network-level evaluations (e.g., a few agencies collect deflection data on their network). Among the field sampling and testing activities are:
Coring. Subsurface sampling.
8-13

Handbook for Pavement Design, Construction and Management Pavement Evaluation
Trenching. Deflection testing. Other nondestructive testing methods.
The primary purposes of these field testing activities are to help observe subsurface pavement conditions, verify pavement layer types and thicknesses, retrieve samples for later laboratory testing and analyses, and document existing material properties and pavement responses. Many different field and laboratory tests are available to determine the subgrade and paving material properties, especially those that are linked to pavement performance. The types and amount of material sampling and testing is primarily dependent upon the following factors:
Observed pavement distress . The type, severity, extent, and variation of visible distress on a pavement greatly affect the locations and amount of field sampling and testing. If the distress is uniformly spread over the project, sampling is most likely conducted in a random (objective) manner. Otherwise, sampling can be targeted in areas of high distress concentrations.
Variability . The variability along the project site will affect the amount of material and sampling required. Projects with greater variability in material properties will require a greater amount of testing in order that this variability can be properly characterized and accounted for.
Traffic volume . The locations and number of allowable samples may be limited on higher trafficked roadways due to worker and driver safety concerns. Such lane closure restrictions and safety related issues are typically not an issue on roadways with lower traffic volumes.
Economics . Most agencies have a limited budget that determines the types and amount of sampling and testing that can be conducted for a given project. Engineering judgment must be used to determine a sampling and testing plan that minimizes the amount of testing required to adequately assess a pavement’s condition, while staying within the provided budget constraints.
Coring
By far, the most common field sampling method is coring, which is the process of cutting cylindrical material samples (cores) from an in-place pavement. Coring is accomplished with the use of a hollow, cylindrical, diamond-tipped core barrel attached to a rotary core drill. The drill is anchored (either to the pavement or to a coring rig) and held perpendicular to the pavement surface while the rotating core barrel is used to slowly cut into the pavement surface. Cores are drilled and retrieved from the pavement and tested in accordance with:
ASTM D5361, Standard Practice for Sampling Compacted Bituminous Mixtures for Laboratory Testing.
ASTM C42, Standard Method for Obtaining and Testing Drilled Cores and Sawed Beams of Concrete.
ASTM C823, Standard Practice for Examination and Sampling of Hardened Concrete in Construction.
AASHTO T 24, Standard Method of Test for Obtaining and Testing Drilled Cores and Sawed Beams of Concrete.
AASHTO T 148, Standard Method of Test for Measuring Length of Drilled Concrete Cores.
8-14

Handbook for Pavement Design, Construction and Management Pavement Evaluation
Coring is most often used to determine/verify layer types and thicknesses. A visual inspection of retrieved cores can also provide valuable information when trying to assess the causes of visual distress or poor pavement performance. Cores are particularly useful at identifying material consistency problems such as honeycombing in concrete and stripping in asphalt layers.
Cores are commonly cut with diameters of 2-, 4-, or 6-in., the selection of which depends on the purpose. If thickness verification is all that is needed, 2-in. diameter cores are sufficient. For asphalt pavements, 6-in. cores are specified for density testing. However, concrete pavement compressive strength testing is most commonly conducted on 4-in. diameter cores; while a 6-in. diameter core is recommended when the maximum aggregate size is greater than 1.5 in.
Subsurface Sampling
Because subsurface conditions can directly affect the performance characteristics that are observed and/or measured at the pavement surface, it is often helpful to obtain subsurface samples of the base, subbase, or subgrade to help determine their properties and conditions. This is conveniently done as part of the coring process as subsurface samples of the base, subbase, and subgrade soil can be retrieved from the core holes. Among the series of laboratory tests that can be performed on the collected material samples are:
Atterberg limits. Gradation. Moisture content and density. Various mixture and volumetric tests on hot-mix asphalt. Various material and petrographic tests on portland cement concrete. Various strength and strength-related measures (e.g., California Bearing Ratio, R-value,
triaxial strength testing, resilient modulus, elastic modulus, dynamic modulus, unconfined compressive strength, split tensile).
In addition to the retrieval of samples for laboratory testing, other specialized testing may also be conducted at core hole locations, such as split-spoon (split-barrel) sampling, Shelby (push) tubes, and dynamic cone penetrometer (DCP). The DCP is a device for measuring the in situ strength of paving materials and subgrade soils. The principle behind the DCP is that a direct correlation exists between the “strength” of a soil and its resistance to penetration by solid objects (Newcomb and Birgisson 1999). In the last decade, the DCP has gained widespread popularity, largely because it is fast, easy to use, and provides reliable estimates of CBR (Laguros and Miller 1997).
The DCP consists of a cone attached to a rod that is driven into the soil by the means of a drop hammer that slides along the penetrometer shaft (Newcomb and Birgisson 1999). The test is performed by driving the cone into the pavement/subgrade by raising and dropping the 16.7 lb hammer from a fixed height of 22.6 in. Earlier versions of the DCP used a 30º cone angle with a diameter of 0.8 in. (Newcomb and Birgisson 1999). More recent versions of the DCP use a 60º cone angle and also have the option of using a 10 lb hammer for weaker soils (Newcomb and Birgisson 1999).
Automated DCPs are have been developed in which the hammer is picked up and dropped automatically. Research results have indicated that CBR values computed using automated DCP results (obtained using the Israeli automated DCP) are about 15 percent greater than CBR values
8-15

Handbook for Pavement Design, Construction and Management Pavement Evaluation
computed using DPI from the manual DCP (Newcomb and Birgisson 1999). The following manuals are available for the operation and interpretation of results for the DCP:
Measurement of Road Pavement Strength by Dynamic Cone Penetrometer (Done and Samuel 2004).
User Guide to the Dynamic Cone Penetrometer (MnDOT n.d.).
Trenching
Occasionally, digging a trench or test pit in a pavement (more commonly an asphalt pavement structure) will be performed to gain a better understanding of the subsurface conditions. In particular, layer history and behavior and layer displacement is more readily apparent in a trench or test pit. Moreover, trenching can be used to determine the in-place unit weight of compacted materials, such as in road fills in accordance with ASTM D5030, Standard Test Method for Density of Soil and Rock in Place by the Water Replacement Method in a Test Pit. Typically, trenching is done during installation of utilities and other appurtenances; however, for certain geotechnical investigations, it may be necessary to provide an excavation large enough to accommodate an inspector sampling subsurface materials in situ and observation of slope stability or groundwater conditions, recovery of large undisturbed samples, installation of instrumentation, or evaluation of abnormalities.
Deflection Testing
Pavement deflection testing measures the response of the pavement to a load in terms of the resultant pavement deflection. This type of testing does not disturb the underlying pavement structure and is a quick and easy way to assess the structural condition of an in-service pavement in a nondestructive manner.
The results of pavement deflection testing can provide valuable information on the properties of the materials in the in-service pavement. For asphalt pavements, the elastic modulus (E) of the individual paving layers can be determined, along with the resilient modulus (MR) of the subgrade by backcalculation to find the material properties that will produce a deflection basin that most closely matches the FWD basin. For concrete pavements, the elastic modulus (E) of the slab and the modulus of subgrade reaction (k or k-value) can be determined. In addition, deflection testing conducted on concrete pavements can be used to estimate the load transfer efficiency across joints or cracks as well as for the identification of loss of support at slab corners.
Although most commonly conducted for project-level testing (and primarily to assist in the development of overlay designs), some highway agencies have incorporated falling weight deflectometer (FWD) testing as part of their network-level pavement evaluations. For example, an Indiana Department of Transportation research study found that collecting three deflection tests per mile in the driving lane (in one direction) would allow 100 percent coverage of the network over a 5-year period (Noureldin et al. 2005). The information was proposed to be used as part of the Department’s pavement management system to supplement the pavement surface condition already being collected with estimates of pavement structural characteristics.
Over the years, a number of different testing devices have been used to obtain pavement deflection measurements, and currently impulse load testing using the FWD has become the accepted world-wide standard. The FWD imparts a dynamic load to a pavement structure that is
8-16

Handbook for Pavement Design, Construction and Management Pavement Evaluation
similar in magnitude and duration to that of a moving wheel load by dropping a set of weights onto a circular load plate. A range of load magnitudes can be achieved by varying the number of weights used and the heights from which they are dropped. The actual load magnitude is measured using a load cell within the load plate, and the resulting deflections are measured by transducers located at the center of the load plate and at preset distances away from the load plate. This is illustrated in the schematic provided as Figure 8-4. Both the maximum surface deflection under the load and the magnitude of the deflection basin are used to provide information on the structural capability of the pavement structure.
WeightWeight
Buffering System
DropHeight
Pavement
LoadPlate
Sensors spaced at -12, 0, 8, 12, 18, 24, 36, and 60 infrom center of load plate
0 in-12 in 8 in 12 in 18 in 24 in 36 in 60 in
Figure 8-4. Schematic diagram of FWD testing equipment (Smith et al. 2010).
Typical testing patterns for FWD testing vary, depending on the purpose of the testing and on the type and condition of the pavement. For network-level testing, deflection testing is conducted at greater intervals, commonly 500 to 1500 ft in a single traffic lane (NHI 1994). This level of testing is normally sufficient to provide a general indicator of structural adequacy of the pavement network.
For project-level testing, the spatial location of the deflection points should be adequate to capture the variability in structural capacity of the pavement; pavements with greater variability in structural condition should be subjected to a greater number of deflection measurements (Haas, Hudson, and Zaniewski 1994). Typical project-level testing intervals for both asphalt and concrete pavements are between 100 and 500 ft, with the shorter testing interval warranted for pavements in poorer condition and the larger testing interval appropriate for pavements in better condition. Even shorter testing intervals are sometimes used for research projects. If needed, a testing pattern can be set up to stagger the tests across traffic lanes, although often traffic control constraints may prevent that. Recommended testing locations for specific pavement types include:
Asphalt pavements: outer wheelpath of the outer traffic lane. Concrete pavements: basin testing in the center slab of the outer traffic lane (to minimize
edge effects) and joint load transfer testing in the outer wheelpath of the outer traffic lane. In addition, testing at selected slab corners locations may also be conducted to detect the presence of voids.
8-17

Handbook for Pavement Design, Construction and Management Pavement Evaluation
Other Nondestructive Testing Methods
There are a number of other nondestructive testing methods available to assist in the evaluation of a pavement structure. Some of the more common techniques are ground penetrating radar (GPR), impact echo testing, ultrasonic pulse velocity (UPV) testing, and seismic pavement analysis. A brief summary of these test methods are provided below.
GPR is nondestructive testing method in which radar pulses are used to locate pavement layers with different dielectric constants or permittivity. The most common pavement application for GPR is determining layer thicknesses. However, to the extent that the dielectric constant of many pavement materials is not significantly different, cores are needed to interpret the data. Additional uses of GPR are to identify saturated layers or subsurface moisture and voids, as the dielectric constants of air (1) and water (80) are significantly different from soils and built up materials. More recent applications include the identification of layers with differential density, such as evaluating an asphalt layer, and in performing an initial assessment of subsurface consistency in support of pavement maintenance and rehabilitation decisions. The Texas DOT has used GPR to locate defects in the asphalt surface layer, significant variation in air void content in the asphalt surface layer and areas with high moisture content in the base layer. One difficulty in the use of GPR data is the interpretation of the results. This can be greatly enhanced through selective coring to provide known layer thicknesses.
The use of GPR as part of a pavement evaluation provides certain benefits, including a reduction in the number of cores that must be taken. Since GPR tests can be performed at near traffic speeds, large amounts of testing can be performed quickly. In addition, characteristics of underlying layers, which cannot be seen from the surface, can be evaluated. However, the testing requires experienced and knowledgeable operators and realistic expectations about its capabilities. For example, pavement thickness studies have shown that differences between GPR thickness measurements are generally within 2 to 10 percent of thicknesses measured from cores, with lower differences generally associated with newly constructed pavements (SDDOT 2006).
Impact-echo is a method for nondestructive testing of concrete structures. Impact-generated sound waves are made to propagate through concrete and are reflected by internal flaws and external surfaces. Such internal flaws include cracks, delaminations, voids (including voids in the subgrade), honeycombing, and debonding, and can also be used to determine slab thickness measurements.
Ultrasonic pulse velocity (UPV) testing can also be used to identify and map cracks, delaminations, voids, honeycombing, cracks in concrete, as well as other materials such as wood, stone, ceramics, and metals. Furthermore, UPV tests can also be used to predict strength of early-age concrete. Typically, UPV testing requires access to two surfaces, preferably two parallel surfaces such as the top and bottom surfaces of an elevated slab, such as a bridge deck. However, testing can be performed using the indirect method which does not require access to two surfaces.
The portable seismic pavement analyzer (PSPA) was adapted from a larger version of the system known as the seismic pavement analyzer (SPA), which was developed for the FHWA’s Strategic Highway Research Program (SHRP) to diagnose problems with pavements in early stages. The PSPA is capable of monitoring the quality and thickness of concrete slabs. Three different seismic testing techniques are used: 1) impact echo, 2) ultrasonic body wave, and 3) ultrasonic
8-18

Handbook for Pavement Design, Construction and Management Pavement Evaluation
surface wave. Furthermore, the US Army Engineer Waterways Experiment Station (WES) developed correlations between PSPA velocities and flexural strength of concrete. Evaluation results are extremely sensitive to the flexural strength of the concrete layer. Presently, there is no method other than laboratory testing to determine the flexural strength of concrete.
Pavement Drainage SurveysBecause the development of many pavement distresses is related to the presence of excess moisture in the pavement structure, it is helpful during the distress survey to also conduct a drainage survey. In a drainage survey, visual signs of poor drainage are noted and can be coupled with information from other field testing activities to provide some insight into the overall drainability of the pavement structure. Thus, the overall purposes of conducting a drainage survey are to:
Identify the presence of moisture-related distresses. Document the prevailing drainage conditions of the pavement (e.g., cross slopes, cut/fill
areas, depth and condition of ditches). Assess the condition and effectiveness of edge drains (if present).
A drainage survey is more commonly conducted as the project level in conjunction with a manual distress survey. Particular attention should be given to the severity and extent of those distresses that are known to be moisture-related to help assess the degree to which excess moisture may be contributing to the pavement deterioration. The location of these distressed areas should be clearly noted. In addition, the following drainage-related items should be noted as part of the drainage survey:
Topography of the project . The overall topography and the approximate cut/fill depth should be noted along the length of the project to help determine if more distresses occur in certain cut or fill areas.
Transverse slopes of the shoulder and pavement . These should be evaluated to ensure that they are not ponding water or preventing the effective runoff of moisture from the surface. Typical recommendations for pavement surface drainage are a minimum 2 percent cross slope for mainline pavements and a 3 percent cross slope for shoulders (Anderson et al. 1998).
Condition of the ditches . The condition of the ditches (and the embankment material adjacent to the shoulder) should be noted along the length of the project to see if they are clear of standing water, debris, or vegetation that might otherwise impede the flow of water. The presence of cattails or willows growing in the ditch is a sign of the presence of excess moisture.
Geometrics of the ditches . The depth, width, and slope of the ditches should be noted along the length of the project to ensure that they facilitate the storage and movement of water. It is generally recommended that ditches be 4 ft (1.2 m) below the surface of the pavement, be at least 3 ft (1 m) wide, and have a minimum slope of 1 percent.
Condition of drainage outlets (if present) . These should be assessed over the entire length of the project to ensure that they are clear of debris and set at the proper elevation above the ditchline. The overall condition of the outlets and headwall (if present) should also be assessed, and the presence or absence of outlet markers noted.
8-19

Handbook for Pavement Design, Construction and Management Pavement Evaluation
Condition of drainage inlets (if present) . Many urban projects incorporate drainage inlets to remove surface water, and these should also be inspected over the length of the project. These should be free-flowing and clear of debris.
If edge drains are present, their effectiveness should be evaluated by observing their outflow either after a rainfall or after water is released from a water truck over pavement discontinuities. Another way of assessing the effectiveness of edge drains is through the use of video inspections (Daleiden, Simpson, and Rauhut 1998; Christopher 2000), in which a camera attached to a pushrod cable is inserted into the drainage system at the outlets. In this way, any blockages, rodent nests, or areas of crushed pipes can be located. Several highway agencies have adopted video edge drain inspection as part of new pavement construction.
All of the information collected from the drainage surveys should be marked and noted on strip maps, and then examined together to obtain a visual picture of what moisture is doing to the pavement, where any moisture damage is occurring, and what factors are present that allow this moisture damage to occur.
The detection of possible drainage problems as evidenced from a drainage survey may suggest the need for an in-depth analysis of the drainability of the pavement structure. Such an analysis requires information on the properties of the subgrade and paving materials (e.g., gradation, permeability, porosity), details of the geometry of the roadway and pavement structure (e.g., transverse and longitudinal slopes, cross section information), and climatic data for the geographic area (e.g., precipitation, depth of frost penetration). A computer program called DRIP (Drainage Requirements In Pavements) is available from FHWA that can assist in such an analysis (Mallela et al. 2002).
8-20
Handbook for Pavement Design, Construction and Management Pavement Evaluation
ReferencesAmerican Association of State Highway and Transportation Officials (AASHTO). 2006. Asset Management Data Collection Guide. Task Force 45 Report. American Association of State Highway and Transportation Officials, Washington, DC. Used by permission.
American Society of Testing and Materials. 2007. Standard Practice for Roads and Parking Lots Pavement Condition Index Surveys. ASTM D6433-07. ASTM International, West Conshohocken, PA.
Anderson, D. A., R. S. Huebner, J. R. Reed, J. C. Warner, and J. J. Henry. 1998. Improved Surface Drainage of Pavements. NCHRP Web Document Issue 16. Transportation Research Board, Washington, DC.
Bennett, C. R., A. Chamorro, C. Chen, H. Solminihac, and G. W. Flintsch. 2007. Data Collection Technologies for Road Management. East Asia Pacific Transportation Unit, World Bank, Washington DC. Available online at: http://siteresources.worldbank.org/INTTRANSPORT/Resources/07-02-12DataCollectionTechnologiesReport-v20.pdf.
Christopher, B. R. 2000. Maintenance of Highway Edgedrains. National Cooperative Highway Research Program Synthesis 401. Transportation Research Board, Washington, DC. Available online at: http://onlinepubs.trb.org/onlinepubs/nchrp/nchrp_syn_285.pdf.
Daleiden, J. F., A. Simpson, and J. B. Rauhut. 1998. Rehabilitation Performance Trends: Early Observations From Long-Term Pavement Performance (LTPP) Specific Pavement Studies (SPS). FHWA-RD-97-099. Federal Highway Administration, Washington, DC. Available online at: http://ntl.bts.gov/lib/20000/20500/20512/PB98131915.pdf.
Done, S., and P. Samuel. 2004. Measurement of Road Pavement Strength by Dynamic Cone Penetrometer. Transportation Research Laboratory, Crowthorne, Berkshire, UK. Available online at: http://www.dfid.gov.uk/r4d/PDF/Outputs/R81571.pdf.
Flintsch, G. and K. V. McGhee. 2009. Quality Management of Pavement Condition Data Collection. National Cooperative Highway Research Program Synthesis 401. Transportation Research Board of the National Academies. Washington, DC. Available online at: http://onlinepubs.trb.org/onlinepubs/nchrp/nchrp_syn_401.pdf.
Haas, R., W. R. Hudson, and J. P. Zaniewski. 1994. Modern Pavement Management. Krieger Publishing Company, Melbourne, FL.
Laguros, J. and G. Miller. 1997. Stabilization of Existing Subgrades to Improve Constructability During Interstate Pavement Reconstruction. NCHRP Synthesis of Highway Practice 247. Transportation Research Board, Washington, DC.
Mallela, J., G. Larson, T. Wyatt, J. Hall, and W. Barker. 2002. User’s Guide For Drainage Requirements In Pavements – DRIP 2.0 Microcomputer Program. FHWA-IF-02-053. Federal Highway Administration, Washington, DC. Available online at: http://isddc.dot.gov/OLPFiles/FHWA/010942.pdf.
8-21
Handbook for Pavement Design, Construction and Management Pavement Evaluation
McGhee, K. 2004. Automated Pavement Distress Collection Techniques. NCHRP Synthesis of Highway Practice 334. Transportation Research Board, Washington, DC. Available online at: http://onlinepubs.trb.org/onlinepubs/nchrp/nchrp_syn_334.pdf.
Miller, J. S. and W. Y. Bellinger. 2003. Distress Identification Manual for the Long-Term Pavement Performance Program (4th Revised Edition). Federal Highway Administration, Washington, DC. Available online at: http://www.tfhrc.gov/pavement/ltpp/reports/03031/03031.pdf.
Minnesota Department of Transportation (MnDOT). n.d. User Guide to the Dynamic Cone Penetrometer. Minnesota Department of Transportation, St. Paul, MN. Available online at: http://www.dot.state.mn.us/materials/researchdocs/User_Guide.pdf.
Newcomb, D. E. and B. Birgisson. 1999. Measuring In Situ Mechanical Properties of Pavement Subgrade Soils. NCHRP Synthesis of Highway Practice 278. Transportation Research Board, Washington, DC.
Noureldin, S., K. Zhu, D. Harris, and S. Li. 2005. Non-Destructive Estimation of Pavement Thickness, Structural Number and Subgrade Resilience along INDOT Highways. Indiana Department of Transportation, Indianapolis, IN. Available online at: http://docs.lib.purdue.edu/cgi/viewcontent.cgi?article=1629&context=jtrp.
Schmitt, R. L., S. Owusu-Ababio, R. M. Weed, and E. V. Nordheim. 2006. Development of a Guide to Statistics for Maintenance Quality Assurance Programs in Transportation. Midwest Regional University Transportation Center. Available online at: http://www.mrutc.org/research/0604/06-04_MRUTC_FR.pdf.
Shahin, M. Y. 1994. Pavement Management for Airports, Roads, and Parking Lots. Chapman and Hall, New York, NY.
Smith, K. D., J. E. Bruinsma, M. J. Wade, K. Chatti, J. M. Vandenbossche, and H. T. Yu. 2010. Using Falling Weight Deflectometer Data with Mechanistic-Empirical Design and Analysis, Volume 1: Final Report. Draft Report. Federal Highway Administration, Washington DC.
South Dakota Department of Transportation (SDDOT). 2006. Feasibility of Using Ground Penetrating Radar (GPR) for Pavement, Utilities, and Bridges. South Dakota Department of Transportation, Pierre, SD. Available online at: http://www.state.sd.us/Applications/HR19ResearchProjects/Projects%5CSD2005-05_Final_Report.pdf.
United States Army Engineer Waterways Experimental Station (US Army). 1989. Instructional Manual, Dynamic Cone Penetrometer. United States Army Engineer Waterways Experimental Station, Vicksburg, MS.
Wang, K. C. P., W. Gong, X. Li, R. P. Elliott, and J. Daleiden. 2002. “Analysis of Real-Time System for Automated Distress Survey.” Transportation Research Record 1806. Transportation Research Board, Washington, DC.
8-22