(This is a sample cover image for this issue. The actual...
14
(This is a sample cover image for this issue. The actual cover is not yet available at this time.) This article appeared in a journal published by Elsevier. The attached copy is furnished to the author for internal non-commercial research and education use, including for instruction at the authors institution and sharing with colleagues. Other uses, including reproduction and distribution, or selling or licensing copies, or posting to personal, institutional or third party websites are prohibited. In most cases authors are permitted to post their version of the article (e.g. in Word or Tex form) to their personal website or institutional repository. Authors requiring further information regarding Elsevier’s archiving and manuscript policies are encouraged to visit: http://www.elsevier.com/copyright
Transcript of (This is a sample cover image for this issue. The actual...

(This is a sample cover image for this issue. The actual cover is not yet available at this time.)
This article appeared in a journal published by Elsevier. The attachedcopy is furnished to the author for internal non-commercial researchand education use, including for instruction at the authors institution
and sharing with colleagues.
Other uses, including reproduction and distribution, or selling orlicensing copies, or posting to personal, institutional or third party
websites are prohibited.
In most cases authors are permitted to post their version of thearticle (e.g. in Word or Tex form) to their personal website orinstitutional repository. Authors requiring further information
regarding Elsevier’s archiving and manuscript policies areencouraged to visit:
http://www.elsevier.com/copyright
Author's personal copy
Linking phytoplankton community size composition with temperature,plankton food web structure and sea–air CO2 flux
Karen Marie Hilligsøe a, Katherine Richardson a,b,n, Jørgen Bendtsen c, Lise-Lotte Sørensen d, TorkelGissel Nielsen e, Maren Moltke Lyngsgaard a,b
a Department of Bioscience, Aarhus University, Ole Worms Alle 1, DK-8000 Arhus C, Denmarkb Center for Macroecology, Evolution and Climate, Faculty of Science, University of Copenhagen, Tagensvej 16, DK-2200 Copenhagen, Denmarkc VitusLab, Symbion Science Park, Fruebjergvej 3, Box 98, DK-2100 Copenhagen Ø, Denmarkd Department of Environmental Science, Aarhus University, Frederiksborgvej 399, PO Box 358, DK-4000 Roskilde, Denmarke National Institute of Aquatic Resources, Section for Ocean Ecology and Climate, Technical, University of Denmark, Kavalergarden 6, DK- 2920 Charlottenlund, Denmark
a r t i c l e i n f o
Article history:
Received 8 July 2010
Received in revised form
14 June 2011
Accepted 16 June 2011Available online 28 June 2011
Keywords:
Phytoplankton
Ocean carbon sink
CO2 flux
Temperature
Size distribution
Secondary production
Climate change
a b s t r a c t
Data collected at open water stations (depth4400 m) in all major ocean basins in 2006–2008 are used
to examine the relationship between the size structure of the phytoplankton community (determined
by size fractionated chlorophyll filtration), temperature and inorganic nutrient availability. A significant
relationship (po0.0005) was found between community size structure and temperature, with the
importance of large cells in the community decreasing with increase in temperature. Although weaker
than the temperature relationship, significant relationships were also noted between community cell
size and DIN (nitrate, nitrite and ammonium: p¼0.034) and phosphate (p¼0.031) concentrations.
When the data were divided into two groups of equal size, representing the samples with the highest
and lowest DIN/phosphate concentrations, respectively, no difference could be identified between the
slopes of the lines representing the relationship between size structure and temperature. There was,
however, a difference in the intercepts between the two groups. If the relationship between size and
temperature was only a response to nutrient availability, we would expect that the response would be
the strongest in the groups with the lowest nutrient concentrations. These results suggest that, in
addition to a nutrient effect, temperature may also directly influence the size structure of phytoplank-
ton communities. The size structure of the phytoplankton community in this study correlated to the
magnitude of primary production, export production (determined after Laws et al., 2000) and
integrated water column chlorophyll. Significant relationships were also found between mesozoo-
plankton production (determined using the proxy of calanoidþcyclopoid nauplii abundance as a
percentage of the total number of these copepods) and both temperature and phytoplankton size, with
production being the lowest in the warmest waters where phytoplankton were the smallest. In the
North Atlantic, export production and community size structure appear to be related to ocean uptake of
CO2 from the atmosphere. The reported results suggest that ocean warming may directly alter plankton
community structure. This, in turn, may alter the structure of marine food webs and impact the
performance of the open ocean as a natural carbon sink.
& 2011 Elsevier Ltd. All rights reserved.
1. Introduction
The oceans are a major reservoir of dissolved inorganic carbonand it is estimated that the oceans have taken up on the order of athird to one half of the CO2 released to the atmosphere via
anthropogenic activities since the industrial revolution (Sabineet al., 2004; Khatiwala et al., 2009). The function of this carbonsink is, thus, extremely important in the global carbon cycle.As there is a potential risk that the strength of the global oceancarbon sink will diminish in a warmer climate (Sarmiento et al.,1998), it is important to understand the processes contributing tothis sink and, especially, to understand how change in oceanicconditions may influence these processes.
Much emphasis has been given to the physical and chemicalprocesses relating to the sea–air flux of CO2 and detailed mappings ofthe seasonal distribution of surface-ocean and atmospheric pCO2
have been carried out. These measurements allow estimates of
Contents lists available at ScienceDirect
journal homepage: www.elsevier.com/locate/dsri
Deep-Sea Research I
0967-0637/$ - see front matter & 2011 Elsevier Ltd. All rights reserved.
doi:10.1016/j.dsr.2011.06.004
n Corresponding author. Tel.: þ45 35324285; fax: þ45 35324220;
E-mail addresses: [email protected] (K.M. Hilligsøe),
[email protected] (K. Richardson), [email protected] (J. Bendtsen),
[email protected] (L.-L. Sørensen), [email protected] (T.G. Nielsen),
[email protected] (M.M. Lyngsgaard).
Deep-Sea Research I 58 (2011) 826–838
Author's personal copy
seasonal patterns in sea–air CO2 flux based on comprehensive datasets of the surface pCO2 distribution and parameterizations of thesea–air CO2 gas exchange (Takahashi et al., 2002).
It is generally recognized that biological processes also poten-tially influence the sea–air CO2 flux. A global estimate of thisbiological mediated draw-down of surface pCO2 has been madeby removing the seasonal pCO2 change due to changes in surfacetemperatures (SST). This signal has been shown to be large, inparticular north of 401N, where seasonal pCO2 changes, whichcannot be explained by seasonal changes in surface temperature,exceed more than 140 matm (Takahashi et al., 2002). A number ofmore recent studies carried out in the North Atlantic have alsoindicated that biological processes may be particularly importantin sea–air CO2 flux here (e.g. Kortzinger et al., 2008; Benningtonet al., 2009; Takahashi et al., 2009).
While it is generically recognized that biological processes areimportant for sea–air CO2 flux, few attempts have, to date, beenmade to decompose this biological signal into its various con-tributing components. Thus, it is still unclear how the individualcomponent processes leading to the biological signal contributeto sea–air CO2 flux. The most obvious of biological processespotentially impacting surface pCO2 in the open ocean is photo-synthesis by phytoplankton. During this ‘‘primary production’’phytoplankton synthesize dissolved inorganic carbon (TCO2) toorganic material. The resulting reduction in surface pCO2 thentends to increase the CO2 flux from the atmosphere to the ocean.Carbon is subsequently transported into the deep ocean throughsinking particulate organic matter (phytoplankton cells, highertrophic organisms and detritus) and through mixing of dissolvedorganic carbon and this ‘‘biological pump’’ tends to increase theocean-atmosphere pCO2 difference on longer time scales(months–years) and, thereby, the sea–air CO2 flux.
Often, the POC sinking out of the surface layer is dominated byphytoplankton cells. The sinking rate of phytoplankton cells is relatedto their size (see Kiørboe, 1993 for review). As the size of phyto-plankton ranges from o1 mm to around 1 mm, there can beconsiderable differences in the rate of carbon transfer from surfaceocean waters to depth depending on the composition of the phyto-plankton community. The size structure of any given phytoplanktoncommunity is normally assumed to be controlled by nutrient avail-ability (see Kiørboe, 1993 for review). However, a number of studiessuggest that temperature may also be a controlling factor forcommunity size structure. The potential role that temperature mayhave is, however, difficult to discern as temperature and inorganicnutrient availability tend to co-vary on the global scale.
Finkel et al. (2007) identify climate (as expressed throughtemperature) as being an important controlling factor for macro-evolutionary changes in phytoplankton community size structure(and, thereby, ocean carbon cycling) during the Cenozoic period.They interpret this temperature influence on phytoplankton sizeas being through its influence on ocean stratification and theresulting availability of nutrients in the surface layer.
Agawin et al. (2000) demonstrated that the relative dominanceof picoplankton is the greatest in warm oligotrophic waters. Theyrecognized a covariance with temperature and nutrients in theirmeta-analysis but did not have sufficient data to discern thepotential importance of the two factors. With the help ofmesocosm data, however, they concluded that the advantage thatsmall sized phytoplankton have under oligotrophic conditions is aprimary contributor to the dominance of picoplankton in warmoligotrophic waters. Moran et al. (2010), on the other hand,concluded that temperature alone could explain 73% of thevariance noted in the global distribution of picoplankton.
In an intriguing study based on a short time series (5 years),carried out in Arctic waters where nutrient availability is notbelieved to be limiting, Li et al. (2009) demonstrated a strong
relationship between phytoplankton community size structure(decrease in nanoplankton; increase in picoplankton) andincrease in temperature/decrease in salinity. Over the sameperiod, an increase in bacterioplankton abundance was recorded.In that study, it is not possible to separate the potential tempera-ture effect from a possible salinity effect.
Taken together, the recent literature tends to suggest that thepossibility of a direct temperature influence on phytoplanktoncommunity size structure cannot be eliminated. If there is such aneffect, then change in climate conditions, including a warming ofthe oceans, could potentially create a feedback on the climatesystem via changes in phytoplankton communities and, thereby,biologically mediated ocean carbon cycling.
In the present study, the potential role of temperature ininfluencing phytoplankton community size structure is addressedusing a data set acquired on a cruise circumnavigating the globe in2006–2007. These data are supplemented with data collected in theNorth Atlantic on an additional cruise conducted in 2008.The potential biogeochemical impacts of changes in phytoplanktoncommunity size structure are addressed by examining sea–air fluxof CO2 in relation to both the magnitude of primary production and‘‘export’’ production, i.e. the fraction of primary production leavingthe surface layer, via the model described by Laws et al. (2000), andthe phytoplankton community size structure. Potential impacts ofchanges in phytoplankton community size structure on the struc-ture of the zooplankton community are also addressed.
We confine our study to the open ocean (defined here as stationswith water depths 4400 m) as the open ocean is believed to bemost important in terms of the carbon export into the deep ocean:Dunne et al. (2007) estimated that the open ocean (depths4200 m) accounts for approximately 80% of the global export.In addition, coastal stations may be influenced by other factors thanthe open ocean. Thus, considering the open ocean and coastalstations together may mask global patterns in the relationshipbetween biological activity and ocean carbon uptake.
2. Material and methods
2.1. Cruise information
Samples used for this study were collected during the circumna-vigating Galathea 3 expedition on HDMS Vædderen carried out from11 August 2006 to 25 April 2007 and on a cruise with R/V DANAfrom 5 to 13 August 2008 in the Northern North Atlantic. Thus, thedata set includes stations sampled along transects across the north-ern part of the North Atlantic sub-polar gyre both in August–September 2006 and August 2008. These transects also coveredwaters from the East Greenland Current and Irminger Sea towardsthe North Atlantic Current. Four samples were also taken in thesouthern part of the West Greenland Current system. Samples fromthe Gulf Stream and the southern part of the North Atlantic sub-polargyre were collected in April 2007. A detailed study of the hydro-graphy in the Sargossa Sea resulted in 19 samples from this area and1 sample from the Caribbean Sea in March–April 2007. Samples (11)from the Eastern Atlantic were taken along a transect from theAzores towards the Angola and Benguela Current systems inSeptember–October 2006. A transect along the south Indian OceanCurrent (6 samples) and the southern Leeuwin Current (4 samples)was sampled in October–December 2006. Samples from the EastAustralian Current (3 samples) and Solomon Sea (5 samples) werecollected in December 2006 and 13 samples were subsequentlymeasured in the Southern Ocean in January–February 2007. Samplesfrom the Peru/Chile Current and eastern equatorial Pacific werecollected in February–March 2007. In summary, samples werecollected from oligotrophic subtropical gyres, equatorial and coastal
K.M. Hilligsøe et al. / Deep-Sea Research I 58 (2011) 826–838 827
Author's personal copy
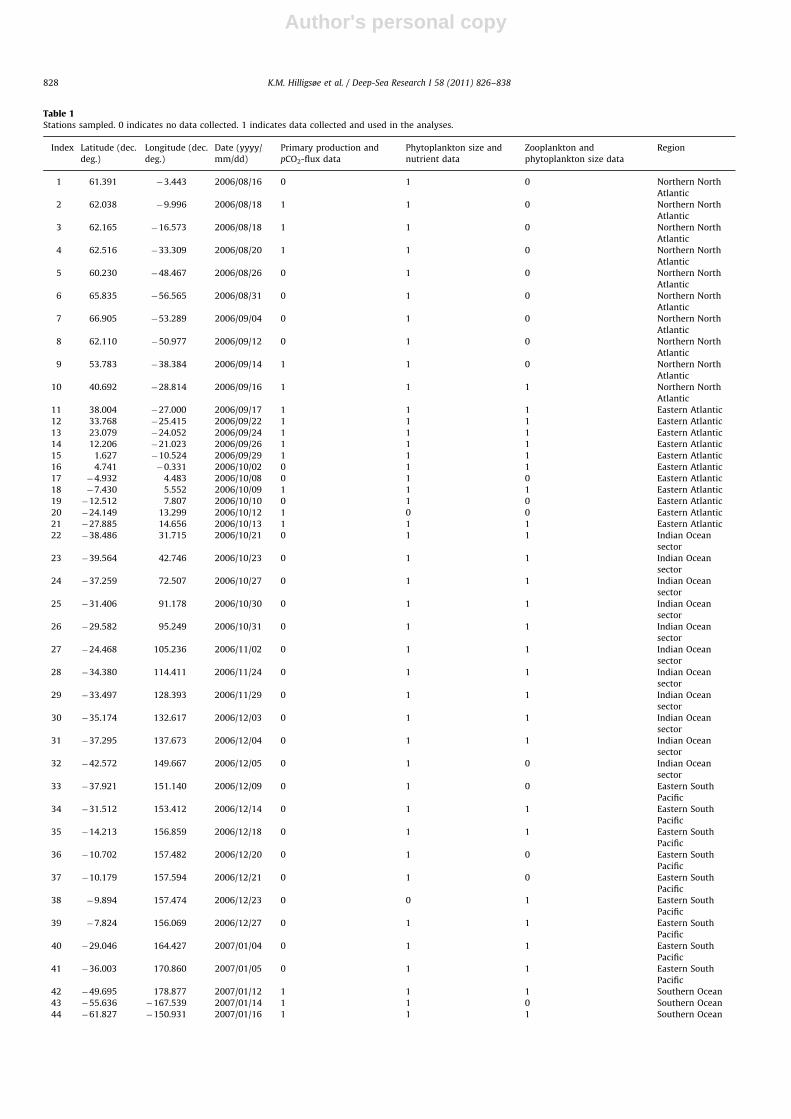
Table 1Stations sampled. 0 indicates no data collected. 1 indicates data collected and used in the analyses.
Index Latitude (dec.
deg.)
Longitude (dec.
deg.)
Date (yyyy/
mm/dd)
Primary production and
pCO2-flux data
Phytoplankton size and
nutrient data
Zooplankton and
phytoplankton size data
Region
1 61.391 �3.443 2006/08/16 0 1 0 Northern North
Atlantic
2 62.038 �9.996 2006/08/18 1 1 0 Northern North
Atlantic
3 62.165 �16.573 2006/08/18 1 1 0 Northern North
Atlantic
4 62.516 �33.309 2006/08/20 1 1 0 Northern North
Atlantic
5 60.230 �48.467 2006/08/26 0 1 0 Northern North
Atlantic
6 65.835 �56.565 2006/08/31 0 1 0 Northern North
Atlantic
7 66.905 �53.289 2006/09/04 0 1 0 Northern North
Atlantic
8 62.110 �50.977 2006/09/12 0 1 0 Northern North
Atlantic
9 53.783 �38.384 2006/09/14 1 1 0 Northern North
Atlantic
10 40.692 �28.814 2006/09/16 1 1 1 Northern North
Atlantic
11 38.004 �27.000 2006/09/17 1 1 1 Eastern Atlantic
12 33.768 �25.415 2006/09/22 1 1 1 Eastern Atlantic
13 23.079 �24.052 2006/09/24 1 1 1 Eastern Atlantic
14 12.206 �21.023 2006/09/26 1 1 1 Eastern Atlantic
15 1.627 �10.524 2006/09/29 1 1 1 Eastern Atlantic
16 4.741 �0.331 2006/10/02 0 1 1 Eastern Atlantic
17 �4.932 4.483 2006/10/08 0 1 0 Eastern Atlantic
18 �7.430 5.552 2006/10/09 1 1 1 Eastern Atlantic
19 �12.512 7.807 2006/10/10 0 1 0 Eastern Atlantic
20 �24.149 13.299 2006/10/12 1 0 0 Eastern Atlantic
21 �27.885 14.656 2006/10/13 1 1 1 Eastern Atlantic
22 �38.486 31.715 2006/10/21 0 1 1 Indian Ocean
sector
23 �39.564 42.746 2006/10/23 0 1 1 Indian Ocean
sector
24 �37.259 72.507 2006/10/27 0 1 1 Indian Ocean
sector
25 �31.406 91.178 2006/10/30 0 1 1 Indian Ocean
sector
26 �29.582 95.249 2006/10/31 0 1 1 Indian Ocean
sector
27 �24.468 105.236 2006/11/02 0 1 1 Indian Ocean
sector
28 �34.380 114.411 2006/11/24 0 1 1 Indian Ocean
sector
29 �33.497 128.393 2006/11/29 0 1 1 Indian Ocean
sector
30 �35.174 132.617 2006/12/03 0 1 1 Indian Ocean
sector
31 �37.295 137.673 2006/12/04 0 1 1 Indian Ocean
sector
32 �42.572 149.667 2006/12/05 0 1 0 Indian Ocean
sector
33 �37.921 151.140 2006/12/09 0 1 0 Eastern South
Pacific
34 �31.512 153.412 2006/12/14 0 1 1 Eastern South
Pacific
35 �14.213 156.859 2006/12/18 0 1 1 Eastern South
Pacific
36 �10.702 157.482 2006/12/20 0 1 0 Eastern South
Pacific
37 �10.179 157.594 2006/12/21 0 1 0 Eastern South
Pacific
38 �9.894 157.474 2006/12/23 0 0 1 Eastern South
Pacific
39 �7.824 156.069 2006/12/27 0 1 1 Eastern South
Pacific
40 �29.046 164.427 2007/01/04 0 1 1 Eastern South
Pacific
41 �36.003 170.860 2007/01/05 0 1 1 Eastern South
Pacific
42 �49.695 178.877 2007/01/12 1 1 1 Southern Ocean
43 �55.636 �167.539 2007/01/14 1 1 0 Southern Ocean
44 �61.827 �150.931 2007/01/16 1 1 1 Southern Ocean
K.M. Hilligsøe et al. / Deep-Sea Research I 58 (2011) 826–838828
Author's personal copy
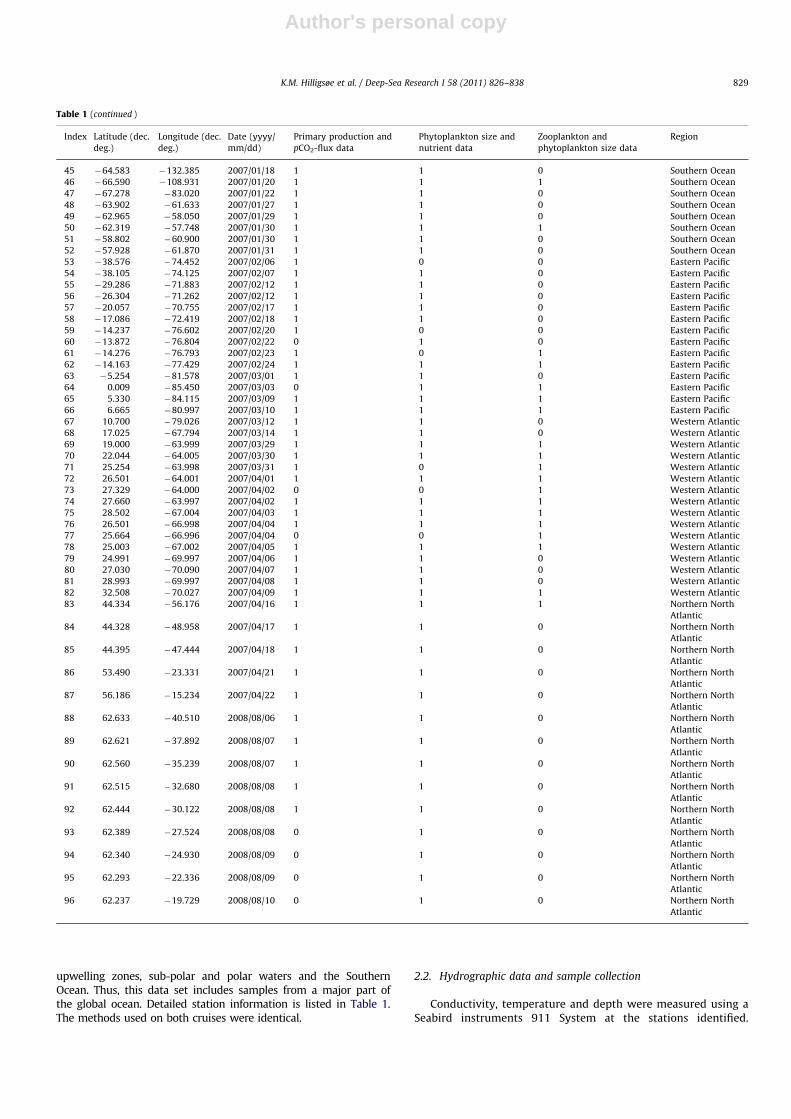
upwelling zones, sub-polar and polar waters and the SouthernOcean. Thus, this data set includes samples from a major part ofthe global ocean. Detailed station information is listed in Table 1.The methods used on both cruises were identical.
2.2. Hydrographic data and sample collection
Conductivity, temperature and depth were measured using aSeabird instruments 911 System at the stations identified.
Table 1 (continued )
Index Latitude (dec.
deg.)
Longitude (dec.
deg.)
Date (yyyy/
mm/dd)
Primary production and
pCO2-flux data
Phytoplankton size and
nutrient data
Zooplankton and
phytoplankton size data
Region
45 �64.583 �132.385 2007/01/18 1 1 0 Southern Ocean
46 �66.590 �108.931 2007/01/20 1 1 1 Southern Ocean
47 �67.278 �83.020 2007/01/22 1 1 0 Southern Ocean
48 �63.902 �61.633 2007/01/27 1 1 0 Southern Ocean
49 �62.965 �58.050 2007/01/29 1 1 0 Southern Ocean
50 �62.319 �57.748 2007/01/30 1 1 1 Southern Ocean
51 �58.802 �60.900 2007/01/30 1 1 0 Southern Ocean
52 �57.928 �61.870 2007/01/31 1 1 0 Southern Ocean
53 �38.576 �74.452 2007/02/06 1 0 0 Eastern Pacific
54 �38.105 �74.125 2007/02/07 1 1 0 Eastern Pacific
55 �29.286 �71.883 2007/02/12 1 1 0 Eastern Pacific
56 �26.304 �71.262 2007/02/12 1 1 0 Eastern Pacific
57 �20.057 �70.755 2007/02/17 1 1 0 Eastern Pacific
58 �17.086 �72.419 2007/02/18 1 1 0 Eastern Pacific
59 �14.237 �76.602 2007/02/20 1 0 0 Eastern Pacific
60 �13.872 �76.804 2007/02/22 0 1 0 Eastern Pacific
61 �14.276 �76.793 2007/02/23 1 0 1 Eastern Pacific
62 �14.163 �77.429 2007/02/24 1 1 1 Eastern Pacific
63 �5.254 �81.578 2007/03/01 1 1 0 Eastern Pacific
64 0.009 �85.450 2007/03/03 0 1 1 Eastern Pacific
65 5.330 �84.115 2007/03/09 1 1 1 Eastern Pacific
66 6.665 �80.997 2007/03/10 1 1 1 Eastern Pacific
67 10.700 �79.026 2007/03/12 1 1 0 Western Atlantic
68 17.025 �67.794 2007/03/14 1 1 0 Western Atlantic
69 19.000 �63.999 2007/03/29 1 1 1 Western Atlantic
70 22.044 �64.005 2007/03/30 1 1 1 Western Atlantic
71 25.254 �63.998 2007/03/31 1 0 1 Western Atlantic
72 26.501 �64.001 2007/04/01 1 1 1 Western Atlantic
73 27.329 �64.000 2007/04/02 0 0 1 Western Atlantic
74 27.660 �63.997 2007/04/02 1 1 1 Western Atlantic
75 28.502 �67.004 2007/04/03 1 1 1 Western Atlantic
76 26.501 �66.998 2007/04/04 1 1 1 Western Atlantic
77 25.664 �66.996 2007/04/04 0 0 1 Western Atlantic
78 25.003 �67.002 2007/04/05 1 1 1 Western Atlantic
79 24.991 �69.997 2007/04/06 1 1 0 Western Atlantic
80 27.030 �70.090 2007/04/07 1 1 0 Western Atlantic
81 28.993 �69.997 2007/04/08 1 1 0 Western Atlantic
82 32.508 �70.027 2007/04/09 1 1 1 Western Atlantic
83 44.334 �56.176 2007/04/16 1 1 1 Northern North
Atlantic
84 44.328 �48.958 2007/04/17 1 1 0 Northern North
Atlantic
85 44.395 �47.444 2007/04/18 1 1 0 Northern North
Atlantic
86 53.490 �23.331 2007/04/21 1 1 0 Northern North
Atlantic
87 56.186 �15.234 2007/04/22 1 1 0 Northern North
Atlantic
88 62.633 �40.510 2008/08/06 1 1 0 Northern North
Atlantic
89 62.621 �37.892 2008/08/07 1 1 0 Northern North
Atlantic
90 62.560 �35.239 2008/08/07 1 1 0 Northern North
Atlantic
91 62.515 �32.680 2008/08/08 1 1 0 Northern North
Atlantic
92 62.444 �30.122 2008/08/08 1 1 0 Northern North
Atlantic
93 62.389 �27.524 2008/08/08 0 1 0 Northern North
Atlantic
94 62.340 �24.930 2008/08/09 0 1 0 Northern North
Atlantic
95 62.293 �22.336 2008/08/09 0 1 0 Northern North
Atlantic
96 62.237 �19.729 2008/08/10 0 1 0 Northern North
Atlantic
K.M. Hilligsøe et al. / Deep-Sea Research I 58 (2011) 826–838 829
Author's personal copy
The instruments were attached to a rosette of 12 Niskinbottles (30l), a fluorometer (SCUFA or Dr Haardt), light meters(Biospherical) and two oxygen sensors (SBE43). All instrumentswere calibrated and data quality controlled before use. Sampleswere taken from selected depths for oxygen calibration (Winkler),salinity calibration (PortaSal), chlorophyll determination, sizefractionated chlorophyll determination, nutrient analysis, pri-mary production and phytoplankton species determination.
2.3. Identification of surface waters
For the analyses, the stations in Table 1 are assigned to sevendifferent regions. Stations north of 401 north are assigned to theNorthern North Atlantic. The Eastern Atlantic region includesstations south of 401 north in the eastern part of the Atlantic,more specifically in the Cape Verde, Gambia and Guinea AbyssalPlains as well as the Angola and Cape Basins. All stations in theIndian Ocean as well as all stations south of Australia and west of1501 east are assigned to the Indian Ocean Sector. All stations inthe Solomon Sea itself, as well as stations in the New CaledoniaBasin and Tasman Sea east of 1501 east, are assigned to theEastern South Pacific. Stations sampled in the Pacific part of theSouthern Ocean as well as the Drake Passage are assigned to theSouthern Ocean. Stations in the Chile and Peru Basins are assignedto the Eastern Pacific. The Caribbean and Sargasso Sea stations areassigned to the Western Atlantic.
2.4. Chlorophyll determination and size fractionation of chlorophyll
Chlorophyll and size fractions of chlorophyll were determined inthe surface water, the chlorophyll maximum and at the standardsampling depth below the chlorophyll maximum. In addition,sampling at 30 m was carried out at intensively investigatedstations. On the Dana 2008 cruise, chlorophyll and size fractions ofchlorophyll were only determined for the surface water andchlorophyll maximum. Seawater was tapped from Niskin bottlesfrom the CTD rosette and filtered on GF/F (approximately 0.75 mm)and 10 mm pore size filters. For each sampling depth and filter size,triplicate filtrations of 200–500 ml seawater for the GF/F filter and400–1000 ml seawater for the 10 mm filter were performed. Thevolume filtered depended on the in-situ chlorophyll concentration.The filters were stored in glass vials with 5 ml 96% ethanol andfrozen at –20 1C. Prior to analysis, the samples were extracted for aminimum of 6 h and a maximum of 24 h in darkness at roomtemperature. The samples were measured on a TD-700 fluorometerfrom Turner Designs, which was calibrated against a pure chlor-ophyll a standard. The procedure for calculation of chlorophyll a
from fluorescence is Method 445.0 by the U.S. EnvironmentalProtection Agency as suggested by Turner Designs (http://www.epa.gov/microbes/m445_0.pdf). The fluorometer measurementsmade with the CTD were calibrated against the discrete measure-ments made in each region/water mass. Integrated water columnchlorophyll was estimated from the calibrated fluorometer profiles.
The fraction of total chlorophyll a retained on a 10 mm filterwas calculated as f10 mm¼cchlorophyll a 10 mm/cchlorophyll a GF/F, wherecchlorophyll a GF/F and cchlorophyll a 10 mm are the concentrations ofchlorophyll a in the water sample, originating from the phyto-plankton collected on the GF/F and 10 mm pore size filter,respectively. In the following, we refer to the fraction of totalchlorophyll a retained on a 10 mm filter as the fraction of thephytoplankton community 410 mm.
2.5. Determination of inorganic nutrients
At each station, seawater from the chlorophyll maximum andthe standard sampling depths of 10, 30, 60, 100, 200 and 400 m
was tapped from Niskin bottles from the CTD rosette andimmediately frozen. For stations where the latitude was Z501,the surface sampling depth was changed to 5 m instead of 10 m.The subsequently filtered seawater (Millipore Millex-GP Hydro-philic PES 0.22 mm) was analyzed for nitrate, nitrite, phosphate,ammonium and silicate by wet-chemistry methods according toGrasshoff (Ed.) et al. (1983) with a SANPLUS System Scalar auto-analyser at the National Environmental Research Institute (NERI),University of Aarhus, Denmark. Detection limits of 0.06, 0.1, 0.04,0.3 and 0.2 mM are for phosphorus, nitrate, nitrite, ammoniumand silicate, respectively.
2.6. Primary production determination
The primary production was measured according to a modifiedcarbon-14 method (Steemann Nielsen, 1952). Particulate produc-tion (retained on a GF/F filter) was determined from samplestaken from two depths: the surface layer and the depth of thesubsurface chlorophyll peak (or at 20 m in the absence of asubsurface peak). Again, for latitudes Z501 N and S, the surfacesampling depth was changed to 5 m instead of 10 m. Primaryproduction vs. light intensity curves were fitted to the data thatwere generated in incubations carried out in 50 ml polyethylenebottles for 2 h at 12 different light intensities (ranging from o10to 41000 mmol m�2 s�1) and two dark samples from eachsampling depth. The dark samples were subtracted from the lightincubation samples. Primary production was calculated by creat-ing a matrix of potential production through the water columnover the light period of the day using the established primaryproduction vs. light intensity curves and the light climate atmeter intervals through the water column throughout the day(estimated from the measured attenuation coefficient and ‘‘inci-dent’’ light during the week of sampling, i.e. hourly averagesmade over a seven-day average around the date of the sampling).Using these weekly averages of incident light, the potentialprimary production at stations sampled on days with differentlight conditions could be compared. The euphotic zone wasassigned as being the waters above the depth of the penetrationof 0.1% surface irradiance.
No correction was made for possible isotope discrimination orphoto-inhibition occurring in the water column. We acknowledgethat photo-inhibition might be predicted to occur in some of theregions we visited. However, we have used the Galathea data tocompare our calculation model for primary production wherephoto-inhibition is not taken into account, and another (Plattet al., 1980) where photo-inhibition is included. A strong linearrelationship (R2
¼0.95, n¼82) was revealed between the resultsobtained with the two models, where results using Platt’s photo-inhibition model were approximately 27% lower than our model.We cannot explain why applying the photo-inhibition parameterin Platt’s model should yield a more or less constant reduction inwater column photosynthesis at high and low productive stationsand under varying ambient light conditions. We, therefore, choosenot to include photo-inhibition in our model.
2.7. Determination of export production
A pelagic food web model for determination of export produc-tion from primary production and temperature by Laws et al.(2000) was applied to the data set. Ideally, total primary produc-tion should be input to the model but, in the present study,particulate production has been used. The model is applied to theinput variables of in-situ temperature and particulate productiondown through the euphotic zone and yields an estimate of exportproduction at the station.
K.M. Hilligsøe et al. / Deep-Sea Research I 58 (2011) 826–838830
Author's personal copy
2.8. Determination of pCO2 and sea–air CO2 flux
Sea–air flux of CO2 is calculated from the difference in partialpressure of CO2 at the sea surface and in the atmosphere.The difference in pCO2 gives the direction of the sea–air exchangeand the potential uptake and the gas surface exchange coefficientis required to calculate actual flux rates of CO2 (Liss and Merlivat,1986, Wanninkhof, 1992, Nightingale et al., 2000). The exchangecoefficients are usually parameterized as wind speed dependentand, in the present study, we use the parameterizations fromWanninkhof (1992). The average DpCO2¼pCO2(sea)�pCO2(air),ocean temperature and salinity recorded during the period oftime the ship was at the sampling station was used together withwind field data to calculate the sea–air CO2 flux.
The partial pressure of CO2 in the ocean is determined bybringing a volume of air into equilibrium with a continuous streamof seawater. For this, we used an equilibrator system where the CO2
in the air sample coming from the equilibrator was measured usingan IR CO2 monitor (LICOR-6262). The CO2 monitor, in turn,measured the air sample from the equilibrator system, a calibrationgas and the atmospheric air. In this manner, we could use the sameinstrument for determining pCO2 in the ocean and the atmosphere.The equilibrator was constructed following Dickson and Goyet(1994) and consists of a 10 l glass cylinder where water is pumpedin at the top of the cylinder into the chamber where a series ofsmall glass tubes increases the water–air contact surface in order toachieve equilibrium quickly. Air is sampled continuously from theequilibrator into the CO2 monitor and the air flow from the CO2
monitor is returned into the equilibrator in a circulating flow.The ocean–atmosphere difference in pCO2 is determined as half-hour means during the cruise.
Data for the wind fields at the sampling station over the weekprior to arrival at the station were obtained from the NationalCenter for Environmental Prediction available at http://www.esrl.noaa.gov/psd/data/reanalysis/reanalysis.shtml. Based on the valuesfor the wind field at 6 h intervals during this 1 week period and themeasured average DpCO2, ocean temperature and salinity at thestation, a sea–air CO2 flux was calculated for every 6 h and,subsequently, averaged for the 1-week period. The averaged sea–air CO2 flux gives an estimate of the net amount of CO2 that hasbeen transported into/out of the ocean during the week prior tosampling. Thus, this approach provides a rate measurement thatcan be directly related to the rate measurement obtained forprimary production, where it is assumed that that the primaryproduction measurement obtained on a given sampling date isrepresentative for the rate during the past week. (Note that primaryproduction rates are estimated using weekly light averages.)
2.9. Estimation of temperature corrected pCO2
Influence from the seasonal surface temperature changes on thepCO2 was considered by removing the effect from the differencebetween the observed temperature (Tobs) and the local annual meantemperature (Tmean). For each station, the annual mean SST wasdetermined by bilinear interpolation from the 1�11 gridded WorldOcean Atlas 2009 (Locarnini et al., 2010). From the temperaturedifference (Tmean�Tobs), the influence from seasonal temperaturechange on the pCO2(obs) was calculated according to Takahashi et al.(2002): pCO2(Tmean)¼pCO2(obs.) � exp[0.0423(Tmean�Tobs)], wherepCO2(Tmean) is the expected pCO2 at annual mean temperature ifonly temperature effects account for the local pCO2 changes. Subse-quently, the influence on the sea–air CO2 flux (FCO2
) could becalculated from FCO2
Tcorrð Þ ¼ gFCO2, where the correction term is
determined by g¼(pCO2(Tmean)�pCO2(obs, air))/(pCO2(obs, water)-�pCO2(obs, air)). Correlations between calculated export production
and sea–air CO2 fluxes were calculated for both the observed and thetemperature corrected sea–air CO2 flux.
2.10. Copepod abundance and potential production
As an indicator of the secondary production of the planktonecosystem, we focused on the demography of calanoid andcyclopoid copepods. As copepod populations, in general, arefound to be food limited, we assume that the number of juvenilestages in the population will be a reflection of the production.Therefore, we used as a proxy for production the ratio betweenthe number of nauplii and the total abundance of copepods.Samples for determining the vertical distribution of metazoo-plankton (450 mm) were collected using a HYDRO-BIOS MultiNetMidi. The MultiNet consists of 5 nets with a closing option for 4 ofthe nets. The strata investigated were 0–50–100–200–300–400 mor 0–75–150–200–300–400 m. The MultiNet was lowered andhauled with speeds of 18 and 10 m min�1, respectively. Sampleswere fixed in 4% formalin and stored at 5 1C prior to microscopicenumeration and calculation of the ratio of nauplii to totalcopepod abundance.
2.11. Statistical analyses
The data set describing fraction of phytoplankton410 mm vs.temperature does not show homogeneity of variance beforetransformation. Therefore, a non-parametric Kruskal–Wallis testwas used to compare the median of the fraction of total chlor-ophyll retained on a 10 mm filter in four temperature groups. Themedians for each group were compared pair-wise using theKruskal–Wallis test.
The multiple regressions were preceded by linear regressionsand transformations to ensure that the data meet statisticalassumptions of independence, homogeneity of variance, normal-ity of error and linearity/additivity. The multiple linear regres-sions for log10(fraction of phytoplankton410 mmþdcell size) vs.temperature, vs. log10(DINþdDIN), vs. log10ðPO4þdPO4
Þ, vs. log10
(SiþdSi) and vs. depth demonstrate normality of error by theLilliefors test. The individual regression coefficients in the multi-ple linear regressions are tested with a t-test. The offsets used inthe transformation were dDIN¼0.04, dPO4
¼ 0:06 and dSi¼
0.2 mmol/kg and dcell size¼0.001. In the following, the transformedvariables are referred to as log10(DIN), log10(PO4), log10(Si) andlog10(fraction of phytoplankton 410 mm) without explicitly writ-ing the d offsets.
An analysis of covariance (ANOCOVA) was performed on thetransformed data set of log10(fraction of phytoplankton410 mm)vs. temperature. The data set is divided into two groups with highand low phosphate concentration and each group with index i isfitted to a model of the following type: log10(fraction of phyto-plankton410 mm)i¼aiþbi � temperature. Firstly, it is determinedwhether there is a significant relationship between communitysize and temperature for both groups. Secondly, it is testedwhether the slopes of the regression lines for the two groupsbPO4 40.29 mmol/kg and bPO4 o0.29 mmol/kg are significantly differentfrom one another using an F-statistic on the interaction termexpressing the difference in slopes between the groups. Finally, ifthere is no difference between the slopes (i.e. the lines canbe considered as being parallel), it is investigated whetherthere is homogeneity of the intercepts (aPO4 Z0:29 mmol=kg andaPO4 o0:29 mmol=kg). If the intercepts are not homogeneous, thenwe can deduce that there is a significant coupling between thephosphate concentration and the temperature. An equivalentanalysis of covariance was done after dividing the data set intotwo groups with high and low DIN concentration. Here, the two
K.M. Hilligsøe et al. / Deep-Sea Research I 58 (2011) 826–838 831
Author's personal copy
groups being tested were for DIN concentrations o and 42.7 mmol/kg, respectively.
Mesozooplankton production vs. temperature was analyzed bylinear regression. The data set of mesozooplankton production vs.cell size did, on the other hand, not show normality of error whendoing linear regression. Therefore, a non-parametric Kruskal–Wallis test was used for comparing the median mezozooplanktonproduction in the two approximately equally sized groups withthe smallest and the largest cell size.
Linear regression analyses were performed on export andprimary production vs. sea–air CO2-flux in each of the geographi-cal regions. The linear regressions were performed both for theraw and for the temperature-corrected sea–air CO2-flux data.
The data set describing export production vs. integratedchlorophyll a did not show homogeneity of variance beforetransformation. Linear regressions and transformations wereconsequently performed to ensure that the data meet statisticalassumptions and, subsequently, linear regressions wereperformed on log10(export productionþdEP) vs. log10(integratedchlorophyll aþdChl. a). The analysis was performed both for thenorthern North Atlantic and for the data set as a whole.The following data set was transformed and analyzed in thesame way: log10(export productionþdEP) vs. log10(fraction ofphytoplankton410 mmþdcell size). The offsets used in the trans-formation were dEP¼0.008 molC/m2/day, dcell size¼0.001 anddChl. a¼10 molC/m2/day. In the following, the transformed vari-ables are referred to without explicitly writing the d offsets.
For the linear regressions, F-tests were applied to check howwell the model fitted the data and normality of error wasdemonstrated by the Lilliefors test.
3. Results
3.1. Phytoplankton community size structure and temperature
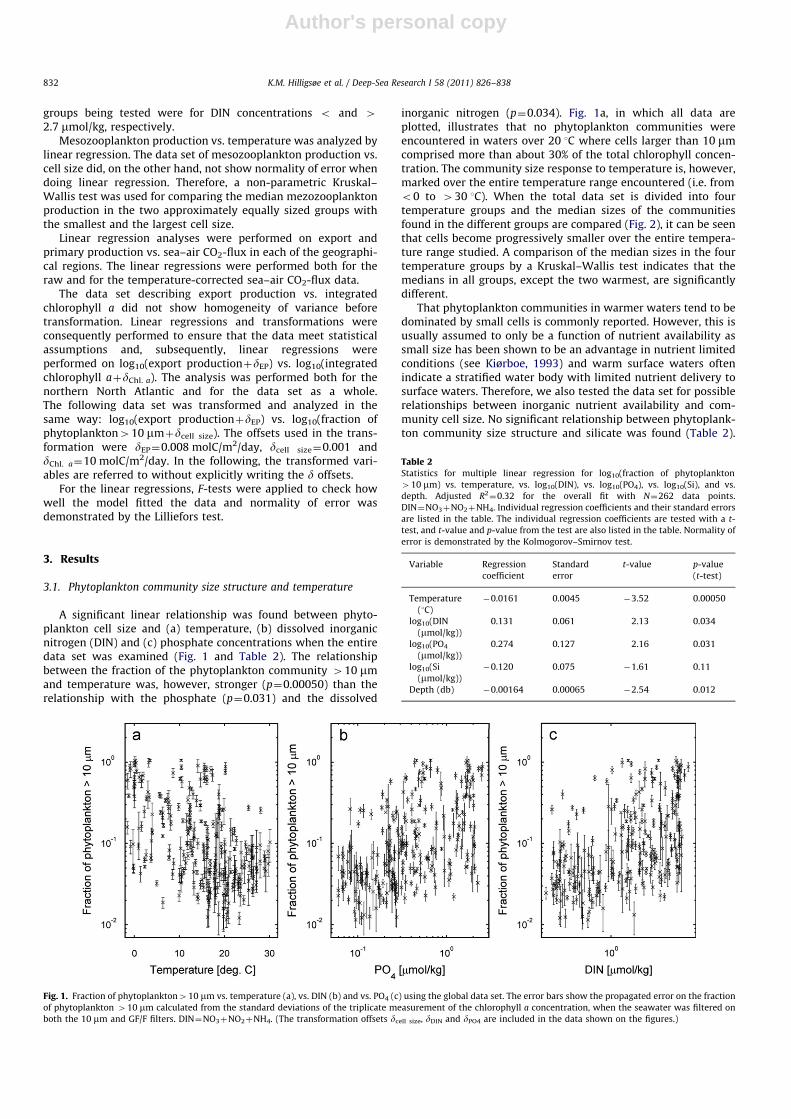
A significant linear relationship was found between phyto-plankton cell size and (a) temperature, (b) dissolved inorganicnitrogen (DIN) and (c) phosphate concentrations when the entiredata set was examined (Fig. 1 and Table 2). The relationshipbetween the fraction of the phytoplankton community 410 mmand temperature was, however, stronger (p¼0.00050) than therelationship with the phosphate (p¼0.031) and the dissolved
inorganic nitrogen (p¼0.034). Fig. 1a, in which all data areplotted, illustrates that no phytoplankton communities wereencountered in waters over 20 1C where cells larger than 10 mmcomprised more than about 30% of the total chlorophyll concen-tration. The community size response to temperature is, however,marked over the entire temperature range encountered (i.e. fromo0 to 430 1C). When the total data set is divided into fourtemperature groups and the median sizes of the communitiesfound in the different groups are compared (Fig. 2), it can be seenthat cells become progressively smaller over the entire tempera-ture range studied. A comparison of the median sizes in the fourtemperature groups by a Kruskal–Wallis test indicates that themedians in all groups, except the two warmest, are significantlydifferent.
That phytoplankton communities in warmer waters tend to bedominated by small cells is commonly reported. However, this isusually assumed to only be a function of nutrient availability assmall size has been shown to be an advantage in nutrient limitedconditions (see Kiørboe, 1993) and warm surface waters oftenindicate a stratified water body with limited nutrient delivery tosurface waters. Therefore, we also tested the data set for possiblerelationships between inorganic nutrient availability and com-munity cell size. No significant relationship between phytoplank-ton community size structure and silicate was found (Table 2).
Fig. 1. Fraction of phytoplankton410 mm vs. temperature (a), vs. DIN (b) and vs. PO4 (c) using the global data set. The error bars show the propagated error on the fraction
of phytoplankton 410 mm calculated from the standard deviations of the triplicate measurement of the chlorophyll a concentration, when the seawater was filtered on
both the 10 mm and GF/F filters. DIN¼NO3þNO2þNH4. (The transformation offsets dcell size, dDIN and dPO4 are included in the data shown on the figures.)
Table 2Statistics for multiple linear regression for log10(fraction of phytoplankton
410 mm) vs. temperature, vs. log10(DIN), vs. log10(PO4), vs. log10(Si), and vs.
depth. Adjusted R2¼0.32 for the overall fit with N¼262 data points.
DIN¼NO3þNO2þNH4. Individual regression coefficients and their standard errors
are listed in the table. The individual regression coefficients are tested with a t-
test, and t-value and p-value from the test are also listed in the table. Normality of
error is demonstrated by the Kolmogorov–Smirnov test.
Variable Regression
coefficient
Standard
error
t-value p-value
(t-test)
Temperature
(1C)
�0.0161 0.0045 �3.52 0.00050
log10(DIN
(mmol/kg))
0.131 0.061 2.13 0.034
log10(PO4
(mmol/kg))
0.274 0.127 2.16 0.031
log10(Si
(mmol/kg))
�0.120 0.075 �1.61 0.11
Depth (db) �0.00164 0.00065 �2.54 0.012
K.M. Hilligsøe et al. / Deep-Sea Research I 58 (2011) 826–838832

Author's personal copy
As noted above, we did find a weakly significant relationshipbetween community size structure and both the total DIN andphosphate concentrations.
By dividing the data into groups with the highest and thelowest concentrations of phosphate and DIN, respectively, wewere able to conduct further analyses that elucidated the poten-tial interaction between nutrients and temperature on phyto-plankton community size structure. To investigate whether therewas a significant coupling between temperature and total DINand/or phosphate, we split the data into two approximately equalsized groups representing the samples with the highest and thelowest concentrations of phosphate, (i.e. Z ando0.29 mmol/kg)and performed an analysis of covariance. The relationshiplog10(fraction of phytoplankton410 mm)¼bi � temperatureþai
between community size and temperature was significant forboth the highest and the lowest concentrations of phosphategroups (po0.001). The slopes of the lines describing therelationship for the two subgroups were bPO4 Z0:29 mmol=kg¼
�0.019970.0039 (N¼129) and bPO4 o0:29 mmol=kg¼�0.019470.0039 (N¼133), and the lines could best be described as parallel(F-statistic F¼0.0; p¼0.95). Finally, we found that the data werebetter described by two parallel lines than by a single line(F-statistic F¼27.2; po0.001)), corresponding to the inter-cepts (aPO4 Z0:29 mmol=kg ¼20:86770:070 and aPO4 o0:29 mmol=kg ¼
20:54370:070). These intercepts were found to be significantlydifferent.
Similarly, we split the data into two approximately equallysized groups representing the samples with the highest and thelowest concentrations of DIN (i.e. Z and o2.7 mmol/kg) andperformed the same analyses. The relationship log10(fraction ofphytoplankton410 mm)¼bi � temperatureþai between commu-nity size and temperature was significant for both the highest andthe lowest concentrations of DIN groups (po0.005). The slopes ofthe lines describing the relationship for the two subgroups were
b(DINZ2.7 mmol/kg)¼–0.021070.0042 (N¼132) and b(DINo2.7 mmol/
kg)¼–0.026570.0042 (N¼130) and the lines could best bedescribed as parallel (F¼0.43; p¼0.51). Finally, the intercepts(aDINZ2.7 mmol/kg¼–0.68370.074 and aDINo2.7 mmol/kg¼�0.58370.074) were found to be significantly different (F-statistic F¼8.1;po0.005).
The analyses imply that there is strong temperature effect on thecell size, and the fact that the data can be described by two parallellines implies that there is an interaction between temperature andnutrients (both DIN and phosphate). Consequently, both nutrientsand temperature emerge from this analysis as being importantparameters for predicting the fraction of cells larger than 10 mm.The analysis does not, however, allow us to separate and quantify theindividual effects of temperature and nutrient availability, separately,on phytoplankton community size structure.
3.2. The relationship between mesozooplankton production and
temperature
The fraction of the total abundances of calanoid and cyclopoidcopepods made up of nauplii (used here as a proxy for mesozoo-plankton production) also decreased significantly (po0.005, N¼45)with increase in temperature (Fig. 3). There is no normality of errorwhen doing linear regression of mesozooplankton production vs. cellsize. Instead, the samples were grouped into two approximatelyequal sized groups with small and large cell sizes (i.e. the fraction ofphytoplankton larger than 10 mm have values o and 4 0.45individually in the two groups); we find that the mesozooplantkonproduction is significantly lower in the group with the smallestphytoplankton cell size (p¼0.036 Kruskal–Wallis).
3.3. Export production and sea–air CO2 flux
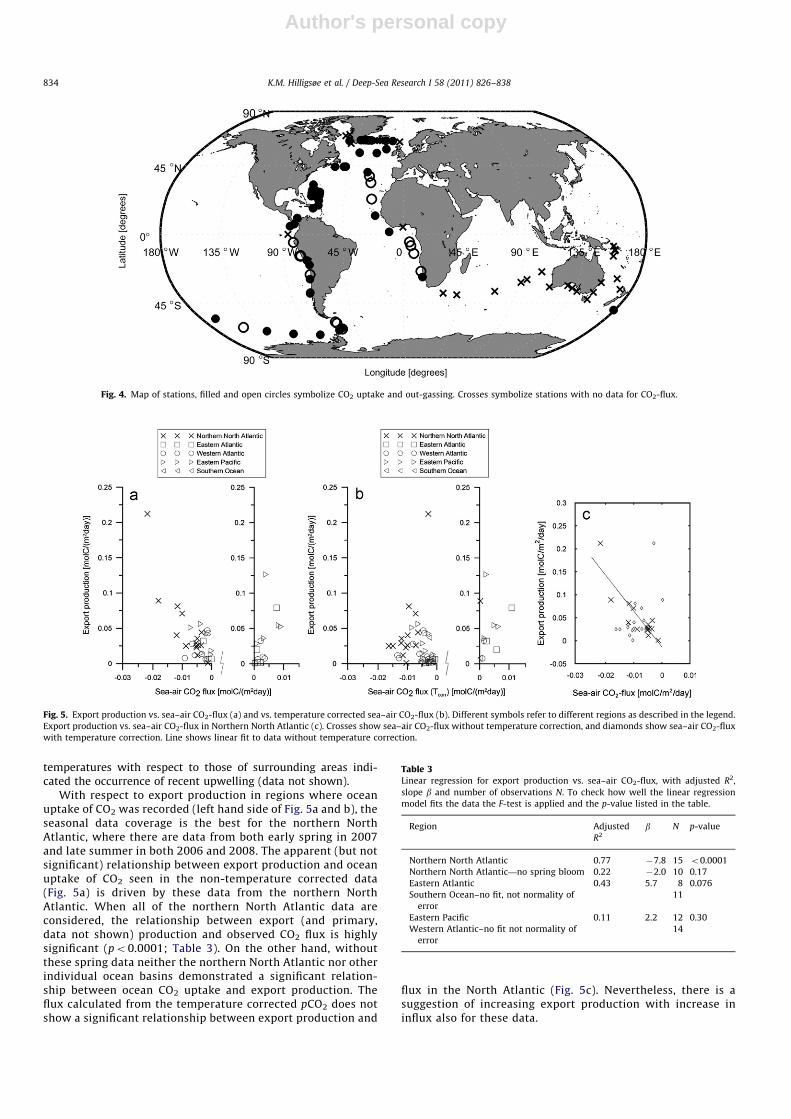
Fig. 4 illustrates the position of stations indicating, respec-tively, out-gassing or uptake of CO2. Export production is plottedas a function of this out-gassing or uptake (i.e. sea–air CO2 flux) inFig. 5a (observed flux) and Fig. 5b (temperature corrected flux).There is a suggestion of increased export production with increasein ocean out-gassing of CO2 (right hand side of both the figures).For most of the stations where out-gassing was observed, surface
Fig. 2. Fraction of phytoplankton 410 mm vs. temperature using the global data
set plotted in four temperature intervals. Data in each interval extend up to but do
not include the highest temperature indicated. In each of the temperature
intervals shown, the median of the data is indicated in the center of the box
and the edges of the box are the 25th and 75th percentiles; the whiskers extend to
the most extreme data points not considered outliers, and outliers are plotted
individually. An analysis of the 4 intervals shows that the median of the
phytoplankton size is significantly different (Kruskal–Wallice test po0.005) and
decreasing with temperature. The only exception is the median of phytoplankton
size in the intervals [14:22] and [22:30.1] 1C, which is not significantly different
(p¼0.34).
Fig. 3. The contribution of calanoid and cyclopoid copepod nauplii to the total
abundance is used as a proxy for secondary production, here shown as a function
of temperature using the global data set (N¼45).
K.M. Hilligsøe et al. / Deep-Sea Research I 58 (2011) 826–838 833
Author's personal copy
temperatures with respect to those of surrounding areas indi-cated the occurrence of recent upwelling (data not shown).
With respect to export production in regions where oceanuptake of CO2 was recorded (left hand side of Fig. 5a and b), theseasonal data coverage is the best for the northern NorthAtlantic, where there are data from both early spring in 2007and late summer in both 2006 and 2008. The apparent (but notsignificant) relationship between export production and oceanuptake of CO2 seen in the non-temperature corrected data(Fig. 5a) is driven by these data from the northern NorthAtlantic. When all of the northern North Atlantic data areconsidered, the relationship between export (and primary,data not shown) production and observed CO2 flux is highlysignificant (po0.0001; Table 3). On the other hand, withoutthese spring data neither the northern North Atlantic nor otherindividual ocean basins demonstrated a significant relation-ship between ocean CO2 uptake and export production. Theflux calculated from the temperature corrected pCO2 does notshow a significant relationship between export production and
flux in the North Atlantic (Fig. 5c). Nevertheless, there is asuggestion of increasing export production with increase ininflux also for these data.
Fig. 4. Map of stations, filled and open circles symbolize CO2 uptake and out-gassing. Crosses symbolize stations with no data for CO2-flux.
Fig. 5. Export production vs. sea–air CO2-flux (a) and vs. temperature corrected sea–air CO2-flux (b). Different symbols refer to different regions as described in the legend.
Export production vs. sea–air CO2-flux in Northern North Atlantic (c). Crosses show sea–air CO2-flux without temperature correction, and diamonds show sea–air CO2-flux
with temperature correction. Line shows linear fit to data without temperature correction.
Table 3Linear regression for export production vs. sea–air CO2-flux, with adjusted R2,
slope b and number of observations N. To check how well the linear regression
model fits the data the F-test is applied and the p-value listed in the table.
Region Adjusted
R2b N p-value
Northern North Atlantic 0.77 �7.8 15 o0.0001
Northern North Atlantic—no spring bloom 0.22 �2.0 10 0.17
Eastern Atlantic 0.43 5.7 8 0.076
Southern Ocean–no fit, not normality of
error
11
Eastern Pacific 0.11 2.2 12 0.30
Western Atlantic–no fit not normality of
error
14
K.M. Hilligsøe et al. / Deep-Sea Research I 58 (2011) 826–838834
Author's personal copy
3.4. Export production, water column chlorophyll and
phytoplankton community size structure
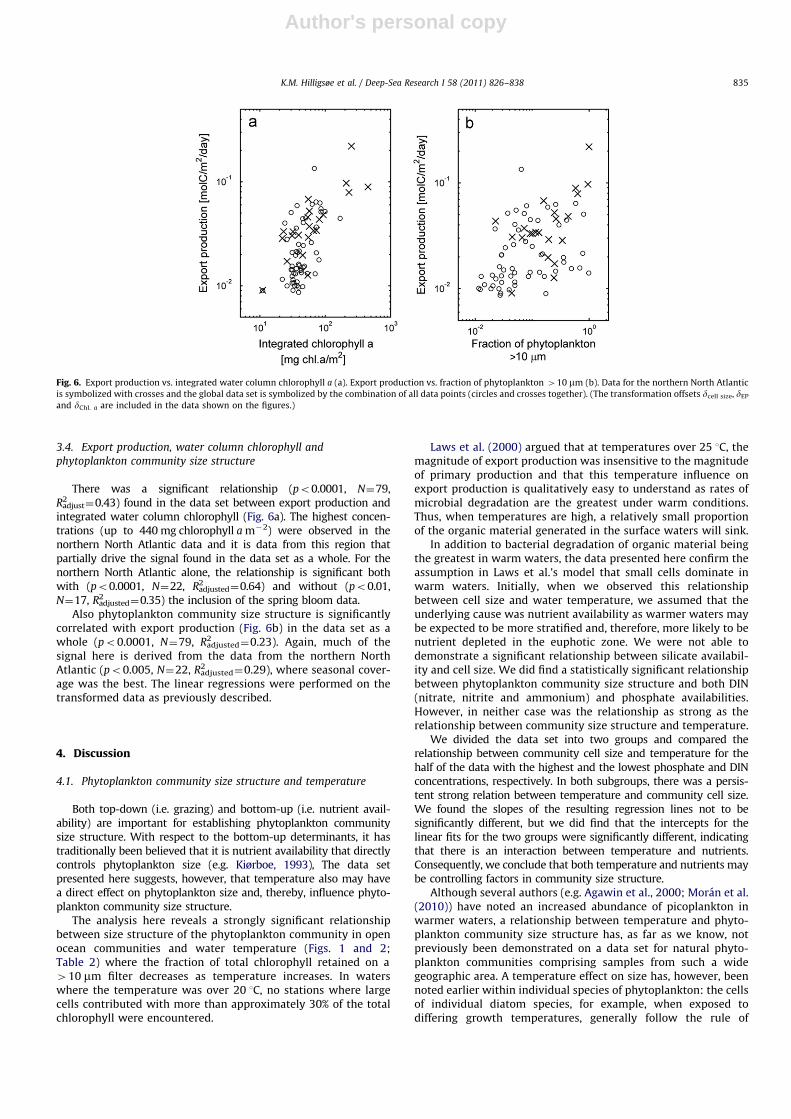
There was a significant relationship (po0.0001, N¼79,R2
adjust¼0.43) found in the data set between export production andintegrated water column chlorophyll (Fig. 6a). The highest concen-trations (up to 440 mg chlorophyll a m�2) were observed in thenorthern North Atlantic data and it is data from this region thatpartially drive the signal found in the data set as a whole. For thenorthern North Atlantic alone, the relationship is significant bothwith (po0.0001, N¼22, R2
adjusted¼0.64) and without (po0.01,N¼17, R2
adjusted¼0.35) the inclusion of the spring bloom data.Also phytoplankton community size structure is significantly
correlated with export production (Fig. 6b) in the data set as awhole (po0.0001, N¼79, R2
adjusted¼0.23). Again, much of thesignal here is derived from the data from the northern NorthAtlantic (po0.005, N¼22, R2
adjusted¼0.29), where seasonal cover-age was the best. The linear regressions were performed on thetransformed data as previously described.
4. Discussion
4.1. Phytoplankton community size structure and temperature
Both top-down (i.e. grazing) and bottom-up (i.e. nutrient avail-ability) are important for establishing phytoplankton communitysize structure. With respect to the bottom-up determinants, it hastraditionally been believed that it is nutrient availability that directlycontrols phytoplankton size (e.g. Kiørboe, 1993), The data setpresented here suggests, however, that temperature also may havea direct effect on phytoplankton size and, thereby, influence phyto-plankton community size structure.
The analysis here reveals a strongly significant relationshipbetween size structure of the phytoplankton community in openocean communities and water temperature (Figs. 1 and 2;Table 2) where the fraction of total chlorophyll retained on a410 mm filter decreases as temperature increases. In waterswhere the temperature was over 20 1C, no stations where largecells contributed with more than approximately 30% of the totalchlorophyll were encountered.
Laws et al. (2000) argued that at temperatures over 25 1C, themagnitude of export production was insensitive to the magnitudeof primary production and that this temperature influence onexport production is qualitatively easy to understand as rates ofmicrobial degradation are the greatest under warm conditions.Thus, when temperatures are high, a relatively small proportionof the organic material generated in the surface waters will sink.
In addition to bacterial degradation of organic material beingthe greatest in warm waters, the data presented here confirm theassumption in Laws et al.’s model that small cells dominate inwarm waters. Initially, when we observed this relationshipbetween cell size and water temperature, we assumed that theunderlying cause was nutrient availability as warmer waters maybe expected to be more stratified and, therefore, more likely to benutrient depleted in the euphotic zone. We were not able todemonstrate a significant relationship between silicate availabil-ity and cell size. We did find a statistically significant relationshipbetween phytoplankton community size structure and both DIN(nitrate, nitrite and ammonium) and phosphate availabilities.However, in neither case was the relationship as strong as therelationship between community size structure and temperature.
We divided the data set into two groups and compared therelationship between community cell size and temperature for thehalf of the data with the highest and the lowest phosphate and DINconcentrations, respectively. In both subgroups, there was a persis-tent strong relation between temperature and community cell size.We found the slopes of the resulting regression lines not to besignificantly different, but we did find that the intercepts for thelinear fits for the two groups were significantly different, indicatingthat there is an interaction between temperature and nutrients.Consequently, we conclude that both temperature and nutrients maybe controlling factors in community size structure.
Although several authors (e.g. Agawin et al., 2000; Moran et al.(2010)) have noted an increased abundance of picoplankton inwarmer waters, a relationship between temperature and phyto-plankton community size structure has, as far as we know, notpreviously been demonstrated on a data set for natural phyto-plankton communities comprising samples from such a widegeographic area. A temperature effect on size has, however, beennoted earlier within individual species of phytoplankton: the cellsof individual diatom species, for example, when exposed todiffering growth temperatures, generally follow the rule of
Fig. 6. Export production vs. integrated water column chlorophyll a (a). Export production vs. fraction of phytoplankton 410 mm (b). Data for the northern North Atlantic
is symbolized with crosses and the global data set is symbolized by the combination of all data points (circles and crosses together). (The transformation offsets dcell size, dEP
and dChl. a are included in the data shown on the figures.)
K.M. Hilligsøe et al. / Deep-Sea Research I 58 (2011) 826–838 835
Author's personal copy
decreasing cell size with increasing temperatures in the samemanner as other ectotherms (Atkinson, 1994, 1995). We note,though, that no satisfactory explanation for this observation hasyet been offered (Montagnes and Franklin, 2001).
Following the logic of Laws et al. (2000), we suggest that onepossible explanation for the observed temperature response inphytoplankton community size structure could be the increase incompetition with heterotrophs for access to nutrients with increasein temperature. Surface to volume ratio has long been argued to beimportant for nutrient uptake (e.g. Kiørboe, 1993), where small cellsare believed to have a competitive advantage under limiting nutrientconditions. As heterotrophic activity increases with increase intemperature, one could envision that increased competition betweenphytoplankton and heterotrophs for nutrients might lead to phyto-plankton communities dominated by small cells. That Moran et al.(2010) recorded a marked increase in abundance of bacterioplanktonconcomitant with a decrease in nanoplankton and an increase inpicoplankton as temperatures increased and salinity decreased intheir study in Arctic waters confirms that bacteria populations undernatural conditions respond to even small temperature changes. Alsoother heterotrophs than bacteria potentially compete with photo-trophic phytoplankton for nutrients. Rose and Caron (2007) reviewedthe relationship between the growth rate of herbivorous protists andthe temperature and found the growth rates of the heterotrophs tobe more sensitive to temperature than those of photoautotrophs.They also found that maximum growth rates of herbivorous protistsequaled or exceeded those of photoautotrophs at temperatures over15 1C. Thus, it appears that increasing temperatures are likely toincrease nutrient competition between photoautotrophic phyto-plankton and heterotrophs and it is possible that the decrease insize noted for phytoplankton with increasing temperature may be aconsequence of this increased competition.
Regardless of the cause, a decrease in phytoplankton size withwater temperature will have consequences on the sinking rateand the magnitude of export production. Surface ocean tempera-tures have been documented to be increasing (Domingues, et al.,2008; Levitus et al., 2009) in response to changes in the climatesystem. Our data suggest that the temperature increases recordedand those expected in the future potentially impact the sizestructure of the phytoplankton community and, thus, the magni-tude of export production.
In addition to sinking rate, there are also differences betweenlarge and small phytoplankton cells with respect to their produc-tion of dissolved organic material. The importance of cell size forexport production has previously been included in organic carbonexport models such that small cell sizes imply a relatively higherproduction of dissolved organic carbon compared to particulateorganic carbon (i.e. Laws et al., 2000). The global export ofdissolved organic carbon has been estimated to be about0.17 Pg C yr�1 (Hansell and Carlson, 1998), corresponding toabout 10–20% of the global export production of about 10 PgC yr�1 (Dunne et al., 2007). Therefore, a relative increase in smallphytoplankton cell sizes in a warmer ocean could affect the globalcarbon export significantly through an increased dissolvedorganic carbon export and, thereby, a shallower remineralizationof organic carbon.
Correspondingly, a temperature influence on phytoplankton sizehas implications for the particulate organic carbon export duringcolder climatic regimes where colder surface water would increasephytoplankton cell sizes and, potentially, increase deep-sea organicmatter sedimentation, in accordance with analysis of glacial sedi-ments (Kohfeld et al., 2005). However, the explicit relationshipbetween phytoplankton cell size and remineralization depth of thesinking particulate organic carbon flux is complex and involves otherfactors such as the formation of aggregates and the particlesassociated content of mineral particles (De La Rocha and Passow,
2007). Thus, the potential consequences of a change in phytoplank-ton size for the remineralization depth of particulate organic carbonneed to be further examined.
4.2. Temperature and mesozooplankton production
Not only biogeochemical fluxes but also food web structurecan be expected to be impacted when small cells become moredominant in phytoplankton communities (e.g. Cushing, 1989;Kiørboe, 1993). To examine whether there was a global patternin the structure of plankton food webs in relation to temperatureor phytoplankton cell size, we here used a proxy for mesozoo-plankton production (the number of calanoid and cyclopoidnauplii as a percentage of the total number of calanoid andcyclopoid copepods recorded at a station/depth strata). The dataset is smaller than the data set pertaining to phytoplankton,which impacts the statistical significance of the analyses.
Nevertheless, a strongly significant relationship was found inthe data set between mesozooplankton production and tempera-ture. Mesozooplankton production also was found to be signifi-cantly lower when the phytoplankton community was dominatedby small cells than when it was dominated by large. It has oftenbeen demonstrated that phytoplankton cell size is an importantfactor in determining copepod production as the ability of theseorganisms to retain small particles in the feeding apparatus islimited (Bergreen et al., 1988, Kiørboe and Nielsen, 1994). Thus,the copepod community in warmer waters, where small phyto-plankton become dominant, can be predicted to be less produc-tive than copepod communities in colder waters because thecopepods have to rely on microzooplankton to make the primaryproduction available to them (Satapoomin et al., 2004). Conse-quently, a relatively larger fraction of the phytoplankton inwarmer waters is recycled in the surface layer through themicrobial food web rather than being sequestered to the deepwater as large fast sinking fecal pellets (Møller et al., 2011).
4.3. Export production and phytoplankton community size structure
The significant correlation between phytoplankton communitysize structure and export production noted here is in accordancewith the general understanding of how export production is regu-lated by ecosystem function in the euphotic zone, although fewobservations have confirmed such a connection directly. Phytoplank-ton size classes are, for example, included in the export productionmodel of Laws et al. (2000) where large and small phytoplanktoncompartments constitute the ecosystem and the large compartmenthas relatively few trophic levels between primary production andexport in contrast to the small phytoplankton group where severaltrophic levels leads to a reduction in the f-ratio. Their model is usedto calculate export production in our study and, although the modelonly uses primary production and temperature as state variables, ourresults showing a correlation to phytoplankton size is seen to be invery good accordance with their assumptions.
In addition to phytoplankton cells and aggregates, however, manyother factors are assumed to affect export of organic material, i.e.ballasting minerals as silica, calcium carbonate and lithogenicmaterial (see review in Boyd and Trull, 2007) and, therefore, a simplerelationship between size classes and EP is not expected. Recentanalysis of direct observations by underwater video profiling ofparticle sizes in the mesopelagic zone (400 m) showed a significantrelationship to size structure in the surface phytoplankton commu-nity, where communities dominated by picophytoplankton had asmaller export than communities dominated by microphytoplankton(Guidi et al., 2009). Our results are in good accordance with thesefindings. That a relationship between the size structure of thephytoplankton community and export production is found here
K.M. Hilligsøe et al. / Deep-Sea Research I 58 (2011) 826–838836

Author's personal copy
emphasizes the potential importance of biological diversity andactivity in controlling the capacity of the ocean to serve as a naturalcarbon sink.
4.4. Phytoplankton activity and sea–air CO2 flux
There is also a suggestion in the data presented here thatbiological activity and diversity may be important factors indetermining the magnitude of sea–air CO2 flux. With relativelyfew data points in each ocean basin, temperature correction ofsurface pCO2 can only be achieved by drawing on publisheddatabases describing annual seasonal temperature and pCO2
patterns. These databases present data averaged over relativelylarge ocean regions and, in using them to temperature correct thedata collected here, we potentially introduce significant error. We,therefore, present export production as a function of both theactual flux we measured during the cruises and as a function oftemperature corrected flux. In the non-corrected data, a verysignificant (po0.0001) relationship between export productionand CO2 flux was noted for the northern North Atlantic. Therelationship is driven by the spring bloom measurements madehere. However, even when the two highest points are removedfrom the statistical analysis, the relationship is still very signifi-cant (po0.005). In no other ocean basin was such a relationshipnoted. This may, however, be due to the limited seasonaldistribution of data from the other ocean basins.
Temperature correction of the data changed the relative positionof two data points from stations located in the large temperaturegradient area between water masses from the North Atlantic andLabrador currents (Fig. 5b and c). The temperature correction, itself,could therefore introduce large errors into the data analysis, whichare difficult to assess, in particular in this region.
In the temperature corrected data, the significant relationshipbetween export production and sea–air CO2 flux is no longer presentand seasonal temperature changes should, therefore, be consideredas a possible explanation for the observed relationship.
Nevertheless, the very strong relationship between exportproduction (and thereby size structure in the phytoplanktoncommunity) and our sea–air CO2 flux in the northern NorthAtlantic suggest that the potential role of phytoplankton activityand diversity in driving this flux at different times of the yearshould be investigated further especially given that two recentstudies (Takahashi et al. (2009); Kortzinger et al. (2008)) suggestthat some anomalies in the pCO2 data they present for the NorthAtlantic might possibly be explained by biological activity.
The data presented here also indicate a positive relationshipbetween out-gassing of CO2 from the surface ocean and thephytoplankton photosynthesis/export production in some oceanbasins. This relationship was expected, as out-gassing is oftenassociated with upwelling of nutrient-rich bottom water to thesurface and the introduction of nutrients to the surface layer canstimulate phytoplankton activity.
5. Conclusions
Given the importance of the ocean as a natural carbon sink and,not least of which the suggestion that this sink may be weakening (LeQuere et al., 2009), there is concerted research effort being devoted toquantifying the factors influencing the function of this sink and howthese factors may be altered by changing ocean conditions. This studysuggests that temperature may have a direct effect on phytoplanktonsize and, thus, community size structure. The data set demonstratesthat small cells become increasingly dominant in the communitywith increasing temperatures over a temperature range from o0 to430 1C. Inorganic nutrient availability and temperature in surface
waters of the ocean co-vary and it is traditionally assumed thatphytoplankton size is directly controlled by nutrient availability. Theanalyses presented here, however, indicate that there may also be adirect effect of temperature on phytoplankton size. This suggests anincrease in dominance of small cells in ocean phytoplankton com-munities in response to global ocean warming which, in turn, willimpact plankton food web structure as well as impact the ocean’scapacity to function as a natural carbon sink.
Acknowledgments
The present investigation was supported by Nordea Fund,Villum Kann Rasmussen Fund, Carlsberg Fund, Knud PetersenFund, The Danish Expedition Fund, The Danish Research Councilfor Nature and Universe and our respective institutions. Thepresent work was carried out as part of the Galathea3 expeditionunder the auspices of the Danish Expedition Foundation. This isGalathea3 contribution no. P82.
References
Agawin, N.S.R., Duarte, C.M., Agustı�, S., 2000. Nutrient and temperature control ofthe contribution of picoplankton to phytoplankton biomass and production.Limnology and Oceanography 45 (3), 591–600.
Atkinson, D., 1994. Temperature and organism size – a biological law forectotherms? Advances in Ecological Research 25, 1–58.
Atkinson, D., 1995. Effects of temperature on the size of aquatic ectotherms:exceptions to the general rule. Journal of Thermal Biology. doi:10.1016/0306–4565(94)00028-H.
Bennington, V., McKinley, G.A., Dutkiewicz, S., Ullman, D., 2009. What doeschlorophyll variability tell us about export and air–sea CO2 flux variability inthe North Atlantic? Global Biogeochemical Cycles 23, GB3002. doi:10.1029/2008GB003241.
Berggreen, U., Hansen, B., Kiørboe, T., 1988. Food size spectra, ingestion andgrowth of the copepod Acartia tonsa during development: implications fordetermination of copepod production. Marine Biology 99, 341–352.
Boyd, P.W., Trull, T.W., 2007. Understanding the export of biogenic particles inoceanic waters: is there consensus? Progress in Oceanography 72, 276–312.
Cushing, D.H., 1989. A difference in structure between ecosystems in stronglystratified waters and those that are only weakly stratified. Journal of PlanktonResearch 11, 1–13.
De La Rocha, C.L., Passow, U., 2007. Factors influencing the sinking of POC and theefficiency of the biological pump. Deep Sea Research II 54, 639–658.
Dickson, A.G., Goyet C. (Eds.), 1994. Handbook of Methods for the Analysis of theVarious Parameters of the Carbon Dioxide System in Sea Water, version 2,ORNL/CDIAC-74.
Domingues, C.M., Church, J.A., White, N.J., Gleckler, P.J., Wijffels, S.E., Barker, P.M.,Dunn, J.R., 2008. Improved estimates of upper-ocean warming and multi-decadal sea-level rise. Nature 453, 1090–1094.
Dunne, J.P., Sarmiento, J.L., Gnadadesikan, A., 2007. A synthesis of global particleexport from the surface ocean and cycling through the ocean interior and onthe seafloor. Global Biogeochemical Cycles 21, GB4006. doi:10.1029/2006GB002907.
Finkel, Z.V., Sebbo, J., Feist-Burkhardt, S., Irwin, A.J., Katz, M.E., Schofield, O.M.E.,Young, J.R., Falkowski, P.G., 2007. A universal driver of macroevolutionarychange in the size of marine phytoplankton over the. Cenozoic Proceedings ofthe National Academy of Science 104 (51), 20416–20420. doi:10.1073/pnas.0709381104 published ahead of print.
Grasshoff, K., Erhardt, M., Kremling, K., 1983. Methods of Seawater Analysis, 2.Revision. Verlag Chemie, Weinheim.
Guidi, L., Stemmann, L., Jackson, G.A., Ibanez, F., Claustre, H., Legendre, L., Picheral, M.,Gorsky, G.l, 2009. Effects of phytoplankton community on production, size andexport of large aggregates: a world-ocean analysis. Limnology and Oceanogra-phy 54 (6), 1951–1963.
Hansell, D.A., Carlson, C.A., 1998. Net community production of dissolved organiccarbon. Global Biogeochemical Cycles 12, 443–453.
Kiørboe, T., 1993. Turbulence, phytoplankton cell size, and the structure of pelagicfood webs. Advances in Marine Biology 29, 1–72.
Kiørboe, T., Nielsen, T.G., 1994. Regulation of zooplankton biomass and productionin a temperate, coastal ecosystem. I. Copepods. Limnology and Oceanography39, 493–507.
Kohfeld, K.E., Quere, C.L., Harrison, S.P., Anderson, R.F., 2005. Role of the biology inglacial-interglacial CO2 cycles. Science 308, 74–78.
Kortzinger, A., Send, U., Lampitt, R.S., Hartman, S., Wallace, D.W.R., Karstensen, J.,Villagarcia, M.G., Llina�s, O., DeGrandpre, M.D., 2008. The seasonal pCO2 cycleat 49_N/16.5_W in the northeastern Atlantic Ocean and what it tells us aboutbiological productivity. Journal of Geophysical Reasearch 113, C04020.doi:10.1029/2007JC004347.
K.M. Hilligsøe et al. / Deep-Sea Research I 58 (2011) 826–838 837
Author's personal copy
Khatiwala, S., Primeau, F., Hall, T., 2009. Reconstruction of anthropogenic CO2
concentrations in the ocean. Nature 462, 346–349.Laws, E.A., Falkowski, P.G., Smith Jr., W.O., Ducklow, H., McCarthy, J.J., 2000.
Temperature effects on export production in the open ocean. Global Biogeo-chemical Cycles 14, 1231–1246.
Levitus, S., Antonov, J.I., Boyer, T.P., Locarnini, R.A., Garcia, H.E., Mishonov, A.V.,2009. Global ocean heat content 1955–2008 in light of recently revealedinstrumentation problems. Geophysical Research Letters 36, L07608.
Le Quere, C., Raupach, M.R., Canadell, J.G., Marland, G., Bopp, L., Ciais, P., Conway, T.J.,Doney, S.C., Feely, R.A., Foster, P., Friedlingstein, P., Gurney, K., Houghton, R.A.,House, J.I., Huntingford, C., Levy, P.E., Lomas, M.R., Majkut, J., Metzl, N., Ometto, J.P.,Peters, G.P., Prentice, I.C., Randerson, J.T., Running, S.W., Sarmiento, J.L., Schuster,U., Sitch, S., Takahashi, T., Viovy, N., van der Werf, G.R., Woodward, F.I., 2009.Trends in the sources and sinks of carbon dioxide. Nature Geoscience 2, 831–836.
Li, W.K.W., McLaughlin, F.A., Lovejoy, C., Carmack, E.C., 2009. Smallest algae thriveas the Arctic ocean freshens. Science 326, 539.
Liss, P.S., Merlivat, L., 1986. Air-sea gas exchange rates: introduction and synthesis.In: Buat-Menard, P. (Ed.), The Role of Air–Sea Exchange in GeochemicalCycling. Springer, New York, pp. 113–127.
Locarnini, R.A., Mishonov, A.V., Antonov, J.I., Boyer, T.P., Garcia, H.E., Baranova,O.K., Zweng, M.M., Johnson, D.R., 2010. World Ocean Atlas 2009. In: Levitus,Temperature.S (Ed.), NOAA Atlas NESDIS 68, vol. 1. U.S. Government PrintingOffice, Washington, D.C, pp. 184.
Montagnes, D.J.S., Franklin, D.J., 2001. Effect of temperature on diatom volume,growth rate, and carbon and nitrogen content: reconsidering some paradigms.Limnology and Oceanography 46 (8), 2008–2018.
Moran, X.A., Lopez-Urrutia, A., Calvo-Dıaz, Li, W.K.W., 2010. Increasing importanceof small phytoplankton in a warmer ocean. Global Change Biology 16,1137–1144. doi:10.1111/j.1365-2486.2009.01960.x.
Møller, E.F., Andersen, C.M., Jaspers, C., Satapoomin, Jonasdottir S, S Nielsen, T.G.,2011. Production and vertical export of copepod fecal pellets in the southernIndian Ocean. Marine Biology 158 (3), 677–688.
Nightingale, P.D., Malin, G., Law, C.S., Watson, A.J., Liss, P.S., Liddicoat, M.I., Boutin, J.,Upstill-Goddard, R.C., 2000. In situ evaluation of air–sea gas exchange
parameterizations using novel conservative and volatile tracers. Global Biogeo-chemical Cycles. 14, 373–387.
Platt, T., Gallegos, C.L., Harrison, W.G., 1980. Photoinhibition of photosynthesis innatural assemblages of marine phytoplankton. Journal of Marine Research 38,687–701.
Rose, J.M., Caron, D.A., 2007. Does low temperature constrain the growth rates ofheterotrophic protists? Evidence and implications for algal blooms in coldwaters. Limnology and Oceanography 52 (2), 8886–8895.
Sabine, C.L., Feely, R.A., Gruber, N., Key, R.M., Lee, K., Bullister, J.L., Wanninkhof, R.,Wong, C.S., Wallace, D.W.R., Tilbrook, B., Millero, F.J., Peng, T.-H., Kozyr, A., Ono,T., Rios, A.F., 2004. The oceanic sink for anthropogenic CO2. Science 305, 367.
Sarmiento, J.L., Hughes, T.M.C., Stouffer, R.J., Manabe, S., 1998. Simulated responseof the ocean carbon cycle to anthropogenic climate warming. Nature 393,245–249.
Satapoomin, S., Nielsen, T.G., Hansen, P.J., 2004. Andaman Sea copepods: spatio-temporal variations in biomass and production, and role in the pelagic foodweb. Marine Ecology Progress Series 274, 99–122.
Steemann Nielsen, E., 1952. The use of radio-active carbon (C14) for measuringorganic production in the sea. Journal du conseil/Conseil international pour l’exploration de la mer 18, 117–140.
Takahashi, T., Sutherland, S.C., Sweeney, C., Poisson, A., Metzl, N., Tillbrook, B.,Bates, N., Wanninkhof, R., Feely, R.A., Sabine, C., Olafsson, J., Nojiri, Y., 2002.Global sea–air CO2 flux based on climatological surface ocean pCO2, andseasonal biological and temperature effects. Deep-Sea Research II 49,1601–1622.
Takahashi, T., Sutherland, S.C., Wanninkhof, R., Sweeney, C., Feely, R.A., Chipman, D.W.,Hales, B., Friederich, G., Chavez, F., Sabine, C., Watson, A., Bakker, D.C.E., Schuster,U., Metzl, N., Yoshikawa-Inoue, H., Ishii, M., Midorikawa, T., Nojiri, Y., Kortzinger, A.,Steinhoff, T., Hoppema, M., Olafsson, J., Arnarson, T.S., Tilbrook, B., Johannessen, T.,Olsen, A., Bellerby, R., Wong, C.S., Delille, B., Bates, N.R., de Baar, H.J.W., 2009.Climatological mean and decadal change in surface ocean pCO2, and net sea–airCO2 flux over the global oceans. Deep-Sea Research II 56, 554–5772009.
Wanninkhof, R., 1992. Relationship between wind speed and gas exchange overthe ocean. Journal of Geophysical Research 97, 7373–7381.
K.M. Hilligsøe et al. / Deep-Sea Research I 58 (2011) 826–838838