This attachment contains the two most recent Senior ... · summary is to provide shareholders with...
30
This attachment contains the two most recent Senior Officer Fee Summaries for the Fund.
-
Upload
hoangkhuong -
Category
Documents
-
view
220 -
download
7
Transcript of This attachment contains the two most recent Senior ... · summary is to provide shareholders with...

This attachment contains the two most recent Senior Officer Fee Summaries for the Fund.
THE FOLLOWING IS NOT PART OF THE SHAREHOLDER REPORT OR THE FINANCIAL STATEMENTS
SUMMARY OF SENIOR OFFICER’S EVALUATION OF
INVESTMENT ADVISORY AGREEMENT1
The following is a summary of the evaluation of the Investment Advisory
Agreement between AllianceBernstein L.P. (the “Adviser”) and the AB Variable
Products Series Fund (the “Fund”), in respect of AB Growth and Income Portfolio (the
“Portfolio”).2 The evaluation of the Investment Advisory Agreement was prepared by
Philip L. Kirstein, the Senior Officer of the Fund, for the Directors of the Fund, as
required by a September 2004 agreement between the Adviser and the New York State
Attorney General (the “NYAG”). The Senior Officer’s evaluation of the Investment
Advisory Agreement is not meant to diminish the responsibility or authority of the Board
of Directors of the Fund to perform its duties pursuant to Section 15 of the Investment
Company Act of 1940 (the “40 Act”) and applicable state law. The purpose of the
summary is to provide shareholders with a synopsis of the independent evaluation of the
reasonableness of the advisory fees proposed to be paid by the Portfolio which was
provided to the Directors in connection with their review of the proposed approval of the
continuance of the Investment Advisory Agreement. The Senior Officer’s evaluation
considered the following factors:
1. Advisory fees charged to institutional and other clients of the Adviser
for like services;
1 The information in the fee summary was completed on April 21, 2016 and discussed with the Board of
Directors on May 3-5, 2016. 2 Future references to the Fund and the Portfolio do not include “AB.” References in the fee summary pertaining to performance and expense ratio rankings refer to the Class A shares of the Portfolio.

2
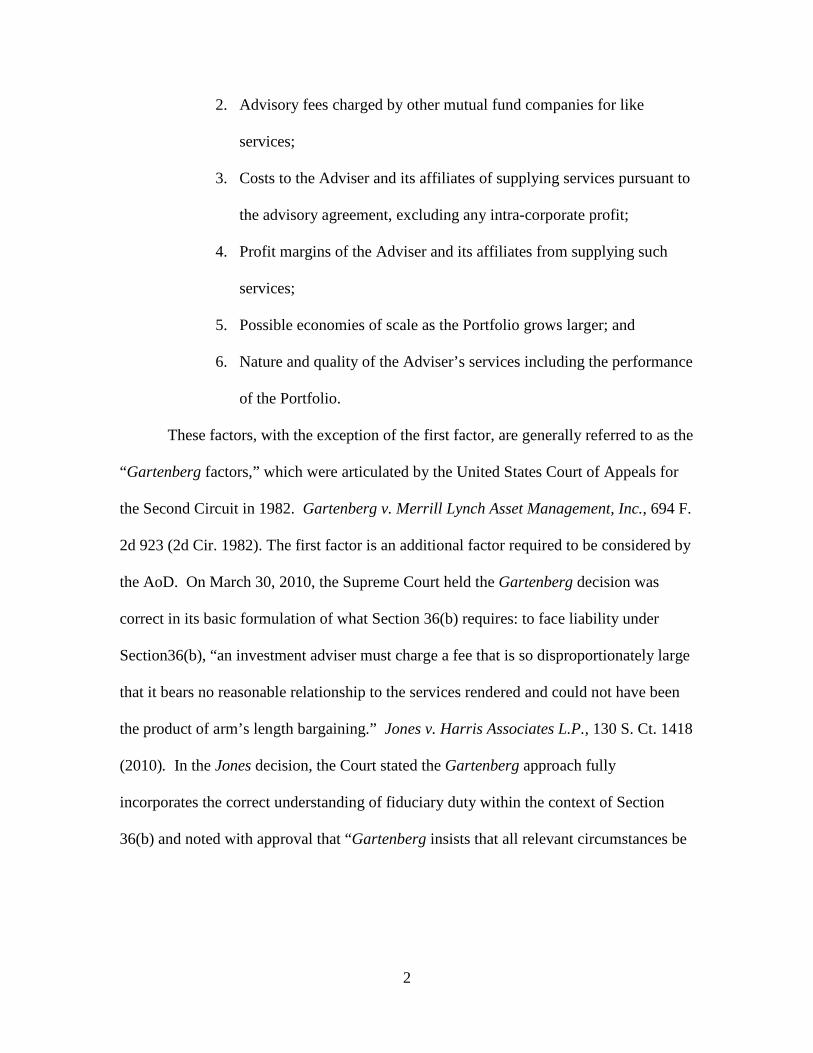
2. Advisory fees charged by other mutual fund companies for like
services;
3. Costs to the Adviser and its affiliates of supplying services pursuant to
the advisory agreement, excluding any intra-corporate profit;
4. Profit margins of the Adviser and its affiliates from supplying such
services;
5. Possible economies of scale as the Portfolio grows larger; and
6. Nature and quality of the Adviser’s services including the performance
of the Portfolio.
These factors, with the exception of the first factor, are generally referred to as the
“Gartenberg factors,” which were articulated by the United States Court of Appeals for
the Second Circuit in 1982. Gartenberg v. Merrill Lynch Asset Management, Inc., 694 F.
2d 923 (2d Cir. 1982). The first factor is an additional factor required to be considered by
the AoD. On March 30, 2010, the Supreme Court held the Gartenberg decision was
correct in its basic formulation of what Section 36(b) requires: to face liability under
Section36(b), “an investment adviser must charge a fee that is so disproportionately large
that it bears no reasonable relationship to the services rendered and could not have been
the product of arm’s length bargaining.” Jones v. Harris Associates L.P., 130 S. Ct. 1418
(2010). In the Jones decision, the Court stated the Gartenberg approach fully
incorporates the correct understanding of fiduciary duty within the context of Section
36(b) and noted with approval that “Gartenberg insists that all relevant circumstances be
3
taken into account” and “uses the range of fees that might result from arm’s-length
bargaining as the benchmark for reviewing challenged fees.”3
PORTFOLIO ADVISORY FEES, NET ASSETS & EXPENSE RATIOS
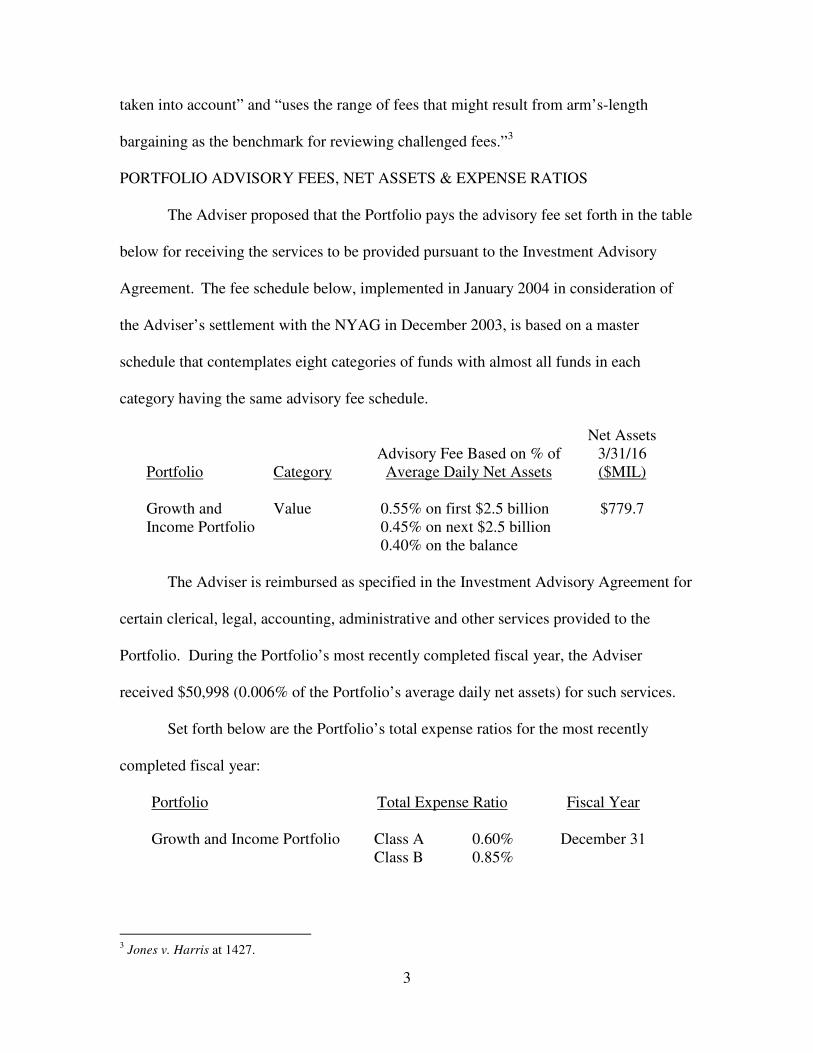
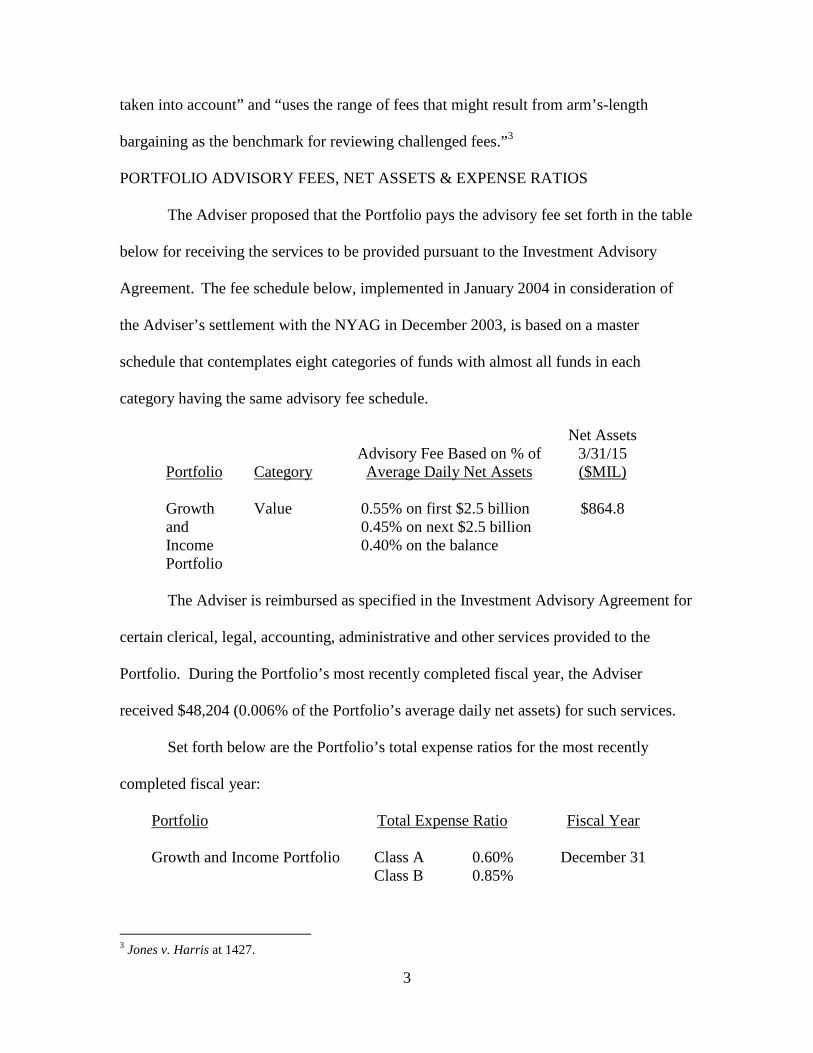
The Adviser proposed that the Portfolio pays the advisory fee set forth in the table
below for receiving the services to be provided pursuant to the Investment Advisory
Agreement. The fee schedule below, implemented in January 2004 in consideration of
the Adviser’s settlement with the NYAG in December 2003, is based on a master
schedule that contemplates eight categories of funds with almost all funds in each
category having the same advisory fee schedule.
Portfolio Category Advisory Fee Based on % of
Average Daily Net Assets
Net Assets 3/31/16 ($MIL)
Growth and Income Portfolio
Value 0.55% on first $2.5 billion 0.45% on next $2.5 billion 0.40% on the balance
$779.7
The Adviser is reimbursed as specified in the Investment Advisory Agreement for
certain clerical, legal, accounting, administrative and other services provided to the
Portfolio. During the Portfolio’s most recently completed fiscal year, the Adviser
received $50,998 (0.006% of the Portfolio’s average daily net assets) for such services.
Set forth below are the Portfolio’s total expense ratios for the most recently
completed fiscal year:
Portfolio Total Expense Ratio Fiscal Year Growth and Income Portfolio Class A
Class B 0.60% 0.85%
December 31
3 Jones v. Harris at 1427.
4
I. ADVISORY FEES CHARGED TO INSTITUTIONAL AND OTHER CLIENTS
The advisory fees charged to investment companies which the Adviser manages
and sponsors are normally higher than those charged to similar sized institutional
accounts, including pension plans and sub-advised investment companies. The fee
differential reflects, among other things, different services provided to such clients, and
different liabilities assumed. Services provided by the Adviser to the Portfolio that are
not provided to non-investment company clients and sub-advised investment companies
include providing office space and personnel to serve as Fund Officers, who among other
responsibilities make the certifications required under the Sarbanes–Oxley Act of 2002,
and coordinating with and monitoring the Portfolio’s third party service providers such as
Fund counsel, auditors, custodians, transfer agents and pricing services. The accounting,
administrative, legal and compliance requirements for the Portfolio are more costly than
those for institutional assets due to the greater complexities and time required for
investment companies, although as previously noted, the Adviser is reimbursed for
providing some of these services. Also, retail mutual funds managed by the Adviser are
widely held. Servicing the Portfolio’s investors is more time consuming and labor
intensive compared to institutional clients since the Adviser needs to communicate with a
more extensive network of financial intermediaries and shareholders. The Adviser also
believes that it incurs substantial entrepreneurial risk when offering a new mutual fund,
since establishing a new mutual fund requires a large upfront investment, and it may take
a long time for the fund to achieve profitability since the fund must be priced to scale
from inception in order to be competitive and assets are acquired one account at a time.
In addition, managing the cash flow of an investment company may be more difficult

5
than managing that of a stable pool of assets, such as an institutional account with little
cash movement in either direction, particularly, if a fund is in net redemption and the
Adviser is frequently forced to sell securities to raise cash for redemptions. However,
managing a fund with positive cash flow may be easier at times than managing a stable
pool of assets. In recent years, investment advisers have been sued by institutional clients
and have suffered reputational damage both by the attendant publicity and outcomes
other than complete victories. Accordingly, the legal and reputational risks associated
with institutional accounts are greater than previously thought, although still not equal to
those related to the mutual fund industry.
Notwithstanding the Adviser’s view that managing an investment company is not
comparable to managing other institutional accounts because the services provided are
different, the Supreme Court has indicated consideration should be given to the advisory
fees charged to institutional accounts that have a substantially similar investment style as
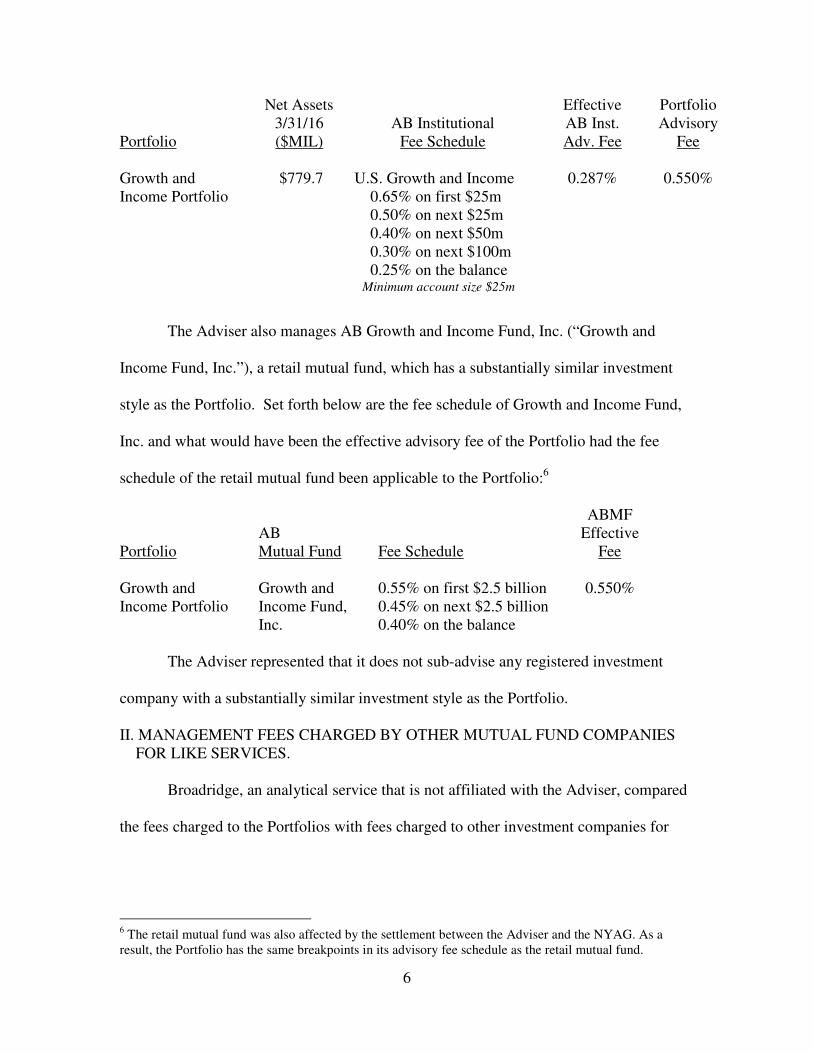
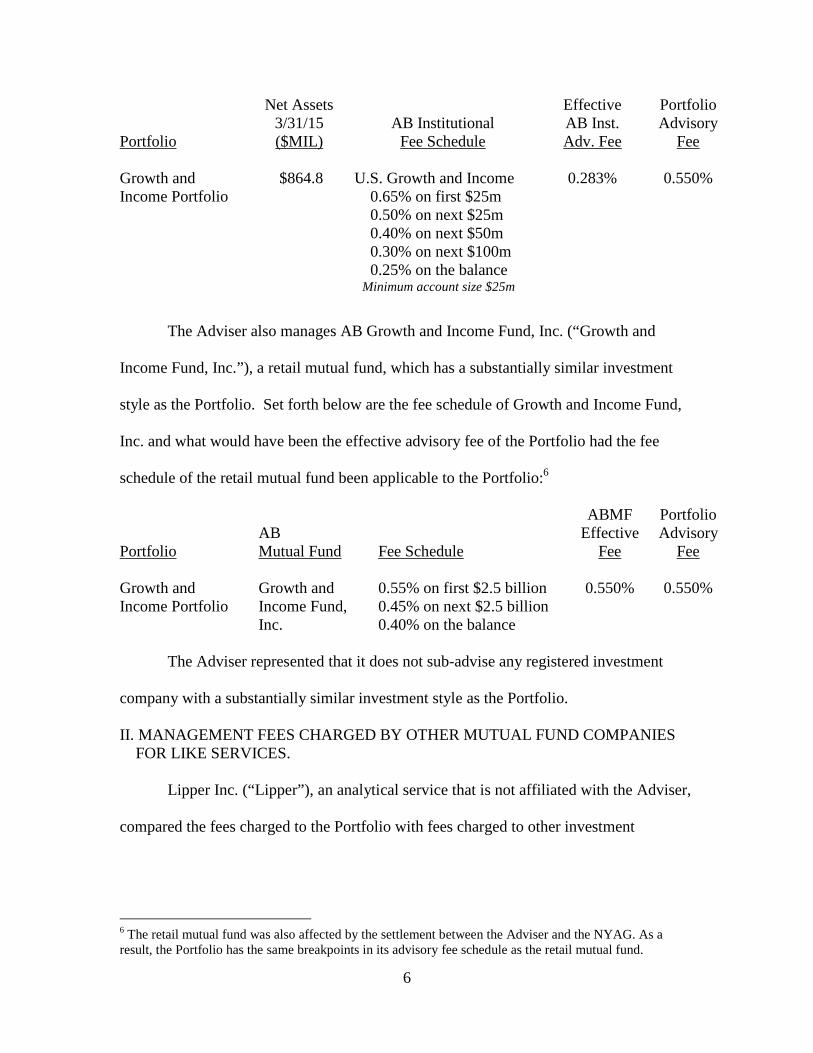
the Portfolio.4 In addition to the AB Institutional fee schedule, set forth below is what
would have been the effective advisory fee of the Portfolio had the AB Institutional fee
schedule been applicable to the Portfolio advisory fee based on March 31, 2016 net
assets:5
4 The Supreme Court stated that “courts may give such comparisons the weight that they merit in light of the similarities and differences between the services that the clients in question require, but the courts must be wary of inapt comparisons.” Among the significant differences the Supreme Court noted that may exist between services provided to mutual funds and institutional accounts are “higher marketing costs.” Jones v. Harris at 1428. 5 The Adviser has indicated that with respect to institutional accounts with assets greater than $300 million, it will negotiate a fee schedule. Discounts that are negotiated vary based upon each client relationship.
6
Portfolio
Net Assets 3/31/16 ($MIL)
AB Institutional
Fee Schedule
Effective AB Inst. Adv. Fee
Portfolio Advisory
Fee Growth and Income Portfolio
$779.7 U.S. Growth and Income 0.65% on first $25m 0.50% on next $25m 0.40% on next $50m 0.30% on next $100m 0.25% on the balance Minimum account size $25m
0.287% 0.550%
The Adviser also manages AB Growth and Income Fund, Inc. (“Growth and
Income Fund, Inc.”), a retail mutual fund, which has a substantially similar investment
style as the Portfolio. Set forth below are the fee schedule of Growth and Income Fund,
Inc. and what would have been the effective advisory fee of the Portfolio had the fee
schedule of the retail mutual fund been applicable to the Portfolio:6
Portfolio
AB Mutual Fund
Fee Schedule
ABMF Effective
Fee Growth and Income Portfolio
Growth and Income Fund, Inc.
0.55% on first $2.5 billion 0.45% on next $2.5 billion 0.40% on the balance
0.550%
The Adviser represented that it does not sub-advise any registered investment
company with a substantially similar investment style as the Portfolio.
II. MANAGEMENT FEES CHARGED BY OTHER MUTUAL FUND COMPANIES FOR LIKE SERVICES.
Broadridge, an analytical service that is not affiliated with the Adviser, compared
the fees charged to the Portfolios with fees charged to other investment companies for
6 The retail mutual fund was also affected by the settlement between the Adviser and the NYAG. As a result, the Portfolio has the same breakpoints in its advisory fee schedule as the retail mutual fund.
7
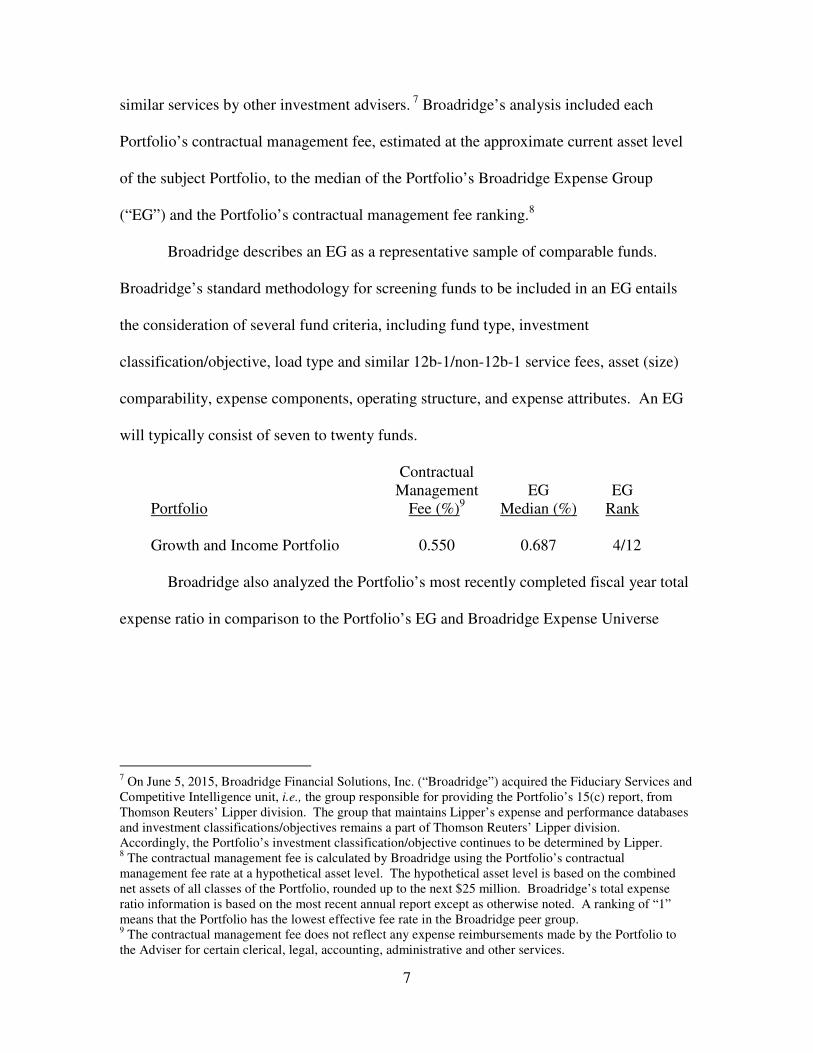
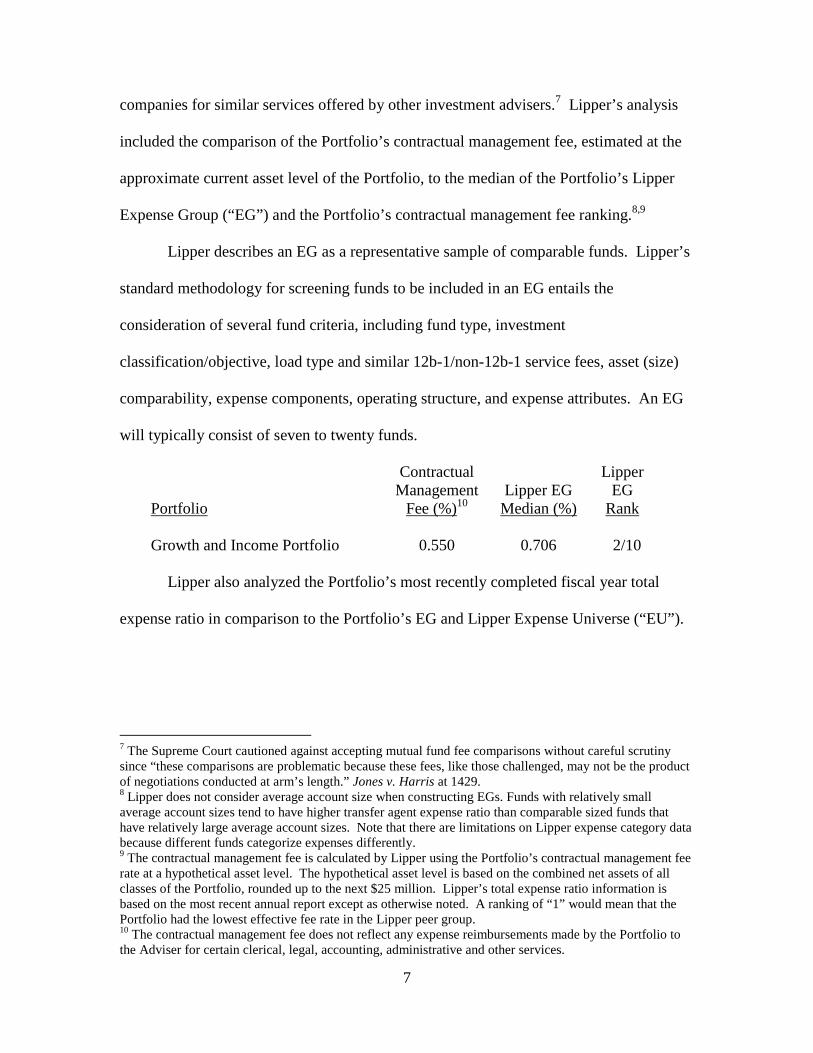
similar services by other investment advisers. 7 Broadridge’s analysis included each
Portfolio’s contractual management fee, estimated at the approximate current asset level
of the subject Portfolio, to the median of the Portfolio’s Broadridge Expense Group
(“EG”) and the Portfolio’s contractual management fee ranking.8
Broadridge describes an EG as a representative sample of comparable funds.
Broadridge’s standard methodology for screening funds to be included in an EG entails
the consideration of several fund criteria, including fund type, investment
classification/objective, load type and similar 12b-1/non-12b-1 service fees, asset (size)
comparability, expense components, operating structure, and expense attributes. An EG
will typically consist of seven to twenty funds.
Portfolio
Contractual Management
Fee (%)9
EG
Median (%)
EG
Rank Growth and Income Portfolio 0.550 0.687 4/12
Broadridge also analyzed the Portfolio’s most recently completed fiscal year total
expense ratio in comparison to the Portfolio’s EG and Broadridge Expense Universe
7 On June 5, 2015, Broadridge Financial Solutions, Inc. (“Broadridge”) acquired the Fiduciary Services and Competitive Intelligence unit, i.e., the group responsible for providing the Portfolio’s 15(c) report, from Thomson Reuters’ Lipper division. The group that maintains Lipper’s expense and performance databases and investment classifications/objectives remains a part of Thomson Reuters’ Lipper division. Accordingly, the Portfolio’s investment classification/objective continues to be determined by Lipper. 8 The contractual management fee is calculated by Broadridge using the Portfolio’s contractual management fee rate at a hypothetical asset level. The hypothetical asset level is based on the combined net assets of all classes of the Portfolio, rounded up to the next $25 million. Broadridge’s total expense ratio information is based on the most recent annual report except as otherwise noted. A ranking of “1” means that the Portfolio has the lowest effective fee rate in the Broadridge peer group. 9 The contractual management fee does not reflect any expense reimbursements made by the Portfolio to the Adviser for certain clerical, legal, accounting, administrative and other services.

8
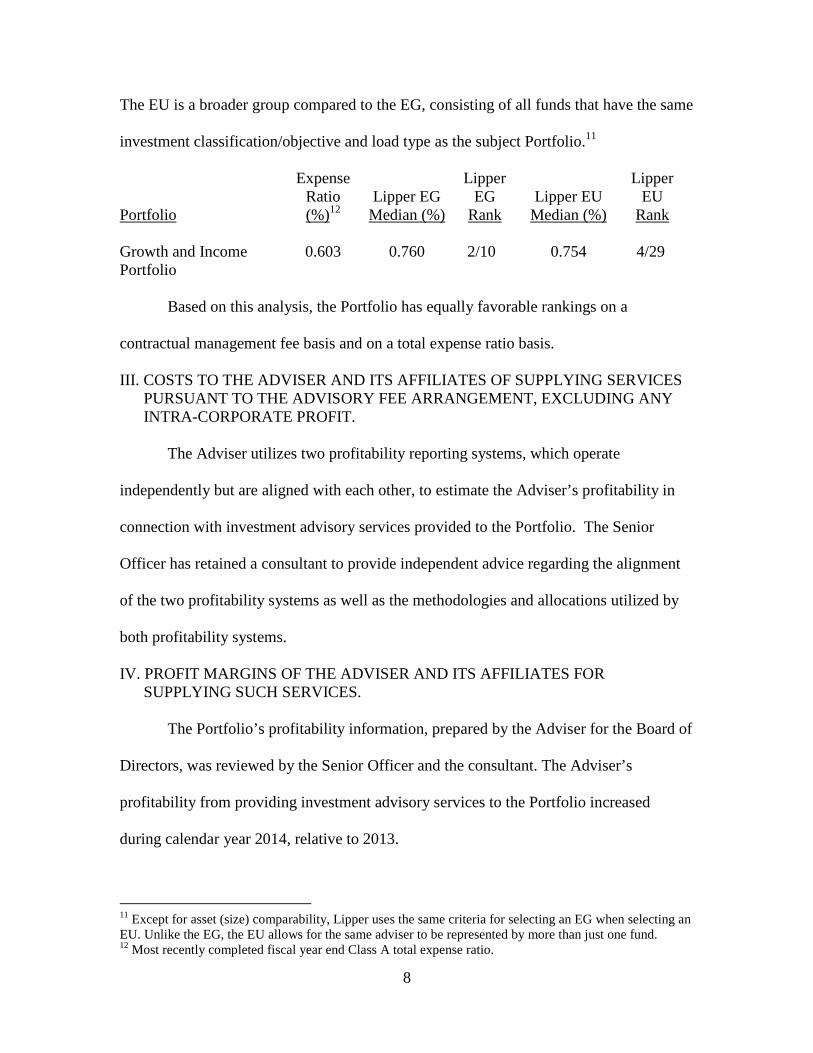
(“EU”). The EU is a broader group compared to the EG, consisting of all funds that have
the same investment classification/objective and load type as the subject Portfolio.10
Portfolio
Expense Ratio (%)11
EG
Median (%)
EG
Rank
EU
Median (%)
EU
Rank Growth and Income Portfolio
0.601 0.731 3/12 0.741 5/30
Based on this analysis, the Portfolio has a more favorable ranking on a total
expense ratio basis than on a contractual management fee basis.
III. COSTS TO THE ADVISER AND ITS AFFILIATES OF SUPPLYING SERVICES PURSUANT TO THE ADVISORY FEE ARRANGEMENT, EXCLUDING ANY INTRA-CORPORATE PROFIT.
The Adviser utilizes two profitability reporting systems, which operate
independently but are aligned with each other, to estimate the Adviser’s profitability in
connection with investment advisory services provided to the Portfolio. The Senior
Officer has retained a consultant to provide independent advice regarding the alignment
of the two profitability systems as well as the methodologies and allocations utilized by
both profitability systems.
IV. PROFIT MARGINS OF THE ADVISER AND ITS AFFILIATES FOR SUPPLYING SUCH SERVICES.
The Portfolio’s profitability information, prepared by the Adviser for the Board of
Directors, was reviewed by the Senior Officer and the consultant. The Adviser’s
profitability from providing investment advisory services to the Portfolio decreased
during calendar year 2015, relative to 2014.
10 Except for asset (size) comparability, Broadridge uses the same criteria for selecting an EG when selecting an EU. Unlike the EG, the EU allows for the same adviser to be represented by more than just one fund. 11 Most recently completed fiscal year end Class A total expense ratio.

9
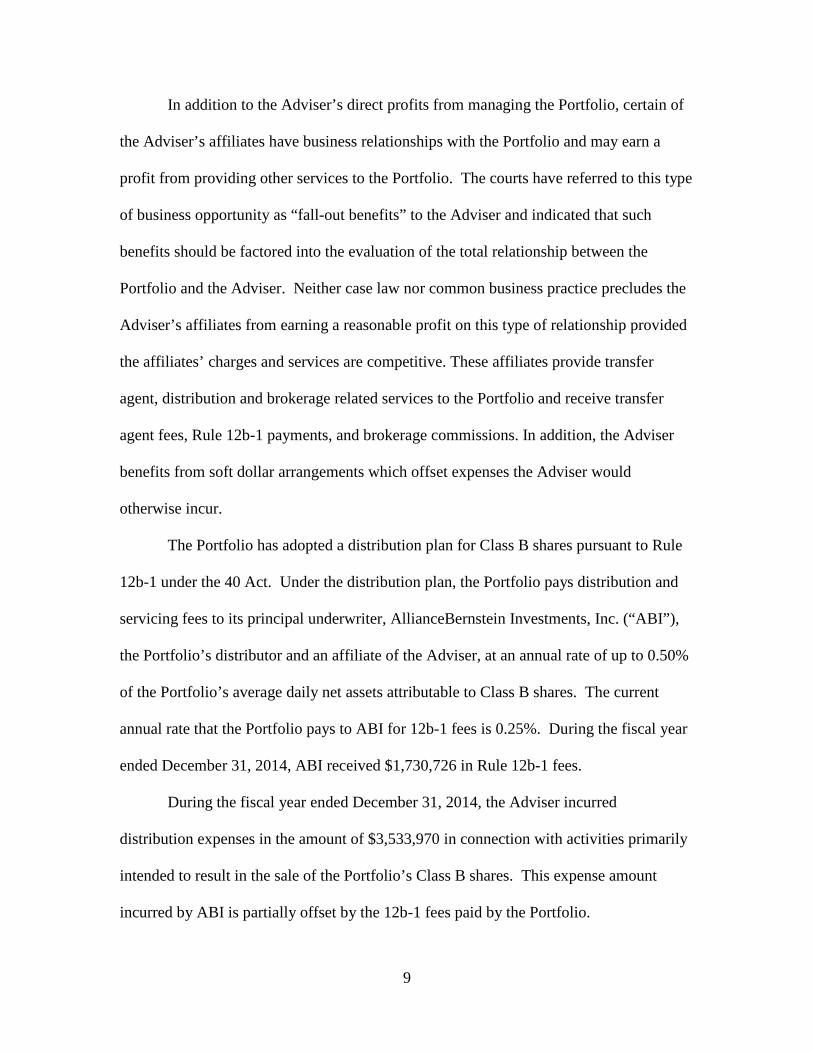
In addition to the Adviser’s direct profits from managing the Portfolio, certain of
the Adviser’s affiliates have business relationships with the Portfolio and may earn a
profit from providing other services to the Portfolio. The courts have referred to this type
of business opportunity as “fall-out benefits” to the Adviser and indicated that such
benefits should be factored into the evaluation of the total relationship between the
Portfolio and the Adviser. Neither case law nor common business practice precludes the
Adviser’s affiliates from earning a reasonable profit on this type of relationship provided
the affiliates’ charges and services are competitive. These affiliates provide transfer
agent, distribution and brokerage related services to the Portfolio and receive transfer
agent fees, Rule 12b-1 payments, and brokerage commissions. In addition, the Adviser
benefits from soft dollar arrangements which offset expenses the Adviser would
otherwise incur.
The Portfolio has adopted a distribution plan for Class B shares pursuant to Rule
12b-1 under the 40 Act. Under the distribution plan, the Portfolio pays distribution and
servicing fees to its principal underwriter, AllianceBernstein Investments, Inc. (“ABI”),
the Portfolio’s distributor and an affiliate of the Adviser, at an annual rate of up to 0.50%
of the Portfolio’s average daily net assets attributable to Class B shares. The current
annual rate that the Portfolio pays to ABI for 12b-1 fees is 0.25%. During the fiscal year
ended December 31, 2015, ABI received $1,694,691 in Rule 12b-1 fees.
During the fiscal year ended December 31, 2015, the Adviser incurred
distribution expenses in the amount of $3,465,172 in connection with activities primarily
intended to result in the sale of the Portfolio’s Class B shares. This expense amount
incurred by ABI is partially offset by the 12b-1 fees paid by the Portfolio.

10
Financial intermediaries, such as insurers, market and sell shares of the Portfolio
and typically receive compensation from ABI, the Advisers and/or the Portfolio for
selling shares of the Portfolio. These financial intermediaries receive compensation in
any or all of the following forms: 12b-1 fees, defrayal of costs for educational seminars
and training, additional distribution support, recordkeeping and/or administrative
services. Payments related to providing contract-holder recordkeeping and/or
administrative services will generally not exceed 0.35% of the average daily net assets of
the Portfolio attributable to the relevant intermediary over the year. With respect to the
Fund, which includes the Portfolio and other Portfolios of the Fund not discussed in this
summary, ABI paid approximately $400,000 in 2015 and expects to pay approximately
$450,000 in 2016 for educational support and distribution assistance (revenue sharing
payments).
The transfer agent of the Portfolio is AllianceBernstein Investor Services, Inc.
(“ABIS”). During the most recently completed fiscal year, ABIS received a fee of
$1,262 from the Portfolio.12
The Portfolio effected brokerage transactions during the most recently completed
fiscal year through the Adviser’s affiliate, Sanford C. Bernstein & Co., LLC (“SCB &
Co.”) and/or its U.K. affiliate, Sanford C. Bernstein Limited (“SCB Ltd.”), collectively
“SCB,” and paid commissions for such transactions. The Adviser represented that SCB’s
profitability from any business conducted with the Portfolio is comparable to the
profitability of SCB’s dealings with other similar third party clients. In the ordinary
course of business, SCB receives and pays liquidity rebates from electronic
12 The Fund, which includes the Portfolio and other Portfolios of the Fund paid ABIS a fee of $18,000 for each calendar year.
11
communications networks (“ECNs”) derived from trading for its clients. These credits
and charges are not being passed onto any SCB client. The Adviser also receives certain
soft dollar benefits from brokers that execute agency trades for the Portfolio and other
clients. These soft dollar benefits reduce the Adviser’s cost of doing business and
increase its profitability.
V. POSSIBLE ECONOMIES OF SCALE
The Adviser has indicated that economies of scale are being shared with
shareholders through pricing to scale, breakpoints, fee reductions/waivers and
enhancement to services.
In May 2012, an independent consultant, retained by the Senior Officer, provided
the Board of Directors information on the Adviser’s firm-wide average costs from 2005
through 2011 and the potential economies of scale. The independent consultant noted
that from 2005 through 2007 the Adviser experienced significant growth in assets under
management (“AUM”). During this period, operating expenses increased, in part to keep
up with growth, and in part reflecting market returns. However, from 2008 through the
first quarter of 2009, AUM rapidly and significantly decreased due to declines in market
value and client withdrawals. When AUM rapidly decreased, some operating expenses
categories, including base compensation and office space, adjusted more slowly during
this period, resulting in an increase in average costs. Since 2009, AUM has experienced
less significant changes. The independent consultant noted that changes in operating
expenses reflect changes in business composition and business practices in response to
changes in financial markets. Finally, the independent consultant concluded that the
increase in average cost and the decline in net operating margin across the Adviser since

12
late 2008 are inconsistent with the view that there are currently reductions in average
costs due to economies of scale that can be shared with the AB Mutual Funds managed
by the Adviser through lower fees.
Previously in February 2008, the independent consultant provided the Board of
Directors an update of Deli’s study on advisory fees and various fund characteristics. 13, 14
The independent consultant first reiterated the results of his previous two dimensional
comparison analysis (fund size and family size) with the Board of Directors.15 The
independent consultant then discussed the results of the regression model that was
utilized to study the effects of various factors on advisory fees. The regression model
output indicated that the bulk of the variation in fees predicted were explained by various
factors, but substantially by fund AUM, family AUM, index fund indicator and
investment style. The independent consultant also compared the advisory fees of the AB
Mutual Funds to similar funds managed by 19 other large asset managers, regardless of
the fund size and each Adviser’s proportion of mutual fund assets to non-mutual fund
assets.
13 The Deli study, originally published in 2002 based on 1997 data and updated for the February 2008 Presentation, may be of diminished value due to the age of the data used in the presentation and the changes experienced in the industry over the last four years. Source: Deli, Daniel N. “Mutual Fund Advisory Contracts: An Empirical Investigation.” Journal of Finance, 57(1): 109-133 (2002). 14 As mentioned previously, the Supreme Court cautioned against accepting mutual fund fee comparisons without careful scrutiny since the fees may not be the product of negotiations conducted at arm’s length. See Jones V. Harris at 1429. 15 The two dimensional analysis showed patterns of lower advisory fees for funds with larger asset sizes and funds from larger family sizes compared to funds with smaller asset sizes and funds from smaller family sizes, which according to the independent consultant is indicative of a sharing of economies of scale and scope. However, in less liquid and active markets, such is not the case, as the empirical analysis showed potential for diseconomies of scale in those markets. The empirical analysis also showed diminishing economies of scale and scope as funds surpassed a certain high level of assets.

13
VI. NATURE AND QUALITY OF THE ADVISER’S SERVICES, INCLUDING THE PERFORMANCE OF THE PORTFOLIO
With assets under management of approximately $479 billion as of March 31,
2016, the Adviser has the investment experience to manage and provide non-investment
services (described in Section I) to the Portfolio.
The information in the table below shows the 1, 3, 5 and 10 year net performance
returns, rankings and quintiles16 of the Portfolios relative to their Broadridge Performance
Group (“PG”) and Broadridge Performance Universe (“PU”)17 for the periods ended
February 29, 2016.18
PG PU PG PU Portfolio (%) Median (%) Median (%) Rank Rank Growth and Income Portfolio
1 year -4.92 -11.41 -10.82 1/12 1/49 3 year 10.46 7.87 7.70 2/12 5/48 5 year 10.95 6.82 7.55 1/12 3/45 10 year 5.77 5.03 5.94 5/11 23/40
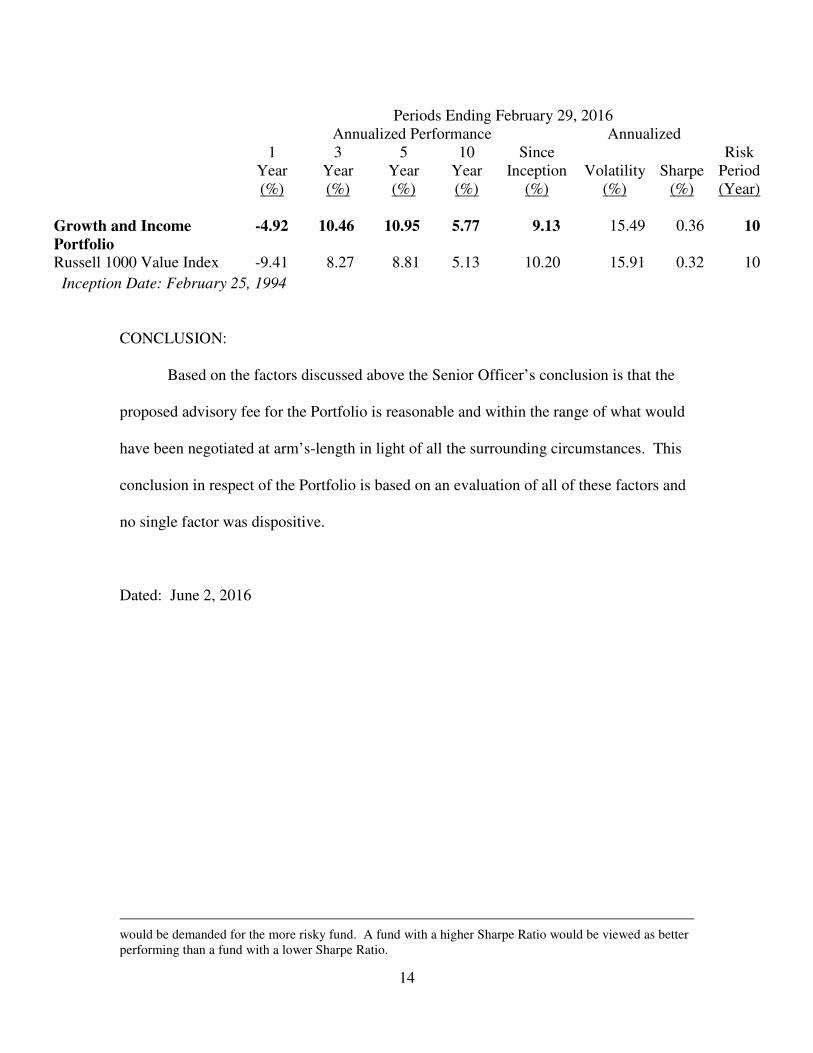
Set forth below are the 1, 3, 5 and 10 year and since inception performance
returns of the Portfolio (in bold)19 versus its benchmarks. Portfolio and benchmark
volatility and reward-to-variability ratio (“Sharpe Ratio”) information is also shown.20
16 The performance returns and rankings of the Portfolio are for the Portfolio’s Class A shares. The performance returns and rankings of the Portfolio were provided by Broadridge. 17 The Portfolio’s PG is identical to the Portfolio’s EG. The Portfolio’s PU is not identical to the Portfolio’s EU as the criteria for including/excluding a fund in/from a PU is different from that of an EU. 18 Note that the current Lipper investment classification/objective dictates the PG and PU throughout the life of each fund even if the fund had a different investment classification/objective at a different point in time. 19 The performance returns and risk measures shown in the table are for the Class A shares of the Portfolio. 20 Portfolio and benchmark volatility and Sharpe Ratio information was obtained through Lipper LANA, a database maintained by Lipper. Volatility is a statistical measure of the tendency of a market price or yield to vary over time. A Sharpe Ratio is a risk adjusted measure of return that divides a fund’s return in excess of the riskless return by the fund’s standard deviation. A fund with a greater volatility would be viewed as more risky than a fund with equivalent performance but lower volatility; for that reason, a greater return
14
CONCLUSION:
Based on the factors discussed above the Senior Officer’s conclusion is that the
proposed advisory fee for the Portfolio is reasonable and within the range of what would
have been negotiated at arm’s-length in light of all the surrounding circumstances. This
conclusion in respect of the Portfolio is based on an evaluation of all of these factors and
no single factor was dispositive.
Dated: June 2, 2016
would be demanded for the more risky fund. A fund with a higher Sharpe Ratio would be viewed as better performing than a fund with a lower Sharpe Ratio.
Periods Ending February 29, 2016
Annualized Performance Annualized
1 Year (%)
3 Year (%)
5 Year (%)
10 Year (%)
Since Inception
(%)
Volatility
(%)
Sharpe
(%)
Risk Period (Year)
Growth and Income
Portfolio
-4.92 10.46 10.95 5.77 9.13 15.49 0.36 10
Russell 1000 Value Index -9.41 8.27 8.81 5.13 10.20 15.91 0.32 10
Inception Date: February 25, 1994

THIS PAGE IS INTENTIONALLY LEFT BLANK.

THE FOLLOWING IS NOT PART OF THE SHAREHOLDER REPORT OR THEFINANCIAL STATEMENTS
SUMMARY OF SENIOR OFFICER’S EVALUATION OFINVESTMENT ADVISORY AGREEMENT1
The following is a summary of the evaluation of the Investment Advisory
Agreement between AllianceBernstein L.P. (the “Adviser”) and the AB Variable
Products Series Fund (the “Fund”), in respect of AB Growth and Income Portfolio (the
“Portfolio”).2 The evaluation of the Investment Advisory Agreement was prepared by
Philip L. Kirstein, the Senior Officer of the Fund, for the Directors of the Fund, as
required by a September 2004 agreement between the Adviser and the New York State
Attorney General (the “NYAG”). The Senior Officer’s evaluation of the Investment
Advisory Agreement is not meant to diminish the responsibility or authority of the Board
of Directors of the Fund to perform its duties pursuant to Section 15 of the Investment
Company Act of 1940 (the “40 Act”) and applicable state law. The purpose of the
summary is to provide shareholders with a synopsis of the independent evaluation of the
reasonableness of the advisory fees proposed to be paid by the Portfolio which was
provided to the Directors in connection with their review of the proposed approval of the
continuance of the Investment Advisory Agreement. The Senior Officer’s evaluation
considered the following factors:
1. Advisory fees charged to institutional and other clients of the Adviser
for like services;
1 The information in the fee summary was completed on April 23, 2015 and discussed with the Board ofDirectors on May 5-7, 2015.2 Future references to the Fund and the Portfolio do not include “AB.” References in the fee summarypertaining to performance and expense ratio rankings refer to the Class A shares of the Portfolio.
2
2. Advisory fees charged by other mutual fund companies for like
services;
3. Costs to the Adviser and its affiliates of supplying services pursuant to
the advisory agreement, excluding any intra-corporate profit;
4. Profit margins of the Adviser and its affiliates from supplying such
services;
5. Possible economies of scale as the Portfolio grows larger; and
6. Nature and quality of the Adviser’s services including the performance
of the Portfolio.
These factors, with the exception of the first factor, are generally referred to as the
“Gartenberg factors,” which were articulated by the United States Court of Appeals for
the Second Circuit in 1982. Gartenberg v. Merrill Lynch Asset Management, Inc., 694 F.
2d 923 (2d Cir. 1982). The first factor is an additional factor required to be considered by
the AoD. On March 30, 2010, the Supreme Court held the Gartenberg decision was
correct in its basic formulation of what Section 36(b) requires: to face liability under
Section36(b), “an investment adviser must charge a fee that is so disproportionately large
that it bears no reasonable relationship to the services rendered and could not have been
the product of arm’s length bargaining.” Jones v. Harris Associates L.P., 130 S. Ct. 1418
(2010). In the Jones decision, the Court stated the Gartenberg approach fully
incorporates the correct understanding of fiduciary duty within the context of Section
36(b) and noted with approval that “Gartenberg insists that all relevant circumstances be
3
taken into account” and “uses the range of fees that might result from arm’s-length
bargaining as the benchmark for reviewing challenged fees.”3
PORTFOLIO ADVISORY FEES, NET ASSETS & EXPENSE RATIOS
The Adviser proposed that the Portfolio pays the advisory fee set forth in the table
below for receiving the services to be provided pursuant to the Investment Advisory
Agreement. The fee schedule below, implemented in January 2004 in consideration of
the Adviser’s settlement with the NYAG in December 2003, is based on a master
schedule that contemplates eight categories of funds with almost all funds in each
category having the same advisory fee schedule.
Portfolio CategoryAdvisory Fee Based on % of
Average Daily Net Assets
Net Assets3/31/15($MIL)
GrowthandIncomePortfolio
Value 0.55% on first $2.5 billion0.45% on next $2.5 billion0.40% on the balance
$864.8
The Adviser is reimbursed as specified in the Investment Advisory Agreement for
certain clerical, legal, accounting, administrative and other services provided to the
Portfolio. During the Portfolio’s most recently completed fiscal year, the Adviser
received $48,204 (0.006% of the Portfolio’s average daily net assets) for such services.
Set forth below are the Portfolio’s total expense ratios for the most recently
completed fiscal year:
Portfolio Total Expense Ratio Fiscal Year
Growth and Income Portfolio Class AClass B
0.60%0.85%
December 31
3 Jones v. Harris at 1427.

4
I. ADVISORY FEES CHARGED TO INSTITUTIONAL AND OTHER CLIENTS
The advisory fees charged to investment companies which the Adviser manages
and sponsors are normally higher than those charged to similar sized institutional
accounts, including pension plans and sub-advised investment companies. The fee
differential reflects, among other things, different services provided to such clients, and
different liabilities assumed. Services provided by the Adviser to the Portfolio that are
not provided to non-investment company clients and sub-advised investment companies
include providing office space and personnel to serve as Fund Officers, who among other
responsibilities make the certifications required under the Sarbanes–Oxley Act of 2002,
and coordinating with and monitoring the Portfolio’s third party service providers such as
Fund counsel, auditors, custodians, transfer agents and pricing services. The accounting,
administrative, legal and compliance requirements for the Portfolio are more costly than
those for institutional assets due to the greater complexities and time required for
investment companies, although as previously noted, the Adviser is reimbursed for
providing such services. Also, retail mutual funds managed by the Adviser are widely
held. Servicing the Portfolio’s investors is more time consuming and labor intensive
compared to institutional clients since the Adviser needs to communicate with a more
extensive network of financial intermediaries and shareholders. The Adviser also
believes that it incurs substantial entrepreneurial risk when offering a new mutual fund,
since establishing a new mutual fund requires a large upfront investment, and it may take
a long time for the fund to achieve profitability since the fund must be priced to scale
from inception in order to be competitive and assets are acquired one account at a time.
In addition, managing the cash flow of an investment company may be more difficult

5
than managing that of a stable pool of assets, such as an institutional account with little
cash movement in either direction, particularly, if a fund is in net redemption and the
Adviser is frequently forced to sell securities to raise cash for redemptions. However,
managing a fund with positive cash flow may be easier at times than managing a stable
pool of assets. In recent years, investment advisers have been sued by institutional clients
and have suffered reputational damage both by the attendant publicity and outcomes
other than complete victories. Accordingly, the legal and reputational risks associated
with institutional accounts are greater than previously thought, although still not equal to
those related to the mutual fund industry.
Notwithstanding the Adviser’s view that managing an investment company is not
comparable to managing other institutional accounts because the services provided are
different, the Supreme Court has indicated consideration should be given to the advisory
fees charged to institutional accounts that have a substantially similar investment style as
the Portfolio.4 In addition to the AB Institutional fee schedule, set forth below is what
would have been the effective advisory fee of the Portfolio had the AB Institutional fee
schedule been applicable to the Portfolio versus the Portfolio’s advisory fee based on
March 31, 2015 net assets:5
4 The Supreme Court stated that “courts may give such comparisons the weight that they merit in light ofthe similarities and differences between the services that the clients in question require, but the courts mustbe wary of inapt comparisons.” Among the significant differences the Supreme Court noted that may existbetween services provided to mutual funds and institutional accounts are “higher marketing costs.” Jones v.Harris at 1428.5 The Adviser has indicated that with respect to institutional accounts with assets greater than $300 million,it will negotiate a fee schedule. Discounts that are negotiated vary based upon each client relationship.
6
Portfolio
Net Assets3/31/15($MIL)
AB InstitutionalFee Schedule
EffectiveAB Inst.Adv. Fee
PortfolioAdvisory
Fee
Growth andIncome Portfolio
$864.8 U.S. Growth and Income0.65% on first $25m0.50% on next $25m0.40% on next $50m0.30% on next $100m0.25% on the balance
Minimum account size $25m
0.283% 0.550%
The Adviser also manages AB Growth and Income Fund, Inc. (“Growth and
Income Fund, Inc.”), a retail mutual fund, which has a substantially similar investment
style as the Portfolio. Set forth below are the fee schedule of Growth and Income Fund,
Inc. and what would have been the effective advisory fee of the Portfolio had the fee
schedule of the retail mutual fund been applicable to the Portfolio:6
PortfolioABMutual Fund Fee Schedule
ABMFEffective
Fee
PortfolioAdvisory
Fee
Growth andIncome Portfolio
Growth andIncome Fund,Inc.
0.55% on first $2.5 billion0.45% on next $2.5 billion0.40% on the balance
0.550% 0.550%
The Adviser represented that it does not sub-advise any registered investment
company with a substantially similar investment style as the Portfolio.
II. MANAGEMENT FEES CHARGED BY OTHER MUTUAL FUND COMPANIESFOR LIKE SERVICES.
Lipper Inc. (“Lipper”), an analytical service that is not affiliated with the Adviser,
compared the fees charged to the Portfolio with fees charged to other investment
6 The retail mutual fund was also affected by the settlement between the Adviser and the NYAG. As aresult, the Portfolio has the same breakpoints in its advisory fee schedule as the retail mutual fund.
7
companies for similar services offered by other investment advisers.7 Lipper’s analysis
included the comparison of the Portfolio’s contractual management fee, estimated at the
approximate current asset level of the Portfolio, to the median of the Portfolio’s Lipper
Expense Group (“EG”) and the Portfolio’s contractual management fee ranking.8,9
Lipper describes an EG as a representative sample of comparable funds. Lipper’s
standard methodology for screening funds to be included in an EG entails the
consideration of several fund criteria, including fund type, investment
classification/objective, load type and similar 12b-1/non-12b-1 service fees, asset (size)
comparability, expense components, operating structure, and expense attributes. An EG
will typically consist of seven to twenty funds.
Portfolio
ContractualManagement
Fee (%)10Lipper EG
Median (%)
LipperEG
Rank
Growth and Income Portfolio 0.550 0.706 2/10
Lipper also analyzed the Portfolio’s most recently completed fiscal year total
expense ratio in comparison to the Portfolio’s EG and Lipper Expense Universe (“EU”).
7 The Supreme Court cautioned against accepting mutual fund fee comparisons without careful scrutinysince “these comparisons are problematic because these fees, like those challenged, may not be the productof negotiations conducted at arm’s length.” Jones v. Harris at 1429.8 Lipper does not consider average account size when constructing EGs. Funds with relatively smallaverage account sizes tend to have higher transfer agent expense ratio than comparable sized funds thathave relatively large average account sizes. Note that there are limitations on Lipper expense category databecause different funds categorize expenses differently.9 The contractual management fee is calculated by Lipper using the Portfolio’s contractual management feerate at a hypothetical asset level. The hypothetical asset level is based on the combined net assets of allclasses of the Portfolio, rounded up to the next $25 million. Lipper’s total expense ratio information isbased on the most recent annual report except as otherwise noted. A ranking of “1” would mean that thePortfolio had the lowest effective fee rate in the Lipper peer group.10 The contractual management fee does not reflect any expense reimbursements made by the Portfolio tothe Adviser for certain clerical, legal, accounting, administrative and other services.
8
The EU is a broader group compared to the EG, consisting of all funds that have the same
investment classification/objective and load type as the subject Portfolio.11
Portfolio
ExpenseRatio(%)12
Lipper EGMedian (%)
LipperEG
RankLipper EU
Median (%)
LipperEU
Rank
Growth and IncomePortfolio
0.603 0.760 2/10 0.754 4/29
Based on this analysis, the Portfolio has equally favorable rankings on a
contractual management fee basis and on a total expense ratio basis.
III. COSTS TO THE ADVISER AND ITS AFFILIATES OF SUPPLYING SERVICESPURSUANT TO THE ADVISORY FEE ARRANGEMENT, EXCLUDING ANYINTRA-CORPORATE PROFIT.
The Adviser utilizes two profitability reporting systems, which operate
independently but are aligned with each other, to estimate the Adviser’s profitability in
connection with investment advisory services provided to the Portfolio. The Senior
Officer has retained a consultant to provide independent advice regarding the alignment
of the two profitability systems as well as the methodologies and allocations utilized by
both profitability systems.
IV. PROFIT MARGINS OF THE ADVISER AND ITS AFFILIATES FORSUPPLYING SUCH SERVICES.
The Portfolio’s profitability information, prepared by the Adviser for the Board of
Directors, was reviewed by the Senior Officer and the consultant. The Adviser’s
profitability from providing investment advisory services to the Portfolio increased
during calendar year 2014, relative to 2013.
11 Except for asset (size) comparability, Lipper uses the same criteria for selecting an EG when selecting anEU. Unlike the EG, the EU allows for the same adviser to be represented by more than just one fund.12 Most recently completed fiscal year end Class A total expense ratio.
9
In addition to the Adviser’s direct profits from managing the Portfolio, certain of
the Adviser’s affiliates have business relationships with the Portfolio and may earn a
profit from providing other services to the Portfolio. The courts have referred to this type
of business opportunity as “fall-out benefits” to the Adviser and indicated that such
benefits should be factored into the evaluation of the total relationship between the
Portfolio and the Adviser. Neither case law nor common business practice precludes the
Adviser’s affiliates from earning a reasonable profit on this type of relationship provided
the affiliates’ charges and services are competitive. These affiliates provide transfer
agent, distribution and brokerage related services to the Portfolio and receive transfer
agent fees, Rule 12b-1 payments, and brokerage commissions. In addition, the Adviser
benefits from soft dollar arrangements which offset expenses the Adviser would
otherwise incur.
The Portfolio has adopted a distribution plan for Class B shares pursuant to Rule
12b-1 under the 40 Act. Under the distribution plan, the Portfolio pays distribution and
servicing fees to its principal underwriter, AllianceBernstein Investments, Inc. (“ABI”),
the Portfolio’s distributor and an affiliate of the Adviser, at an annual rate of up to 0.50%
of the Portfolio’s average daily net assets attributable to Class B shares. The current
annual rate that the Portfolio pays to ABI for 12b-1 fees is 0.25%. During the fiscal year
ended December 31, 2014, ABI received $1,730,726 in Rule 12b-1 fees.
During the fiscal year ended December 31, 2014, the Adviser incurred
distribution expenses in the amount of $3,533,970 in connection with activities primarily
intended to result in the sale of the Portfolio’s Class B shares. This expense amount
incurred by ABI is partially offset by the 12b-1 fees paid by the Portfolio.

10
Financial intermediaries, such as insurers, market and sell shares of the Portfolio
and typically receive compensation from ABI, the Advisers and/or the Portfolio for
selling shares of the Portfolio. These financial intermediaries receive compensation in
any or all of the following forms: 12b-1 fees, defrayal of costs for educational seminars
and training, additional distribution support, recordkeeping and/or administrative
services. Payments related to providing contract-holder recordkeeping and/or
administrative services will generally not exceed 0.35% of the average daily net assets of
the Portfolio attributable to the relevant intermediary over the year. With respect to the
Fund, which includes the Portfolio and other Portfolios of the Fund not discussed in this
summary, ABI paid approximately $350,000 in 2014 and expects to pay approximately
$400,000 in 2015 for educational support and distribution assistance (revenue sharing
payments).
The transfer agent of the Portfolio is AllianceBernstein Investor Services, Inc.
(“ABIS”). During the most recently completed fiscal year, ABIS received a fee of
$1,385 from the Portfolio.13
The Portfolio did not effect brokerage transactions through the Adviser’s affiliate,
Sanford C. Bernstein & Co., LLC (“SCB & Co.”) nor its U.K. affiliate, Sanford C.
Bernstein Limited (“SCB Ltd.”), collectively “SCB,” and pay commissions during the
Portfolio’s most recently completed fiscal year. The Adviser represented that SCB’s
profitability from business conducted in the future with the Portfolio would be
comparable to the profitability of SCB’s dealings with other similar third party clients. In
the ordinary course of business, SCB receives and pays liquidity rebates from electronic
13 The Fund, which includes the Portfolio and other Portfolios of the Fund paid ABIS a fee of $18,000 in2014.

11
communications networks (“ECNs”) derived from trading for its clients. These credits
and charges are not being passed onto any SCB client. The Adviser also receives certain
soft dollar benefits from brokers that execute agency trades for the Portfolio and other
clients. These soft dollar benefits reduce the Adviser’s cost of doing business and
increase its profitability.
V. POSSIBLE ECONOMIES OF SCALE
The Adviser has indicated that economies of scale are being shared with
shareholders through pricing to scale, breakpoints, fee reductions/waivers and
enhancement to services.
In May 2012, an independent consultant, retained by the Senior Officer, provided
the Board of Directors information on the Adviser’s firm-wide average costs from 2005
through 2011 and the potential economies of scale. The independent consultant noted
that from 2005 through 2007 the Adviser experienced significant growth in assets under
management (“AUM”). During this period, operating expenses increased, in part to keep
up with growth, and in part reflecting market returns. However, from 2008 through the
first quarter of 2009, AUM rapidly and significantly decreased due to declines in market
value and client withdrawals. When AUM rapidly decreased, some operating expenses
categories, including base compensation and office space, adjusted more slowly during
this period, resulting in an increase in average costs. Since 2009, AUM has experienced
less significant changes. The independent consultant noted that changes in operating
expenses reflect changes in business composition and business practices in response to
changes in financial markets. Finally, the independent consultant concluded that the
increase in average cost and the decline in net operating margin across the Adviser since
12
late 2008 are inconsistent with the view that there are currently reductions in average
costs due to economies of scale that can be shared with the AB Mutual Funds managed
by the Adviser through lower fees.
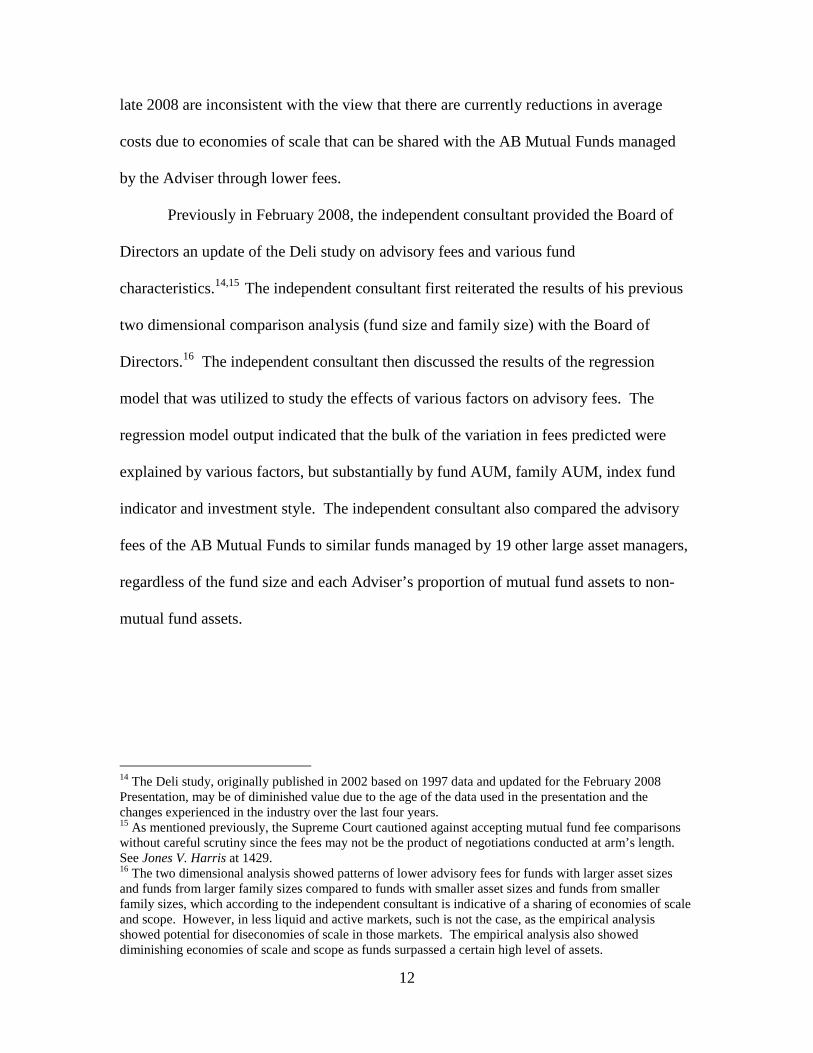
Previously in February 2008, the independent consultant provided the Board of
Directors an update of the Deli study on advisory fees and various fund
characteristics.14,15 The independent consultant first reiterated the results of his previous
two dimensional comparison analysis (fund size and family size) with the Board of
Directors.16 The independent consultant then discussed the results of the regression
model that was utilized to study the effects of various factors on advisory fees. The
regression model output indicated that the bulk of the variation in fees predicted were
explained by various factors, but substantially by fund AUM, family AUM, index fund
indicator and investment style. The independent consultant also compared the advisory
fees of the AB Mutual Funds to similar funds managed by 19 other large asset managers,
regardless of the fund size and each Adviser’s proportion of mutual fund assets to non-
mutual fund assets.
14 The Deli study, originally published in 2002 based on 1997 data and updated for the February 2008Presentation, may be of diminished value due to the age of the data used in the presentation and thechanges experienced in the industry over the last four years.15 As mentioned previously, the Supreme Court cautioned against accepting mutual fund fee comparisonswithout careful scrutiny since the fees may not be the product of negotiations conducted at arm’s length.See Jones V. Harris at 1429.16 The two dimensional analysis showed patterns of lower advisory fees for funds with larger asset sizesand funds from larger family sizes compared to funds with smaller asset sizes and funds from smallerfamily sizes, which according to the independent consultant is indicative of a sharing of economies of scaleand scope. However, in less liquid and active markets, such is not the case, as the empirical analysisshowed potential for diseconomies of scale in those markets. The empirical analysis also showeddiminishing economies of scale and scope as funds surpassed a certain high level of assets.
13
VI. NATURE AND QUALITY OF THE ADVISER’S SERVICES,INCLUDING THE PERFORMANCE OF THE PORTFOLIO
With assets under management of approximately $486 billion as of March 31,
2015, the Adviser has the investment experience to manage and provide non-investment
services (described in Section I) to the Portfolio.
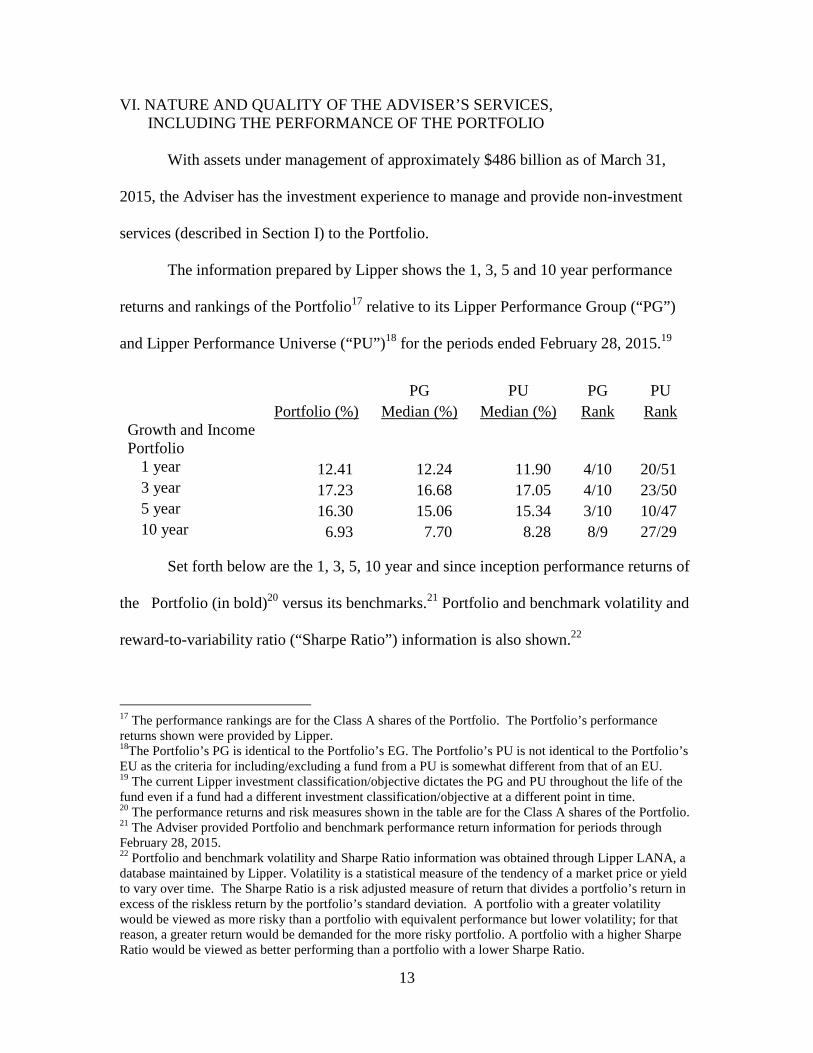
The information prepared by Lipper shows the 1, 3, 5 and 10 year performance
returns and rankings of the Portfolio17 relative to its Lipper Performance Group (“PG”)
and Lipper Performance Universe (“PU”)18 for the periods ended February 28, 2015.19
PG PU PG PU
Portfolio (%) Median (%) Median (%) Rank RankGrowth and IncomePortfolio
1 year 12.41 12.24 11.90 4/10 20/513 year 17.23 16.68 17.05 4/10 23/505 year 16.30 15.06 15.34 3/10 10/4710 year 6.93 7.70 8.28 8/9 27/29
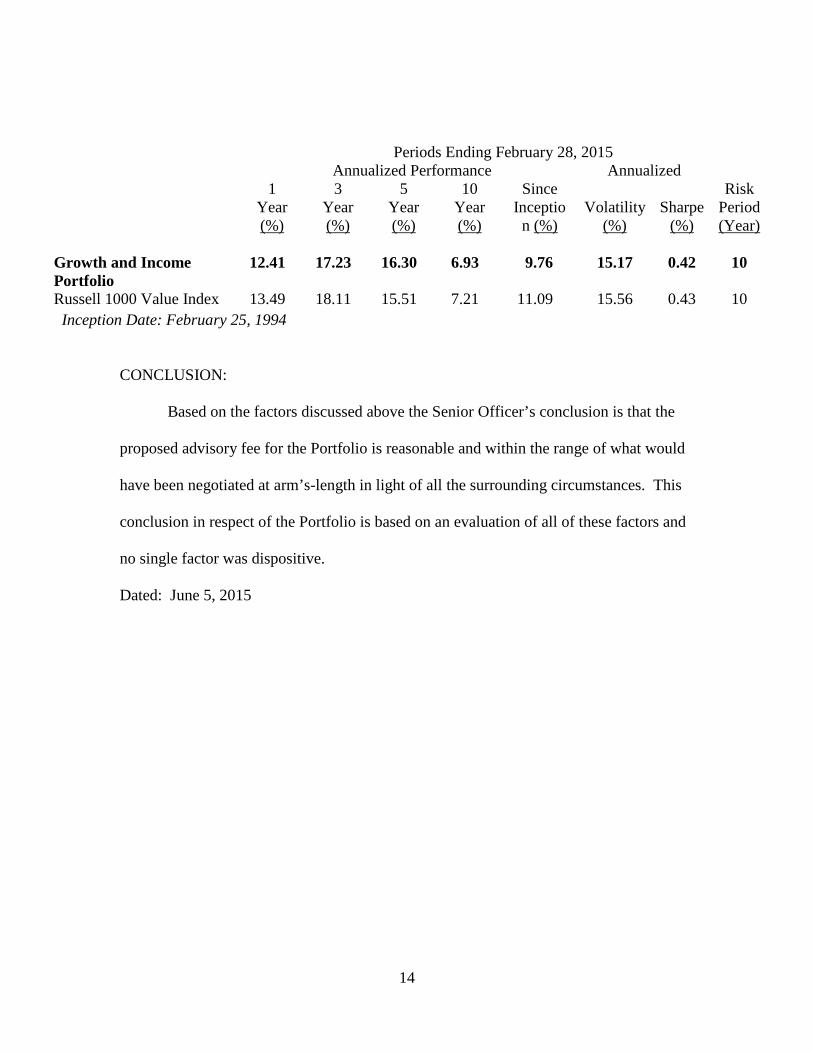
Set forth below are the 1, 3, 5, 10 year and since inception performance returns of
the Portfolio (in bold)20 versus its benchmarks.21 Portfolio and benchmark volatility and
reward-to-variability ratio (“Sharpe Ratio”) information is also shown.22
17 The performance rankings are for the Class A shares of the Portfolio. The Portfolio’s performancereturns shown were provided by Lipper.18The Portfolio’s PG is identical to the Portfolio’s EG. The Portfolio’s PU is not identical to the Portfolio’sEU as the criteria for including/excluding a fund from a PU is somewhat different from that of an EU.19 The current Lipper investment classification/objective dictates the PG and PU throughout the life of thefund even if a fund had a different investment classification/objective at a different point in time.20 The performance returns and risk measures shown in the table are for the Class A shares of the Portfolio.21 The Adviser provided Portfolio and benchmark performance return information for periods throughFebruary 28, 2015.22 Portfolio and benchmark volatility and Sharpe Ratio information was obtained through Lipper LANA, adatabase maintained by Lipper. Volatility is a statistical measure of the tendency of a market price or yieldto vary over time. The Sharpe Ratio is a risk adjusted measure of return that divides a portfolio’s return inexcess of the riskless return by the portfolio’s standard deviation. A portfolio with a greater volatilitywould be viewed as more risky than a portfolio with equivalent performance but lower volatility; for thatreason, a greater return would be demanded for the more risky portfolio. A portfolio with a higher SharpeRatio would be viewed as better performing than a portfolio with a lower Sharpe Ratio.
14
CONCLUSION:
Based on the factors discussed above the Senior Officer’s conclusion is that the
proposed advisory fee for the Portfolio is reasonable and within the range of what would
have been negotiated at arm’s-length in light of all the surrounding circumstances. This
conclusion in respect of the Portfolio is based on an evaluation of all of these factors and
no single factor was dispositive.
Dated: June 5, 2015
Periods Ending February 28, 2015Annualized Performance Annualized
1Year(%)
3Year(%)
5Year(%)
10Year(%)
SinceInceptio
n (%)Volatility
(%)Sharpe
(%)
RiskPeriod(Year)
Growth and IncomePortfolio
12.41 17.23 16.30 6.93 9.76 15.17 0.42 10
Russell 1000 Value Index 13.49 18.11 15.51 7.21 11.09 15.56 0.43 10
Inception Date: February 25, 1994