
This attachment contains the two most recent Senior ... · shareholders with a synopsis of the...
42
This attachment contains the two most recent Senior Officer Fee Summaries for the Fund.
Transcript of This attachment contains the two most recent Senior ... · shareholders with a synopsis of the...

This attachment contains the two most recent Senior Officer Fee Summaries for the Fund.

SUMMARY OF SENIOR OFFICER’S EVALUATION OF INVESTMENT ADVISORY AGREEMENT1
The following is a summary of the evaluation of the Investment Advisory
Agreement between AllianceBernstein L.P. (the “Adviser”) and Sanford C. Bernstein
Fund, Inc. (the “Fund”) with respect to the following Overlay Portfolios (the
“Portfolios”):2
Tax-Aware Overlay A Portfolio Overlay A Portfolio Tax-Aware Overlay B Portfolio Overlay B Portfolio Tax-Aware Overlay C Portfolio Tax-Aware Overlay N Portfolio
The evaluation of the Investment Advisory Agreement was prepared by Philip L.
Kirstein, the Senior Officer of the Fund, for the Directors of the Fund, as required by the
August 2004 agreement between the Adviser and the New York State Attorney General
(the “NYAG”). The Senior Officer’s evaluation of the Investment Advisory Agreement
is not meant to diminish the responsibility or authority of the Board of Directors of the
Fund to perform its duties pursuant to Section 15 of the Investment Company Act of
1940 (the “40 Act”) and applicable state law. The purpose of the summary is to provide
shareholders with a synopsis of the independent evaluation of the reasonableness of the
advisory fees proposed to be paid by the Portfolios which was provided to the Directors
in connection with their review of the proposed approval of the continuance of the
Investment Advisory Agreement.
1 The Senior Officer’s evaluation was completed on October 4, 2012 and discussed with the Board on October 16 and 25, 2012. 2 Future references to the various Portfolios do not include “Sanford C. Bernstein.” It also should be noted that references in the fee summary pertaining to performance and expense ratios refer to the Class 1shares of the Portfolios unless otherwise indicated.

2
The Overlay Portfolios, which utilizes the Adviser’s Dynamic Asset Allocation
(“DAA”) service, are not designed to be used as stand-alone investments and are used
only in conjunction with globally diversified Private Client portfolios. Overlay A
Portfolio and Tax-Aware Overlay A Portfolio are intended for use in Private Client
accounts that have a higher equity weighting (e.g., 20% fixed income and 80% equity).
Overlay B Portfolio, Tax-Aware Overlay B Portfolio, Tax-Aware Overlay C Portfolio
and Tax-Aware Overlay N Portfolio are intended for use in Private Client accounts that
have a higher fixed income weighting (e.g., 70% fixed income and 30% equity).3
Combinations of the Overlay Portfolios can be used to tailor the overlay service to suit a
variety of Private Client account asset allocations. When applied in a systematic way
over time, the overlay strategies are designed to: reduce portfolio volatility, reduce the
probability of large losses as a result of negative “tail events”, and maintain returns over
time. The side effect of such strategies is reducing the probability of large gains. These
potential benefits are intended to be realized at the level of a Private Client’s account,
which would include other investments, such as individual securities as well as holdings
in one or more of the Portfolios.
The Senior Officer’s evaluation considered the following factors:
1. Advisory fees charged to institutional and other clients of the Adviser
for like services;
2. Advisory fees charged by other mutual fund companies for like
services;
3 Both the Overlay C Portfolio and the Overlay N Portfolio seek to minimize the impact of federal and state taxes for shareholders resident in California and New York, respectively.

3
3. Costs to the Adviser and its affiliates of supplying services pursuant to
the advisory agreement, excluding any intra-corporate profit;
4. Profit margins of the Adviser and its affiliates from supplying such
services;
5. Possible economies of scale as the Portfolios grow larger; and
6. Nature and quality of the Adviser’s services including the performance
of the Portfolios.
These factors, with the exception of the first factor, are generally referred to as the
“Gartenberg factors,” which were articulated by the United States Court of Appeals for
the Second Circuit in 1982. Gartenberg v. Merrill Lynch Asset Management, Inc., 694 F.
2d 923 (2d Cir. 1982). The first factor is an additional factor required to be considered by
the Assurance of Discontinuance between the NYAG and the Adviser. On March 30,
2010, the Supreme Court held the Gartenberg decision was correct in its basic
formulation of what §36(b) requires: to face liability under §36(b), “an investment
adviser must charge a fee that is so disproportionately large that it bears no reasonable
relationship to the services rendered and could not have been the product of arm’s length
bargaining.” Jones v. Harris Associates L.P., 130 S. Ct. 1418 (2010). In the Jones
decision, the Court stated the Gartenberg approach fully incorporates the correct
understanding of fiduciary duty within the context of section 36(b) and noted with
approval that “Gartenberg insists that all relevant circumstances be taken into account”
and “uses the range of fees that might result from arm’s-length bargaining as the
benchmark for reviewing challenged fees.” 4
4 Jones v. Harris at 1427.

4
PORTFOLIOS’ ADVISORY FEES, EXPENSE REIMBURSEMENTS & RATIOS
The Adviser proposed that the Portfolios pay the advisory fees set forth below for
receiving the services to be provided pursuant to the Investment Advisory Agreement.
The proposed advisory fee schedules did not contain any changes from the previous year.
Portfolio
Advisory Fee Based on % of Average Daily Net Assets5
Tax-Aware Overlay A Portfolio Overlay A Portfolio
0.90% (flat fee)
Tax-Aware Overlay B Portfolio Overlay B Portfolio Tax-Aware Overlay C Portfolio Tax-Aware Overlay N Portfolio
0.65% (flat fee)
The Portfolios’ net assets on September 30, 2012 and September 30, 2011 are set
forth below:
Portfolio
09/30/12 Net Assets
($MM)
09/30/11 Net Assets
($MM)
Change ($MM)
Tax-Aware Overlay A Portfolio
$2,836.0 $2,646.8 $189.2
Overlay A Portfolio $1,457.3 $1,392.3 $65.0 Tax-Aware Overlay B Portfolio
$1,716.6 $1,561.1 $155.5
Overlay B Portfolio $1,063.5 $925.0 $138.5 Tax-Aware Overlay C Portfolio
$433.7 $395.2 $38.6
Tax-Aware Overlay N Portfolio
$376.6 $338.4 $38.2
5 The advisory fees of each Portfolio are based on the percentage of each Portfolio’s net assets, not a combination of any of the Portfolios shown.

5
The Adviser agreed to waive that portion of its management fees and/or reimburse
the Portfolios for that portion of the Portfolios’ total operating expenses to the degree
necessary to limit the Portfolios’ expense ratios to the amounts set forth below.6, 7
During the semi-annual period ending March 31, 2012, none of the Portfolios were
operating above their expense caps. Accordingly, the Overlay Portfolios’ expense
limitation undertakings were of no effect during the semi-annual period ended March 31,
2012.
Portfolio
Semi-Annual Period Ending 03/31/12
Total Expense Ratio8 Exp. Cap Gross
Tax-Aware Overlay A Portfolio Class 1
Class 2 1.20% 1.00%
1.14% 0.94%
Overlay A Portfolio Class 1
Class 2 1.20% 1.00%
1.15% 0.95%
Tax-Aware Overlay B Portfolio Class 1
Class 2 0.90% 0.75%
0.84% 0.69%
Overlay B Portfolio Class 1
Class 2 0.90% 0.75%
0.86% 0.71%
Tax-Aware Overlay C Portfolio Class 1
Class 2 0.90% 0.75%
0.88% 0.73%
Tax-Aware Overlay N Portfolio Class 1
Class 2 0.90% 0.75%
0.88% 0.73%
6 On January 25, 2012, the Adviser notified the Board that the Adviser had determined to extend the Expense Limitation Undertaking for the Overlay Portfolios through January 31, 2013. The agreement is terminable by the Adviser upon at least 60 days’ written notice. 7 The agreement allows for the Adviser to be reimbursed through January 31, 2013 for management fees that the Adviser waived or reimbursements that the Adviser made for fund expenses exceeding the Overlay Portfolios’ expense caps through January 31, 2013. The agreement provides that such payment shall be made only to the extent that the payment does not cause the Overlay Portfolios’ aggregate expenses to exceed, on an annual basis, their expense caps, and that such payment shall not exceed the amount of the offering expenses recorded by the Portfolios for financial reporting purposes on or before February 8, 2011. 8 Annualized.

6
I. MANAGEMENT FEES CHARGED TO INSTITUTIONAL AND OTHER CLIENTS
The advisory fees charged to investment companies which the Adviser manages
and sponsors are normally higher than those charged to similar sized institutional
accounts, including pension plans and sub-advised investment companies. The fee
differential reflects, among other things, different services provided to such clients, and
different liabilities assumed. Services provided by the Adviser to the Portfolios that are
not provided to non-investment company clients and sub-advised investment companies
include providing office space and personnel to serve as Fund Officers, who among other
responsibilities, make the certifications required under the Sarbanes–Oxley Act of 2002,
and coordinating with and monitoring the Portfolios’ third party service providers such as
Fund counsel, auditors, custodians, transfer agents and pricing services. The accounting,
administrative, legal and compliance requirements for the Portfolios are more costly than
those for institutional assets due to the greater complexities and time required for
investment companies. Servicing the Portfolios’ Private Client and Retail investors is
more time consuming and labor intensive compared to institutional clients since the
Adviser needs to communicate with a more extensive network of financial intermediaries
and shareholders. The Adviser also believes that it incurs substantial entrepreneurial risk
when offering a new mutual fund since establishing a new mutual fund requires a large
upfront investment and it may take a long time for the fund to achieve profitability since
the fund must be priced to scale from inception in order to be competitive and assets are
acquired one account at a time. In addition, managing the cash flow of an investment
company may be more difficult than managing that of a stable pool of assets, such as an
institutional account with little cash movement in either direction, particularly, if a fund

7
is in net redemption and the Adviser is frequently forced to sell securities to raise cash for
redemptions. However, managing a fund with positive cash flow may be easier at times
than managing a stable pool of assets. Finally, in recent years, investment advisers have
been sued by institutional clients and have suffered reputational damage both by the
attendant publicity and outcomes other than complete victories. Accordingly, the legal
and reputational risks associated with institutional accounts are greater than previously
thought, although still not equal to those related to the mutual fund industry.
Notwithstanding the Adviser’s view that managing an investment company is not
comparable to managing other institutional accounts because the services provided are
different, the Supreme Court has indicated consideration should be given to the advisory
fee charged to institutional accounts that have investment styles similar to the Portfolios.9
However, with respect to the Portfolios, the Adviser represented that there are no
institutional products in the Adviser’s Form ADV that have similar investment style as
the Portfolios.
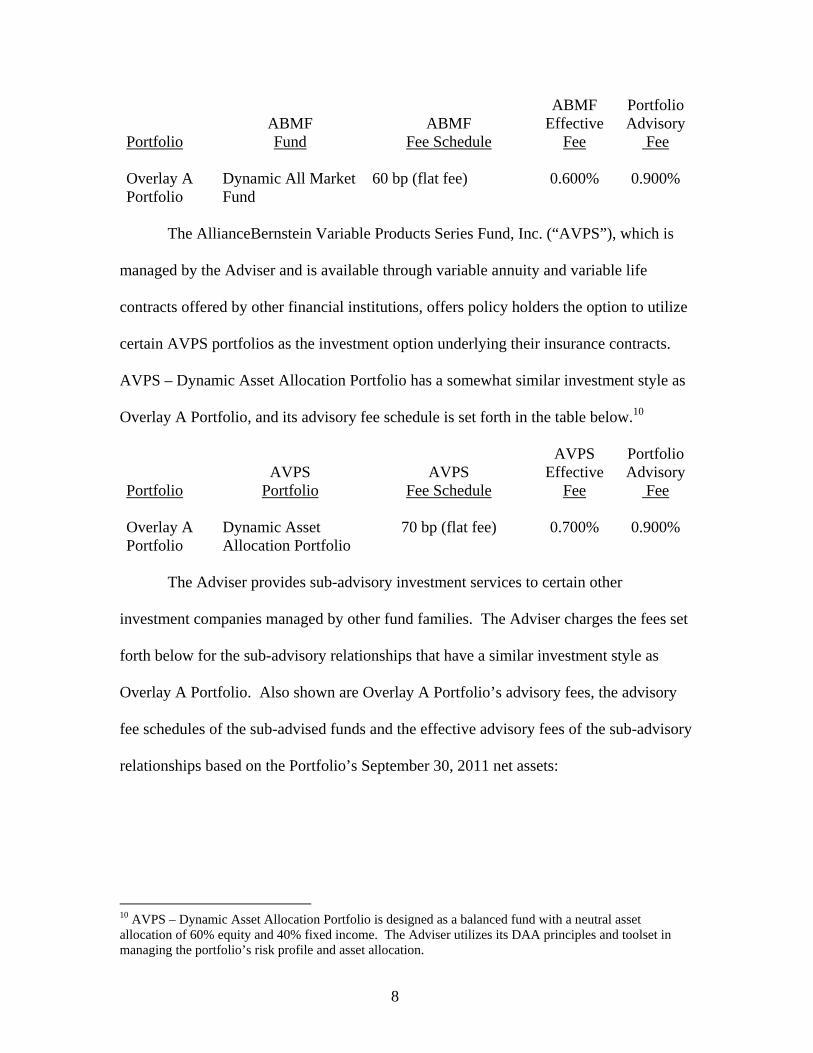
The Adviser manages the AllianceBernstein Cap Fund, Inc. - Dynamic All
Market Fund (“Dynamic All Market Fund”), a retail mutual fund which has a somewhat
similar investment style as Overlay A Portfolio. Set forth below is the advisory fee
schedule of Dynamic All Market Fund and what would have been the effective advisory
fee of the Overlay A Portfolio had the retail mutual fund’s fee schedule been applicable
to the Portfolio based on the Portfolio’s September 30, 2012 net assets:
9 The Supreme Court stated that “courts may give such comparisons the weight that they merit in light of the similarities and differences between the services that the clients in question require, but the courts must be wary of inapt comparisons.” Among the significant differences the Supreme Court noted that may exist between services provided to mutual funds and institutional accounts are “higher marketing costs.” Jones v. Harris at 1428.
8
Portfolio
ABMF Fund
ABMF
Fee Schedule
ABMF Effective
Fee
Portfolio Advisory
Fee Overlay A Portfolio
Dynamic All Market Fund
60 bp (flat fee) 0.600% 0.900%
The AllianceBernstein Variable Products Series Fund, Inc. (“AVPS”), which is
managed by the Adviser and is available through variable annuity and variable life
contracts offered by other financial institutions, offers policy holders the option to utilize
certain AVPS portfolios as the investment option underlying their insurance contracts.
AVPS – Dynamic Asset Allocation Portfolio has a somewhat similar investment style as
Overlay A Portfolio, and its advisory fee schedule is set forth in the table below.10
Portfolio
AVPS
Portfolio
AVPS
Fee Schedule
AVPS Effective
Fee
Portfolio Advisory
Fee Overlay A Portfolio
Dynamic Asset Allocation Portfolio
70 bp (flat fee) 0.700% 0.900%
The Adviser provides sub-advisory investment services to certain other
investment companies managed by other fund families. The Adviser charges the fees set
forth below for the sub-advisory relationships that have a similar investment style as
Overlay A Portfolio. Also shown are Overlay A Portfolio’s advisory fees, the advisory
fee schedules of the sub-advised funds and the effective advisory fees of the sub-advisory
relationships based on the Portfolio’s September 30, 2011 net assets:
10 AVPS – Dynamic Asset Allocation Portfolio is designed as a balanced fund with a neutral asset allocation of 60% equity and 40% fixed income. The Adviser utilizes its DAA principles and toolset in managing the portfolio’s risk profile and asset allocation.

9
Portfolio
Sub-advised Fund
Sub-advised Fund Fee Schedule
Sub-advised Fund Effective
Fee (%)
Portfolio Advisory Fee (%)
Overlay A Portfolio
Client #1 0.40% on first $100 million 0.35% on next $100 million 0.30% on the balance
0.310%
0.900%
Client #2 0.40% on first $250 million
0.35% on next $250 million 0.325% on next $500 million 0.30% on the balance
0.334%
0.900%
Client #3 0.35% on the first $400 million
0.30% on the balance 0.314% 0.900%
It is fair to note that the services the Adviser provides pursuant to sub-advisory
agreements are generally confined to the services related to the investment process; in
other words, they are not as comprehensive as the services provided to Overlay A
Portfolio by the Adviser. In addition, to the extent that certain of these sub-advisory
relationships are with affiliates of the Adviser, the fee schedules may not reflect arm’s
length bargaining or negotiations.
While it appears that certain sub-advisory relationships are paying a lower fee
than the Overlay A Portfolio, it is difficult to evaluate the relevance of such lower fees
due to differences in terms of the service provided, risks involved and other competitive
factors between the Portfolio and sub-advisory relationships. There could also be various
business-related reasons why an investment adviser would be willing to manage a sub-
advisory relationship investment related services for a different fee level than an
investment company it is sponsoring where the investment adviser is providing all the
services generally required by a registered investment company in addition to investment
services.

10
II. MANAGEMENT FEES CHARGED BY OTHER MUTUAL FUND COMPANIES FOR LIKE SERVICES.
Lipper, Inc. (“Lipper”), an analytical service that is not affiliated with the
Adviser, compared the fees charged to the Portfolios with fees charged to other
investment companies for similar services by other investment advisers.11 Lipper’s
analysis included the comparison of each Portfolio’s contractual management fee,12
estimated at the approximate current asset level of the subject Portfolio, to the median of
the Portfolio’s Lipper Expense Group (“EG”)13 and the Portfolio’s contractual
management fee ranking.
Lipper describes an EG as a representative sample of comparable funds. Lipper’s
standard methodology for screening funds to be included in an EG entails the
consideration of several fund criteria, including fund type, investment
classification/objective, load type and similar 12b-1/non-12b-1 service fees, asset (size)
comparability, and expense components and attributes. An EG will typically consist of
seven to twenty funds.
As noted previously, the Portfolios were not designed as stand-alone portfolios, in
contrast to their Lipper peers, which are stand-alone. Accordingly, the peers selected for
each Portfolio from Lipper’s Global Flexible universe were based primarily on asset size
and may be of limited value for comparison purposes.
11 The Supreme Court cautioned against accepting mutual fund fee comparisons without careful scrutiny since “these comparisons are problematic because these fees, like those challenged, may not be the product of negotiations conducted at arm’s length.” Jones v. Harris at 1429. 12 The contractual management fee is calculated by Lipper using each Portfolio’s contractual management fee rate at a hypothetical asset level. The hypothetical asset level is based on the combined current net assets of all classes of the Portfolio, rounded up to the next $25 million. Lipper’s total expense ratio information is based on the most recent annual report except as otherwise noted. A ranking of “1” means that the Portfolio has the lowest effective fee rate in the Lipper peer group. 13 Lipper does not consider average account size when constructing EGs. Funds with relatively small average account sizes tend to have a higher transfer agent expense ratio than comparable sized funds that have relatively large average account sizes.
11
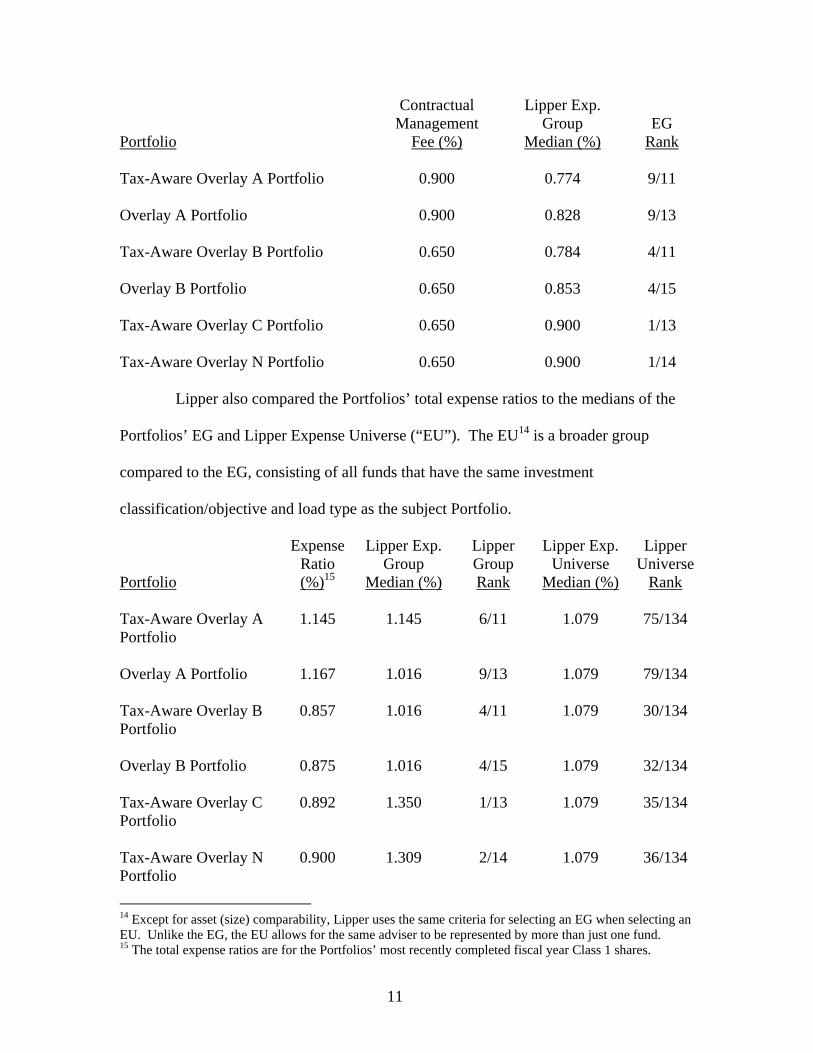
Portfolio
Contractual Management
Fee (%)
Lipper Exp. Group
Median (%)
EG
Rank Tax-Aware Overlay A Portfolio 0.900 0.774 9/11 Overlay A Portfolio 0.900 0.828 9/13 Tax-Aware Overlay B Portfolio 0.650 0.784 4/11 Overlay B Portfolio 0.650 0.853 4/15 Tax-Aware Overlay C Portfolio 0.650 0.900 1/13 Tax-Aware Overlay N Portfolio 0.650 0.900 1/14
Lipper also compared the Portfolios’ total expense ratios to the medians of the
Portfolios’ EG and Lipper Expense Universe (“EU”). The EU14 is a broader group
compared to the EG, consisting of all funds that have the same investment
classification/objective and load type as the subject Portfolio.
Portfolio
Expense Ratio (%)15
Lipper Exp. Group
Median (%)
Lipper Group Rank
Lipper Exp. Universe
Median (%)
Lipper Universe
Rank Tax-Aware Overlay A Portfolio
1.145 1.145 6/11 1.079 75/134
Overlay A Portfolio 1.167 1.016 9/13 1.079 79/134 Tax-Aware Overlay B Portfolio
0.857 1.016 4/11 1.079 30/134
Overlay B Portfolio 0.875 1.016 4/15 1.079 32/134 Tax-Aware Overlay C Portfolio
0.892 1.350 1/13 1.079 35/134
Tax-Aware Overlay N Portfolio
0.900 1.309 2/14 1.079 36/134
14 Except for asset (size) comparability, Lipper uses the same criteria for selecting an EG when selecting an EU. Unlike the EG, the EU allows for the same adviser to be represented by more than just one fund. 15 The total expense ratios are for the Portfolios’ most recently completed fiscal year Class 1 shares.

12
Based on this analysis, the Portfolios have lower contractual management fees
than their respective EG medians with the exception of Tax-Aware Overlay A Portfolio
and Overlay A Portfolio, which have higher contractual management fees.
The Portfolios have lower total expense ratios than their respective EG medians,
with the exception for Tax-Aware Overlay A Portfolio, which has an equal total expense
ratio, and Overlay A Portfolio, which has a higher total expense ratio.
III. COSTS TO THE ADVISER AND ITS AFFILIATES OF SUPPLYING SERVICES PURSUANT TO THE MANAGEMENT FEE ARRANGEMENT, EXCLUDING ANY INTRA-CORPORATE PROFIT.
The Adviser utilizes two profitability reporting systems, which operate
independently but are aligned with each other, to estimate the Adviser’s profitability in
connection with investment advisory services provided to the Portfolios. The Senior
Officer has retained a consultant to provide independent advice regarding the alignment
of the two profitability systems as well as the methodologies and allocations utilized by
both profitability systems. See Section IV for additional discussion.
IV. PROFIT MARGINS OF THE ADVISER AND ITS AFFILIATES FOR SUPPLYING SUCH SERVICES.
Members of the Adviser’s Controller’s Office provided the Board of Directors
information regarding the Adviser’s profitability attributable to the Portfolios. The
Adviser’s profitability with respect to the Portfolios increased in 2011 compared to 2010.
The Adviser provides the Portfolios with shareholder servicing services. For
these services, the Adviser charges Tax-Aware Overlay A Portfolio and Overlay A
Portfolio a fee of 0.20% of average daily net assets, and Overlay B Portfolio and the Tax-
Aware Overlay B, C and N Portfolios a fee of 0.15% of average daily net assets. Set

13
forth below are the fees paid by the Portfolios under the Shareholder Servicing
Agreement during the fiscal year ended September 30, 2011:
Portfolio
Shareholder Serving Agreement Fee
Tax-Aware Overlay A Portfolio $3,777,784 Overlay A Portfolio $2,058,920 Tax-Aware Overlay B Portfolio $1,317,311 Overlay B Portfolio $1,067,785 Tax-Aware Overlay C Portfolio $329,469 Tax-Aware Overlay N Portfolio $376,132
In addition to the Adviser’s direct profits from managing and providing certain
shareholder services to the Portfolios, certain of the Adviser’s affiliates have business
relationships with the Portfolios and may earn a profit from providing other services to
the Portfolios. The courts have referred to this type of business opportunity as “fall-out
benefits” to the Adviser and indicated that such benefits should be factored into the
evaluation of the total relationship between the Portfolios and the Adviser. Neither case
law nor common business practice precludes the Adviser’s affiliates from earning a
reasonable profit on this type of relationship provided the affiliates’ charges and services
are competitive.
During the fiscal year ended September 30, 2011, none of the Portfolios effected
brokerage transactions through and paid commissions to the Adviser’s affiliate, Sanford
C. Bernstein & Co., LLC (“SCB & Co.”) and/or its U.K. affiliate, Sanford C. Bernstein
Limited (“SCB Ltd.”), collectively “SCB”.
14
V. POSSIBLE ECONOMIES OF SCALE
The Adviser has indicated that economies of scale are being shared with
shareholders through pricing to scale, breakpoints, fee reductions/waivers and
enhancement to services.
An independent consultant, retained by the Senior Officer, provided the Board of
Directors information on the Adviser’s firm-wide average costs from 2005 through 2011
and the potential economies of scale. The independent consultant noted that from 2005
through 2007 the Adviser experienced significant growth in assets under management
(“AUM”). During this period, operating expenses increased, in part to keep up with
growth, and in part reflecting market returns. However, from 2008 through the first
quarter of 2009, AUM rapidly and significantly decreased due to declines in market value
and client withdrawals. When AUM rapidly decreased, some operating expenses
categories, including base compensation and office space, adjusted more slowly during
this period, resulting in an increase in average costs. Since 2009, AUM has experienced
less significant changes. The independent consultant noted that changes in operating
expenses reflect changes in business composition and business practices in response to
changes in financial markets. Finally, the independent consultant concluded that the
increase in average cost and the decline in net operating margin across the Adviser since
late 2008 are inconsistent with the view that there are currently reductions in average
costs due to economies of scale that can be shared with the AllianceBernstein Mutual
Funds managed by the Adviser through lower fees.

15
The Adviser has indicated that economies of scale are being shared with
shareholders through fee structures,16 subsidies and enhancement to services. Based on
some of the professional literature that has considered economies of scale in the mutual
fund industry, it is thought that to the extent economies of scale exist, they may more
often exist across a fund family as opposed to a specific fund. This is because the costs
incurred by the Adviser, such as investment research or technology for trading or
compliance systems, can be spread across a greater asset base as the fund family
increases in size. It is also possible that as the level of services required to operate a
successful investment company has increased over time, and advisory firms make such
investments in their business to provide services, there may be a sharing of economies of
scale without a reduction in advisory fees.
Previously in September 2007, the independent consultant provided the Board of
Directors an update of the Deli17 study on advisory fees and various fund
characteristics.18 The independent consultant first reiterated the results of his previous
two dimensional comparison analysis (fund size and family size) with the Board of
Directors.19 The independent consultant then discussed the results of the regression
model that was utilized to study the effects of various factors on advisory fees. The
regression model output indicated that the bulk of the variation in fees predicted were 16 Fee structures include fee reductions, pricing at scale and breakpoints in advisory fee schedules. 17 The Deli study, originally published in 2002 based on 1997 data and updated for the February 2008 Presentation, may be of diminished value due to the age of the data used in the presentation and the changes experienced in the industry over the last four years. 18 As mentioned previously, the Supreme Court cautioned against accepting mutual fund fee comparisons without careful scrutiny since the fees may not be the product of negotiations conducted at arm’s length. See Jones V. Harris at 1429. 19 The two dimensional analysis showed patterns of lower advisory fees for funds with larger asset sizes and funds from larger family sizes compared to funds with smaller asset sizes and funds from smaller family sizes, which according to the independent consultant is indicative of a sharing of economies of scale and scope. However, in less liquid and active markets, such is not the case, as the empirical analysis showed potential for diseconomies of scale in those markets. The empirical analysis also showed diminishing economies of scale and scope as funds surpassed a certain high level of assets.

16
explained by various factors, but substantially by fund AUM, family AUM, index fund
indicator and investment style.
VI. NATURE AND QUALITY OF THE ADVISER’S SERVICES INCLUDING THE PERFORMANCE OF THE PORTFOLIO.
With assets under management of approximately $411 billion as of August 31,
2012, the Adviser has the investment experience to manage the Portfolios and provide
non-investment services (described in Section I) to the Portfolios.
The information prepared by Lipper in the table below shows the 1 year gross
performance returns of the Portfolios20 relative to the medians of the Portfolios’ Lipper
Performance Groups (“PG”) and Lipper Performance Universes (“PU”) 21 for the period
ended July 31, 2012.22 Also shown are the gross performance rankings of the Portfolios.
It should be noted that the Overlay Portfolios are not designed to be used as stand-alone
investments, unlike its peers, and are used only in conjunction with globally diversified
Private Client portfolios. Accordingly, the Lipper performance comparisons for the
Overlay Portfolios are shown only for information purposes and do not indicate how
successful the Overlay Portfolios are in meeting their investment objectives.
Portfolio
Return (%) PG
Median (%)PU
Median (%) PG
Rank PU
Rank
Tax-Aware Overlay A Portfolio 1 year -7.25 -0.59 -1.54 10/11 199/247 Overlay A Portfolio 1 year -3.79 0.08 -1.54 12/13 164/247
20 The gross performance returns are for the Class 1 shares for the Overlay Portfolios. 21 The Portfolios’ PGs are identical to the Portfolios’ EGs. The Portfolios’ PUs are not identical to the Portfolios’ EUs as the criteria for including/excluding a fund in/from a PU are somewhat different from that of an EU. 22 Note that the current Lipper investment classification/objective dictates the PG and PU throughout the life of the fund even if a fund had a different investment classification/objective at a different point in time.
17
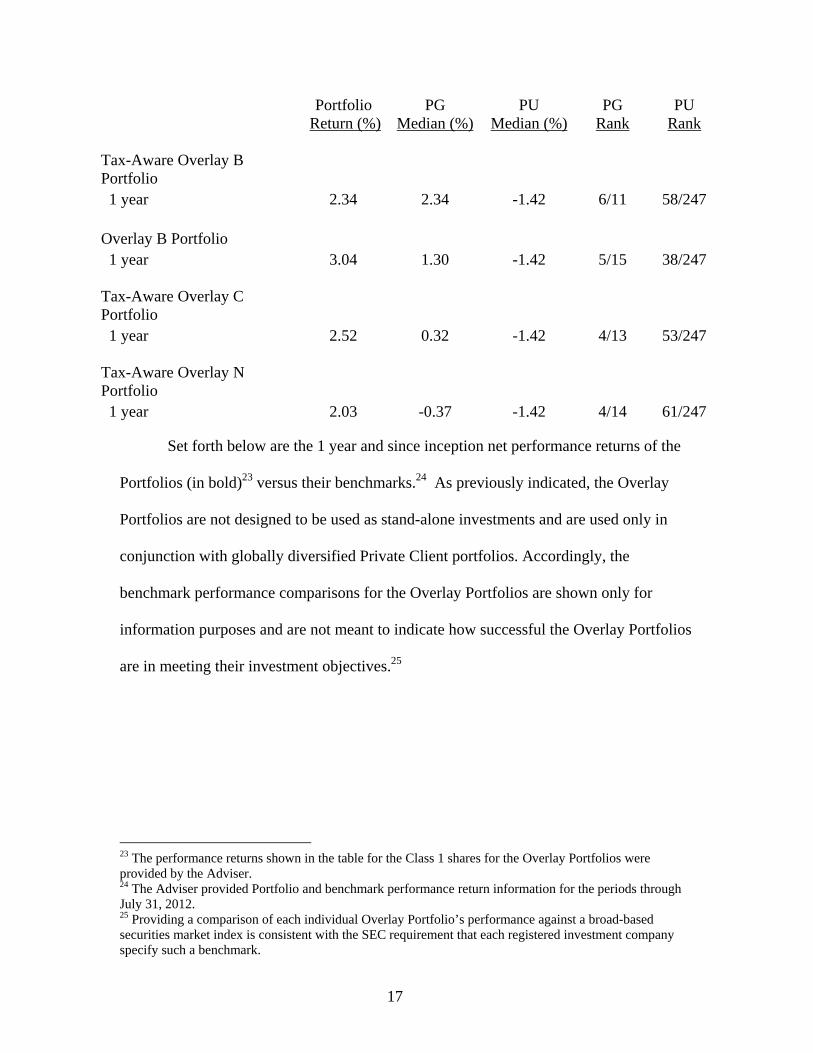
Portfolio
Return (%) PG
Median (%)PU
Median (%) PG
Rank PU
Rank Tax-Aware Overlay B Portfolio 1 year 2.34 2.34 -1.42 6/11 58/247 Overlay B Portfolio 1 year 3.04 1.30 -1.42 5/15 38/247 Tax-Aware Overlay C Portfolio
1 year 2.52 0.32 -1.42 4/13 53/247 Tax-Aware Overlay N Portfolio 1 year 2.03 -0.37 -1.42 4/14 61/247
Set forth below are the 1 year and since inception net performance returns of the
Portfolios (in bold)23 versus their benchmarks.24 As previously indicated, the Overlay
Portfolios are not designed to be used as stand-alone investments and are used only in
conjunction with globally diversified Private Client portfolios. Accordingly, the
benchmark performance comparisons for the Overlay Portfolios are shown only for
information purposes and are not meant to indicate how successful the Overlay Portfolios
are in meeting their investment objectives.25
23 The performance returns shown in the table for the Class 1 shares for the Overlay Portfolios were provided by the Adviser. 24 The Adviser provided Portfolio and benchmark performance return information for the periods through July 31, 2012. 25 Providing a comparison of each individual Overlay Portfolio’s performance against a broad-based securities market index is consistent with the SEC requirement that each registered investment company specify such a benchmark.

18
Periods Ending July 31, 2012 Annualized Net Performance (%)
1 Year (%)
Since Inception (%)
Tax-Aware Overlay A Portfolio -8.30 3.22 S&P 500 Stock Index 9.13 13.64 Inception Date: February 8, 2010 Overlay A Portfolio -4.90 5.01 S&P 500 Stock Index 9.13 13.64 Inception Date: February 8, 2010 Tax-Aware Overlay B Portfolio 1.47 5.22 Barclays Capital 5 Year GO Municipal Bond Index 4.60 4.47 Inception Date: February 8, 2010 Overlay B Portfolio 2.15 6.02 Barclays Capital Global Aggregate Bond Index 6.94 5.25 Inception Date: February 8, 2010 Tax-Aware Overlay C Portfolio 1.61 5.24 Barclays Capital 5 Year GO Municipal Bond Index 4.60 4.47 Inception Date: February 8, 2010 Tax-Aware Overlay N Portfolio 1.12 4.99 Barclays Capital 5 Year GO Municipal Bond Index 4.60 4.47 Inception Date: February 8, 2010
As indicated previously, the Overlay Portfolios were not designed as stand-alone
portfolios, in contrast to the Portfolios’ Lipper peers. The Overlay Portfolios are used in
conjunction with globally diversified Private Client portfolios. The table below shows
the impact of the Overlay Portfolios, herein referred to as DAA as of July 31, 2012 on a
Tax-Aware account and on a Non-Taxable account:26
26 Information with respect to DAA’s impact on a Tax-Aware account and a Non-Taxable account was provided by the Adviser.

19
Tax-Aware Portfolio 1 Year Period 1 Year Period Inception- Inception- Ending 7/31/12 Ending 7/31/12 7/31/2012 7/31/2012
% Return % Volatility % Return % Volatility
30/70 Investor Fully Diversified - With DAA 2.35 6.51 4.97 5.69 Fully Diversified - Traditional Portfolio 2.70 7.37 4.85 6.17 Impact of DAA -0.35 -0.86 0.12 -0.48
Fully Diversified - Benchmark27 5.58 6.13 7.0 5.14
60/40 Investor Fully Diversified - With DAA -1.80 12.91 4.65 11.25 Fully Diversified - Traditional Portfolio -0.73 15.23 4.85 12.62 Impact of DAA -1.07 -2.32 -0.20 -1.37
Fully Diversified - Benchmark28 4.50 12.79 8.98 10.56
80/20 Investor Fully Diversified - With DAA -4.67 17.22 4.25 15.00 Fully Diversified - Traditional Portfolio -3.22 20.51 4.62 16.96 Impact of DAA -1.45 -3.29 -0.37 -1.96
Fully Diversified - Benchmark29 3.58 17.27 10.11 14.21 Non-Taxable Portfolio 1 Year Period 1 Year Period Inception- Inception-
Ending 7/31/12 Ending 7/31/12 7/31/2012 7/31/2012 % Return % Volatility % Return % Volatility
30/70 Investor Fully Diversified - With DAA 2.99 5.94 6.83 5.34 Fully Diversified - Traditional Portfolio 3.33 6.65 7.16 5.87 Impact of DAA -0.34 -0.71 -0.33 -0.53
27 Benchmark is 21% S&P 500 Stock Index, 7.5% MSCI EAFE, 1.5% MSCI Emerging Markets, 70% Barclays 1-10 Year Munis. 28 Benchmark is 42% S&P 500 Stock Index, 15% MSCI EAFE, 3% MSCI Emerging Markets, 40% Barclays 1-10 Year Munis. 29 Benchmark is 56% S&P 500 Stock Index, 20% MSCI EAFE, 4% MSCI Emerging Markets, 20% Barclays 1-10 Year Munis.

20
Non-Taxable Portfolio 1 Year Period 1 Year Period Inception- Inception- Ending 7/31/12 Ending 7/31/12 7/31/2012 7/31/2012
% Return % Volatility % Return % Volatility Fully Diversified - Benchmark30 6.36 5.45 8.48 4.82
60/40 Investor Fully Diversified - With DAA -0.44 12.38 6.56 10.88 Fully Diversified - Traditional Portfolio 0.18 14.64 6.96 12.59 Impact of DAA -0.62 -2.26 -0.40 -1.71
Fully Diversified - Benchmark31 5.17 12.15 10.20 10.37
80/20 Investor Fully Diversified - With DAA -2.86 16.80 6.20 14.80 Fully Diversified - Traditional Portfolio -2.14 20.13 6.59 17.28 Impact of DAA -0.72 -3.33 -0.39 -2.48
Fully Diversified - Benchmark32 4.16 16.79 11.15 14.31 CONCLUSION:
Based on the factors discussed above the Senior Officer’s conclusion is that the
investment advisory fees for the Overlay Portfolios are reasonable and within the range
of what would have been negotiated at arm’s-length in light of all the surrounding
circumstances. This conclusion with respect to each Portfolio is based on an evaluation
of all of these factors and no single factor was dispositive.
Dated: November 12, 2012
30 Benchmark is 20% S&P 500 Stock Index, 7.1% MSCI EAFE, 1.4% MSCI Emerging Markets, 3.0% FTSE/EPRA NAREIT, 68.5% Barclays US Aggregate. 31 Benchmark is 39.1% S&P 500 Stock Index, 13.9% MSCI EAFE, 2.8% MSCI Emerging Markets, 8.4% FTSE/EPRA NAREIT, 35.8% Barclays US Aggregate. 32 Benchmark is 51.8% S&P 500 Stock Index, 18.5% MSCI EAFE, 3.7% MSCI Emerging Markets, 12% FTSE/EPRA NAREIT, 14% Barclays US Aggregate.

THIS PAGE IS INTENTIONALLY LEFT BLANK.

SUMMARY OF SENIOR OFFICER’S EVALUATION OF
INVESTMENT ADVISORY AGREEMENT1
The following is a summary of the evaluation of the Investment Advisory
Agreement between AllianceBernstein L.P. (the “Adviser”) and Sanford C. Bernstein
Fund, Inc. (the “Fund”) with respect to the following Overlay Portfolios (the
“Portfolios”):2
Tax-Aware Overlay A Portfolio
Overlay A Portfolio
Tax-Aware Overlay B Portfolio
Overlay B Portfolio
Tax-Aware Overlay C Portfolio
Tax-Aware Overlay N Portfolio
The evaluation of the Investment Advisory Agreement was prepared by Philip L.
Kirstein, the Senior Officer of the Fund for the Directors of the Fund, as required by the
August 2004 agreement between the Adviser and the New York State Attorney General
(the “NYAG”). The Senior Officer’s evaluation of the Investment Advisory Agreement
is not meant to diminish the responsibility or authority of the Board of Directors of the
Fund to perform its duties pursuant to Section 15 of the Investment Company Act of
1940 (the “40 Act”) and applicable state law. The purpose of the summary is to provide
shareholders with a synopsis of the independent evaluation of the reasonableness of the
advisory fees proposed to be paid by the Portfolios which was provided to the Directors
in connection with their review of the proposed approval of the continuance of the
Investment Advisory Agreement.
1 The Senior Officer’s evaluation, excluding the conclusion, was completed and provided to the Board of
Directors on October 4, 2011 and discussed with the Board on October 11, 2011. The Adviser provided
additional information in response to questions raised by the directors. The conclusion was completed and
provided to the Board on October 19, 2011. The full evaluation was discussed with the Board of Directors
on October 19- 20, 2011. 2 Future references to the various Portfolios do not include “Sanford C. Bernstein.” It also should be noted
that references in the fee summary pertaining to performance and expense ratios refer to the Class 1shares
of the Portfolios unless otherwise indicated.

2
The Overlay Portfolios, which utilizes the Adviser’s Dynamic Asset Allocation
(“DAA”) service, are not designed to be used as stand-alone investments and are used
only in conjunction with globally diversified Private Client portfolios. Overlay A
Portfolio and Tax-Aware Overlay A Portfolio are intended for use in Private Client
accounts that have a higher equity weighting (e.g., 20% fixed income and 80% equity).
Overlay B Portfolio, Tax-Aware Overlay B Portfolio, Tax-Aware Overlay C Portfolio
and Tax-Aware Overlay N Portfolio are intended for use in Private Client accounts that
have a higher fixed income weighting (e.g., 70% fixed income and 30% equity).3
Combinations of the Overlay Portfolios can be used to tailor the overlay service to suit a
variety of Private Client account asset allocations. When applied in a systematic way
over time, the overlay strategies are designed to: reduce portfolio volatility, reduce the
probability of large losses as a result of negative “tail events”, and maintain returns over
time. The side effect of such strategies is reducing the probability of large gains. These
potential benefits are intended to be realized at the level of a Private Client’s account,
which would include other investments, such as individual securities as well as holdings
in one or more of the Portfolios.
The Senior Officer’s evaluation considered the following factors:
1. Advisory fees charged to institutional and other clients of the Adviser
for like services;
2. Advisory fees charged by other mutual fund companies for like
services;
3 Both the Overlay C Portfolio and the Overlay N Portfolio seek to minimize the impact of federal and state
taxes for shareholders resident in California and New York, respectively.

3
3. Costs to the Adviser and its affiliates of supplying services pursuant to
the advisory agreement, excluding any intra-corporate profit;
4. Profit margins of the Adviser and its affiliates from supplying such
services;
5. Possible economies of scale as the Portfolios grow larger; and
6. Nature and quality of the Adviser’s services including the performance
of the Portfolios.
These factors, with the exception of the first factor, are generally referred to as the
“Gartenberg factors,” which were articulated by the United States Court of Appeals for
the Second Circuit in 1982. Gartenberg v. Merrill Lynch Asset Management, Inc., 694 F.
2d 923 (2d Cir. 1982). On March 30, 2010, the Supreme Court held the Gartenberg
decision was correct in its basic formulation of what §36(b) requires: to face liability
under §36(b), “an investment adviser must charge a fee that is so disproportionately large
that it bears no reasonable relationship to the services rendered and could not have been
the product of arms length bargaining.” Jones v. Harris Associates L.P., 130 S. Ct. 1418
(2010). In Jones, the Court stated the Gartenberg approach fully incorporates the correct
understanding of fiduciary duty within the context of section 36(b) and noted with
approval that “Gartenberg insists that all relevant circumstances be taken into account”
and “uses the range of fees that might result from arms-length bargaining as the
benchmark for reviewing challenged fees.”4
4 Jones v. Harris at 1427.

4
PORTFOLIOS’ ADVISORY FEES, EXPENSE REIMBURSEMENTS & RATIOS
The Adviser proposed that the Portfolios pay the advisory fees set forth below for
receiving the services to be provided pursuant to the Investment Advisory Agreement.
The proposed advisory fee schedules did not contain any changes from the previous year.
Portfolio
Advisory Fee Based on % of
Average Daily Net Assets5
Tax-Aware Overlay A Portfolio
Overlay A Portfolio
0.90% (flat fee)
Tax-Aware Overlay B Portfolio
Overlay B Portfolio
Tax-Aware Overlay C Portfolio
Tax-Aware Overlay N Portfolio
0.65% (flat fee)
The Portfolios’ net assets on September 30, 2011 and September 30, 2010 are set
forth below:
Portfolio
09/30/11
Net Assets
($MM)
09/30/10
Net Assets
($MM)
Change
($MM)
Tax-Aware Overlay A
Portfolio $2,646.8 $1,701.7 $945.1
Overlay A Portfolio $1,392.3 $866.0 $526.3
Tax-Aware Overlay B
Portfolio $1,561.1 $953.2 $607.9
Overlay B Portfolio $925.0 $641.8 $283.2
Tax-Aware Overlay C
Portfolio $395.2 $239.1 $156.1
Tax-Aware Overlay N
Portfolio $338.4 $219.3 $119.1
5 The advisory fees of each Portfolio are based on the percentage of each Portfolio’s net assets, not a
combination of any of the Portfolios shown.

5
The Adviser agreed to waive that portion of its management fees and/or reimburse
the Portfolios for that portion of the Portfolios’ total operating expenses to the degree
necessary to limit the Portfolios’ expense ratios to the amounts set forth below.6 The
agreement allows for the Adviser to be reimbursed through January 31, 2013 for
management fees that the Adviser waived or reimbursements that the Adviser made for
fund expenses exceeding the Overlay Portfolios’ expense caps through January 31, 2012.
The agreement provides that such payment shall be made only to the extent that the
payment does not cause the Overlay Portfolios’ aggregate expenses to exceed, on an
annual basis, their expense caps, and that such payment shall not exceed the amount of
the offering expenses recorded by the Portfolios for financial reporting purposes on or
before February 8, 2011. Set forth below are the Portfolios’ total expense ratios for the
semi-annual period ending March 31, 2011:
Portfolio
Semi-Annual Period
Ending 03/31/11
Total Expense Ratio7
Exp. Cap Gross
Tax-Aware Overlay A Portfolio Class 1
Class 2
1.20%
1.00%
1.14%
0.95%
Overlay A Portfolio Class 1
Class 2
1.20%
1.00%
1.17%
0.97%
Tax-Aware Overlay B Portfolio Class 1
Class 2
0.90%
0.75%
0.87%
0.72%
Overlay B Portfolio Class 1
Class 2
0.90%
0.75%
0.87%
0.72%
6 On January 26, 2011, the Adviser notified the Board that the Adviser had determined to extend the
Expense Limitation Undertaking for the Overlay Portfolios through January 31, 2012. The agreement is
terminable by the Adviser upon at least 60 days’ written notice. 7 Annualized.

6
Portfolio
Semi-Annual Period
Ending 03/31/11
Total Expense Ratio7
Tax-Aware Overlay C Portfolio Class 1
Class 2
0.90%
0.75%
0.90%
0.75%
Tax-Aware Overlay N Portfolio Class 1
Class 2
0.90%
0.75%
0.91%
0.76%
I. MANAGEMENT FEES CHARGED TO INSTITUTIONAL AND OTHER CLIENTS
The advisory fees charged to investment companies which the Adviser manages
and sponsors are normally higher than those charged to similar sized institutional
accounts, including pension plans and sub-advised investment companies. The fee
differential reflects, among other things, different services provided to such clients, and
different liabilities assumed. Services provided by the Adviser to the Portfolios that are
not provided to non-investment company clients and sub-advised investment companies
include providing office space and personnel to serve as Fund Officers, who among other
responsibilities, make the certifications required under the Sarbanes–Oxley Act of 2002,
and coordinating with and monitoring the Portfolios’ third party service providers such as
Fund counsel, auditors, custodians, transfer agents and pricing services. The accounting,
administrative, legal and compliance requirements for the Portfolios are more costly than
those for institutional assets due to the greater complexities and time required for
investment companies. Servicing the Portfolios’ Private Client and Retail investors is
more time consuming and labor intensive compared to institutional clients since the
Adviser needs to communicate with a more extensive network of financial intermediaries
and shareholders. The Adviser also believes that it incurs substantial entrepreneurial risk
when offering a new mutual fund since establishing a new mutual fund requires a large

7
upfront investment and it may take a long time for the fund to achieve profitability since
the fund must be priced to scale from inception in order to be competitive and assets are
acquired one account at a time. In addition, managing the cash flow of an investment
company may be more difficult than managing that of a stable pool of assets, such as an
institutional account with little cash movement in either direction, particularly, if a fund
is in net redemption and the Adviser is frequently forced to sell securities to raise cash for
redemptions. However, managing a fund with positive cash flow may be easier at times
than managing a stable pool of assets. Finally, in recent years, investment advisers have
been sued by institutional clients and have suffered reputational damage both by the
attendant publicity and outcomes other than complete victories. Accordingly, the legal
and reputational risks associated with institutional accounts are greater than previously
thought, although still not equal to those related to the mutual fund industry.
Notwithstanding the Adviser’s view that managing an investment company is not
comparable to managing other institutional accounts because the services provided are
different, the Supreme Court has indicated consideration should be given to the advisory
fee charged to institutional accounts that have investment styles similar to the Portfolios.8
However, with respect to the Portfolios, the Adviser represented that there are no
institutional products in the Adviser’s Form ADV that have similar investment style as
the Portfolios.
The Adviser manages the AllianceBernstein Cap Fund, Inc. - Dynamic All
Market Plus Fund (“Dynamic All Market Plus Fund”), a retail mutual fund which has a
8 The Supreme Court stated that “courts may give such comparisons the weight that they merit in light of
the similarities and differences between the services that the clients in question require, but the courts must
be wary of inapt comparisons.” Among the significant differences the Supreme Court noted that may exist
between services provided to mutual funds and institutional accounts are “higher marketing costs.” Jones v.
Harris at 1428.

8
somewhat similar investment style as Overlay A Portfolio. Set forth below are the
advisory fee schedule of Dynamic All Market Plus Fund and what would have been the
effective advisory fee of the Overlay A Portfolio had the retail mutual fund’s fee schedule
been applicable to the Portfolio based on the Portfolio’s September 30, 2011 net assets:
Portfolio
ABMF
Fund
ABMF
Fee Schedule
ABMF
Effective
Fee
Portfolio
Advisory
Fee
Overlay A
Portfolio
Dynamic All Market
Plus Fund
90 bp (flat fee) 0.900% 0.900%
The Adviser provides sub-advisory investment services to certain other
investment companies managed by other fund families. The Adviser charges the fees set
forth below for the sub-advisory relationships that have a similar investment style as
Overlay A Portfolio. Also shown are Overlay A Portfolio’s advisory fees, the advisory
fee schedules of the sub-advised funds and the effective advisory fees of the sub-advisory
relationships based on the Portfolio’s September 30, 2011 net assets:
Portfolio
Sub-advised
Fund
Sub-advised Fund
Fee Schedule
Sub-advised
Fund Effective
Fee (%)
Portfolio
Advisory
Fee (%)
Overlay A
Portfolio
Client #1 0.40% on first $100 million
0.35% on next $100 million
0.30% on the balance
0.336%
0.900%
Client #2 0.40% on first $250 million
0.35% on next $250 million
0.325% on next $500 million
0.30% on the balance
0.311%
0.900%
It is fair to note that the services the Adviser provides pursuant to sub-advisory
agreements are generally confined to the services related to the investment process; in

9
other words, they are not as comprehensive as the services provided to Overlay A
Portfolio by the Adviser.
While it appears that certain sub-advisory relationships are paying a lower fee
than the Overlay A Portfolio, it is difficult to evaluate the relevance of such lower fees
due to differences in terms of the service provided, risks involved and other competitive
factors between the Portfolio and sub-advisory relationships. There could also be various
business-related reasons why an investment adviser would be willing to manage a sub-
advisory relationship investment related services for a different fee level than an
investment company it is sponsoring where the investment adviser is providing all the
services generally required by a registered investment company in addition to investment
services.
II. MANAGEMENT FEES CHARGED BY OTHER MUTUAL FUND COMPANIES
FOR LIKE SERVICES.
Lipper, Inc. (“Lipper”), an analytical service that is not affiliated with the
Adviser, compared the fees charged to the Portfolios with fees charged to other
investment companies for similar services by other investment advisers.9 Lipper’s
analysis included the comparison of each Portfolio’s contractual management fee,10
estimated at the approximate current asset level of the subject Portfolio, to the median of
9 The Supreme Court cautioned against accepting mutual fund fee comparisons without careful scrutiny
since “these comparisons are problematic because these fees, like those challenged, may not be the product
of negotiations conducted at arm’s length.” Jones v. Harris at 1429. 10
The contractual management fee is calculated by Lipper using each Portfolio’s contractual management
fee rate at a hypothetical asset level. The hypothetical asset level is based on the combined current net
assets of all classes of the Portfolio, rounded up to the next $25 million. Lipper’s total expense ratio
information is based on the most recent annual report except as otherwise noted. A ranking of “1” means
that the Portfolio has the lowest effective fee rate in the Lipper peer group.
10
the Portfolio’s Lipper Expense Group (“EG”)11
and the Portfolio’s contractual
management fee ranking.
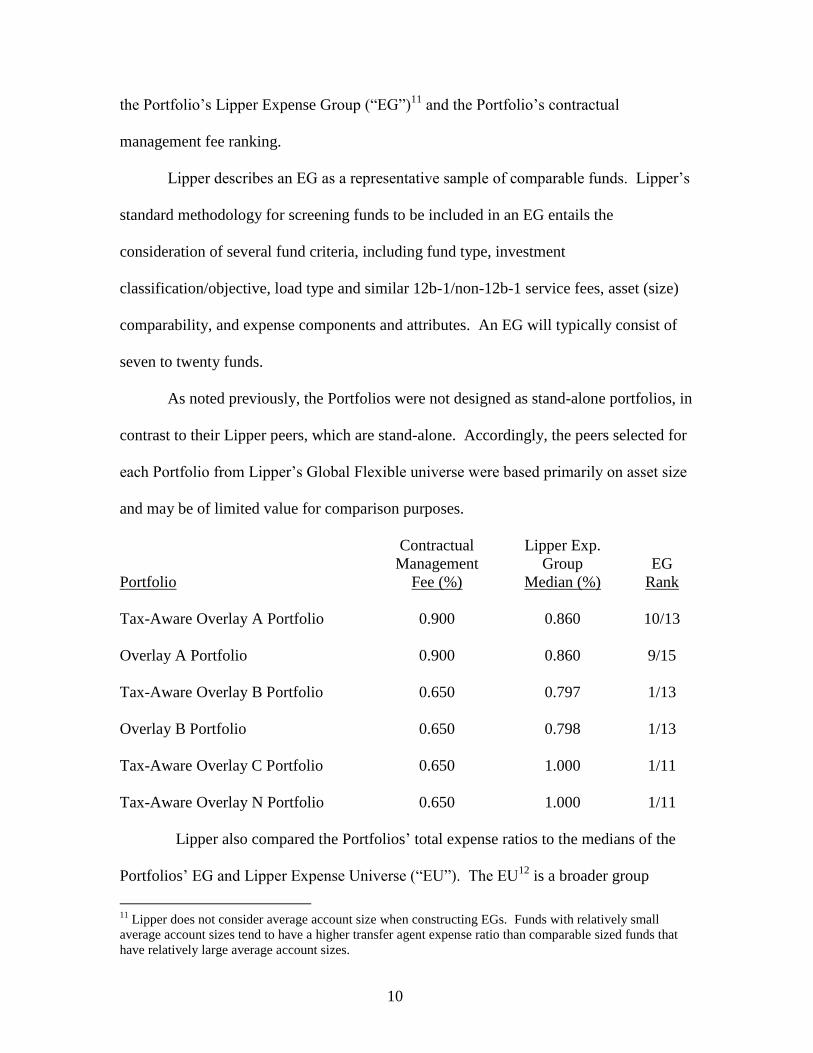
Lipper describes an EG as a representative sample of comparable funds. Lipper’s
standard methodology for screening funds to be included in an EG entails the
consideration of several fund criteria, including fund type, investment
classification/objective, load type and similar 12b-1/non-12b-1 service fees, asset (size)
comparability, and expense components and attributes. An EG will typically consist of
seven to twenty funds.
As noted previously, the Portfolios were not designed as stand-alone portfolios, in
contrast to their Lipper peers, which are stand-alone. Accordingly, the peers selected for
each Portfolio from Lipper’s Global Flexible universe were based primarily on asset size
and may be of limited value for comparison purposes.
Portfolio
Contractual
Management
Fee (%)
Lipper Exp.
Group
Median (%)
EG
Rank
Tax-Aware Overlay A Portfolio 0.900 0.860 10/13
Overlay A Portfolio 0.900 0.860 9/15
Tax-Aware Overlay B Portfolio 0.650 0.797 1/13
Overlay B Portfolio 0.650 0.798 1/13
Tax-Aware Overlay C Portfolio 0.650 1.000 1/11
Tax-Aware Overlay N Portfolio 0.650 1.000 1/11
Lipper also compared the Portfolios’ total expense ratios to the medians of the
Portfolios’ EG and Lipper Expense Universe (“EU”). The EU12
is a broader group
11
Lipper does not consider average account size when constructing EGs. Funds with relatively small
average account sizes tend to have a higher transfer agent expense ratio than comparable sized funds that
have relatively large average account sizes.
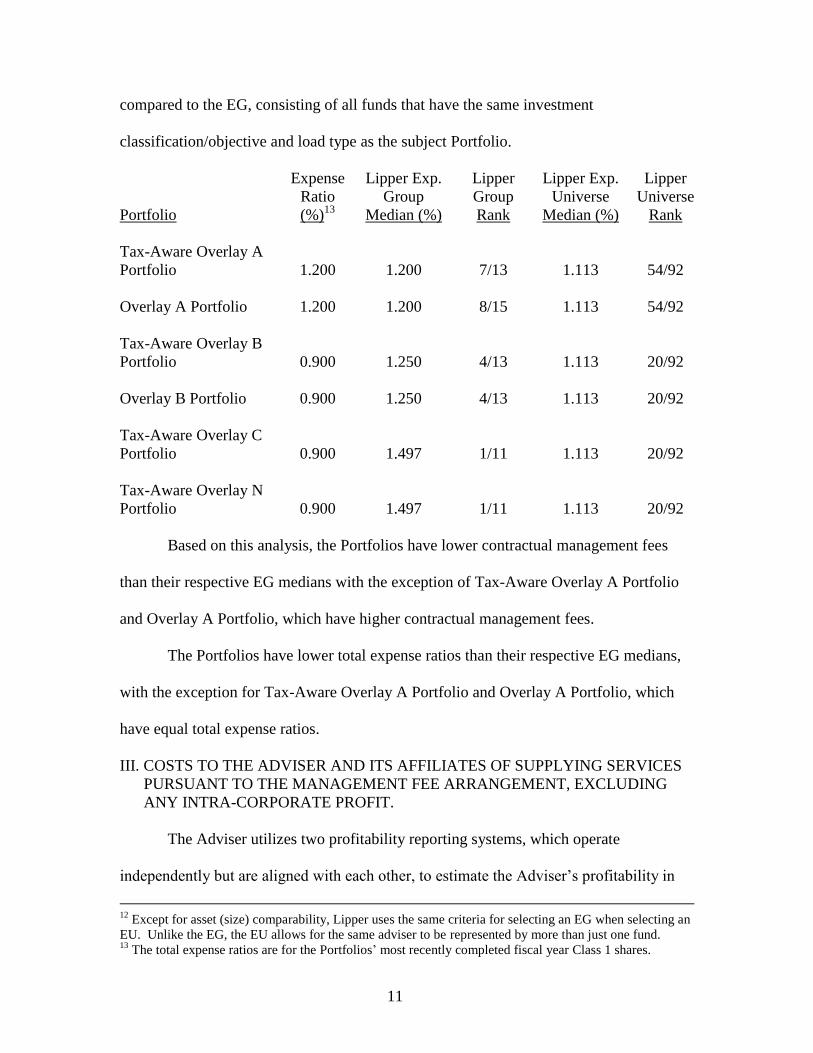
11
compared to the EG, consisting of all funds that have the same investment
classification/objective and load type as the subject Portfolio.
Portfolio
Expense
Ratio
(%)13
Lipper Exp.
Group
Median (%)
Lipper
Group
Rank
Lipper Exp.
Universe
Median (%)
Lipper
Universe
Rank
Tax-Aware Overlay A
Portfolio 1.200 1.200 7/13 1.113 54/92
Overlay A Portfolio 1.200 1.200 8/15 1.113 54/92
Tax-Aware Overlay B
Portfolio 0.900 1.250 4/13 1.113 20/92
Overlay B Portfolio 0.900 1.250 4/13 1.113 20/92
Tax-Aware Overlay C
Portfolio 0.900 1.497 1/11 1.113 20/92
Tax-Aware Overlay N
Portfolio 0.900 1.497 1/11 1.113 20/92
Based on this analysis, the Portfolios have lower contractual management fees
than their respective EG medians with the exception of Tax-Aware Overlay A Portfolio
and Overlay A Portfolio, which have higher contractual management fees.
The Portfolios have lower total expense ratios than their respective EG medians,
with the exception for Tax-Aware Overlay A Portfolio and Overlay A Portfolio, which
have equal total expense ratios.
III. COSTS TO THE ADVISER AND ITS AFFILIATES OF SUPPLYING SERVICES
PURSUANT TO THE MANAGEMENT FEE ARRANGEMENT, EXCLUDING
ANY INTRA-CORPORATE PROFIT.
The Adviser utilizes two profitability reporting systems, which operate
independently but are aligned with each other, to estimate the Adviser’s profitability in
12
Except for asset (size) comparability, Lipper uses the same criteria for selecting an EG when selecting an
EU. Unlike the EG, the EU allows for the same adviser to be represented by more than just one fund. 13
The total expense ratios are for the Portfolios’ most recently completed fiscal year Class 1 shares.
12
connection with investment advisory services provided to the Portfolios. The Senior
Officer has retained a consultant to provide independent advice regarding the alignment
of the two profitability systems as well as the methodologies and allocations utilized by
both profitability systems. See Section IV for additional discussion.
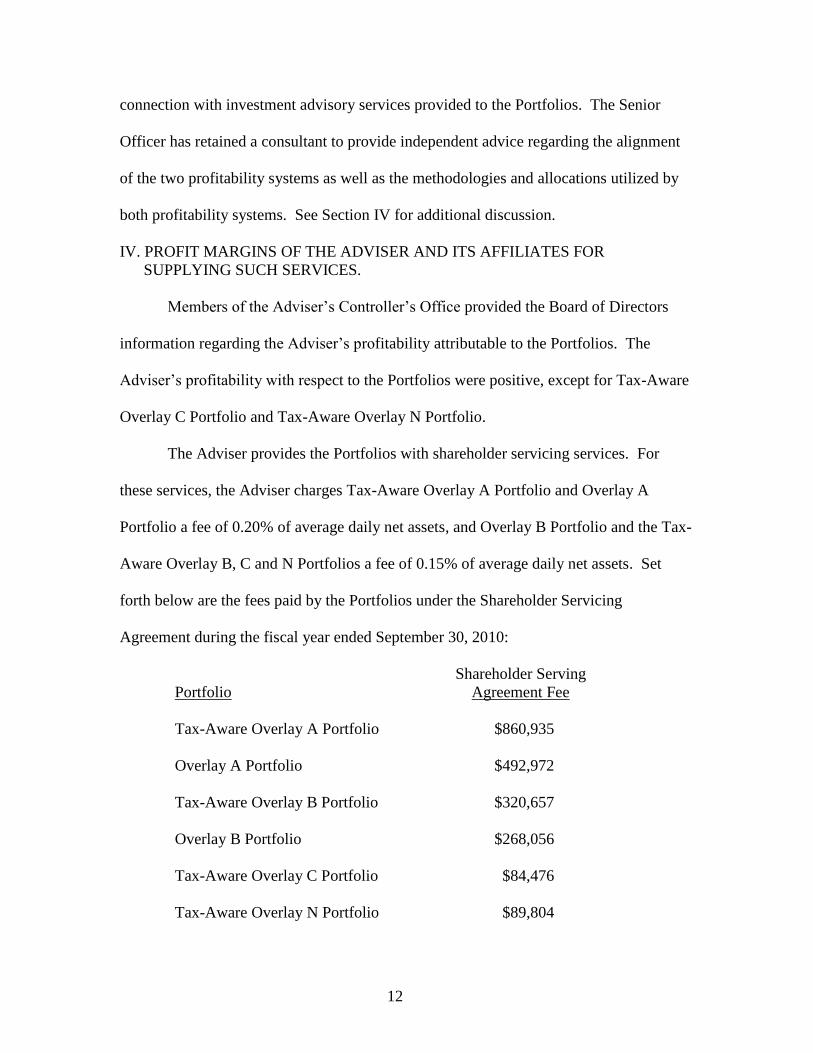
IV. PROFIT MARGINS OF THE ADVISER AND ITS AFFILIATES FOR
SUPPLYING SUCH SERVICES.
Members of the Adviser’s Controller’s Office provided the Board of Directors
information regarding the Adviser’s profitability attributable to the Portfolios. The
Adviser’s profitability with respect to the Portfolios were positive, except for Tax-Aware
Overlay C Portfolio and Tax-Aware Overlay N Portfolio.
The Adviser provides the Portfolios with shareholder servicing services. For
these services, the Adviser charges Tax-Aware Overlay A Portfolio and Overlay A
Portfolio a fee of 0.20% of average daily net assets, and Overlay B Portfolio and the Tax-
Aware Overlay B, C and N Portfolios a fee of 0.15% of average daily net assets. Set
forth below are the fees paid by the Portfolios under the Shareholder Servicing
Agreement during the fiscal year ended September 30, 2010:
Portfolio
Shareholder Serving
Agreement Fee
Tax-Aware Overlay A Portfolio $860,935
Overlay A Portfolio $492,972
Tax-Aware Overlay B Portfolio $320,657
Overlay B Portfolio $268,056
Tax-Aware Overlay C Portfolio $84,476
Tax-Aware Overlay N Portfolio $89,804

13
In addition to the Adviser’s direct profits from managing and providing certain
shareholder services to the Portfolios, certain of the Adviser’s affiliates have business
relationships with the Portfolios and may earn a profit from providing other services to
the Portfolios. The courts have referred to this type of business opportunity as “fall-out
benefits” to the Adviser and indicated that such benefits should be factored into the
evaluation of the total relationship between the Portfolios and the Adviser. Neither case
law nor common business practice precludes the Adviser’s affiliates from earning a
reasonable profit on this type of relationship provided the affiliates’ charges and services
are competitive.
Tax-Overlay A Portfolio and Overlay A Portfolio effected brokerage transactions
through the Adviser’s affiliate, Sanford C. Bernstein & Co., LLC (“SCB & Co.”) and/or
its U.K. affiliate, Sanford C. Bernstein Limited (“SCB Ltd.”), collectively “SCB,” and
paid commissions for such transactions during the Portfolios’ most recently completed
fiscal year. The Adviser represented that SCB’s profitability from business conducted
with the Portfolios is comparable to the profitability of SCB’s dealings with other similar
third party clients. In the ordinary course of business, SCB receives and pays liquidity
rebates from electronic communications networks (“ECNs”) derived from trading for its
clients, including the Portfolios. These credits and charges are not being passed onto to
any SCB client. The Adviser also receives certain soft dollar benefits from brokers that
execute agency trades for its clients. These soft dollar benefits reduce the Adviser’s
research expense and increase its profitability.

14
V. POSSIBLE ECONOMIES OF SCALE
The Adviser has indicated that economies of scale are being shared with
shareholders through fee structures,14
subsidies and enhancement to services. Based on
some of the professional literature that has considered economies of scale in the mutual
fund industry, it is thought that to the extent economies of scale exist, they may more
often exist across a fund family as opposed to a specific fund. This is because the costs
incurred by the Adviser, such as investment research or technology for trading or
compliance systems, can be spread across a greater asset base as the fund family
increases in size. It is also possible that as the level of services required to operate a
successful investment company has increased over time, and advisory firms make such
investments in their business to provide services, there may be a sharing of economies of
scale without a reduction in advisory fees.
At the September 2007 Board of Directors meeting, an independent consultant
retained by the Senior Officer, provided the Board of Directors an update of the Deli15
study on advisory fees and various fund characteristics.16
The independent consultant
first reiterated the results of his previous two dimensional comparison analysis (fund size
and family size) with the Board of Directors.17
The independent consultant then
discussed the results of the regression model that was utilized to study the effects of
14
Fee structures include fee reductions, pricing at scale and breakpoints in advisory fee schedules. 15
The Deli study, originally published in 2002 based on 1997 data and updated for the September 2007
presentation, may be of diminished value due to the age of the data used in the presentation and the changes
experienced in the industry over the last four years. 16
As mentioned previously, the Supreme Court cautioned against accepting mutual fund fee comparisons
without careful scrutiny since the fees may not be the product of negotiations conducted at arm’s length.
See Jones V. Harris at 1429. 17
The two dimensional analysis showed patterns of lower advisory fees for funds with larger asset sizes
and funds from larger family sizes compared to funds with smaller asset sizes and funds from smaller
family sizes, which according to the independent consultant is indicative of a sharing of economies of scale
and scope. However, in less liquid and active markets, such is not the case, as the empirical analysis
showed potential for diseconomies of scale in those markets. The empirical analysis also showed
diminishing economies of scale and scope as funds surpassed a certain high level of assets.

15
various factors on advisory fees. The regression model output indicated that the bulk of
the variation in fees predicted were explained by various factors, but substantially by
fund AUM, family AUM, index fund indicator and investment style. The independent
consultant also compared the advisory fees of the AllianceBernstein Mutual Funds to
similar funds managed by 19 other large asset managers, regardless of the fund size and
each Adviser’s proportion of mutual fund assets to non-mutual fund assets.
VI. NATURE AND QUALITY OF THE ADVISER’S SERVICES
INCLUDING THE PERFORMANCE OF THE PORTFOLIO.
With assets under management of approximately $433 billion as of August 31,
2011, the Adviser has the investment experience to manage the Portfolios and provide
non-investment services (described in Section I) to the Portfolios.
The information prepared by Lipper in the table below shows the 1 year and since
inception gross performance returns of the Portfolios18
relative to the medians of the
Portfolios’ Lipper Performance Groups (“PG”) and Lipper Performance Universes
(“PU”) 19
for the periods ended June 30, 2011.20
Also shown are the gross performance
rankings of the Portfolios. It should be noted that the Overlay Portfolios are not
designed to be used as stand-alone investments, unlike its peers, and are used only in
conjunction with globally diversified Private Client portfolios. Accordingly, the Lipper
performance comparisons for the Overlay Portfolios are shown only for information
purposes and do not indicate how successful the Overlay Portfolios are in meeting their
investment objectives.
18
The gross performance returns are for the Class 1 shares for the Overlay Portfolios. 19
The Portfolios’ PGs are identical to the Portfolios’ EGs. The Portfolios’ PUs are not identical to the
Portfolios’ EUs as the criteria for including/excluding a fund in/from a PU are somewhat different from
that of an EU. 20
Note that the current Lipper investment classification/objective dictates the PG and PU throughout the
life of the fund even if a fund had a different investment classification/objective at a different point in time.

16
Portfolio
Return (%)
PG
Median (%)
PU
Median (%)
PG
Rank
PU
Rank
Tax-Aware Overlay A
Portfolio
1 year 20.56 20.56 21.40 7/13 88/162
Since Inception 13.96 12.82 13.96 5/12 66/131
Overlay A Portfolio
1 year 17.57 19.95 21.40 9/15 120/162
Since Inception 13.24 12.43 13.68 5/14 68/131
Tax-Aware Overlay B
Portfolio
1 year 11.31 19.95 21.40 11/13 141/162
Since Inception 8.77 12.31 13.68 8/12 109/131
Overlay B Portfolio
1 year 9.82 19.95 21.40 11/13 144/162
Since Inception 9.10 12.31 13.68 8/12 108/131
Tax-Aware Overlay C
Portfolio
1 year 11.20 25.63 21.40 9/11 141/162
Since Inception 8.85 12.17 13.68 6/10 108/131
Tax-Aware Overlay N
Portfolio
1 year 9.77 23.08 25.63 9/11 142/162
Since Inception 7.79 10.56 12.12 6/10 109/131
Set forth below are the 1 year and since inception performance returns of the
Portfolios (in bold)21
versus their benchmarks.22
As previously indicated, the Overlay
Portfolios are not designed to be used as stand-alone investments and are used only in
conjunction with globally diversified Private Client portfolios. Accordingly, the
21
The performance returns shown in the table for the Class 1 shares for the Overlay Portfolios were
provided by the Adviser. 22
The Adviser provided Portfolio and benchmark performance return information for the periods through
June 30, 2011.

17
benchmark performance comparisons for the Overlay Portfolios are shown only for
information purposes and are not meant to indicate how successful the Overlay Portfolios
are in meeting their investment objectives.23
Periods Ending June 30, 2011
Annualized Net Performance (%)
1
Year
(%)
Since Inception
(%)
Tax-Aware Overlay A Portfolio 19.13 14.00
S&P 500 Stock Index 30.69 19.68
Inception Date: February 8, 2010
Overlay A Portfolio 16.17 13.39
S&P 500 Stock Index 30.69 19.68
Inception Date: February 8, 2010
Tax-Aware Overlay B Portfolio 10.32 8.48
Barclays Capital 5 Year GO Municipal Bond Index 4.17 3.98
Inception Date: February 8, 2010
Overlay B Portfolio 8.83 8.72
Barclays Capital Global Aggregate Bond Index 1.48 3.56
Inception Date: February 8, 2010
Tax-Aware Overlay C Portfolio 10.21 8.56
Barclays Capital 5 Year GO Municipal Bond Index 4.17 3.98
Inception Date: February 8, 2010
Tax-Aware Overlay N Portfolio 9.77 8.48
Barclays Capital 5 Year GO Municipal Bond Index 4.17 3.98
Inception Date: February 8, 2010
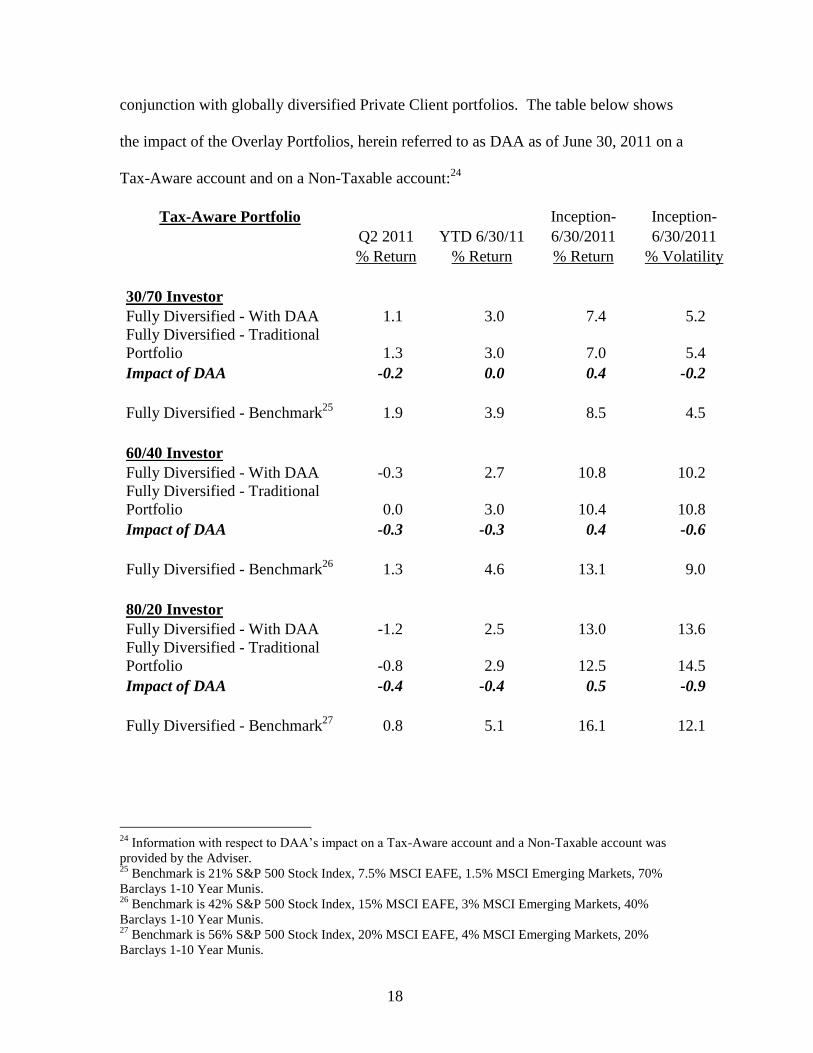
As indicated previously, the Overlay Portfolios were not designed as stand-alone
portfolios, in contrast to the Portfolios’ Lipper peers. The Overlay Portfolios are used in
23
Providing a comparison of each individual Overlay Portfolio’s performance against a broad-based
securities market index is consistent with the SEC requirement that each registered investment company
specify such a benchmark.
18
conjunction with globally diversified Private Client portfolios. The table below shows
the impact of the Overlay Portfolios, herein referred to as DAA as of June 30, 2011 on a
Tax-Aware account and on a Non-Taxable account:24
Tax-Aware Portfolio
Inception- Inception-
Q2 2011 YTD 6/30/11 6/30/2011 6/30/2011
% Return % Return % Return % Volatility
30/70 Investor
Fully Diversified - With DAA 1.1 3.0 7.4 5.2
Fully Diversified - Traditional
Portfolio 1.3 3.0 7.0 5.4
Impact of DAA -0.2 0.0 0.4 -0.2
Fully Diversified - Benchmark25
1.9 3.9 8.5 4.5
60/40 Investor
Fully Diversified - With DAA -0.3 2.7 10.8 10.2
Fully Diversified - Traditional
Portfolio 0.0 3.0 10.4 10.8
Impact of DAA -0.3 -0.3 0.4 -0.6
Fully Diversified - Benchmark26
1.3 4.6 13.1 9.0
80/20 Investor
Fully Diversified - With DAA -1.2 2.5 13.0 13.6
Fully Diversified - Traditional
Portfolio -0.8 2.9 12.5 14.5
Impact of DAA -0.4 -0.4 0.5 -0.9
Fully Diversified - Benchmark27
0.8 5.1 16.1 12.1
24
Information with respect to DAA’s impact on a Tax-Aware account and a Non-Taxable account was
provided by the Adviser. 25
Benchmark is 21% S&P 500 Stock Index, 7.5% MSCI EAFE, 1.5% MSCI Emerging Markets, 70%
Barclays 1-10 Year Munis. 26
Benchmark is 42% S&P 500 Stock Index, 15% MSCI EAFE, 3% MSCI Emerging Markets, 40%
Barclays 1-10 Year Munis. 27
Benchmark is 56% S&P 500 Stock Index, 20% MSCI EAFE, 4% MSCI Emerging Markets, 20%
Barclays 1-10 Year Munis.

19
Non-Taxable Portfolio
Inception- Inception-
Q2 2011 YTD 6/30/11 6/30/2011 6/30/2011
% Return % Return % Return % Volatility
30/70 Investor
Fully Diversified - With DAA 1.0 2.9 9.8 4.9
Fully Diversified - Traditional
Portfolio 1.0 3.1 10.2 5.4
Impact of DAA 0.0 -0.2 -0.4 -0.5
Fully Diversified - Benchmark28
1.8 3.6 10.1 4.5
60/40 Investor
Fully Diversified - With DAA 0.1 3.0 12.8 10.0
Fully Diversified - Traditional
Portfolio 0.1 3.3 13.2 11.3
Impact of DAA 0.0 -0.3 -0.4 -1.3
Fully Diversified - Benchmark29
1.3 4.6 15.0 9.3
80/20 Investor
Fully Diversified - With DAA -0.5 3.0 14.7 13.6
Fully Diversified - Traditional
Portfolio -0.5 3.4 15.1 15.5
Impact of DAA 0.0 -0.4 -0.4 -1.9
Fully Diversified - Benchmark30
1.0 5.2 18.2 12.8
CONCLUSION:
Based on the factors discussed above the Senior Officer’s conclusion is that the
investment advisory fees for the Overlay Portfolios are reasonable and within the range
of what would have been negotiated at arm’s-length in light of all the surrounding
28
Benchmark is 20% S&P 500 Stock Index, 7.1% MSCI EAFE, 1.4% MSCI Emerging Markets, 3.0%
FTSE/EPRA NAREIT, 68.5% Barclays US Aggregate. 29
Benchmark is 39.1% S&P 500 Stock Index, 13.9% MSCI EAFE, 2.8% MSCI Emerging Markets, 8.4%
FTSE/EPRA NAREIT, 35.8% Barclays US Aggregate. 30
Benchmark is 51.8% S&P 500 Stock Index, 18.5% MSCI EAFE, 3.7% MSCI Emerging Markets, 12%
FTSE/EPRA NAREIT, 14% Barclays US Aggregate.

20
circumstances. This conclusion with respect to each Portfolio is based on an evaluation
of all of these factors and no single factor was dispositive.
Dated: November 16, 2011