Thirty Years of Research on Race Differences in Cognitive ... · THIRTY YEARS OF RESEARCH ON RACE...
60
THIRTY YEARS OF RESEARCH ON RACE DIFFERENCES IN COGNITIVE ABILITY J. Philippe Rushton The University of Western Ontario Arthur R. Jensen University of California, Berkeley The culture-only (0% genetic–100% environmental) and the hereditarian (50% genetic–50% environmental) models of the causes of mean Black–White differences in cognitive ability are compared and contrasted across 10 categories of evidence: the worldwide distribution of test scores, g factor of mental ability, heritability, brain size and cognitive ability, transracial adoption, racial admixture, regression, related life-history traits, human origins research, and hypothesized environmental vari- ables. The new evidence reviewed here points to some genetic component in Black–White differences in mean IQ. The implication for public policy is that the discrimination model (i.e., Black–White differences in socially valued outcomes will be equal barring discrimination) must be tempered by a distributional model (i.e., Black–White outcomes reflect underlying group characteristics). Section 1: Background Throughout the history of psychology, no question has been so persistent or so resistant to resolution as that of the relative roles of nature and nurture in causing individual and group differences in cognitive ability (Degler, 1991; Loehlin, Lindzey, & Spuhler, 1975). The scientific debate goes back to the mid-19th century (e.g., Galton, 1869; Nott & Glidden, 1854). Starting with the widespread use of standardized mental tests in World War I, average ethnic and racial group differences were found. Especially vexing has been the cause(s) of the 15-point Black–White IQ difference in the United States. In 1969, the Harvard Educational Review published Arthur Jensen’s lengthy article, “How Much Can We Boost IQ and School Achievement?” Jensen con- cluded that (a) IQ tests measure socially relevant general ability; (b) individual differences in IQ have a high heritability, at least for the White populations of the United States and Europe; (c) compensatory educational programs have proved generally ineffective in raising the IQs or school achievement of individuals or groups; (d) because social mobility is linked to ability, social class differences in IQ probably have an appreciable genetic component; and tentatively, but most controversially, (e) the mean Black–White group difference in IQ probably has some genetic component. Jensen’s (1969) article was covered in Time, Newsweek, Life, U.S. News & World Report, and New York Times Magazine. His conclusions, the theoretical issues they raised, and the public policy recommendations that many saw as stemming directly from them were dubbed “Jensenism,” a term which entered the J. Philippe Rushton, Department of Psychology, The University of Western Ontario, London, Ontario, Canada; Arthur R. Jensen, School of Education, University of California, Berkeley. Correspondence concerning this article should be addressed to J. Philippe Rushton, Department of Psychology, The University of Western Ontario, London, Ontario N6A 5C2, Canada. E-mail: [email protected] Psychology, Public Policy, and Law 2005, Vol. 11, No. 2, 235–294 Copyright 2005 by the American Psychological Association 1076-8971/05/$12.00 DOI: 10.1037/1076-8971.11.2.235 235
Transcript of Thirty Years of Research on Race Differences in Cognitive ... · THIRTY YEARS OF RESEARCH ON RACE...

THIRTY YEARS OF RESEARCH ON RACEDIFFERENCES IN COGNITIVE ABILITY
J. Philippe RushtonThe University of Western Ontario
Arthur R. JensenUniversity of California, Berkeley
The culture-only (0% genetic–100% environmental) and the hereditarian (50%genetic–50% environmental) models of the causes of mean Black–White differencesin cognitive ability are compared and contrasted across 10 categories of evidence:the worldwide distribution of test scores, g factor of mental ability, heritability, brainsize and cognitive ability, transracial adoption, racial admixture, regression, relatedlife-history traits, human origins research, and hypothesized environmental vari-ables. The new evidence reviewed here points to some genetic component inBlack–White differences in mean IQ. The implication for public policy is that thediscrimination model (i.e., Black–White differences in socially valued outcomeswill be equal barring discrimination) must be tempered by a distributional model(i.e., Black–White outcomes reflect underlying group characteristics).
Section 1: Background
Throughout the history of psychology, no question has been so persistent orso resistant to resolution as that of the relative roles of nature and nurture incausing individual and group differences in cognitive ability (Degler, 1991;Loehlin, Lindzey, & Spuhler, 1975). The scientific debate goes back to themid-19th century (e.g., Galton, 1869; Nott & Glidden, 1854). Starting with thewidespread use of standardized mental tests in World War I, average ethnic andracial group differences were found. Especially vexing has been the cause(s) ofthe 15-point Black–White IQ difference in the United States.
In 1969, the Harvard Educational Review published Arthur Jensen’s lengthyarticle, “How Much Can We Boost IQ and School Achievement?” Jensen con-cluded that (a) IQ tests measure socially relevant general ability; (b) individualdifferences in IQ have a high heritability, at least for the White populations of theUnited States and Europe; (c) compensatory educational programs have provedgenerally ineffective in raising the IQs or school achievement of individuals orgroups; (d) because social mobility is linked to ability, social class differences inIQ probably have an appreciable genetic component; and tentatively, but mostcontroversially, (e) the mean Black–White group difference in IQ probably hassome genetic component.
Jensen’s (1969) article was covered in Time, Newsweek, Life, U.S. News &World Report, and New York Times Magazine. His conclusions, the theoreticalissues they raised, and the public policy recommendations that many saw asstemming directly from them were dubbed “Jensenism,” a term which entered the
J. Philippe Rushton, Department of Psychology, The University of Western Ontario, London,Ontario, Canada; Arthur R. Jensen, School of Education, University of California, Berkeley.
Correspondence concerning this article should be addressed to J. Philippe Rushton, Departmentof Psychology, The University of Western Ontario, London, Ontario N6A 5C2, Canada. E-mail:[email protected]
Psychology, Public Policy, and Law2005, Vol. 11, No. 2, 235–294
Copyright 2005 by the American Psychological Association1076-8971/05/$12.00 DOI: 10.1037/1076-8971.11.2.235
235
dictionary. Since 1969, Jensen has continued to publish prolifically on all of theseissues, and increasing numbers of psychometricians and behavioral geneticistshave come to agree with one or more of the tenets of Jensenism (Snyderman &Rothman, 1987, 1988).
The Bell Curve (Herrnstein & Murray, 1994) presented general readers anupdate of the evidence for the hereditarian position along with several policyrecommendations and an original analysis of 11,878 youths (including 3,022Blacks) from the 12-year National Longitudinal Survey of Youth. It found thatmost 17-year-olds with high scores on the Armed Forces Qualification Test,regardless of ethnic background, went on to occupational success by their late 20sand early 30s, whereas those with low scores were more inclined to welfaredependency. The study also found that the average IQ for African Americans waslower than those for Latino, White, Asian, and Jewish Americans (85, 89, 103,106, and 113, respectively; Herrnstein & Murray, 1994, pp. 273–278).
Currently, the 1.1 standard deviation difference in average IQ between Blacksand Whites in the United States is not in itself a matter of empirical dispute. Ameta-analytic review by Roth, Bevier, Bobko, Switzer, and Tyler (2001) showedit also holds for college and university application tests such as the ScholasticAptitude Test (SAT; N � 2.4 million) and the Graduate Record Examination(GRE; N � 2.3 million), as well as for tests for job applicants in corporate settings(N � 0.5 million) and in the military (N � 0.4 million). Because test scores arethe best predictor of economic success in Western society (Schmidt & Hunter,1998), these group differences have important societal outcomes (R. A. Gordon,1997; Gottfredson, 1997).
The question that still remains is whether the cause of group differences inaverage IQ is purely social, economic, and cultural or whether genetic factors arealso involved. Following publication of The Bell Curve, the American Psycho-logical Association (APA) established an 11-person Task Force (Neisser et al.,1996) to evaluate the book’s conclusions. Based on their review of twin and otherkinship studies, the Task Force for the most part agreed with Jensen’s (1969)Harvard Educational Review article and The Bell Curve, that within the Whitepopulation the heritability of IQ is “around .75” (p. 85). As to the cause of themean Black–White group difference, however, the Task Force concluded: “Thereis certainly no support for a genetic interpretation” (p. 97).
Among the factors contributing to the longstanding lack of resolution of thisimportant and controversial issue are the difficulty of the subject matter, thepolitical issues associated with it and the emotions they arouse, and the differentmeta-theoretical perspectives of the experimental and correlational methodolo-gies. Cronbach (1957) referred to these conflicting approaches as the two “halves”of psychology because researchers are predisposed to draw different conclusionsdepending on whether they adopt a “manipulations-lead-to-change” or a “corre-lations-find-stability” paradigm.
Here we review in detail the research that has accumulated since Jensen’s(1969) article and compare our findings with earlier reviews and evaluations suchas those by Loehlin et al. (1975), P. E. Vernon (1979), Herrnstein and Murray(1994), the APA Task Force (Neisser et al., 1996), and Nisbett (1998). Facts inthemselves typically do not answer scientific questions. For a question so complexas the cause of the average Black–White group difference in IQ, no one fact, one
236 RUSHTON AND JENSEN

study, nor indeed any single line of evidence, can hope to be determinative.Rather, resolving the issue requires examining several independent lines ofevidence to determine if, when taken together, they confirm or refute rivalhypotheses and research programs.
The philosophy of science methodology used here is guided by the view that,just as in individual studies the principal of aggregation holds that a set ofmeasurements provides a more reliable indicator than any single measure takenfrom the set (Rushton, Brainerd, & Pressley, 1983), so in reviewing multiple linesof evidence, making strong inferences from a number of contending hypothesesis more efficacious than considering only one hypothesis at a time (Platt, 1964).Although strong inference is the method of science, it has, more often than not,been eschewed in this controversial debate.
The final section of this article addresses the question of what these conclu-sions imply for policy, specifically for the issues of educational and psychologicaltesting, health, race relations, and conflicting worldviews about the essence ofhuman nature. It suggests that the distributional model that takes genetic factorsinto account must temper the discrimination model that explains Black–Whitedifferences in socially valued outcomes.
Section 2: The Two Conflicting Research Programs
Here, we review the research on Black–White difference in average IQpublished since Jensen’s (1969) now 36-year-old article. We then apply thephilosophy of science methodologies of Platt (1964), Lakatos (1970, 1978), andUrbach (1974a, 1974b) to determine if the preponderance of this new evidencestrengthens or weakens Jensen’s (1969) tentative assertion that it is more likelythan not that some part of the cause of the mean Black–White difference isgenetic. The data reviewed have been collated from articles in specialist journalsand a number of scholarly monographs on the nature of intelligence, behavioralgenetics, and social policy issues, as well as recent book-length reviews (Devlin,Feinberg, Resnick, & Roeder, 1997; Herrnstein & Murray, 1994; Jencks &Phillips, 1998; Jensen, 1998b; Lynn & Vanhanen, 2002; Rushton, 2000; Stern-berg, 2000). While we focus on the mean Black–White difference in IQ becauseit is the topic on which most of the research to date has been conducted, studiesof other traits (e.g., reaction times) and other groups (e.g., East Asians) areincluded when those data are sufficient and informative.
Some have argued that the cause of Black–White differences in IQ is a pseudoquestion because “race” and “IQ” are arbitrary social constructions (Tate &Audette, 2001). However, we believe these constructs are meaningful because theempirical findings documented in this article have been confirmed across culturesand methodologies for decades. The fuzziness of racial definitions does not negatetheir utility. To define terms, based on genetic analysis, roughly speaking, Blacks(Africans, Negroids) are those who have most of their ancestors from sub-SaharanAfrica; Whites (Europeans, Caucasoids) have most of their ancestors from Eu-rope; and East Asians (Orientals, Mongoloids) have most of their ancestors fromPacific Rim countries (Cavalli-Sforza, 2000; Cavalli-Sforza, Menozzi, & Piazza,1994; Nei & Roychoudhury, 1993; Risch, Burchard, Ziv, & Tang, 2002). Al-though he eschewed the term race, Cavalli-Sforza’s (2000, p. 70) maximum
237RACE DIFFERENCES IN COGNITIVE ABILITY
likelihood tree made on the basis of molecular genetic markers substantiallysupports the traditional racial groups classification. Of course, in referring topopulation or racial group differences we are discussing averages. Individuals areindividuals, and the three groups overlap substantially on almost all traits andmeasures.
The hereditarian position originated in the work of Charles Darwin (1859,1871) and then was elaborated by his cousin Sir Francis Galton (1869, 1883).Based on research models used in behavioral genetics, this view contends that asubstantial part (say 50%) of both individual and group differences in humanbehavioral traits is genetic. It therefore follows that even if all individuals in bothgroups were treated identically, average group differences would not disappear,though they might diminish.
The opposing culture-only position finds no need to posit any genetic causa-tion, stating that if the environments for all individuals could be equalized, theobserved group differences in average IQ would effectively disappear, though thismight be difficult to achieve. This position has been predominant in the socialsciences since the 1930s.
It is essential to keep in mind precisely what the two rival positions do and donot say—about a 50% genetic–50% environmental etiology for the hereditarianview versus an effectively 0% genetic–100% environmental etiology for theculture-only theory. The defining difference is whether any significant part of themean Black–White IQ difference is genetic rather than purely cultural or envi-ronmental in origin. Hereditarians use the methods of quantitative genetics, andthey can and do seek to identify the environmental components of observed groupdifferences. Culture-only theorists are skeptical that genetic factors play anyindependently effective role in explaining group differences.
Most of those who have taken a strong position in the scientific debate aboutrace and IQ have done so as either hereditarians or culture-only theorists.Intermediate positions (e.g., gene–environment interaction) can be operationallyassigned to one or the other of the two positions depending on whether theypredict any significant heritable component to the average group difference in IQ.For example, if gene–environment interactions make it impossible to disentanglecausality and apportion variance, for pragmatic purposes that view is indistin-guishable from the 100% culture-only program because it denies any potency tothe genetic component proposed by hereditarians.
It is also important to define and interpret heritability correctly. Heritabilityrefers to the genetic contribution to the individual differences (variance) in aparticular group, not to the phenotype of a single individual. Heritability is not aconstant that holds for all groups or in all environments. A heritability of 1.00means all the observed differences in that group are due to genetic differences andnot at all to their differences in the environment. A heritability of zero (0.00)means the converse. A heritability of 0.50 means the observed variation is equallythe result of genetic and of environmental differences. The heritability of heightin modern industrial populations, for example, is about 90%, which means thatmost of the differences in height among the individuals are due to their geneticdifferences.
Behavioral Genetics by Plomin, DeFries, McClearn, and McGuffin (2001)provides a detailed explanation of heritability (see also Jensen, 1973; Miele, 2002,
238 RUSHTON AND JENSEN

for general readers). Heritability estimates are true only for particular populationsat particular times. They can vary in different populations or at different times.Equalizing environments, for example, produces the counterintuitive result ofincreasing heritability because any individual differences that remain must be dueto genetic differences.
The cause of individual differences within groups has no necessary implica-tion for the cause of the average difference between groups. A high heritabilitywithin one group does not mean that the average difference between it and anothergroup is due to genetic differences, even if the heritability is high in both groups.However, within-groups evidence does imply the plausibility of the between-groups differences being due to the same factors, genetic or environmental. Ifvariations in level of education or nutrition or genes reliably predict individualvariation within Black and within White groups, then it would be reasonable toconsider these variables to explain the differences between Blacks and Whites. Ofcourse, independent evidence would then be needed to establish any relationship.
Heritability describes what is the genetic contribution to individual differ-ences in a particular population at a particular time, not what could be. If eitherthe genetic or the environmental influences change (e.g., due to migration, greatereducational opportunity, better nutrition), then the relative impact of genes andenvironment will change. Heritability has nothing to say about what should be. Ifa trait has a high heritability it does not mean that it cannot be changed.Environmental change is possible. For example, phenylketunuria (PKU) is asingle-gene disorder that causes mental retardation but that can be prevented bybeginning a diet low in phenylaline early in life. (Note that the only effectivetreatment for PKU is aimed directly at the specific chemical factor that causes it.)The fact that the heritability of IQ is between 0.50 and 0.80 does not mean thatindividual differences are fixed and permanent. It does tell us that some individ-uals are genetically predisposed to be more teachable, more trainable, and morecapable of changing than others, under current conditions (Jensen, 1973; Miele,2002).
Having defined the terms of the debate, we now discuss approaches forresolving it. Lakatos’s (1970, 1978) analytical methodology classifies researchprograms as being either progressive or degenerating. A progressive program notonly explains existing phenomena and theoretical anomalies but also offers novelpredictions, some of which can be tested and then either confirmed or rejected. Adegenerating program merely accommodates existing anomalies by a series ofnew, unrelated, ad hoc hypotheses, ignores them, or denies their existence.
The philosopher Peter Urbach (1974a, 1974b) applied this methodology andconcluded that the hereditarian/culture-only IQ debate is really a conflict ofresearch programs that goes back to their classic proponents—Francis Galton(1869) for the hereditarians and J. B. Watson (1924) for the environmentalists.Each has an underlying set of assumptions, termed its hard core, and a heuristicmachinery that generates hypotheses. The hard core of the hereditarian programis that (a) all individuals possess some level of general mental capacity calledgeneral intelligence that, to some degree, influences all cognitive activity, and (b)the differences between individuals and between groups in general intelligenceare largely the result of genetic differences. The hard core of the culture-onlyprogram is that (a) there are a number of different learned mental skills or
239RACE DIFFERENCES IN COGNITIVE ABILITY

intelligences, and (b) any observed differences in cognitive performance are theresult of environmental factors.
Hereditarian heuristics include constructing better tests, developing bettertechniques for measuring mental abilities, and discovering biological correlates(e.g., heritability, inbreeding depression and heterosis, brain size, brain metabolicrate, brain evoked potentials, brain imaging) of these tests. The process theninvolves examining the similarities of the scores among people whose varyingdegrees of genetic resemblance can be predicted from Mendelian theory (Fisher,1918). Culture-only heuristics include searching for the environmental factors thatcause differences in intellectual performance and discovering the bias in existingtests. If two groups differ in mean IQ, culture-only theorists conjecture either thatthe lower scoring group has been exposed to one or more deleterious experienceor been deprived of some beneficial environmental stimuli or that the tests are notvalid measures of their true ability. Compensatory training might be initiated andthe hypothesis confirmed if the groups then obtain more nearly equal scores, or ifless biased tests are developed on which the group differences are reduced but stillpredict outside criteria. Of course, these two programs overlap to some degree,and a given experiment might well combine elements of the heuristics of each.
Reviewed here are new data sets for 10 categories of evidence that havebecome available since Jensen’s (1969) article. They include the internationalpattern of IQ test scores, more and less g-loaded components of tests, heritability,brain-size and cognitive-ability relations, transracial adoption, racial admixture,regression to the mean, the race–behavior matrix, human origins research, andhypothesized environmental variables. These findings are then used to evaluatethe culture-only and hereditarian models in terms of the methodology proposed byLakatos (1970, 1978).
Section 3: Mean Race–IQ Differences: A Global Perspective
The IQ debate became worldwide in scope when it was shown that EastAsians scored higher on IQ tests than did Whites, both within the United Statesand in Asia, even though IQ tests were developed for use in the Euro Americanculture (Lynn, 1977, 1978, 1982; P. E. Vernon, 1979, 1982). Around the world,the average IQ for East Asians centers around 106; that for Whites, about 100; andthat for Blacks, about 85 in the United States and 70 in sub-Saharan Africa. Mostof the early research was conducted in the United States, but some was alsoperformed in Canada and the Caribbean (Eysenck, 1971, 1984; Jensen, 1969,1973; Osborne & McGurk, 1982; Shuey, 1958, 1966; cf. Flynn, 1980; Kamin,1974; Lewontin, Rose, & Kamin, 1984). In the United States, 15% to 20% of theBlack IQ distribution exceeds the White median IQ, so many Blacks obtain scoresabove the White average. This same order of mean group differences is also foundon “culture-fair” tests and on reaction time tasks. Hundreds of studies on millionsof people have confirmed the three-way racial pattern (Jensen, 1998b; Lynn &Vanhanen, 2002; Rushton, 2000).
Racial-group differences in IQ appear early. For example, the Black and theWhite 3-year-old children in the standardization sample of the Stanford–Binet IVshow a 1 standard deviation mean difference after being matched on gender, birthorder, and maternal education (Peoples, Fagan, & Drotar, 1995). Similarly, the
240 RUSHTON AND JENSEN

Black and the White 21⁄2- to 6-year-old children in the U.S. standardization sampleof the Differential Aptitude Scale have a 1 standard deviation mean difference. Nodata are available for East Asian children at the youngest ages. On the DifferentialAptitude Battery, by age 6, however, the average IQ of East Asian children is 107,compared with 103 for White children and 89 for Black children (Lynn, 1996).The size of the average Black–White difference does not change significantly overthe developmental period from 3 years of age and beyond (see Jensen, 1974,1998b).
Serious questions have been raised about the validity of using tests for racialcomparisons. However, because the tests show similar patterns of internal itemconsistency and predictive validity for all groups, and because the same differ-ences are found on relatively culture-free tests, many psychometricians haveconcluded that the tests are valid measures of racial differences, at least amongpeople sharing the culture of the authors of the test (Jensen, 1980; Wigdor &Garner, 1982). This conclusion was endorsed by the APA Task Force’s statement:“Considered as predictors of future performance, the tests do not seem to bebiased against African Americans” (Neisser et al., 1996, p. 93).
Most disputed is the validity of the low mean IQ scores reported for sub-Saharan Africans. Lynn’s (1991) review of 11 studies found a mean IQ of 70. Asubsequent review of over two dozen studies by Lynn and Vanhanen (2002) foundan average IQ of 70 for West, Central, East, and Southern Africa. For example,in Nigeria, Fahrmeier (1975) collected data on 375 children ages 6 to 13 years ina study of the effects of schooling on cognitive development. The children’s meanscore on the Colored Progressive Matrices was 12 out of 36, which is at the 4thpercentile for 91⁄2-year-olds on U.S. norms, or an IQ equivalent of about 75(Raven et al., 1990, pp. 97–98). In Ghana, Glewwe and Jacoby (1992) reported aWorld Bank study that tested a representative sample of 1,736 individuals rangingin age from 11 to 20 years old from the entire country. All had completed primaryschool; half were attending middle school. Their mean score on the ColoredProgressive Matrices was 19 out of 36, which is below the 1st percentile for151⁄2-year-olds on U.S. norms, an IQ equivalent of less than 70. In Kenya,Sternberg et al. (2001) administered the Colored Progressive Matrices to 85children ages 12 to 15 years old who scored 23.5 out of 36, which is about the 2ndpercentile for 131⁄2-year-olds, an IQ equivalent of 70. In Zimbabwe, Zindi (1994)reported mean IQs for 204 African 12- to 14-year-olds of 67 on the WechslerIntelligence Scale for Children—Revised (WISC–R) and of 72 on the StandardProgressive Matrices. In South Africa, Owen (1992) found that 1,093 African 12-to 14-year-old high school students solved 28 out of 60 problems on the StandardProgressive Matrices, which is around the 10th percentile, or an IQ equivalent ofabout 80 (Raven, Raven, & Court, 1998, p. 77). Again in South Africa, Skuy,Schutte, Fridjhon, and O’Carroll (2001) found mean scores 1 to 2 standarddeviations below U.S. norms on a wide variety of individually administered testsgiven to 154 African high school students under optimized conditions.
Black university students in South Africa also show relatively low mean testscores. Sixty-three undergraduates at the all-Black universities of Fort Hare,Zululand, the North, and the Medical University of South Africa had a full-scaleIQ of 77 on the Wechsler Adult Intelligence Scale—Revised (Avenant, 1988,cited in Nell, 2000, pp. 26–28). In a study at the University of Venda in South
241RACE DIFFERENCES IN COGNITIVE ABILITY

Africa’s Northern Province by Grieve and Viljoen (2000), 30 students in 4th-yearlaw and commerce averaged a score of 37 out of 60 on the Standard ProgressiveMatrices, equivalent to an IQ of 78 on U.S. norms. A study at South Africa’sUniversity of the North by Zaaiman, van der Flier, and Thijs (2001) found thehighest scoring African sample to that date—147 first-year mathematics andscience students who scored 52 out of 60 on the Standard Progressive Matrices,which is equivalent to an IQ of 100. This higher score may reflect the fact thatthey were mathematics and science students, specially selected for admission tothe university from a pool of 700 applicants on the basis of a math-scienceselection test.
At the University of the Witwatersrand in Johannesburg, South Africa,Rushton, Skuy, and colleagues gave the Raven’s Progressive Matrices in fourseparate studies under optimal testing conditions. Rushton and Skuy (2000) found173 African 1st-year psychology students averaged an IQ equivalent of 84. Skuyet al. (2002) tested another 70 psychology students who averaged an IQ equivalentof 83. After receiving training on how to solve Matrices-type items, their meanscore rose to an IQ equivalent of 96. Rushton, Skuy, and Fridjhon (2002, 2003)gave nearly 200 African 1st-year engineering students both the Standard and theAdvanced version of the Raven’s test and found they averaged an IQ of 97 on theStandard and 103 on the Advanced, making them the highest scoring Africansample on record. (The White university students in these four studies had IQsfrom 105 to 117; East Indian students had intermediate IQs, from 102 to 106.)
Many critics claim that Western-developed IQ tests are not valid for groupsas culturally different as sub-Saharan Africans (e.g., Nell, 2000). The mainevidence to support a claim of external bias would be if the test failed to predictperformance for Africans. Even if tests only underpredicted performance forAfricans compared with non-Africans, it would suggest that their test scoresunderestimated their “true” IQ scores. However, a review by Kendall, Verster,and von Mollendorf (1988) showed that test scores for Africans have about equalpredictive validity as those for non-Africans (e.g., 0.20 to 0.50 for students’school grades and for employees’ job performance). The review also showed thatmany of the factors that influence scores in Africans are the same as those forWhites (e.g., coming from an urban vs. a rural environment; being a science ratherthan an arts student; having had practice on the tests; and the well-documentedcurvilinear relationship with age). Similarly, Sternberg et al.’s (2001) study ofKenyan 12- to 15-year-olds found that IQ scores predicted school grades, with amean r � .40 (p � .001; after controlling for age and socioeconomic status [SES],r � .28, p � .01). In Rushton et al.’s (2003) study of African and non-Africanengineering students at the University of the Witwatersrand, scores on theAdvanced Progressive Matrices correlated with scores on the Standard Progres-sive Matrices measured 3 months earlier (.60 for Africans; .70 for non-Africans)and with end-of-year exam marks measured 3 months later (.34 for Africans; .28for non-Africans). Figure 1 shows the regression of exam marks on test scores forthese university students.
Although predictive validity is the ultimate pragmatic criterion for absence ofbias, critics also suggest that the items have different meanings for Africans thanthey do for Whites or East Indians (Nell, 2000). This hypothesis of internal biashas been tested. The psychometric studies by Owen (1992) on thousands of high
242 RUSHTON AND JENSEN

school students, and by Rushton and Skuy (2000; Rushton et al., 2002, 2003) onhundreds of university students, found almost identical item structures in Afri-cans, Whites, and East Indians on the Progressive Matrices. Items found difficultby one group were difficult for the others; items found easy by one group wereeasy for the others (mean rs � .90, p � .001). The item–total score correlationsfor Africans, Whites, and East Indians were also similar, indicating that the itemsmeasured similar psychometric constructs in all three groups. (Section 4 reviewsevidence of the similarity of the g factor in Africans and non-Africans.) The onlyreliable example of bias so far discovered in this extensive literature is the ratherobvious internal bias on the Vocabulary components of tests such as the Wechslerfor groups that do not have English as their first language (e.g., Skuy et al., 2001).Even here, the language factor only accounts for about 0.5 of a standard deviation,out of the overall 2.0 standard deviation difference, between Africans and Whites.
Could it make a difference that Africans have less experience in solvingproblems such as those on the Raven’s, are less testwise, and have less access tocoaching than non-Africans? Raven (2000) showed that students who were
Figure 1. Regression of Raven’s scores on university grades for Africans andnon-Africans. From “Performance on Raven’s Advanced Progressive Matrices byAfrican, East Indian, and White Engineering Students,” by J. P. Rushton, M. Skuy,and P. Fridjhon, 2003, Intelligence, 31, p. 133. Copyright 2003 by Elsevier Science.Reprinted with permission.
243RACE DIFFERENCES IN COGNITIVE ABILITY

encouraged to engage in complex cognitive tasks increased in self-direction,understanding, and competence. In South Africa, Skuy and Shmukler (1987)applied Feuerstein’s (1980) Mediated Learning Experience and raised the Ravenscores of Black high school students. Skuy, Hoffenberg, Visser, and Fridjhon(1990) found generalized improvements for Africans with what they termed afacilitative temperament. In an intervention study with 1st-year psychology stu-dents at the University of the Witwatersrand, Skuy et al. (2002) increased Raven’stest scores in both Africans and non-Africans after intervention training. Bothexperimental groups improved over the baseline compared with their respectivecontrol groups, with significantly greater improvement for the African group (IQscore gains of 83 to 97 in Africans; 103 to 107 in non-Africans). The questionremains, however, whether such intervention procedures only increase perfor-mance through mastery of subject-specific knowledge or whether they increaseg-like problem-solving ability that generalizes to other tests as well (te Nijenhuis,Voskuijl, & Schijve, 2001).
Some argue that African students are less interested, more anxious, work lessefficiently, or give up sooner on items they find difficult, perhaps because theproblems have less meaning for them (e.g., Nell, 2000). Four findings argueagainst these hypotheses. First, Rushton and Skuy (2000) closely observed thetest-taking behavior of Africans and noted that they worked very diligently,typically staying longer than Whites to recheck their answers. Second and third,there are the similar predictive validities and internal consistencies previouslydiscussed. Finally, there is supporting evidence from reaction-time research.
Reaction time is one of the simplest culture-free cognitive measures. Mostreaction time tasks are so easy that 9- to 12-year-old children can perform themin less than 1 s. But even on these very simple tests, children with higher IQ scoresperform faster than do children with lower scores, perhaps because reaction timemeasures the neurophysiological efficiency of the brain’s capacity to processinformation accurately—the same ability measured by intelligence tests (Deary,2000; Jensen, 1998b). Children are not trained to perform well on reaction timetasks (as they are on certain paper-and-pencil tests), so the advantage of those withhigher IQ scores on these tasks cannot arise from practice, familiarity, education,or training.
For three reaction time tasks (the simple, choice, and odd-man-out tasks),individuals with higher IQ scores average faster and less variable reaction times.For any one task, the correlation between reaction time and IQ normally liesbetween .20 and .40. A review of several studies concluded that the six measurescombined (i.e., the average time and the variability for the three reaction timetasks) produce a multiple correlation of .67 (Deary, 2000). This is about the samemagnitude as the correlation between two conventional intelligence tests of, say,reasoning ability and vocabulary.
Lynn and his colleagues carried out a series of reaction time studies on over1,000 nine-year-old East Asian children in Japan and Hong Kong, White childrenin Britain and Ireland, and Black children in South Africa (summarized by Lynn& Vanhannen, 2002, pp. 66–67). The Progressive Matrices were given as anonverbal test of intelligence, along with the simple, choice, and odd-man-outtasks. Reaction times and variabilities were measured by computer and hencewere not subject to any human error in recording. For details, see Shigehisa and
244 RUSHTON AND JENSEN

Lynn (1991) for Japan; Chan and Lynn (1989) for Hong Kong and Britain; Lynn(1991) for Ireland; and Lynn and Holmshaw (1990) for South Africa.
The correlations between IQ and reaction times for the five countries aresummarized in Table 1. The East Asian children in Hong Kong and Japanobtained the highest IQs, followed in descending order by the White children inBritain and Ireland, and then the Black children in South Africa. The medians forsimple reaction time, choice reaction time, and odd-man-out reaction time followthe same descending order as the IQs. Because all the tasks take less than 1 s, allchildren found them easy. The variabilities in the three reaction time measures forthe three groups follow the same general descending trend.
The same pattern of average scores on these and other reaction time tasks (i.e.,East Asians faster than Whites faster than Blacks) is found within the UnitedStates. Jensen (1993) and Jensen and Whang (1994) examined the time taken byover 400 schoolchildren ages 9 to 12 years old in California to retrieve over-learned addition, subtraction, or multiplication of single digit numbers (from 1 to9) from long-term memory. All of the children had perfect scores on paper-and-pencil tests of this knowledge, which was then reassessed using the MathVerification Test. The response times significantly correlated (negatively) withRaven Matrices scores, whereas movement times have a near-zero correlation.The average reaction times for the three racial groups differ significantly (seeFigure 2). They cannot be explained by the groups’ differences in motivationbecause the East Asian children averaged a shorter response time but a longermovement time than did the Black children.
Section 4: The g Factor and Mean Race–IQ Differences
Jensen (1998b) showed that a test’s g loading (g being the general factor ofintelligence) is the best predictor, not just of that test’s correlation with scholasticand workplace performance, but of heritability coefficients determined from twin
Table 1Sample Size, Mean IQ Score, and Reaction Time Measures (in Milliseconds)From Five Countries, and the Reaction Time Correlations with IQ
VariableHongKong Japan Britain Ireland
SouthAfrica SD ra
Sample size 118 110 239 317 350 — —IQ scores 113 110 100 89 67 — —Simple reaction time 361 348 371 388 398 64 .94*Choice reaction time 423 433 480 485 489 67 .89*Odd-man-out reaction time 787 818 898 902 924 187 .96*Variability of simple reaction time 99 103 90 121 139 32 .83*Variability of choice reaction time 114 138 110 141 155 30 .73*Variability of odd-man-out reaction
time 269 298 282 328 332 95 .85*
Note. Data in this table are reconfigured from IQ and the Wealth of Nations (p. 67, Table6.2), by R. Lynn and T. Vanhanen, 2002, Westport, CT: Praeger. Copyright 2002 by R.Lynn and T. Vanahanen. Adapted with permission.a r � reliability.* p � .05.
245RACE DIFFERENCES IN COGNITIVE ABILITY

studies, inbreeding depression scores calculated in children of cousin-marriages,brain evoked potentials, brain pH levels, brain glucose metabolism, as well asnerve conduction velocity, reaction time, and other physiological factors. Thesecorrelations argue strongly for the heritable and biological, as opposed to the merestatistical reality of g. Because the mean Black–White group difference in IQ ismore pronounced on high-g-loaded tests than it is on low-g-loaded tests, it suggeststhat it is not the result of any idiosyncratic cultural peculiarities of this or that test.
Spearman (1927, p. 379) first proposed the hypothesis that the mean Black–White group difference in IQ would be “most marked in just those [tests] whichare known to be saturated with g.” Jensen (1980, p. 535) designated it as“Spearman’s hypothesis” and developed the method of correlated vectors to testit. This method correlates the standardized Black–White mean differences on a setof cognitive tests with their respective g loadings, a significant positive correlationsupporting the hypothesis. The rationale is straightforward. If g is the main sourceof between- and within-group differences, then there should be a positive rela-tionship between a given test’s g loading and the mean Black–White groupdifference on that test: The more g-loaded the test, the greater the Black–Whitegroup difference on that test. A corollary is the prediction that when race (scoredas Blacks � 1, Whites � 2) is factor analyzed along with scores from a numberof diverse cognitive tests, its highest loading on the resulting correlation matrixwill be with the g factor.
Jensen (1998b, pp. 369–379) summarized 17 independent data sets of nearly45,000 Blacks and 245,000 Whites derived from 149 psychometric tests andfound that the g loadings consistently predicted the magnitude of the mean
Figure 2. Mean response times of 10-year-old Black, White, and East Asianchildren on the Math Verification Test for Multiplication, Subtraction, and Addition.Redrawn by A. R. Jensen from data in Jensen (1993; Jensen & Whang, 1994).Copyright 2002 by A. R. Jensen. Reprinted with permission.
246 RUSHTON AND JENSEN

Black–White group difference (r � .62, p � .05). This was borne out even among3-year-olds administered eight subtests of the Stanford–Binet in which the rankcorrelation between g loadings and the mean Black–White group differences was.71 (p � .05; Peoples et al., 1995). Subsequently, Nyborg and Jensen (2000)analyzed a unique battery of 19 highly diverse cognitive tests from an archivaldata set of 4,462 males who had served in the U.S. Armed Forces. The g factorwas extracted using different methods. Spearman’s hypothesis was confirmed,with an average correlation of .81 between the race difference on a test and its gloading. Nyborg and Jensen concluded that Spearman’s original conjecture aboutthe mean Black–White difference on the g factor “should no longer be regardedas just an hypothesis but as an empirically established fact” (p. 599). Only onestudy to date has examined East Asian–White difference on psychometric tests asa function of their g loadings; it confirmed the hypothesis for 15 cognitive testsadministered to two generations of Americans of Japanese, Chinese, and Euro-pean ancestry. In this case, the more g-loaded the test, the greater the mean EastAsian–White group difference favoring East Asians (Nagoshi, Johnson, DeFries,Wilson, & Vandenberg, 1984).
Studies in Southern Africa have also found the mean Black–White IQdifference is mainly on g. Lynn and Owen (1994) were the first to test explicitlySpearman’s hypothesis in sub-Saharan Africa, administering the Junior AptitudeTest to 1,056 White, 1,063 Indian, and 1,093 Black 16-year-old high schoolstudents in South Africa. They found a 2 standard deviation difference betweenthe Africans and Whites (yielding an average African IQ of about 70) and a 1standard deviation difference between the Whites and Indians (yielding an aver-age Indian IQ of 85). They then tested Spearman’s hypothesis and found theAfrican–White differences correlated .62 (p � .05) with the g factor extractedfrom the African sample, but only .23 with g extracted from the White sample.They did not find any White–Indian differences on g.
Jensen (1998b, p. 388) noted some problems with Lynn and Owen’s (1994)South African study, but their results on Black–White differences have been wellcorroborated since then and extended to include East Indians and “Coloreds” (theterm used to refer to the mixed-race population of South Africa). Thus, Rushton(2001) reanalyzed data on 10 subtests of the WISC–R published on 154 highschool students in South Africa by Skuy et al. (2001) and found African–Whitedifferences were mainly on g. Rushton and Jensen (2003) compared data on theWISC–R from 204 African 12- to 14-year-olds from Zimbabwe published byZindi (1994) with the U.S. normative sample for Whites and found 77% of thebetween-groups race variance was attributable to a single source, namely g.
Spearman’s hypothesis has been confirmed in South Africa using test itemanalyses as well. Rushton and Skuy (2000) studied 309 university students at theUniversity of the Witwatersrand and found that the more an individual item fromthe Raven’s Standard Progressive Matrices measured g (estimated by its item–total correlation), the more it correlated with the standardized African–Whitedifference on that item. Rushton (2002) analyzed the item data from 4,000 highschool students in South Africa on Raven’s Standard Progressive Matrices pub-lished by Owen (1992) and found the four-way African–Colored–East Indian–White differences were all on g. In two studies of engineering students, Rushtonet al. (2002, 2003) found that the more the items from both the Standard and the
247RACE DIFFERENCES IN COGNITIVE ABILITY

Advanced Progressive Matrices loaded on g, the better they predicted the mag-nitude of African–East Indian–White differences. The g loadings showed cross-cultural generality; those calculated on the East Indian students predicted themagnitude of the African–White differences.
Spearman’s hypothesis was also confirmed when the g factor was extractedfrom 12 reaction time variables given to the 820 nine- to twelve-year-olds. Whileall of the children could do the tasks in less than 1 s, the correlations between theg loadings and the mean Black–White differences on the reaction time tasks rangefrom .70 to .81 (Jensen, 1993). These results bear out Spearman’s hypothesis evenmore strongly than do those from conventional psychometric tests. The hypothesisthat the mean Black–White group difference on these tests reflects a difference inmotivation is again disconfirmed by the fact that although Whites averaged fasterreaction times than Blacks, Blacks averaged faster movement times than Whites.And again, East Asians typically averaged higher than Whites on the g factorextracted from their (faster) reaction time measures (Jensen & Whang, 1994).
Spearman’s hypothesis, as demonstrated by the method of correlated vectors,cannot be a chimera or a methodological artifact, as a few critics have claimed(e.g., Gould, 1996, p. 350; Schonemann, 1992). In the method of correlatedvectors, the means and standard deviations of the variables cannot have anymathematical relationship with the factor structure of the correlation matrixbecause the means and the variances of all the tests in the factor-analyzedcorrelation matrix are totally removed by the Pearson correlations, which convertall variables to z scores. Therefore, any systematic relationship between factorloadings and standardized group means (or group mean differences) must be anempirical fact, not an artifact (Jensen, 1992).
Other claims of artifact are contradicted by Dolan’s (1997) technical com-mentaries on the method of correlated vectors (Dolan, 1997, 2000). Dolan arguedthat the method of correlated vectors is not incorrect but that it lacks specificity;that is, it does not incorporate tests of alternative models of the factor structure ofgroup differences or incorporate statistical tests to compare them for goodness-of-fit. In its place, he advocated use of the multigroup confirmatory factor modelfor testing Spearman’s hypothesis. Statistical tests of significance are a built-infeature of this procedure. Dolan and Hamaker (2001) have applied it to two largepublished data sets (Jensen & Reynolds, 1982; Naglieri & Jensen, 1987). Theresults statistically confirmed the conclusion derived from the method of corre-lated vectors regarding a “weak form” of Spearman’s hypothesis: Black–Whitegroup differences were predominantly on the g factor, although the groups alsoshowed differences on some lower order factors (e.g., short-term memory andspatial ability) independent of g.
Section 5: Gene–Environment Architecture and Mean Black–WhiteIQ Differences
Dozens of twin, adoption, and family studies have confirmed the high heri-tability of intellectual and behavioral traits, and even reaction time tasks, withina race (Bouchard, 1996; Bouchard & Loehlin, 2001; Deary, 2000; Plomin et al.,2001). Most of these estimates have been calculated on White samples. One studyof 543 pairs of identical and 134 pairs of nonidentical 12-year-old Japanese twins
248 RUSHTON AND JENSEN

in Japan reported a substantial heritability of 0.58 for IQ (Lynn & Hattori, 1990).The hereditarian model views race differences simply as aggregated individualdifferences of this sort.
The culture-only model, however, predicts that special factors such as pov-erty, the history of slavery, and White racism have operated on the Blackpopulation and suppressed natural levels of intelligence and so made heritabilitiesin Blacks substantially lower than they are in Whites. In arguing against Galton’s(1869) hereditarian position, Charles H. Cooley (1897), a founder and firstpresident of the American Sociological Association, was the first to introduce thepowerful analogy that corn seeds given a normal environment grow plants of fullheight whereas seeds given a deprived environment grow plants of stunted height.According to this view, cultural deprivation, not heredity, is the cause of anyBlack–White IQ differences.
It is an empirical question whether heritabilities are the same for Blacks as forWhites. Loehlin et al. (1975, pp. 114–116) reviewed the literature to that date andfound that while there was some evidence suggesting a lower heritability ofintelligence for Blacks than for Whites (e.g., Scarr-Salapatek, 1971), a larger bodyof evidence suggested equal heritabilities in the two groups. Subsequently, Os-borne’s (1980) Georgia Twin Study compared 123 Black and 304 White pairs of12- to 18-year-old twins drawn from schools in Georgia, Kentucky, and Indiana,given the Basic Test Battery, along with smaller subsets of twins given thePrimary Mental Abilities test and the Cattell Culture Fair Intelligence test.Osborne found heritabilities of about 50% for both Blacks and Whites, allsignificantly different from zero but not from each other. (The heritabilities of theBasic, Primary, and Cattell tests were, respectively, for Whites, 0.61, 0.37, and0.71, and for Blacks, 0.75, 0.42, and 0.19; Osborne, 1980, pp. 68–69, 89, 98.)
Another way of answering the question is to compare their psychometricfactor structures of kinship patterns, background variables, and subtest correla-tions. If there are minority-specific developmental processes arising from culturalbackground differences between the races at work, they should be reflected in thecorrelations between the background variables and the outcome measures. Rowe(1994; Rowe, Vazsonyi, & Flannery, 1994, 1995) examined this hypothesis in aseries of studies using structural equation models. One study of six data sourcescompared cross-sectional correlational matrices (about 10 � 10) for a total of8,528 Whites, 3,392 Blacks, 1,766 Hispanics, and 906 Asians (Rowe et al., 1994).These matrices contained both independent variables (e.g., home environment,peer characteristics) and developmental outcomes (e.g., achievement, delin-quency). A LISREL goodness-of-fit test found each ethnic group’s covariancematrix equal to the matrix of the other groups. Not only were the Black and Whitematrices nearly identical, but they were as alike as the covariance matricescomputed from random halves within either group. There were no distortions inthe correlations between the background variables and the outcome measures thatsuggested any minority-specific developmental factor.
Another study examined longitudinal data on academic achievement (Rowe etal., 1995). Again, any minority-specific cultural processes affecting achievementshould have produced different covariance structures among ethnic and racialgroups. Correlations were computed between academic achievement and familyenvironment measures in 565 full-sibling pairs from the National Longitudinal
249RACE DIFFERENCES IN COGNITIVE ABILITY

Survey of Youth, each tested at ages 6.6 and 9.0 years (White N � 296 pairs;Black N � 149 pairs; Hispanic N � 120 pairs). Each racial group was treatedseparately, yielding three 8 � 8 correlation matrices, which included age as avariable. Because LISREL analysis showed the matrices were equal across thethree groups, there was no evidence of any special minority-specific developmen-tal process affecting either base rates in academic achievement or any changestherein over time.
A nearly identical statistical structure on intellectual variables across ethnicand racial groups has been reported in large-scale studies of military samples. Reeand Carretta (1995) examined a nationally representative sample of young Black,White, and Hispanic men and women who took the Armed Services VocationalAptitude Battery (ASVAB; N � 9,173). The ASVAB, which is used to selectapplicants for all military enlistments and assign them to first jobs, consists of 10separately scored subtests (General Science, Arithmetic Reasoning, Word Knowl-edge, Paragraph Comprehension, Numerical Operations, Coding Speed, Auto andShop Information, Mathematics Knowledge, Mechanical Comprehension, andElectronics Information). Despite the especially wide variety of subtests, Ree andCarretta found the hierarchical factor structure of ASVAB subtest scores wasvirtually identical across the three groups. Similarly, Carretta and Ree (1995)examined the more specialized and diverse Air Force Officer Qualifying Test, amultiple-aptitude battery that had been given to 269,968 applicants (212,238Whites, 32,798 Blacks, 12,647 Hispanics, 9,460 Asian Americans, and 2,551Native Americans). The g factor accounted for the greatest amount of variance inall groups, and its loadings differed little by ethnicity. Thus, the factor structureof cognitive ability is nearly identical for Blacks and for Whites, as was found inthe studies by Owen (1992) and Rushton and Skuy (2000; Rushton et al., 2002,2003) comparing Africans, East Indians, and Whites on the item structures of testsdescribed in Section 3. There was no “Factor X” specific to race.
Within-race heritabilities have also been calculated using structural equationmodeling. Rowe and Cleveland (1996) estimated the genetic architecture forBlack and White full- and half-siblings from the National Longitudinal Survey ofYouth (106 pairs of Black half-sibs, 53 pairs of White half-sibs; 161 pairs ofBlack full-sibs, 314 pairs of White full-sibs). Three Peabody Individual Achieve-ment Tests were used (Mathematics, Reading Comprehension, and ReadingRecognition). The best-fitting model was one in which the sources of the differ-ences between individuals within race and of the differences between racial meanswas the same—about 50% genetic and 50% environmental. Similarly, Jensen(1998b, p. 465) used structural equation modeling to reanalyze a subset of theGeorgia Twin Study (comprising 123 Black and 304 White pairs of 12- to18-year-old twins). He broke down the phenotypic mean differences into theirgenetic and environmental contributions and tested four alternative models: onlygenetic factors, only environmental factors, neither genes nor environment, andgenes plus environment. The model of both genetic and environmental factorsbest explained the observed Black–White group differences in IQ, whereas boththe genetic-only and the environmental-only explanations were inadequate.
Heritability data are especially informative when the hereditarian and theculture-only models make opposite predictions. For example, the hereditarianmodel predicts race differences will be greater on those subtests that are more
250 RUSHTON AND JENSEN
heritable within races, whereas culture-only theory predicts they will be greater onsubtests that are more culturally malleable (i.e., those with lower heritabilities) onwhich races should grow apart as a result of dissimilar experiences. Analyses ofseveral independent data sets support the genetic hypothesis.
Nichols (1972, cited in Jensen, 1973, pp. 116–117) was the first to applydifferential heritabilities in the study of racial-group differences. He estimated theheritability of 13 tests from 543 pairs of 7-year-old siblings, including an equalnumber of Blacks and Whites, and found a .67 correlation between the heritabilityof a test and the magnitude of the Black–White group difference on that test.Subsequently, Jensen (1973, pp. 103–119) calculated the environmentality of atest (defined as the degree to which sibling correlations departed from the puregenetic expectation of 0.50) in Black and in White children and found it wasinversely related to the magnitude of the Black–White group difference (r �–.70); that is, the more environmentally influenced a test, the less pronounced itsBlack–White group difference.
Prompted by Jensen’s approach, Rushton (1989) estimated genetic influencefrom the amount of inbreeding depression found on the 11 tests of the WISC.Inbreeding depression occurs in offspring who receive the same harmful recessivegenes from each of their closely related parents. Rushton found a positivecorrelation between inbreeding depression scores calculated from 1,854 cousin-marriages in Japan and the magnitude of the mean Black–White group differencein the United States on the same 11 Wechsler tests (.48). This contradictsculture-only theory, which predicts that mean differences between Blacks andWhites should be greater on those subtests most affected by the environment (i.e.,those showing the lowest amount of inbreeding depression). We know of nonongenetic explanation for the relation between inbreeding depression scoresfrom Japan and mean Black–White group differences in the United States.
Other aspects of the gene–environment architectural matrix also pertain to thequestion of mean Black–White group differences. First, it is possible to distin-guish between two different types of environmental effects. Shared (also calledcommon or between-family) environmental effects are due to variables all childrenreared in the same family (whether genetically related or adopted) have incommon but that differ between families (e.g., father’s occupation, family culturalpractice, parents’ child-rearing style). Nonshared (also called unique or within-family) effects are specific to each child in the same family and therefore differwithin families (e.g., an accident, illness, or chance friendship that happens to onesibling and not to the other). Twin and adoption studies can be used to measurethe two types of environmental effect (Plomin, DeFries, & Loehlin, 1977; see alsoPlomin & Daniels, 1987; Plomin et al., 2001).
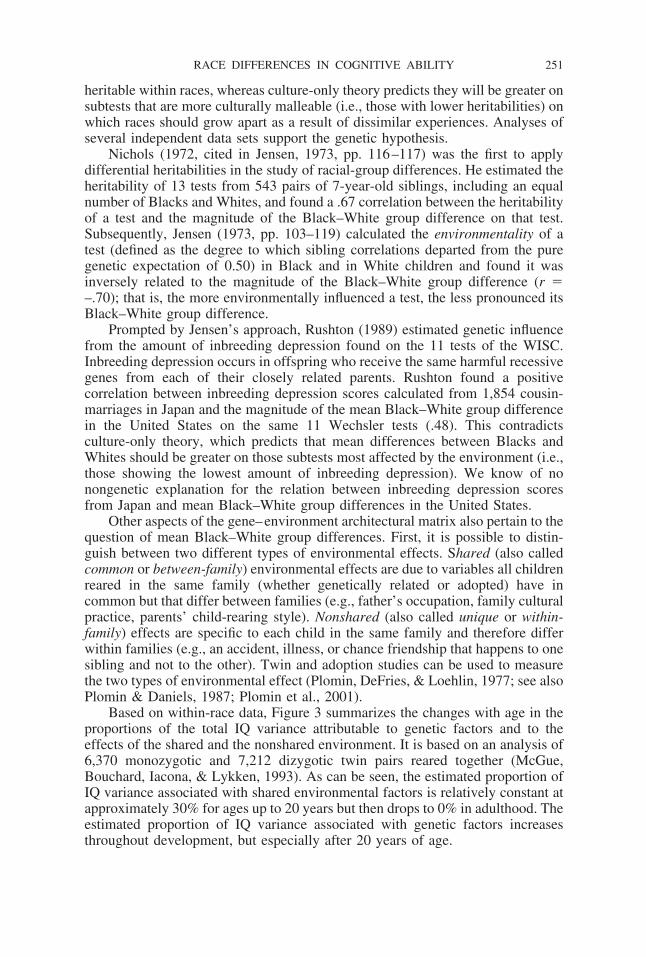
Based on within-race data, Figure 3 summarizes the changes with age in theproportions of the total IQ variance attributable to genetic factors and to theeffects of the shared and the nonshared environment. It is based on an analysis of6,370 monozygotic and 7,212 dizygotic twin pairs reared together (McGue,Bouchard, Iacona, & Lykken, 1993). As can be seen, the estimated proportion ofIQ variance associated with shared environmental factors is relatively constant atapproximately 30% for ages up to 20 years but then drops to 0% in adulthood. Theestimated proportion of IQ variance associated with genetic factors increasesthroughout development, but especially after 20 years of age.
251RACE DIFFERENCES IN COGNITIVE ABILITY

These results are corroborated by studies of monozygotic twins reared apartand of other kinships groups (Plomin et al., 2001). Because the variables usuallyproposed to explain mean racial-group differences are part of the shared familyenvironment (such as social class, religious beliefs, cultural practices, fatherabsence, and parenting styles), and these account for little variance within a race,they are unlikely to account for the differences between races. Rather, meandifferences between races are primarily due to nonshared family effects, whichinclude not only genetics but also a range of idiosyncratic environmental eventsthat, within-families, affect one sibling and not the other (Jensen, 1997).
Hereditarians have also examined the question of whether group differencesoccur in shared and in nonshared environmental effects as well as in geneticeffects. For example, Rushton and Osborne (1995) reanalyzed 125 Black and 111White pairs of 12- to 18-year-old twins from the Georgia Twin Study andestimated their cranial capacities from head size measures. They found a lowerrange of heritabilities for Blacks than for Whites (12% to 31% against 47% to56%) and a higher range of common environmental (i.e., shared family) effectsfor Blacks than for Whites (42% to 46% against 28% to 32%). However, thesepercentage differences between Blacks and Whites were not significant, althoughall heritabilities within each race were significantly above zero.
Figure 3. Estimated proportions of the total IQ variance attributable to genetic andenvironmental (shared and nonshared) effects. Note that only the nonshared (orwithin-family) environmental variance remains relatively constant across the entireage range. From “Behavioral Genetics of Cognitive Ability: A Life-Span Perspec-tive,” by M. McGue, T. J. Bouchard, Jr., W. G. Iacono, and D. T. Lykken, in R.Plomin and G. E. McClearn (Eds.), Nature, Nurture, and Psychology (p. 64), editedby R. Plomin and G. E. McClearn, 1993, Washington, DC: American PsychologicalAssociation. Copyright 1993 by the American Psychological Association. Reprintedwith permission.
252 RUSHTON AND JENSEN
Also relevant to the question of the mean Black–White group differences arethe changes in heritability that occur with increases in age (see Plomin et al.,2001). The average correlation of IQ between full siblings reared together reaches.49 in adulthood. The correlation in IQ for siblings reared apart as children is .24,which increases to .49 in adulthood. This shows that siblings grow more similarto each other as they age. In genetically unrelated people reared together, such asadopted children, the correlation for IQ is .25 in childhood but decreases to .01 inadulthood (McGue et al., 1993). This shows, conversely, that unrelated peoplereared together grow less similar over time. Between childhood and adulthood theinfluence of the shared home environment on IQ decreases, whereas the effect ofgenetic similarity increases.
The diminishing or even vanishing effect of differences due to the sharedhome environment can best be understood in terms of three components ofgene–environment correlation and the change in their relative importance duringdevelopment (Plomin et al., 1977; Plomin et al., 2001). The passive component ofthe gene–environment correlation reflects all those things that happen to thephenotype, independent of its own characteristics. For example, children ofacademically oriented parents may inherit genes for academic ability and also beexposed (through no effort of their own) to stimulating intellectual environments.The reactive component of gene–environment correlation results from the reac-tion of others to the expression of genetically based abilities, as when childrenwith an unusual curiosity about science are given chemistry sets. The activecomponent of the gene–environment correlation results from children activelyseeking experiences compatible with their genotypes, for example, going toscience fairs rather than sports events or music concerts. From early childhood tolate adolescence the predominant component of the gene–environment covariancegradually shifts from passive to reactive to active. The child’s enlarging world islike a cafeteria in which choices become increasingly biased by genetic factors(Scarr, 1996; Scarr & McCartney, 1983). As individuals mature they seek out andeven create their own experiential environment.
Section 6: Race, Brain Size, and Cognitive Ability
Studies on over 700 participants show that individuals with larger brainvolumes have higher IQ scores. About two dozen studies using magnetic reso-nance imaging (MRI) to measure the volume of the human brain have found anoverall correlation with IQ of greater than .40 (Rushton & Ankney, 1996; P. A.Vernon, Wickett, Bazana, & Stelmack, 2000). The correlation of .40 using MRIis much higher than the .20 correlation found in earlier research using simple headsize measures, although the .20 correlation is also reliable and significant. Rushtonand Ankney (1996) reviewed 32 studies correlating measures of external head sizewith IQ scores or with measures of educational and occupational achievement,and they found a mean r � .20 for people of all ages, both sexes, and variousethnic backgrounds, including African Americans.
The most likely reason why larger brains are, on average, more intelligentthan smaller brains is that they contain more neurons and synapses, which makethem more efficient. Haier et al. (1995) tested the brain efficiency hypothesis byusing MRI to measure brain volume and glucose metabolic rate to measure
253RACE DIFFERENCES IN COGNITIVE ABILITY
glucose uptake (an indicator of energy use). They found a correlation of –.58between glucose metabolic rate and IQ, suggesting that more intelligent individ-uals have more efficient brains because they use less energy in performing a givencognitive task. Several other studies supporting the brain-size/efficiency modelwere reviewed in Gignac, Vernon, and Wickett (2003). In any individual, how-ever, energy use increases with the increasing complexity of the cognitive task.
Estimates from twin studies indicate that genes contribute from 50% to 90%of the variance to both cranial capacities based on external head size measures andto brain volume measured by MRI (Bartley, Jones, & Weinberger, 1997; Pen-nington et al., 2000; Posthuma et al., 2002; Rushton & Osborne, 1995; Thompsonet al., 2001). Common genetic effects mediate from 50% to 100% of the brain-size/IQ correlation (Pennington et al., 2000; Posthuma et al., 2002). Studies havealso shown that correlations between brain size and IQ also hold true withinfamilies as well as between families (Gignac et al., 2003; Jensen, 1994; Jensen &Johnson, 1994), which also implies shared genetic effects. However, one studythat examined only sisters failed to find the within-family relation (Schoenemann,Budinger, Sarich, & Wang, 2000). Families with larger brains overall tend to havehigher IQs and, within a family, the siblings with the larger brains tend to havehigher IQ scores. The within-family finding is of special interest because itcontrols for most of the sources of variance that distinguish families, such associal class, styles of child rearing, and general nutrition, that differ betweenfamilies.
Race differences in average brain size are observable at birth. A study byRushton (1997) analyzed recorded head circumference measurements and IQscores from 50,000 children in the Collaborative Perinatal Project followed frombirth to age 7 (Broman, Nichols, Shaugnessy, & Kennedy, 1987). Using the headcircumference measures to calculate cranial capacity at birth, 4 months, 1 year,and 7 years, at each of these ages, the Asian American children averaged largercranial volumes than did the White children, who averaged larger cranial volumesthan did the Black children. Within each race, cranial capacity correlated with IQscores. By age 7, the Asian American children averaged an IQ of 110; the Whitechildren, 102; and the Black children 90. Because the Asian American childrenwere the shortest in stature and the lightest in weight while the Black childrenwere the tallest in stature and the heaviest in weight, these average race differ-ences in brain-size/IQ relations were not due to body size.
External head size measurements (length, width, height) also have been usedto estimate cranial capacities in adults. Rushton carried out five studies of largearchival data sets. The first (Rushton, 1991) examined head size measures in 24international military samples collated by the U.S. National Aeronautics andSpace Administration. After adjusting for the effects of body height, weight, andsurface area, the mean cranial capacity for East Asians was 1,460 cm3 and forEuropeans 1,446 cm3. The second (Rushton, 1992) demonstrated that even afteradjusting for the effects of body size, sex, and military rank in a stratified randomsample of over 6,000 U.S. Army personnel, the average cranial capacity of EastAsians, Whites, and Blacks were 1,416, 1,380, and 1,359 cm3, respectively. Thethird study (Rushton, 1993) reanalyzed a set of anthropometric data originallypublished by Melville Herskovits (who concluded there were not race differencesin cranial capacity) and found Whites averaged a cranial capacity of 1,421 and
254 RUSHTON AND JENSEN
Blacks, 1,295 cm3. The fourth study (Rushton, 1994) analyzed data obtained ontens of thousands of people from around the world collated by the InternationalLabor Office in Geneva, Switzerland. It found that after adjusting for the effectsof body size and sex, samples from the Pacific Rim, Europe, and Africa hadaverage cranial capacities, of 1,308, 1,297, and 1,241 cm3 respectively. Finally,Rushton and Osborne (1995) analyzed the Georgia Twin Study of adolescents andfound that after correcting for body size and sex, Whites had an average cranialcapacity of 1,269 cm3, Blacks 1,251 cm3.
Rushton’s results, based on calculating average cranial capacity from externalhead size measures, join those from dozens of other studies from the 1840s to thepresent on different samples using three different methods (endocranial volumefrom empty skulls, wet brain weight at autopsy, and high-tech MRI). All show thesame strong pattern of East Asians averaging larger and heavier brains thanWhites who average larger and heavier brains than Blacks. For example, usingMRI technology, Harvey, Persaud, Ron, Baker, and Murray (1994) found that 41Blacks in Britain averaged a smaller brain volume than did 67 British Whites.
The American anthropologist Samuel George Morton (1849) filled over 1,000skulls with packing material to measure endocranial volume and found thatBlacks averaged about 5 cubic inches less cranial capacity than Whites. Hisresults were confirmed by Todd (1923), H. L. Gordon (1934), and Simmons(1942). The most extensive study of race differences in endocranial volume todate measured 20,000 skulls from around the world and reported East Asians,Europeans, and Africans had average cranial volumes of 1,415, 1,362, and 1,268cm3, respectively (Beals, Smith, & Dodd, 1984).
Using the method of weighing brains at autopsy, Paul Broca (1873) reportedthat Whites averaged heavier brains than did Blacks, with larger frontal lobes andmore complex convolutions. (Broca also used endocranial volume and found EastAsians averaged larger cranial capacities than Europeans, who averaged largerthan Blacks.) Other early autopsy studies found a mean Black–White groupdifference in brain weight of about 100 g (Bean, 1906; Mall, 1909; Pearl, 1934;Vint, 1934). A more recent autopsy study of 1,261 American adults found that thebrains of 811 White Americans in their sample averaged 1,323 g and the brainsof 450 Black Americans averaged 1,223 g—a difference of 100 g (Ho, Roess-mann, Straumfjord, & Monroe, 1980). Because the Blacks and Whites in the studywere similar in body size, this was not responsible for the differences in brainweight.
Rushton (2000; Rushton & Ankney, 1996) summarized the world databaseusing the three methods on which there are a sufficient number of studies(autopsies, endocranial volume, and head measurements), as well as head mea-surements corrected for body size (see Rushton, 2000, pp. 126–132, Table 6.6).The results in cm3 or equivalents were as follows: East Asians � 1,351, 1,415,1,335, and 1,356 (M � 1,364); Whites � 1,356, 1,362, 1,341, and 1,329 (M �1,347); and Blacks � 1,223, 1,268, 1,284, and 1,294 (M � 1,267). The overallmean for East Asians is 17 cm3 more than that for Whites and 97 cm3 more thanthat for Blacks. Within-race differences due to differences in method of estimationaveraged 31 cm3. Because 1 cubic inch of brain matter contains millions of braincells and hundreds of millions of synapses or neural connections, these groupdifferences in average brain size may explain group differences in average IQ.
255RACE DIFFERENCES IN COGNITIVE ABILITY

Jensen and Johnson (1994) showed that for both Blacks and Whites, the headsize by IQ correlation is true within families as well as between families,indicating the intrinsic or functional relationship mentioned earlier. Further,within each sex, Blacks and Whites fit the same regression line of head size on IQ.When Blacks and Whites are perfectly matched for true-score IQ (i.e., IQcorrected for measurement error) at either the Black mean or the White mean, theoverall average Black–White group difference in head circumference is virtuallynil. (Matching Blacks and Whites for IQ eliminates the average difference in headsize, but matching the groups on head size does not equalize their IQs. This iswhat one would expect if brain size is only one of a number of brain factorsinvolved in IQ.)
In another analysis of the Georgia Twin Study, Jensen (1994) showed that themean Black–White group difference in head/brain size is also related to themagnitude of the mean Black–White group difference in g. The correlationcoefficient of each test with the head measurements was correlated with themagnitude of the Black–White group difference on that test, thus forming twovectors. The column vector of IQ test and head size correlations indicated acorrelation of .51 (p � .05) with the vector of standardized Black–White groupdifferences on each of the tests.
Section 7: Mean Race–IQ Differences and Transracial Adoption Studies
“Transracial adoption is the human analog of the cross-fostering design,commonly used in animal behavior genetics research. . . .There is no question thatadoption constitutes a massive intervention” (Scarr & Weinberg, 1976, p. 726).Studies of Korean and Vietnamese children adopted into White homes show thatalthough as babies many had been hospitalized for malnutrition, they nonethelessgrew to have IQs 10 or more points higher than their adoptive national norms. Bycontrast, Black and mixed-race (Black–White) children adopted into White mid-dle-class families typically have lower average scores than the White siblings withwhom they had been reared or than White children adopted into similar homes.
The Minnesota Transracial Adoption Study, the largest and best-knowntransracial study, was designed specifically by Sandra Scarr and Richard Wein-berg to separate genetic factors from rearing conditions as causal influences on thecognitive performance of Black children (Scarr & Weinberg, 1976; Weinberg,Scarr, & Waldman, 1992). It is also the only transracial adoption study thatincludes a longitudinal follow-up, with testing at ages 7 and 17 years. Scarr andWeinberg compared the IQ and academic achievement scores of Black, White,and mixed-race Black/White children adopted into upper-middle-class Whitefamilies in Minnesota by adopting parents whose mean IQ was more than 1standard deviation above the population mean of 100 (see Table 2). The biologicalchildren of these parents were also tested.
The first testing of 265 children was carried out in 1975 when they were 7years old and the second in 1986 when the 196 remaining in the study were 17years old. The 7-year-old White biological (i.e., nonadopted) children had anaverage IQ of 117 (see Table 2, 2nd column), similar to that found for children ofWhite upper-middle-class parents. The adopted children with two White biolog-ical parents had a mean IQ of 112. The adopted children with one Black and one
256 RUSHTON AND JENSEN

Tab
le2
Com
pari
son
ofC
ogni
tive
Per
form
ance
Mea
sure
sat
Age
s7
and
17in
Bio
logi
cal
and
Ado
pted
(Whi
te,
Mix
ed-R
ace,
and
Bla
ck)
Chi
ldre
n,A
llR
eare
din
Mid
dle-
Cla
ssW
hite
Fam
ilie
s
Chi
ldre
n’s
back
grou
ndA
ge7
IQA
ge17
IQA
ge17
grad
epo
int
aver
age
Age
17cl
ass
rank
(per
cent
ile)
Age
17sc
hool
aptit
ude
(per
cent
ile)a
Bio
logi
cal
pare
nts
120
115
——
—N
onad
opte
d,w
ithtw
oW
hite
biol
ogic
alpa
rent
s(N
atag
e7
�14
3;N
at17
�10
4)11
710
93.
064
69A
dopt
ed,
with
two
Whi
tebi
olog
ical
pare
nts
(Nat
age
7�
25;
Nat
17�
16)
112
106
2.8
5459
Ado
pted
,w
ithon
eW
hite
and
one
Bla
ckbi
olog
ical
pare
nt(N
atag
e7
�68
;N
at17
�55
)10
999
2.2
4053
Ado
pted
,w
ithtw
oB
lack
biol
ogic
alpa
rent
s(N
atag
e7
�29
;N
at17
�21
)97
892.
136
42
Not
e.Fr
om“T
heM
inne
sota
Tra
nsra
cial
Ado
ptio
nSt
udy:
AFo
llow
-Up
ofIQ
Tes
tPe
rfor
man
ceat
Ado
lesc
ence
,”by
R.
A.
Wei
nber
g,S.
Scar
r,an
dI.
D.
Wal
dman
,19
92,
Inte
llig
ence
,16
,pp
.11
7–13
5.C
opyr
ight
1992
byA
blex
Publ
ishi
ng.
Ada
pted
with
perm
issi
on.
aB
ased
onna
tiona
lno
rms
(wei
ghte
dm
ean
offo
urpe
rcen
tiles
).
257RACE DIFFERENCES IN COGNITIVE ABILITY

White biological parent averaged 109. The adopted children with two Blackbiological parents had an average IQ of 97. (A mixed group of 21 Asian, NorthAmerican Indian, and Latin American Indian adopted children averaged an IQ of100 but were not included in the main statistical analyses.)
Scarr and Weinberg (1976) interpreted the results of the testing at age 7 assupport for the culture-only position. They drew special attention to the fact thatthe mean IQ of 105 for all “socially classified” Black children (i.e., those witheither one or two Black parents) was significantly above the U.S. White mean.The poorer performance of children with two Black biological parents wasattributed to their more difficult and later placement. Scarr and Weinberg alsopointed out that this latter group had both natural and adoptive parents withsomewhat lower educational levels and abilities (2 points lower in adoptiveparents’ IQ). They found no evidence for the expectancy effects hypothesis thatadoptive parents’ beliefs about the child’s racial background influence the child’sintellectual development. The mean score for 12 children wrongly believed bytheir adoptive parents to have two Black biological parents was virtually the sameas that of the 56 children correctly classified by their adoptive parents as havingone Black and one White biological parent.
Table 2 also presents the results for the 196 children retested at age 17(Weinberg et al., 1992). There were four independent assessments of the chil-dren’s cognitive performance at this later age: (a) an individually administered IQtest, (b) an overall grade point average, (c) a class rank based on school perfor-mance, and (d) four special aptitude tests in school subjects administered by theeducational authority, which we averaged. The results are concordant with theearlier testing. The nonadopted White children had a mean IQ of 109, a gradepoint average of 3.0, a class rank at the 64th percentile, and an aptitude score atthe 69th percentile. The adopted children with two White biological parents hada mean IQ of 106, a grade point average of 2.8, a class rank at the 54th percentile,and an aptitude score at the 59th percentile. The adopted children with one Blackand one White biological parent had a mean IQ of 99, a grade point average of 2.2,a class rank at the 40th percentile, and an aptitude score at the 53rd percentile. Theadopted children with two Black biological parents had a mean IQ of 89, a gradepoint average of 2.1, a class rank at the 36th percentile, and an aptitude score atthe 42nd percentile. (The 12 remaining mixed group of Amerindian/Asian chil-dren had an IQ of 96 with no data provided on school achievement.)
Because different tests based on different standardization groups were used inthe first testing than in the follow-up, the overall average difference of about 8 IQpoints (evident for all groups, including the nonadopted group) between the twotest periods does not bear on the hypothesis of interest. The relevant comparisonsare those between the adopted groups of different races within each age level. Themean of 89 for adopted children with two Black parents was slightly above thenational Black mean of 85 but not above the Black mean for Minnesota.
Weinberg et al. (1992) interpreted their follow-up results as further supportfor the culture-only theory. Emphasizing the beneficial effects of the rearingenvironment, they pointed out that at both age 7 and 17 all groups of adoptedchildren averaged above their expected population means. Their analyses fre-quently combined the two “socially classified Black” groups with “other” mixed-race children who had one parent of unknown, Asian, Amerindian, or other racial
258 RUSHTON AND JENSEN

background. In their age 17 breakdowns, Weinberg et al. (1992, p. 132) stated that“[b]iological mothers’ race remained the best single predictor of adopted child’sIQ when other variables were controlled,” which they then attributed to “unmea-sured social characteristics.” Their overall conclusion was that “the social envi-ronment maintains a dominant role in determining the average IQ level of Blackand interracial children and that both social and genetic variables contribute toindividual variations among them” (p. 133).
Levin (1994) and Lynn (1994) disputed Weinberg et al.’s (1992) culture-onlyinterpretation. They each proposed a straightforward, hereditarian alternative: Themean IQ and school achievement scores of Black children reflected their degreeof African ancestry. At both age 7 and 17, the adopted children with two Blackbiological parents had lower average IQs and school achievement scores than didthose with one Black and one White biological parent, and these children, in turn,averaged lower scores than did those with two White biological parents. Wald-man, Weinberg, and Scarr (1994) responded to Levin (1994) and Lynn (1994)with further regression analyses that indicated the children’s preadoptive experi-ence was confounded with racial ancestry, and so an unambiguous interpretationof the results was not possible.
Subsequently, Jensen (1998b) discussed these studies at length and reviewedthe evidence showing that age of adoption does not influence children’s IQ scoresafter age 7 (e.g., Fisch, Bilek, Deinard, & Chang, 1976). Studies of severelymalnourished, late-adopted, East Asian children (see below) provide substantialevidence that age of adoption does not adversely influence IQ in transracialadoptions. More generally, as reviewed in Section 5, dozens of adoption, twin,and family studies of Whites show that although the shared-family environmentalcomponent of true-score IQ variance can be quite large at age 7, by late adoles-cence it is the smallest component. After that age, genetic and within-family(nonshared) environmental effects account for the largest components of variance(see Figure 3).
Small sample studies of very young children reared in enriched environmentssometimes find an absence of the usual race differences in IQ. In two studies of2- to 5-year-olds raised in English residential nurseries, Tizard (1974) comparedBlack (African and West Indian), White, and mixed-parentage children and foundno significant differences among the three groups on several language compre-hension tests and on the Wechsler Preschool and Primary Scale of Intelligence(WPPSI); the single significant difference was in favor of the non-White children.Moore (1986) found that at age 7, 23 Black children adopted by middle-classWhite families had a mean IQ of 117, whereas a similar group of children adoptedby middle-class Black families had a mean IQ of 104, both significantly above thenational Black mean of 85. To be more informative, future studies need to besupplemented by follow-up testing, as in the Minnesota Study. Behavior geneticstudies consistently show that, as people age, their genes exert ever more influ-ence, whereas family socialization effects decrease (see Figure 3). Trait differ-ences not apparent early in life begin to appear at puberty and are completelyapparent by age 17.
Three studies of East Asian children adopted by White families support thehereditarian hypothesis. In the first, 25 four-year-olds from Vietnam, Korea,Cambodia, and Thailand, all adopted into White American homes prior to 3 years
259RACE DIFFERENCES IN COGNITIVE ABILITY

of age, excelled in academic ability with a mean IQ score of 120, compared withthe U.S. norm of 100 (Clark & Hanisee, 1982). Prior to placement, half of thebabies had required hospitalization for malnutrition.
In the second study, Winick, Meyer, and Harris (1975) found 141 Koreanchildren adopted as infants by American families exceeded the national averagein both IQ and achievement scores when they reached 10 years of age. Theprincipal interest of the investigators was on the possible effects of severemalnutrition on later intelligence, and many of these Korean children had beenmalnourished in infancy. When tested, those who had been severely malnourishedas infants obtained a mean IQ of 102; a moderately well-nourished group obtaineda mean IQ of 106; and an adequately nourished group obtained a mean IQ of 112.
A study by Frydman and Lynn (1989) examined 19 Korean infants adoptedby families in Belgium. At about 10 years of age, their mean IQ was 119, theverbal IQ was 111, and the performance IQ was 124. Even correcting the Belgiannorms upward to 109 to account for the increase in IQ scores over time (about 3IQ points a decade; see Section 13), the Korean children still had a statisticallysignificant 10-point advantage in mean IQ over indigenous Belgian children.Neither the social class of the adopting parents nor the number of years the childspent in the adopted family had any effect on the child’s IQ.
Section 8: Mean Race–IQ Differences and Racial Admixture
In the Minnesota Transracial Adoption Study, the IQs of the mixed-race(Black/White) adoptees averaged between those of the “nonmixed” White and the“nonmixed” Black adoptees, as expected under a genetic hypothesis (see Table 2).Results from some other types of studies are also consistent with that hypothesis.In her review, Shuey (1966) found that in 16 of 18 studies in which skin colorcould be used as a proxy for amount of admixture, Blacks with lighter skin coloraveraged higher scores than those with darker skin, although the magnitude of theassociation was quite low (r � .10). The Black American average IQ of 85 (15points higher than the sub-Saharan African average of 70; see Section 3) is alsoconsistent with the genetic hypothesis, given the approximately 20% Whiteadmixture of Black Americans (Chakraborty, Kamboh, Nwankwo, & Ferrell,1992; Parra et al., 1998). The mixed-race “Colored” population of South Africaalso has an average IQ of 85, intermediate to the respective African and Whitemeans of 70 and 100 (Owen, 1992). Early studies of brain weight data also fit withthe genetic hypothesis. Bean (1906) found, as did Pearl (1934), that the greater theamount of White admixture (judged independently from skin color), the higher themean brain weight at autopsy in Black groups. More recent data of this nature arenot available.
The average IQ scores of around 70 for Black Americans in certain areas ofthe Deep South of the United States where the degree of White admixture issignificantly below the general average (Chakraborty et al., 1992; Parra et al.,1998) are also consistent with the hereditarian interpretation of the effects ofhybridization. An average IQ of 71 was found for all of the Black children in anentire school district from a rural county in Georgia; the average White IQ in thesame county was 101 (Jensen, 1977). Similarly, Stanley and Porter (1967) foundthe scores on the SAT of all-Black college students in Georgia were too low to be
260 RUSHTON AND JENSEN

predictive of college grades, thereby raising the question of whether test scores onBlack Americans are as valid as those for White Americans. However, when Hillsand Stanley (1970) gave the School and College Ability Test (a much easier testto pass) to similar students, they found that their scores were normally distributedand did predict college grades, though the average for the Black college studentswas at about the 50th percentile on eighth-grade national norms.
Most recently, Lynn (2002) and Rowe (2002) analyzed data from large,publicly available, archival data sets, which show that groups of mixed-raceindividuals have mean scores intermediate to unmixed groups of Blacks and ofWhites. Lynn examined the 1982 National Opinion Research Center’s survey ofa representative sample of the adult population, excluding non-English speakers.The 442 Blacks in the sample were asked whether they would describe themselvesas “very dark,” “dark brown,” “medium brown,” “light brown,” or “very light.”The correlation between these self-ratings and a 10-word vocabulary test scorewas .17 (p � .01). Rowe examined the 1994 National Longitudinal Study ofAdolescent Health’s survey of a representative sample of youths, with intentionaloversampling of Black children of highly educated parents. The mean age for theentire sample (9,830 Whites, 4,017 Blacks, and 119 mixed-race individuals) was16 years. The Black adolescents averaged a lower birth weight, a lower verbal IQ,and a higher number of sexual partners than did the White adolescents. For eachcharacteristic, the mixed-race mean fell between the means of the other twogroups. Rowe found the social class explanation of the group differences “un-convincing” because, of the three variables, only verbal IQ showed a moderatecorrelation with social class and statistically adjusting for it left the main findingsunchanged. He also rejected the “discrimination based on skin tone” hypothesisbecause it was eliminated by deliberately selecting only those mixed-race ado-lescents who were judged by their interviewers to be Black, based on theirphysical appearance.
Three studies of racially mixed individuals at first appear to support theculture-only hypothesis against the genetic hypothesis. Eyferth (1961; Eyferth,Brandt, & Hawel, 1960) reported IQ data for out-of-wedlock children fathered bysoldiers stationed in Germany after World War II and then reared by WhiteGerman mothers. The mean IQs for 83 White children and for 98 racially mixedchildren were both about 97 (97.2 for the Whites, 96.5 for the racially mixed). AsLoehlin et al. (1975, pp. 126–128) noted, however, these results are ambiguousfor three reasons. First, the children were still very young when tested. One thirdof the children were between 5 and 10 years of age, and two thirds were between10 and 13 years. As discussed in Section 5 (see Figure 3), behavior genetic studiesshow that while family socialization effects on IQ are often strong before puberty,after puberty they dwindle, sometimes to zero. Second, 20% to 25% of the“Black” fathers were not African Americans but French North Africans (i.e.,largely Caucasian or “Whites” as we have defined the terms here). Third, therewas rigorous selection based on IQ score in the U.S. Army at the time, with arejection rate for Blacks on the preinduction Army General Classification Test ofabout 30%, compared with 3% for Whites (see Davenport, 1946, Tables I and III).
The second study reports a 9-point IQ advantage for the 4-year-old offspringof couples with a White mother and a Black father (mean IQ � 102, N � 101)compared with those from the offspring of a Black mother and a White father
261RACE DIFFERENCES IN COGNITIVE ABILITY

(mean IQ � 93, N � 28). Willerman, Naylor, and Myrianthopoulos (1974),assuming White mothers provide better pre- or postnatal environments for theirchildren than do Black mothers, interpreted their data as more consistent with acultural than a genetic hypothesis (see also Nisbett, 1998). However, Loehlin etal. (1975, p. 126) noted that the mixed-race pairs with White mothers averagedalmost a year more schooling than did the pairs with Black mothers. Thus theWhite mothers may have had a higher average IQ than the Black ones. Themid-parent IQs have to be the same for the results to be interpretable. Also, thetwo sets of mixed-race children averaged an IQ of 98, intermediate to the Whiteand Black children in the sample from whom the mixed-race children had beendrawn (IQs � 105 and 91, respectively; Broman, Nichols, & Kennedy, 1975,p. 43).
The third study seeming to support the culture-only hypothesis is a subsidiaryanalysis by Moore (1986; see Section 8) of a small number of 7-year-old childrenadopted by middle-class White parents. Moore found no difference in IQ betweenthose children with only one and those with two Black biological parents. Themean IQ for the group of 9 adopted children with two Black biological parentswas 109, and the mean IQ for the group of 14 children with one Black and oneWhite biological parent was 107. Given the young age of these children, afollow-up to adolescence would be informative.
Studies of blood groups provide no support for the hereditarian perspective.Both Loehlin, Vandenberg, and Osborne (1973) and Scarr, Pakstis, Katz, andBarker (1977) found that blood groups distinguishing African from Europeanancestry did not predict IQ scores in Black samples. However, these studies failedto choose genetic markers with large allele frequency differences between Afri-cans and Europeans (Jensen, 1998b, pp. 480, 524 n.64).
Molecular genetic technology was unsophisticated in the 1970s. In the future,the issue may be resolved by calculating individual admixture through the use ofDNA markers as already occurs in medicine (Risch et al., 2002). On the basis ofexisting surveys, an individual’s racial group can be determined by testing his orher DNA at 100 random sites along the genome, or at 30 specifically chosen ones.Even different ethnic groups within a race can be distinguished using some 50specifically chosen sites. A genetic hypothesis predicts that for those Blackindividuals who possess more White genes, their physical, behavioral, and othercharacteristics will approach those of Whites.
Although the studies of racial hybrids are generally consistent with the genetichypothesis, to date they are not conclusive. It may be true, for example, thatlighter skinned Cape Coloreds and African Americans have better nutrition, havegreater opportunities for learning, or are treated better by their societies. On theother hand, the Minnesota Transracial Adoption Study (Table 2) held many suchfactors constant and removed the most frequently proposed causal agents such aspoverty, malnutrition, poor schools, and dysfunctional neighborhoods. Yet, heretoo, the mixed-race children had a higher mean IQ than did the children of twoBlack parents, and the means for each group were very similar to those for theirrespective counterparts elsewhere in the United States. The discussion in thissection is particularly supportive of Loehlin’s (2000) conclusion that “Researchusing larger samples and better techniques for estimating ancestry is called for andquite feasible” (p. 188).
262 RUSHTON AND JENSEN

Section 9: Mean Race–IQ Differences and Regression to the Mean
Regression toward the mean provides still another method of testing if thegroup differences are genetic. Regression toward the mean is seen, on average,when individuals with high IQ scores mate and their children show lower scoresthan their parents. This is because the parents pass on some, but not all, of theirgenes to their offspring. The converse happens for low IQ parents; they havechildren with somewhat higher IQs. Although parents pass on a random half oftheir genes to their offspring, they cannot pass on the particular combinations ofgenes that cause their own exceptionality. This is analogous to rolling a pair ofdice and having them come up two 6�s or two 1�s. The odds are that on the nextroll, you will get some value that is not quite as high (or as low). Physical andpsychological traits involving dominant and recessive genes show some regres-sion effect. Genetic theory predicts the magnitude of the regression effect to besmaller the closer the degree of kinship between the individuals being compared(e.g., identical twin � full-sibling or parent–child � half-sibling). Culture-onlytheory makes no systematic or quantitative predictions.
For any trait, scores should move toward the average for that population. Soin the United States, genetic theory predicts that the children of Black parents ofIQ 115 will regress toward the Black IQ average of 85, whereas children of Whiteparents of IQ 115 will regress toward the White IQ average of 100. Similarly,children of Black parents of IQ 70 should move up toward the Black IQ averageof 85, whereas children of White parents of IQ 70 should move up toward theWhite IQ average of 100. This hypothesis has been tested and the predictionsconfirmed. Regression would explain why Black children born to high IQ,wealthy Black parents have test scores 2 to 4 points lower than do White childrenborn to low IQ, poor White parents (Jensen, 1998b, p. 358). High IQ Blackparents do not pass on the full measure of their genetic advantage to their children,even though they gave them a good upbringing and good schools, often better thantheir own. (The same, of course, applies to high IQ White parents.) Culture-onlytheory cannot predict these results but must argue that cultural factors somehowimitate the effect theoretically predicted by genetic theory, which have also beendemonstrated in studies of physical traits and in animals.
Jensen (1973, pp. 107–119) tested the regression predictions with data fromsiblings (900 White sibling pairs and 500 Black sibling pairs). These provide aneven better test than parent–offspring comparisons because siblings share verysimilar environments. Black and White children matched for IQ had siblings whohad regressed approximately halfway to their respective population means ratherthan to the mean of the combined population. For example, when Black childrenand White children were matched with IQs of 120, the siblings of Black childrenaveraged close to 100, whereas the siblings of White children averaged close to110. A reverse effect was found with children matched at the lower end of the IQscale. When Black children and White children are matched for IQs of 70, thesiblings of the Black children averaged about 78, whereas the siblings of theWhite children averaged about 85. The regression line showed no significantdeparture from linearity throughout the range of IQ from 50 to 150, as predictedby genetic theory but not by culture-only theory.
263RACE DIFFERENCES IN COGNITIVE ABILITY

Section 10: The Race–Behavior Matrix
Around the world, the rate of dizygotic (i.e., two-egg) twinning is less than 4per 1,000 births among East Asians, 8 among Whites, and 16 or greater amongBlacks (Bulmer, 1970). Multiple birthing rates have been shown to be heritable,based on the race of the mother, regardless of the race of the father, as found inEast Asian–White crosses in Hawaii and White–Black crosses in Brazil (Bulmer,1970).
On average, Black babies are born a week earlier than White babies, yet theyare more mature as measured by pulmonary function, amniotic fluid, and bonedevelopment. In the United States, 51% of Black children have been born by week39 of pregnancy compared with 33% of White children. Black African babies,even those born to mothers in the professional classes, are also born earlier thanWhite babies (Papiernik, Cohen, Richard, de Oca, & Feingold, 1986). They arenot born premature but sooner, and they are biologically more mature.
After birth, Black babies continue to mature faster, on average, than Whitebabies, whereas East Asian babies average an even slower rate. X-rays show afaster rate of average bone growth in Black children than in White children, anda faster rate in White children than in East Asian children (Eveleth & Tanner,1990, pp. 154–155). Black babies at a given age also average greater muscularstrength and a more accurate reach for objects. Black children average a youngerage of sitting, crawling, walking, and putting on their own clothes than Whites orEast Asians. The average age of walking is 13 months in East Asian children, 12months in White children, and 11 months in Black children (Bayley, 1965;Brazelton & Freedman, 1971).
Blacks average a faster rate of dental development than do Whites, who havea faster rate than do East Asians. On average, Black children begin the first stageof permanent tooth growth at about 5.8 years, whereas Whites and East Asians donot begin until 6.1 years (Eveleth & Tanner, 1990, pp. 158–161). Blacks also havean earlier age of sexual maturity than do Whites, who in turn have an earlieraverage age than do East Asians, whether measured by age of first menstruation,first sexual experience, or first pregnancy (Rushton, 2000, pp. 147–150).
Myopia (nearsightedness) is positively correlated with IQ and may be causedby extra myelinization in the eye and so possibly linked to brain size (Miller,1994). The relationship appears to be pleiotropic (Cohn, Cohn, & Jensen, 1988);that is, a gene affecting one trait also has some effect on one or more others. Thereare significant racial and ethnic differences in the frequency of myopia, with thehighest rates found in East Asians, the lowest rates among Blacks, with Whitesintermediate (Post, 1982).
Not just in the United States but around the world, East Asians and Blacks fallat the two ends of a continuum with Whites intermediate, not only on meancognitive test scores and brain size measures but also on 60 life-history variablesthat provide measures of maturation, personality, reproduction, and social orga-nization. It seems unlikely that social factors alone could produce this consistentpattern on so diverse a set of behaviors (see Table 3; Rushton, 2000, p. 5, Table1.1 for complete list). This evidence raises the theoretical question of whethersingle traits such as intelligence are part of a broader “life-history” perspective.
264 RUSHTON AND JENSEN

Section 11: Mean Race–IQ Differences and Human Origins
The currently most commonly accepted view of human origins, the “Out-of-Africa” theory, posits that Homo sapiens arose in Africa about 150,000 years ago,expanded northward beyond Africa about 100,000 years ago, with a European–East Asian split about 41,000 years ago (Cavalli-Sforza et al., 1994; Stringer &McKie, 1996). In Cavalli-Sforza’s (2000) maximum likelihood tree devised onthe basis of molecular genetic markers, the most distant group was the Africans,with Europeans and Asians being closer. Cavalli-Sforza observed, “All worldtrees place the earliest split between Africans and non-Africans, which is expectedgiven that all humans originated in Africa” (p. 72). This is also the conclusion ofother reviewers (e.g., Risch et al., 2002).
Evolutionary selection pressures were different in the hot savanna where
Table 3Worldwide Average Differences Among Blacks, Whites, and East Asians
Trait Blacks Whites East Asians
IntelligenceIQ test scores 85 102 106Decision times Slower Intermediate FasterCultural achievements Low High High
Brain sizeCranial capacity (cm3) 1,267 1,347 1,364Cortical neurons (millions) 13,185 13,665 13,767
Maturation rateGestation time Shorter Longer LongerSkeletal development Earlier Intermediate LaterMotor development Earlier Intermediate LaterDental development Earlier Intermediate LaterAge of first intercourse Earlier Intermediate LaterAge of first pregnancy Earlier Intermediate LaterLife span Shortest Intermediate Longest
PersonalityAggressiveness Higher Intermediate LowerCautiousness Lower Intermediate HigherImpulsivity Higher Intermediate LowerSelf-concept Higher Intermediate LowerSociability Higher Intermediate Lower
ReproductionTwo-egg twinning (per 1,000 births) 16 8 4Hormone levels Higher Intermediate LowerSex characteristics Larger Intermediate SmallerIntercourse frequencies Higher Intermediate LowerPermissive attitudes Higher Intermediate LowerSexually transmitted diseases Higher Intermediate Lower
Social organizationMarital stability Lower Intermediate HigherLaw abidingness Lower Intermediate HigherMental health Lower Intermediate Higher
Note. From Race, Evolution, and Behavior: A Life History Perspective (p. 5), by J. P.Rushton, 2000, Port Huron, MI: Charles Darwin Research Institute. Copyright 2000 byJ. P. Rushton. Adapted with permission.
265RACE DIFFERENCES IN COGNITIVE ABILITY

Africans lived than in the cold northern regions Europeans experienced, or theeven colder Arctic regions of East Asians. These ecological differences affectednot only morphology but also behavior. It has been proposed that the farther norththe populations migrated out of Africa, the more they encountered the cognitivelydemanding problems of gathering and storing food, gaining shelter, makingclothes, and raising children successfully during prolonged winters (Rushton,2000). As these populations evolved into present-day Europeans and East Asians,the ecological pressures selected for larger brains, slower rates of maturation, andlower levels of testosterone—with concomitant reductions in sexual potency,aggressiveness, and impulsivity; increases in family stability, advanced planning,self-control, rule following, and longevity; and the other characteristics listed inTable 3. The fact that the three-way pattern in IQ, brain size, and other traits is notunique to the United States but occurs internationally is consistent with a single,general (genetic–evolutionary) theory, whereas culture-only theory must invoke anumber of highly localized, specific explanations.
As Homo sapiens migrated further away from Africa, the random geneticmutations that occur at a constant rate in all living species accumulated, alongwith the adaptive changes. The resulting differences in allele frequencies aresufficient for numerous and extensive genetic investigations to yield essentiallythe same picture and identify the same major racial groupings as did the mor-phological markers of classical anthropology. The greatest genetic divergencewithin the human species is between Africans (who have had the most time forrandom mutations to accumulate) and non-Africans (Cavalli-Sforza 2000; Cav-alli-Sforza et al., 1994; Nei & Roychoudhury, 1993). Jensen (1998b, pp. 517–520)carried out a principal-components analysis of data on genetic markers from Neiand Roychoudhury (1993) and found the familiar clustering of races: (a) EastAsians, (b) Europeans and East Indians, (c) South Asians and Pacific Islanders, (d)Africans, (e) North and South Amerindians and Eskimos, and (f) AboriginalAustralians and Papuan New Guineans. Howells’s (1993) analysis of between-groups variation in craniometric data also revealed a similar population tree. Thegenetic hypothesis is consistent with the latest findings on human origins andgenetic variation, whereas culture-only theory is indifferent to them (Crow, 2002).
Section 12: How Well Have Culture-Only Theories of Mean Race–IQDifferences Held Up?
Culture-only hypotheses have not explained the mean Black–White groupdifferences in IQ. (They have especially not explained the findings on EastAsians.) One early view was that the mean Black–White group difference in IQwas due to the then obvious differences in (segregated) school facilities (Myrdal,1944). However, despite the U.S. Supreme Court Brown v. Board of Education(1954) decision striking down segregated schooling, and the consequent nation-wide program of school busing, the mean Black–White group difference has notdecreased. Moreover, the Coleman Report (Coleman et al., 1966) found that theracial composition of schools per se was not related to achievement in eitherBlacks or Whites. Most of the variation in IQ scores occurred within schools andless than 20% occurred between schools. Negligible, and in some cases, negativecorrelations were found between IQ and variables such as pupil expenditure,
266 RUSHTON AND JENSEN

teachers’ salaries, teachers’ qualifications, student/teacher ratios, and the avail-ability of other school professionals (see also Coleman, 1990–1991).
The most frequently stated culture-only hypothesis is that the mean IQdifferences are due to SES. In fact, controlling for SES only reduces the meanBlack–White group difference in IQ by about a third, around 5 IQ points. Thegenetic perspective does not regard this control for SES as being entirely envi-ronmental. It holds that the parents’ socioeconomic level in part reflects theirgenetic differences in intelligence. Moreover, according to the culture-only the-ory, as Black groups advance up the socioeconomic ladder, their children shouldbe less exposed to environmental deficits and therefore should do better and, byextension, close the distance separating the Black mean with the White. In fact,the magnitude of the mean Black–White group difference in IQ for higher SESlevels, when measured in standard deviations, is larger (Herrnstein & Murray,1994, pp. 286–289).
Other nongenetic hypotheses are that standard IQ tests are culturally biasedbecause the test items are not equally familiar and motivating to all groups or thatthey only measure familiarity with middle-class language or culture. However,despite attempts to equate items for familiarity and culture-fairness, no “culture-fair” test has eliminated the mean group difference. American Blacks actuallyhave higher average scores on culturally loaded tests than on culturally reducedtests, which is the opposite to what is found for some other groups such asMexican Indians and East Asians. (The mean Black–White group differences aregreatest on the g factor, regardless of the type of test from which g is extracted;see Section 4.) Moreover, the three-way pattern of mean Black–White–East Asiangroup differences occurs worldwide on culture-fair reaction time measures, whichall children can do in less than 1 s (see Section 3).
Subsequent culture-only hypotheses have pointed to specific aspects of de-privation as possible determinants of IQ. These include the following: (a) lack ofreading material in the home, (b) poor cultural amenities in the home, (c) weakstructural integrity of the home, (d) foreign language in the home, (e) lowpreschool attendance, (f) no encyclopedia in the home, (g) low level of parentaleducation, (h) little time spent on homework, (i) low parental educational desiresfor child, (j) low parental interest in school work, (k) negative child self-concept(self-esteem), and (l) low child interest in school and reading. However, bothwithin-race kinship studies and across-race adoption studies show that theseenvironmental variables have increasingly smaller effects on the adoptees’ IQ asthey reach adolescence (see Sections 5 and 7). Moreover, other studies found thatAmerican Indians and East Asians averaged higher in IQ than Blacks, eventhough they averaged lower on these proposed causal factors (Coleman et al.,1966, p. 20). Another example comes from the Inuit, who live above the ArcticCircle and have higher average IQs than do either American or Jamaican Blacks(Berry, 1966; MacArthur, 1968) even though their socioeconomic conditions areextremely poor and unemployment is high (P. E. Vernon, 1965, 1979).
In the 1960s, culture-only theory formed the basis for implementing “HeadStart”-type intervention programs as a way to eliminate the group differences inIQ and scholastic achievement. Although federal matching grants were given toimprove the learning skills, social skills, and health status of low-income pre-school children so that they could begin schooling on an equal footing with their
267RACE DIFFERENCES IN COGNITIVE ABILITY

more advantaged peers, the mean Black–White group difference in IQ was noteliminated or permanently reduced. Currie and Thomas (1995) reviewed theliterature and carried out a longitudinal study using a national sample of over4,000 children in which they compared siblings to control for selection bias. Theyfound that although Head Start led to large and significant immediate gains in testscores for both White and Black groups, these gains were quickly lost for Blackgroups, although some remained for White groups. Even more intensive andprolonged educational interventions than Head Start have not produced lastingeffects on IQ or scholastic performance (Jensen, 1998b, pp. 333–344) or thatgeneralize to other measures or criteria.
Some culture-only theorists propose that SES should not be assessed in termsof crude material measures but must be seen as a complex of attitudes, aspirations,self-images, and societal stereotypes (Loury, 2002; Ogbu, 2002; Sowell, 1994).Some of these types of cultural factors have been tested as well. Matching Blackand White children for the geographical areas of their homes, the schools theyattend, and other finer grade socioeconomic indicators again reduces the meangroup IQ difference but does not eliminate it. Black children from the best areasand schools (those producing the highest average scores) still average slightlylower than do White children with the lowest socioeconomic indicators (Herrn-stein & Murray, 1994, pp. 286–289; Jensen, 1998b, pp. 357–360). This is ananomaly for the culture-only theory but is explained by genetic theory throughregression to the mean (see Section 10).
Other culture-only hypotheses have invoked Black role models, test anxiety,self-esteem, and racial stress as causal agents, but none of these have ever beenconsistently confirmed (Jensen, 1980, 1998b). Other ideas, such as stereotypethreat (Steele, 1997), involuntary-minorities-are-castes (Ogbu, 2002), and racestigma (Loury, 2002), do not explain the low IQ of Africans south of the Sahara,where Blacks are in the majority. Nor is there any evidence from analyses of largearchival data sets that unique minority-specific factors such as the history ofslavery, White racism, lowered expectations, or heightened stress make culturalinfluences stronger for one group than for another (see Section 5). Neither canracial stigmatization (Loury, 2002) explain why East Asians average higher in IQand brain size than Whites. A progressive theory of racial group differences mustaddress all the known facts.
Culture-only theory must offer some explanation why its main variables—poverty, social class, religious beliefs, cultural practices, father absence, andparenting styles—account for so little variance within groups. Given these re-peated findings, it is unlikely such variables can account for differences betweengroups (see Section 5). Adoption and twin studies show that the environmentalvariables influencing IQ and social behavior are primarily those that occur withinfamilies rather than between families (see Figure 3). Although the causes ofwithin-group differences are logically separate from the causes of between-groupsdifferences (Section 2), even when the combined set of within- and between-families variables is examined together, there are still no identifiable race-specificvariables (Section 5).
It is always possible that new data with sharper hypotheses and better controlscould require a revision of the finding of no shared family or minority-specificcultural effects on race–IQ differences. There were hints (but no more than that)
268 RUSHTON AND JENSEN
of a lower heritability and a greater shared environment component in Blackadolescents than in White adolescents in Rushton and Osborne’s (1995) twinstudy of cranial capacity (Section 5). Similarly, an epidemiological study oflow-birth-weight and normal children, followed from 6 to 11 years of age,reported an IQ decline in mainly Black inner-city children with no similar IQdecline in mainly White suburban children. The authors interpreted their results asa between-community effect and the racial makeup of the schools the childrenattended, more than to individual and family factors (Breslau et al., 2001).Behavioral genetic designs using traditional modeling procedures (Section 5),along with new individual admixture measures on mixed-race participants (Sec-tion 8), could provide counterevidence to our conclusions. Unfortunately, behav-ioral geneticists (who have the most knowledge of the best techniques) have forthe most part avoided the racial question.
One culture-only hypothesis currently enjoying much support is based on thesecular increase in test scores, known as the Flynn effect because of the repeateddemonstration by James Flynn (1984, 1987, 1999) that the average IQ in severalcountries has increased by about 3 points a decade over the last 50 years. Somehave suggested that the Flynn effect implies that the 1 standard deviation differ-ence in the mean Black–White IQ difference in the United States will graduallydisappear over time (Flynn, 1999). However, one statistical analysis shows thatthe Flynn effect is not on the g factor, the principal source of the mean Black–White group difference.
Table 4 (based on Rushton, 1999) shows the results of a principal-componentsanalysis of the secular gains in IQ from the United States, Germany, Austria, andScotland, along with Black–White IQ difference scores from the United States,inbreeding depression scores from cousin-marriages in Japan, and g loadings fromthe standardization samples of the WISC–R and WISC–III. The relevant findingsare as follows: (a) The IQ gains on the WISC–R and WISC–III form a cluster,showing that the secular trend in overall test scores is a reliable phenomenon; but(b) this cluster is independent of a second cluster formed by Black–Whitedifferences, inbreeding depression scores (a purely genetic effect), and g factorloadings (a largely genetic effect).
This analysis shows that the secular increase in IQ behaves differently fromthe mean Black–White group difference in IQ. Flynn’s (1999) hypothesis that theIQ gains over time imply a purely environmental origin of mean racial-groupdifferences is not supported. Although the Flynn effect does suggest that improv-ing the environment, especially at the low end of the IQ distribution, can improvetest scores, the cluster analysis shows that the g factor is independent of the Flynneffect. Instead, g is associated with inbreeding depression, for which there is nonongenetic explanation, which implies strongly that g is less amenable to envi-ronmental manipulation. These findings are consistent with an analysis of adop-tion data, which shows the IQ gains that result from being adopted into high SEShomes do not produce a gain in g but only in non-g factors and in specificity ofthe various subtests. The adopted children’s g factor scores reflected the SES levelof their biological parents (Jensen, 1998a).
Dickens and Flynn (2001) replied to Rushton’s (1999) cluster analysis with amore general statement of having resolved the paradox of how high heritabilitiescould go along with large secular increases in IQ. Their solution rests on the role
269RACE DIFFERENCES IN COGNITIVE ABILITY

of genotype–environment correlation. Recall from Section 5 that this occurslargely through the individual’s genetic tendency to encounter, select, or createcertain aspects of the environment in preference to alternatives. Genotype–environment correlation is part of the mechanism by which genetic proclivitiesbecome realized. Dickens and Flynn hypothesized that the positive feedbackeffects from even small initial environmental advantages stimulate mental devel-opment and lead to an even more favorable environment, stimulating yet more IQdevelopment.
Dickens and Flynn’s (2001) model, however, appears inconsistent withsome empirical evidence. Gene– environment correlation cannot explain themean Black–White group difference in IQ because it implies that Blackgroups, in comparison with White groups, become increasingly disadvantagedduring the developmental period from early childhood to maturity. Withincreasing age there would be cumulative unfavorable effects on IQ for Blackgroups with respect to White groups. Yet national data (reviewed in Section3) show that the size of the mean Black–White group difference remainsapproximately constant at 1 standard deviation and shows no significantchange throughout the developmental period after about 3 years of age. Thefollow-up results of the Minnesota Transracial Adoption Study (Table 2), andthe fact that the heritability for IQ generally increases from about 0.40 in earlychildhood to about 0.80 in later maturity (Figure 3), both contradict theDickens–Flynn thesis. So too does the fact that both g estimates calculated
Table 4Principal-Components Analysis and Varimax Rotation for PearsonCorrelations of Inbreeding Depression Scores, Black–White Differences, gLoadings, and Gains Over Time on the Wechsler Intelligence Scales forChildren (WISC) With Reliability Partialed Out
Variable
Principal components
Unrotatedloadings
Varimax rotatedloadings
I II 1 2
Inbreeding depression scores from Japan(WISC–R) 0.31 0.61 0.26 0.63
Black–White differences from the U.S.(WISC–R) 0.29 0.70 0.23 0.72
WISC–R g loadings from the U.S. �0.33 0.90 �0.40 0.87WISC–III g loadings from the U.S. �0.61 0.64 �0.66 0.59U.S. gains 1 (WISC to WISC–R) 0.73 �0.20 0.75 �0.13U.S. gains 2 (WISC–R to WISC–III) 0.81 0.40 0.77 0.47German gains (WISC to WISC–R) 0.91 0.03 0.91 0.11Austria gains (WISC to WISC–R) 0.87 0.00 0.86 0.07Scotland gains (WISC to WISC–R) 0.97 0.08 0.96 0.17% of total variance explained 48.60 25.49 48.44 25.65
Note. Values in bold define the factors. From “Secular Gains in IQ Not Related to theg Factor and Inbreeding Depression—Unlike Black–White Differences: A Reply toFlynn,” by J. P. Rushton, 1999, Personality and Individual Differences, 26, p. 387.Copyright 1999 by Elsevier Science. Reprinted with permission.
270 RUSHTON AND JENSEN

from East Indians in South Africa and genetic estimates calculated from theJapanese in Japan are able to predict the magnitude of Black–White differ-ences in South Africa and in the United States (see Sections 4 and 5). Suchrobust generalization implies that the mean Black–White group difference inIQ is sufficiently persistent across cultures as to be unaffected by majorchanges in gene– environment correlations.
Dickens and Flynn (2001) provided no empirical evidence that gene–envi-ronment correlation constitutes either a large component of the phenotypic vari-ance or that it increases with age (both of which are required by their model).They also did not provide any other direct empirical evidence. In addition, theirmodels have been criticized for not taking the stability of IQ scores over time intoaccount and for having too many free parameters (Loehlin, 2002; Rowe &Rodgers, 2002), to which Dickens and Flynn (2002) have replied. Because to dateDickens and Flynn have not given the high heritability of IQ any independentcausal effect in explaining the mean Black–White group difference, their thesis isbest placed in the culture-only camp.
Section 13: Evaluating the Culture-Only and the HereditarianResearch Programs
Table 5 summarizes the 30-plus-years of research on Black–White IQ differ-ences carried out since Jensen’s (1969) Harvard Educational Review article. Itcompares and contrasts the predictions of the hereditarian and the culture-onlytheories against the existing data reviewed in Sections 3 through 12, to which wethen assigned “scores.” We assigned the highest score (��) when, in our opinion,the results confirmed a novel prediction first derived from theory that was thentested and confirmed. We awarded the next highest score (�) when the resultswere consistent with theory but not predicted from it. We gave a neutral score (0)when the results could not be predicted from theory so that it could be eitherconfirmed or disconfirmed. We assigned a negative score (–) when the predictedresults were disconfirmed. Because some diacritical tests have two components,the maximum possible support for either research program would be a score of12 � 2 � 24; maximum disconfirmation would be a score of –24. Naturally thesescores reflect our particular evaluation of how well the two competing theoriespredict and explain the evidence. We acknowledge that others might see thingsdifferently, and we invite them to assign their scores. Our purpose is to advancethe debate.
Our evaluation of the evidence supports a cumulative score of 17 for thehereditarian model and –7 for the culture-only model. We therefore suggest thatthe hypothesis of some genetic component in the mean Black–White groupdifference in IQ should be considered “provisionally true.” Naturally, we do notexpect everyone to agree with this assessment. Our own perspective is obviouslyhereditarian (Jensen, 1998b; Rushton, 2000). Those working from a differentperspective may arrive at alternative tallies or add new dimensions to be talliedthat we have overlooked. Before discussing our conclusion, we consider in moredetail the data on each of the categories in Table 5.
271RACE DIFFERENCES IN COGNITIVE ABILITY

Tab
le5
Com
pari
son
Cha
rtfo
rE
valu
atin
gth
eH
ered
itar
ian
(50%
Gen
etic
)an
dC
ultu
re-O
nly
(0%
Gen
etic
)R
esea
rch
Pro
gram
s
Sect
ion:
Pred
ictio
nH
ered
itari
anm
odel
Scor
eC
ultu
re-o
nly
mod
elSc
ore
3:M
ean
Bla
ck–W
hite
–Eas
tA
sian
IQdi
ffer
ence
sfo
und
wor
ldw
ide.
Pred
icte
dby
here
dita
rian
mod
el.
(��
)L
ower
Bla
cksc
ores
due
tocu
ltura
lde
priv
atio
n,bu
thi
gher
Eas
tA
sian
scor
esan
omal
ous.
(�)
4:M
ean
Bla
ck–W
hite
diff
eren
ces
grea
ter
ong
load
edco
gniti
vete
sts
than
oncu
ltura
llylo
aded
cogn
itive
test
s.
Nov
elpr
edic
tion
from
theo
ryco
nfirm
ed.
(��
)Pr
edic
tions
cont
radi
cted
.(�
)
5:M
ean
Bla
ck–W
hite
diff
eren
ces
inIQ
grea
ter
onm
ore
heri
tabl
esu
btes
tsth
anon
cultu
rally
mal
leab
lesu
btes
ts.
Nov
elpr
edic
tion
from
theo
ryco
nfirm
ed.
(��
)Pr
edic
tions
cont
radi
cted
.(�
)
6:M
ean
Bla
ck–W
hite
–Eas
tA
sian
IQdi
ffer
ence
sas
soci
ated
with
mea
ndi
ffer
ence
sin
brai
nsi
ze.
Exp
lain
sB
lack
–Whi
teIQ
diff
eren
ces.
(��
)L
ower
Bla
cksi
zedu
eto
nutr
ition
alde
priv
atio
n,bu
tE
ast
Asi
ansi
zean
omal
ous.
(�)
7:M
ean
Bla
ck–W
hite
–Eas
tA
sian
IQdi
ffer
ence
sre
mai
n(i
nal
ldi
rect
ions
)fo
llow
ing
tran
srac
ial
adop
tion,
desp
iteea
rly
depr
ivat
ion
inE
ast
Asi
ans.
Gen
etic
effe
cts
stro
nger
than
com
mon
envi
ronm
ent
effe
cts.
(��
)Pr
edic
tion
fails
beca
use
Bla
ck–W
hite
IQdi
ffer
ence
sdo
not
disa
ppea
r.C
anno
tex
plai
nw
hyE
ast
Asi
ans
aver
age
high
erth
anW
hite
s.
(�)
8:M
ean
Bla
ck–W
hite
diff
eren
ces
inIQ
and
brai
nsi
zere
flect
edin
stud
ies
ofra
cial
adm
ixtu
re.
Chi
ldre
nw
rong
lybe
lieve
dby
adop
tive
pare
nts
toha
vetw
oB
lack
biol
ogic
alpa
rent
sha
dth
esa
me
IQs
asch
ildre
nco
rrec
tlycl
assi
fied
asof
mix
edra
ce.
Pred
icte
dby
gene
ticth
eory
.(�
)So
cial
disc
rim
inat
ion
via
skin
colo
rdo
esno
tex
plai
nra
cial
mis
clas
sific
atio
nno
rth
epa
ttern
ofm
ean
brai
nsi
zedi
ffer
ence
s.
(0)
9:M
ean
Bla
ck–W
hite
IQdi
ffer
ence
ssh
owre
gres
sion
tow
ard
pred
icte
dra
cem
eans
.B
est
evid
ence
com
esfr
omw
ell-
cont
rolle
dsi
blin
gst
udie
s.
Nov
elpr
edic
tion
confi
rmed
.(�
�)
Pare
nt–c
hild
regr
essi
onpr
edic
ted,
but
sibl
ing
data
anom
alou
s.(0
)
272 RUSHTON AND JENSEN

Tab
le5
(con
tinu
ed)
Sect
ion:
Pred
ictio
nH
ered
itari
anm
odel
Scor
eC
ultu
re-o
nly
mod
elSc
ore
10:
Mea
nB
lack
–Whi
te–E
ast
Asi
anIQ
diff
eren
ces
are
para
llele
dby
ara
ce–b
ehav
ior
mat
rix
of60
life-
hist
ory
trai
ts.
Seri
esof
nove
lpr
edic
tions
base
don
anev
olut
iona
ryth
eory
ofra
cial
orig
ins
confi
rmed
.
(��
)A
nom
alou
s.(�
)
11:
Mea
nB
lack
–Whi
te–E
ast
Asi
andi
ffer
ence
sm
esh
with
wha
tis
know
nab
out
hum
anev
olut
ion.
Seri
esof
nove
lpr
edic
tions
base
don
evol
utio
nary
theo
ryco
nfirm
ed.
(��
)A
nom
alou
s.(�
)
12:
Mea
nB
lack
-Whi
te-E
ast
Asi
andi
ffer
ence
sno
tfu
llyex
plai
ned
byan
ym
odel
,no
tby
a10
0%cu
lture
-onl
ym
odel
,by
a10
0%ge
netic
-onl
ym
odel
,or
,w
ithpr
ecis
ion,
even
byth
e50
%ge
netic
-50%
envi
ronm
enta
lm
odel
.
The
mod
elof
50%
gene
s-50
%en
viro
nmen
tm
ayne
edto
bere
vise
d,pe
rhap
sto
80%
gene
s-20
%en
viro
nmen
t.
(0)
Mod
elas
curr
ently
stat
edfa
ils.
Iden
tifyi
ngso
me
larg
eG
ene
�E
nvir
onm
ent
inte
ract
ion
mig
htm
ake
itvi
able
.
(0)
Tot
al17
�7
Not
e.K
eyfo
rsc
ores
:��
�st
rong
supp
ort:
resu
ltsco
nfirm
eda
nove
lpre
dict
ion
first
deri
ved
from
theo
ryan
dth
ente
sted
;��
mild
supp
ort:
resu
ltsco
nsis
tent
with
theo
rybu
tno
tpr
edic
ted
from
it;0
�ne
utra
l:re
sults
coul
dno
tbe
pred
icte
dfr
omth
eory
soth
atit
coul
dbe
eith
erco
nfirm
edor
disc
onfir
med
;�
�re
ject
ion:
resu
ltspr
edic
ted
from
theo
rydi
scon
firm
ed.B
ecau
seso
me
diac
ritic
alte
sts
have
two
elem
ents
,the
max
imum
poss
ible
supp
ort
wou
ldbe
asc
ore
of12
�2
�24
and
max
imum
disc
onfir
mat
ion
wou
ldbe
asc
ore
of�
24.
273RACE DIFFERENCES IN COGNITIVE ABILITY

Mean Race–IQ Differences Are Found Worldwide (Section 3)
The mean Black–White IQ difference in the United States of 85 versus 100can be, and has been, explained both by the hereditarian model (in terms of somegenetic difference) and by the culture-only model (in terms of nutrition, poverty,SES, family structure, schooling, racism, and the legacy of slavery). Hence,initially we were inclined to give both the hereditarian model and the culture-onlymodel a score of (�). The hereditarian model, however, also predicted that thesame pattern would be found worldwide, with lower scores for sub-SaharanAfrica than for Black Americans, and that the differences would also be found onculture-fair tests and on reaction time tasks that measure the speed and efficiencywith which the brain processes information (and which all children can performin less than 1 s). These predictions were confirmed. The culture-only hypothesisis disconfirmed by the differences on culture-fair and reaction time tests. Nor canthe culture-only model easily explain why the East Asian average IQ of 106 ishigher than the average White IQ, including on these same speed-of-processingtasks. Within the United States, the mean Black–White group difference in IQ hasnot changed significantly over the past 100 years despite significant improvementsin the conditions of Black Americans. The same magnitude of difference isobserved as early as age 21⁄2 years. Our score for Section 3: hereditarian model(�); culture-only model (–).
Race–IQ Differences Are Most Pronounced on the More g-LoadedComponents of Tests and Least So on the Most Culturally Loaded Items(Section 4)
The hereditarian model made the novel prediction that the mean Black–Whitegroup difference in IQ is not the result of idiosyncratic cultural peculiarities in thisor that test but would be more pronounced on highly g-loaded tests. Because theprediction was confirmed, it counts as evidence for the hereditarian position whilealso contradicting the prediction from the culture-only model that the differencesare due to culturally loaded tests. In South Africa, g loadings calculated on EastIndians predicted mean Black–White group differences, showing substantialcross-cultural generalizability. A test’s g loading is the best predictor, not just ofits correlation with scholastic and workplace performance, but also of its corre-lation with reaction time measures, heritability coefficients determined from twinstudies, inbreeding depression scores calculated in children of cousin-marriages,and neurological variables such as brain size, brain evoked potentials, brain pHlevels, brain glucose metabolism, and nerve conduction velocity. Thus, we con-clude the evidence reviewed in Section 4 strongly supports the hereditarian model(��) and argues against the culture-only model (–).
Race–IQ Differences Are Most Pronounced on the More HeritableComponents of Tests With Little or No Evidence of Race-SpecificDevelopmental Processes (Section 5)
Research based on this novel prediction from the hereditarian model estab-lished that (a) the heritability of IQ among Black groups is around 0.50, notsignificantly different from that found in White groups; (b) there is no evidence
274 RUSHTON AND JENSEN

of the effect of any special minority-specific developmental process resultingfrom the legacy of slavery or of White racism in large sets of archival correlationmatrices between background variables and outcome measures, or on relationsamong subtests; (c) IQ subtests with higher heritabilities predict mean Black–White group differences better than do subtests with lower heritabilities; and (d)the shared environment type of variables usually proposed to explain groupdifferences (e.g., differences in income, schools) decrease in effect size with age.Cross-cultural generality was demonstrated by the fact that the magnitude ofinbreeding depression scores on various subtests calculated on the Japanese inJapan predicted the magnitude of Black–White differences in the United States.Because the empirical results confirmed a novel prediction from the hereditarianmodel (��) but disconfirmed several predictions from culture-only theory (–),we scored Section 5: hereditarian model (��); culture-only model (–).
Mean Race–IQ Differences Are Associated With Mean Brain SizeDifferences (Section 6)
Overall, MRI studies show that brain size is related to IQ differences withinrace. Moreover, the three-way pattern of group differences in average brain sizeis detectable at birth. By adulthood, East Asians average 1 cubic inch more cranialcapacity than Whites, and Whites average 5 cubic inches more cranial capacitythan Blacks. These findings on group differences in average brain size have beenreplicated using MRI, endocranial volume from empty skulls, wet brain weight atautopsy, and external head size measures. They were acknowledged by UlricNeisser, Chair of the APA’s Task Force on intelligence, who noted that, withrespect to “racial differences in the mean measured sizes of skulls and brains (withEast Asians having the largest, followed by Whites and then Blacks) . . . there isindeed a small overall trend” (Neisser, 1997, p. 80). The hereditarian modelexplains these in terms of genetic differences. The culture-only position canexplain them in terms of nutrition, SES, or early cognitive stimulation. Adding theEast Asian data, however, literally “changes the shape of the table.” The hered-itarian model posits that if East Asians average higher IQs than do Whites, thenthey must also average larger brains than Whites, and that perhaps both the higherIQ and the larger brain are most parsimoniously explained in terms of the naturalselection experienced in colder climates during human evolution (��). Theculture-only position has yet to explain both the higher IQ and the larger brainsize of East Asians, given that these groups have also been subjected to prejudicein White societies or severe malnutrition in their homelands. We scored Section6: hereditarian model (��); culture-only model (–).
Mean Race Differences in IQ Remain Following TransracialAdoption (Section 7)
Transracial adoption studies provide one of the best methods for resolving thequestion of group differences in mean IQ. The above-average IQ scores of Blackadoptees at age 7 confirmed the culture-only predictions. The results of thefollow-up testing at age 17 were more ambiguous. The hereditarian modelpredicted that when the longitudinal study was carried out, the Black–Whitedifference would emerge (based on the increasing size of the genetic effect on IQ
275RACE DIFFERENCES IN COGNITIVE ABILITY

with age), and this is one interpretation of the data, though a culture-onlyinterpretation is also plausible. However, support for the hereditarian model againcomes from adding the East Asian data to the mix. Korean and Vietnamesechildren adopted into White homes, even though as babies many had beenhospitalized for malnutrition, nonetheless grew to have IQs 10 or more pointshigher than their adoptive national norms. The culture-only model cannot explainthat finding. Further, it argues against the culture-only hypothesis that the highperformance of East Asian children is due to “trying harder” or other culturalvalues emphasized by East Asian families. Our score for Section 7: hereditarianmodel (��); culture-only model (–).
Studies of Racial Admixture Reflect Mean Black–White IQDifferences (Section 8)
Both the hereditarian and the culture-only model can explain why groups oflighter skinned African Americans and the (also lighter skinned) mixed-race“Coloreds” of South Africa have average IQs between those of (for the most part)unmixed groups of Blacks and Whites. Both models can also explain the fact thatthe degree of White admixture is correlated with brain weight at autopsy. Theculture-only position does so in terms of societal discrimination based on skincolor as well as its possible cascading effects on nutrition and health (�); thehereditarian model does so in terms of the hypothesized genetic difference inaverage IQ and its correlations with race and skin color (�). Some evidenceagainst the culture-only position comes from studying the misclassified adopteesin the Minnesota Transracial Adoption Study (–). The expectancy effects hypoth-esis, that adoptive parents’ beliefs about their child’s racial background influencethe child’s intellectual development, is not supported by the finding that the meanIQ score for 12 children wrongly believed by their adoptive parents to have hadtwo Black biological parents was about the same as that of the 56 childrencorrectly believed by their adoptive parents to have had one Black and one Whitebiological parent. While the number of children is small, this conclusion issupported by Rowe’s study in which 119 mixed-race children were selected as“looking African American” but their IQ scores also turned out to be intermediate.Our score for Section 8: hereditarian model (�); culture-only model (0).
IQs Show Regression Toward Predicted Racial Means (Section 9)
The phenomenon of regression to the mean is predicted from basic genetictheory and has been documented for a number of physical traits in humans and inother species. The hereditarian model applied this reasoning to IQ studies to makea novel prediction about the amount of regression across the whole IQ distributionand various degrees of kinship. The results showed that the children of Blackparents of IQ 115 regressed toward the Black average IQ of 85, whereas childrenof White parents of IQ 115 regressed toward the White average IQ of 100. Theconverse occurred at the low end of the scale. Even stronger support for thehereditarian position came from sibling data. The regression lines for both Blacksand for Whites showed no significant departure from linearity throughout therange of IQ from 50 to 150. A failure of this prediction would have argued againstthe hereditarian model but would have been neutral for the culture-only model.
276 RUSHTON AND JENSEN
The predictions from the hereditarian model were tested and confirmed. Theculture-only theory must argue that environmental effects or chance variationmimics the predicted genetic effects. We scored Section 9: hereditarian model(��); culture-only model (0).
Mean Race–IQ Differences Are Paralleled by a Matrix of Other Traitsand Behaviors (Section 10)
A suite of over 60 life-history variables, including rate of two-egg twinning,speed of maturation and longevity, personality and temperament, family stabilityand crime, sexual behavior and fertility, as well as intelligence and brain size,have been identified on which East Asian and African groups consistently averageat the two ends of a continuum, with European groups intermediate, regardless ofwhere they presently live. This race–behavior matrix constitutes a series of novelpredictions derived from an evolutionary theory of the origin of races that weretested and confirmed. The culture-only model has only partially addressed thisrace–behavior matrix, with (sometimes contradictory) supplementary hypotheses.Our score for Section 10: hereditarian model (��); culture-only model (–).
Mean Race–IQ Differences and Human Evolution (Section 11)
One theory of human evolution argues that the farther north the ancestralhuman populations migrated out of Africa, about 100,000 years ago, the morethey encountered the cognitively demanding problems of gathering and storingfood, gaining shelter, making clothes, and raising children successfully duringprolonged winters. (This is not the only theory of human evolution, nor do all whoendorse it concur with our interpretation.) Ecological pressures selected for largerbrains, slower rates of maturation, lower levels of sex hormone, and all the otherlife-history characteristics. From this perspective, the data from both humangenetics and human evolution mesh with the race–behavior matrix (��). Ge-netic–evolutionary theory acknowledges factors such as East Asian familystrength or African poverty, but as effects rather than causes. The consistency ofthe pattern of traits in Table 3 also supports the argument, as do genetic analyses,against the view that race is only a social construction based on a few salient traitssuch as skin color (Crow, 2002; Risch et al., 2002). Our score for Section 11:hereditarian model (��); culture-only model (–).
Culture-Only Hypotheses Fail to Account for Mean Race–IQDifferences (Section 12)
This section reviewed a number of well-known culture-only hypotheses forthe mean Black–White group difference in IQ. The most widely accepted is thatthey are due to differences in SES. Adjusting for SES, however, only reduces themean Black–White IQ difference by about one third. Other culture-only hypoth-eses, such as the effects of segregation, bias in tests, or the consequences of beinga minority in a White society are not supported by our review of the evidence. TheHead Start program in the United States has produced some modest gains inincreasing school retention and graduation rates among White groups, though notamong Black groups (Currie & Thomas, 1995). Neither the narrowing of the
277RACE DIFFERENCES IN COGNITIVE ABILITY

Black–White social conditions nor the Flynn effect (i.e., the secular rise in IQ) hasnarrowed the Black–White IQ gap. However, the Flynn effect, based on increasesin nutrition, health care, and intellectual stimulation, does appear to support theculture-only model (�), but it is neutral (hence 0) for the hereditarian modelbecause large environmental effects (up to 50% of the variance) are compatiblewith large genetic effects (also up to 50% of the variance). The finding in Table4 that the secular increase did not cluster with g and its biological correlates,however, may support the hereditarian model. Because the real area of conflict isthe cause of the mean racial group difference in cognitive ability, the hereditarianhypothesis is not disproven by the Flynn effect, whatever its cause(s). Overall, onSection 12, we gave the hereditarian model a score of (0) and the culture-onlymodel (0).
Section 14: Progressive Research Leads to Provisional Truth
Our conclusion, that the Black–White IQ difference is partly heritable, ac-cords with previous analytic reviews of this literature. Loehlin et al. (1975)concluded that Black–White IQ differences “probably” reflected “genetic differ-ences among the groups” (p. 238). P. E. Vernon (1979) tabulated 30 main topics,each scored on a 4-point scale, and concluded that “although the total number ofitems favoring genetic influences (G and G?) is roughly balanced by the numberof environmental points (E and E?), more of the highly convincing items are Grather than E” (p. 319). The survey of over 1,000 experts in behavioral geneticsand psychometrics by Snyderman and Rothman (1987) also found that a pluralitybelieved the Black–White IQ difference “to be a product of both genetic andenvironmental variation” (p. 141). However, there are also notable statements tothe contrary. The APA Task Force on intelligence, for example, concluded“[t]here is certainly no support for a genetic interpretation” (Neisser et al., 1996,p. 97). Likewise, Nisbett (1998) reached the conclusion that “the most relevantstudies provide no evidence for the genetic superiority of either race” (p. 101).
In our opinion, the present review, similar to those of Loehlin et al. (1975) andVernon (1979) earlier, should be given greater weight because they surveyed agreater range of evidence. Examining all the documentation allows a greaterchance of finding accurate explanations than does selecting a few items from thewhole. The 10 categories of predictions reviewed in Table 5 were derived fromthe “hard core” assumptions of the two competing research programs, each ofwhich tries to explain the Black–White IQ difference (see Section 2). Based onLakatos’s (1970, 1978) criteria for evaluating research programs, and a philoso-phy of science methodology that evaluates rival theories by generating multiplestrong inferences and assessing the preponderance and the consilience of manylines of evidence, we believe the hereditarian theory has satisfied the criteria fora “progressive” research program, whereas the culture-only program has not. Bothhave drawn implications to make numerous, testable, novel predictions, but wefound the hereditarian predictions were mostly confirmed, whereas those fromculture-only theory mostly were not.
Some attempts to salvage the culture-only theory have been problematic.Suggestions that “White flight” undermined desegregation and busing programsso that “true” integration has not yet been properly tried, that Head Start programs
278 RUSHTON AND JENSEN

still have not been fully funded, that culture-fair tests were not really fair, that thesensory deprivation and race-of-examiner hypotheses were of only minor signif-icance, or that being Black in America is really a matter of caste, not class or race,fall short of being strong inference. Urbach (1974b, p. 237) dismissed suchclaims, and that the mean Black–White IQ difference is a system problem, andthat caste and class differences are complex, subtle, and attitudinal rather thangrossly econometric, as “pseudo-scientific maneuvers,” noting that “it is intellec-tually improper to obscure facts by continually retreating behind the trivial truththat the world is complex [italics added]”.
We believe the burden of proof must shift to those who argue for a 100%culture-only position. For example, they need to address why, if importantminority-specific developmental processes such as stereotype threat (Steele, 1997)and racial stigma (Loury, 2002) exert such a powerful influence on schoolachievement, the correlation matrices representing developmental processes canbe so similar across ethnic and racial groups (Section 5). They need to explainwhy, if gene–environment interactions are as widespread and difficult to disen-tangle as often claimed (e.g., Block, 1995), identical twins reared apart grow to beso similar (Bouchard, 1996; Bouchard & Loehlin, 2001). Some culture-onlyhypotheses are too ambiguous to be tested.
A conundrum for theorists of all persuasions, however, is that there is too littleevidence of any environmental effects. The hereditarian model of Black–White IQdifferences proposed in Section 2 (50% genetic and 50% environmental), far fromprecluding environmental factors, requires they be found. Although evidence inSections 3 to 11 provided strong support for the genetic component of the model,evidence from Section 12 was unable to identify the environmental component.On the basis of the present evidence, perhaps the genetic component must begiven greater weight and the environmental component correspondingly re-duced. In fact, Jensen’s (1998b, p. 443) latest statement of the hereditarian model,termed the default hypothesis, is that genetic and cultural factors carry the exactsame weight in causing the mean Black–White difference in IQ as they do incausing individual differences in IQ, about 80% genetic–20% environmental byadulthood.
One current challenge, therefore, is to identify significant sources of nonge-netic variance. It is hoped that the recent models of gene–culture correlation putforward by Dickens and Flynn (2001, 2002) to explain the paradox of largeheritability estimates and large environmental effects mark a new trend in therace–IQ debate. Their models accept the empirical reality of both genetic andenvironmental influences. Within Whites, most of the nongenetic variance ap-pears to result from a small number of random adverse effects such as prenatalproblems, complications in the birth process, maternal health, and childhooddisease and trauma (Jensen, 1997).
Another challenge is to explain the pattern of covariant traits shown in Table3 and described in Section 10. Several life-history theorists working from anevolutionary perspective have postulated that there is some latent dimension onwhich “unpredictable environments” and “scarcity of resources” can move indi-viduals up or down because traits need to be coherent and harmonized, rather thanhaving some go to one pole while others go to the other (see Rushton, 2000, pp.252–255, 271–273, for discussion). Most life-history explanations that have
279RACE DIFFERENCES IN COGNITIVE ABILITY
focused on behavioral rather than biological traits have typically avoided the racedifferences and have hypothesized postnatal events such as father absence, pa-rental divorce, and sexual and physical abuse as causes rather than effects (e.g.,Belsky, Steinberg, & Draper, 1991; Chisholm, 1999). However, the fact that brainsize differences show up at birth, as do those in gestation time and speed ofphysical maturation, implies some prenatal and biological mediation.
Writing from a life-history perspective, Mealey (1990) suggested that thewider pattern of racial-group differences described in Section 10 was “interestingand worth pursuing, but . . . may be environmentally contingent rather thangenetic” (p. 387). Nyborg (1994, pp. 146–149) hypothesized that an estradial-testosterone hormonal trade-off existed, with Blacks averaging the most testos-terone, East Asians the least, and Whites in between. Eysenck (1991) proposed anutritional deficiency hypothesis. Lynn (1990; Lynn & Vanhanen, 2002) alsoproposed a crucial role for nutrition, finding that the heavier twin at birth typicallyhas a larger head and brain size, as well as a higher IQ in adolescence, and thatinfants fed breast milk typically average higher IQs (8.3 points) at age 8 than thosefed formulas. Masters (1997, p. 142) put forward a “neurotoxity hypothesis,” inwhich race differences in pre- and postnatal exposure to metal pollutants interactwith stress, poor diet, alcohol, and drugs. He pointed out that breast-feedingreduces the infants’ exposure to metal pollutants while providing infants the longchains of proteins necessary for brain development. Mothers from low socioeco-nomic groups typically do not breast-feed their infants, and Black mothers areonly one third as likely to breast-feed their infants as White mothers (see alsoJensen, 1998b, pp. 506–508).
Section 15: Implications for Public Policy
It is a widely accepted fact of behavioral science that there is great variabilitywithin each racial group and there is an ethical consensus that we treat people asindividuals. Although no specific policies necessarily follow from knowing aboutthe causes of group differences, they may serve as guides to action on someissues. The conclusion reached in Sections 13 and 14—that about 50% of thevariance in mean Black–White group differences in IQ is due to heredity—iscompatible with a wide range of recommendations, from programs for thedisadvantaged and laissez-faire approaches to selection and opportunity groupingin certain educational and vocational situations.
In The Bell Curve, Herrnstein and Murray (1994) offered some specific policyrecommendations based on their conclusions about genetic variation and IQ,which are generally concordant with political conservatism, such as scaling backaffirmative action, reducing the intrusiveness of government, and returning toindividualism. Most political conservatives, however, support these recommen-dations, no matter how the nature–nurture question is “resolved,” an argumentwith which Murray agreed (Miele, 1995). Arthur Jensen, also writing from thehereditarian perspective, recently opined that giving primacy to individual rightsmaximizes fairness, which he pragmatically defined as the ability of each indi-vidual to reach his or her full potential (Miele, 2002). He therefore argued for arestructuring of the educational system by tailoring methods to fit the individual,
280 RUSHTON AND JENSEN

and letting the group outcomes become what they may, rather than allowingclaims of differential performance to justify group rights over individual rights.
A multifaceted approach to the policy implications of the hereditarian con-clusion about mean Black–White differences is required. Many policy preferencesare not at all affected by our scientific conclusion. Granting equal rights under thelaw and whether to provide social welfare, for example, are based more on moraland political philosophy than on research findings. Still other policy issues (e.g.,affirmative action, the value of diversity) might merit reconsideration based on thedegree to which heredity as opposed to culture turns out to be the causal agent.Finally, certain policies do follow from our conclusions, such as the need forgreater equality and neutrality in the treatment of the culture-only and genetichypothesis within both the scientific and policy arenas, and in researching andameliorating the biological basis of group differences in IQ, health, and so on.
Two fundamentally different, policy-organizing models typically used toexplain why racial groups differ in average rate of socially valued outcomesshould be examined, specifically, with reference to the issues of race relations,educational and psychological testing, health, and conflicting worldviews aboutthe nature of human nature.
Discrimination or Distribution?
Herrnstein (1990) termed the two fundamentally different models put forth toexplain why racial groups differ in their average rate of socially valued outcomesthe distributional model and the discrimination model. Each may be partiallycorrect. The discrimination model focuses on social and institutional practices thatdiscriminate against members of one group (or favor members of another), thustilting the playing field. It assumes that in the absence of discrimination, outcomesshould be about equal for all populations; thus evidence of differential perfor-mance in itself constitutes evidence of discrimination. Factors hypothesized underthis model that cause mean race differences include relative poverty, anti-Blackbias, a lack of access to legitimate channels of upward mobility, and dysfunctionalfamily organization growing out of the legacy of slavery (see Sections 12 and 13).
The discrimination model has also been used to explain the overrepresenta-tion of some groups in valued outcomes. Blacks are said to excel in sports suchas boxing, basketball, track and field, and football because other channels ofupward mobility are closed to them (Hoberman, 1997). As early as the 1920s,sociologists explained the underrepresentation of East Asians in U.S. crimestatistics as being due to the East Asian “ghetto.” This self-imposed segregationwas seen as a response to external prejudice, which protected its members fromthe disruptive tendencies of the outside society.
The distributional model, on the other hand, explains the overlapping of theracial groups and their differing averages in terms of their mean group charac-teristics—for example, the mean differences in heritable IQ and possibly othertraits too. However, it could also fit Sowell’s (1994) theory of socializationthrough subtle cultural traditions, or Loury’s (2002) theory of racial stigma, whichpostulates a unique type of gene–culture correlation in which people react toothers on the basis of physical appearance. Other factors hypothesized to underliea distributional model include deep-rooted cultural values and family structures
281RACE DIFFERENCES IN COGNITIVE ABILITY

endemic to certain populations, as well as biological variables such as body type,hormonal levels, and personality and temperament. Thus according to the distri-butional model, population differences are expected to occur and to do soglobally.
The research supporting the role of heredity in human behavior implies thatthe distributional model is more correct than the discrimination model. It explainssome of the mean Black–White group difference in IQ-related outcomes in termsof the differential distribution of the genes for general mental ability. For exam-ple, IQ is a significant predictor of such socially disadvantageous outcomes asdropping out of high school, being unemployed, being divorced within 5 years ofmarriage, having an illegitimate child, living in poverty, being on welfare, andincarceration. In today’s technological society, everyday life itself is a type of IQtest (see R. A. Gordon, 1997; Gottfredson, 1997; Herrnstein & Murray, 1994). Onall of the above measures, the group means favor Whites over Blacks. Of course,this does not deny that many other attributes are also important for success in life.
Race Relations
Some have suggested that we cannot expect members of ethnic groups tosimply accept the genetic component in the mean-group differences in IQ andother traits. Yet, with regard to individuals within families, we do acknowledgethat some siblings are more intelligent, more athletic, more physically attractive,or more socially charming than others. We also accept that some families aregenetically more gifted in certain areas than other families. We should, therefore,by extension, be able to generalize to all the members of the human family. Ifviewed against the backdrop that group differences are simply aggregated indi-vidual differences, the former may be easier to accept than has hitherto beenthought.
Although the hereditarian model may not specify particular policies, it doesargue against the feasibility of some programs based on the discrimination model.One very socially significant example is that a demonstration of differential racialperformance (good or bad) could not, by itself, be offered as proof of racialdiscrimination because, as the evidence reviewed in this article demonstrated,genetic factors play a role in producing these differences. Rather, the burdenwould be on the plaintiffs to prove that the defendants had discriminated on thebasis of race and not educational or vocational performance associated with race.
However, the view that one segment of the population is largely to blame forthe problems of another segment can be even more harmful to racial harmony, byfirst producing demands for compensation and thereby inviting a backlash. Equat-ing group disparities in success with racism on the part of the more successfulgroup guarantees mutual resentment. As overt discrimination fades, still largeracial disparities in success lead Blacks to conclude that White racism is not onlypervasive but also insidious because it is so unobservable and “unconscious.”Whites resent that nonfalsifiable accusation and the demands to compensateBlacks for harm they do not believe they caused. Misplaced blame can alsoendanger institutions. Objective standards of merit that yield racially unevenoutcomes when evenly applied, whether in college admissions, hiring, or day-to-day operations of the legal system, have increasingly come under attack—for
282 RUSHTON AND JENSEN

example, by critical legal theorists as inherently pro-White and hence illegitimate.Although the distributional model does not rule out affirmative action or com-pensation-type initiatives, it does reduce the impact of arguments in their favorbased on an exclusive adherence to the discrimination model (Gottfredson, 2000;Levin, 1997).
Educational, Vocational, and Psychological Testing
Because the means for Blacks and Hispanics are lower on tests of academicand vocational achievement, such as the SAT, the General Aptitude Test Battery,and the ASVAB, than those for Whites and East Asians, some have claimed thetests are racially biased. Yet the evidence reviewed and the distributional modelpredict that such differences will occur worldwide (see Section 3). This issupported by the fact that these tests have about equal predictive validity for allgroups who speak the same language and have been schooled in the culture of thetest.
Ethnic disparities in cognitive performance are not just “an American di-lemma” (Myrdal, 1944) but are found around the world. In India, members of thehigher castes obtain higher mean scores and examination marks than do those ofthe lower castes. In Malaysia, members of the Chinese and East Indian racialminorities have higher mean scores than does the majority Malay population. InSouth Africa, members of the White, East Indian, and Colored population groupsobtain higher mean scores than does the indigenous Black African majority(Klitgaard, 1986; Lynn & Vanhanen, 2002; Nell, 2000). These facts present achallenge for policymakers attempting to design educational, vocational, andmilitary systems.
The apparent failure of equal opportunity programs to enable all groups insociety to perform equally scholastically or even to narrow the gap in the testscores used in selection for higher education, jobs, and the Armed Forces hascaused some to disparage psychological testing. Jensen (2000) proposed empha-sizing face validity in test construction by making item content more obviouslyrelevant to the purpose of selection and thereby improve the public’s perceptionof the utility of tests. An example would be having all the items in a test used toselect police personnel involve a typical crime scenario rather than abstractanalogies (though a correct solution would still require logical reasoning).
More generally, there is a need to educate the public about the true nature ofindividual and group differences, genetics, and evolutionary biology. Ultimately,the public must accept the pragmatic reality that some groups will be overrepre-sented and other groups underrepresented in various socially valued outcomes.Organizations such as the APA could play a critical role in changing the zeitgeist.To do so will not be easy, for it requires overcoming deeply ingrained biases thatoperate at several levels of the APA (Redding, 2001). The standard models ofsocial science from the 1930s to the present have assumed a tabula rasa perspec-tive that precludes any analysis of hereditary group differences.
The expectation of average group differences includes the statistical certaintythat it does not apply to all individuals, a point that can easily be overlooked.Thus, any part of a general program of education must include distributionalstatistics so that people also learn not to stereotype or overgeneralize. This may
283RACE DIFFERENCES IN COGNITIVE ABILITY
not be as difficult a task as might be supposed. Even kindergarten children arecapable of learning that although boys are typically taller than girls, many girls aretaller than the average boy.
Health, Medical Genetics, and Pharmaco-Anthropology
The distributional model also relates to questions raised about bias in thehealth system based on ethnic differences in rates of certain diseases (Risch et al.,2002). From an epidemiological perspective, failure to take ethnicity into accountcan confound a study, particularly if the disease in question is more common inone ethnic group than another. The incidence of hypertension, prostate cancer, andother diseases is higher in Blacks than Whites. To cite a specific example, theinfant mortality rate of American Blacks is twice that of American Whites, andthis difference remains significant after controlling for SES in each race.
Despite overlap, drug and food effects often differ sufficiently to test for themindependently. One well-known example of the harm done by ignoring groupdifferences involves lactose intolerance. The ability of adults to digest milk easilyis largely limited to Caucasoids, and a lack of this knowledge may have increasedmortality among the needy in Third World countries that were inadvertentlyprovided with milk products to alleviate hunger.
Some physicians are becomingly increasingly concerned that assumingBlacks are identical to Whites neglects the problems faced by Blacks. Forexample, 30% of the people who have kidney failure and undergo dialysis areBlack, but estimates are that fewer than 10% of organ donors are Black. There isalso evidence that Blacks fare better when given organs donated by other Blacks.Another example is that it now appears that genetics may underlie the increasedrates and levels of hypertension in Blacks. Black males tend to have higher bloodpressure and increased rates of cardiovascular disease, including strokes, thanWhite males, but the cause is widely debated. Some evidence suggests that Blackmales experience a faster heart rate when performing moderate exercise, althoughthe pulse rates of the Black and White males when resting show no significantdifference. Blacks have a higher incidence of prostate cancer than Whites, who inturn have a higher rate than East Asians, for which the underlying cause may bethe mean group differences in testosterone level (Polednak, 1989; Risch et al.,2002).
Conflicting Worldviews
A prevailing worldview throughout history has been that economic, cultural,and other environmental forces are the preeminent causes of group and individualbehavior. Modern social science has typically taken this perspective and promotedthe idea that all babies are born more or less equally endowed in intelligence andlearning ability. It followed therefore that inequalities were the result of social,economic, and political forces. This worldview generated many strategies forintervention in the home, the workplace, the mass media, the criminal justicesystem, and even the entire social–economic system. Some have been effectiveand are almost universally accepted, whereas others have failed and producedonly shattered expectations, resentment, and interethnic hostility.
The major policy implication of the research reviewed here is that adopting an
284 RUSHTON AND JENSEN

evolutionary–genetic outlook does not undermine our dedication to democraticideals. As E. O. Wilson (1978) aptly noted: “We are not compelled to believe inbiological uniformity in order to affirm freedom and dignity” (p. 52). He went onto quote the sociologist Bressler (1968): “An ideology that tacitly appeals tobiological equality as a condition for human emancipation corrupts the idea offreedom. Moreover, it encourages decent men to tremble at the prospect of‘inconvenient’ findings that may emerge in future scientific research” (E. O.Wilson, 1978, p. 52). Denial of any genetic component in human variation,including between groups, is not only poor science, it is likely to be injurious bothto unique individuals and to the complex structure of societies.
References
Bartley, A. L., Jones, D. W., & Weinberger, D. R. (1997). Genetic variability of humanbrain size and cortical gyral patterns. Brain, 120, 257–269.
Bayley, N. (1965). Comparisons of mental and motor test scores for ages 1–15 months bysex, birth order, race, and geographic location, and education of parents. ChildDevelopment, 36, 379–411.
Beals, K. L., Smith, C. L., & Dodd, S. M. (1984). Brain size, cranial morphology, climate,and time machines. Current Anthropology, 25, 301–330.
Bean, R. B. (1906). Some racial peculiarities of the Negro brain. American Journal ofAnatomy, 5, 353–432.
Belsky, J., Steinberg, L., & Draper, P. (1991). Childhood experience, interpersonaldevelopment, and reproductive strategy: An evolutionary theory of socialization.Child Development, 62, 647–670.
Berry, J. W. (1966). Temne and Eskimo perceptual skills. International Journal ofPsychology, 1, 207–222.
Block, N. (1995). How heritability misleads about race. Cognition, 56, 99–128.Bouchard, T. J., Jr. (1996). Behavior genetic studies of intelligence, yesterday and today:
The long journey from plausibility to proof (The Galton Lecture). Journal of Bioso-cial Science, 28, 527–555.
Bouchard, T. J., Jr., & Loehlin, J. C. (2001). Genes, evolution, and personality. BehaviorGenetics, 31, 243–273.
Brazelton, T. B., & Freedman, D. G. (1971). The Cambridge neonatal scales. In G. B. A.Stoelinga & J. J. van der Werff ten Bosch (Eds.), Normal and abnormal development ofbrain and behavior (pp. 104–132). Leiden, the Netherlands: Leiden University Press.
Breslau, N., Chilcoat, H. D., Susser, E. S. Matte, T., Liang, K.-Y., & Peterson, E. L.(2001). Stability and change in children’s intelligence quotient scores: A comparisonof two socioeconomically disparate communities. American Journal of Epidemiology,154, 711–717.
Bressler, M. (1968). Sociobiology, biology and ideology. In D. Glass (Ed.), Genetics (pp.178–210). New York: Rockefeller University Press.
Broca, P. (1873). Sur les cranes de la caverne de l’Homme Mort (Loere) [Cranial size inthe deceased]. Revue d’Anthropologie, 2, 1–53.
Broman, S. H., Nichols, P. L., & Kennedy, W. (1975). Preschool IQ: Prenatal and earlydevelopmental correlates. Hillsdale, NJ: Erlbaum.
Broman, S. H., Nichols, P. L., Shaughnessy, P., & Kennedy, W. (1987). Retardation inyoung children. Hillsdale, NJ: Erlbaum.
Brown v. Board of Education of Topeka, 347 U.S. 483 (1954).Bulmer, M. G. (1970). The biology of twinning in man. Oxford, England: Clarendon Press.Carretta, T. R., & Ree, M. J. (1995). Near identity of cognitive structure in sex and ethnic
groups. Personality and Individual Differences, 19, 149–155.
285RACE DIFFERENCES IN COGNITIVE ABILITY

Cavalli-Sforza, L. L. (2000). Genes, peoples, and languages. Berkeley: University ofCalifornia Press.
Cavalli-Sforza, L. L., Menozzi, P., & Piazza, A. (1994). The history and geography ofhuman genes. Princeton, NJ: Princeton University Press.
Chakraborty, R., Kamboh, M. I., Nwankwo, M., & Ferrell, R. E. (1992). Caucasian genesin American Blacks. American Journal of Human Genetics, 50, 145–155.
Chan, J., & Lynn, R. (1989). The intelligence of six-year-olds in Hong Kong. Journal ofBiosocial Science, 21, 461–464.
Chisholm, J. S. (1999). Death, hope, and sex: Steps to an evolutionary ecology of mindand morality. Cambridge, England: Cambridge University Press.
Clark, E. A., & Hanisee, J. (1982). Intellectual and adaptive performance of Asianchildren in adoptive American settings. Developmental Psychology, 18, 595–599.
Cohn, S. J., Cohn, C. M. G., & Jensen, A. R. (1988). Myopia and intelligence: Apleiotropic relationship? Human Genetics, 80, 53–58.
Coleman, J. S. (1990–1991). The Sidney Hook Memorial Award Address: On theself-suppression of academic freedom. Academic Questions, 4, 17–22.
Coleman, J. S., Campbell, E. Q., Hobson, C. J., McPartland J., Mood, A. M., Weinfeld,F. D., & York, R. L. (1966). Equality of educational opportunity. Washington, DC:U.S. Department of Health, Education, and Welfare.
Cooley, C. H. (1897). Genius, fame, and the comparison of races. Annals of the AmericanAcademy of Political and Social Science, 9, 317–358.
Cronbach, L. J. (1957). The two disciplines of scientific psychology. American Psychol-ogist, 12, 671–684.
Crow, J. F. (2002, Winter). Unequal by nature: A geneticist’s perspective on humandifferences. Daedalus, 131(1), 81–88.
Currie, J., & Thomas, D. (1995). Does Head Start make a difference? American EconomicReview, 85, 341–364.
Darwin, C. (1859). The origin of species. London: Murray.Darwin, C. (1871). The descent of man. London: Murray.Davenport, R. K. (1946). Implications of military selection and classification in relation to
universal military training. Journal of Negro Education, 15, 585–594.Deary, I. J. (2000). Looking down on human intelligence: From psychometrics to the
brain. Oxford, England: Oxford University Press.Degler, C. N. (1991). In search of human nature. New York: Oxford University Press.Devlin, B., Feinberg, S. E., Resnick, D. P., & Roeder, K. (1997). (Eds.). Intelligence,
genes, and success: Scientists respond to The Bell Curve. New York: Springer-Verlag.
Dickens, W. T., & Flynn, J. R (2001). Heritability estimates versus large environmentaleffects: The IQ paradox resolved. Psychological Review, 108, 346–369.
Dickens, W. T., & Flynn, J. R. (2002). The IQ paradox is still resolved: Reply to Loehlin(2002) and Rowe and Rodgers (2002). Psychological Review, 109, 764–771.
Dolan, C. V. (1997). A note on Schonemann’s refutation of Spearman’s hypothesis.Multivariate Behavioral Research, 32, 319–325.
Dolan, C. V. (2000). Investigating Spearman’s hypothesis by means of multi-groupconfirmatory factor analysis. Multivariate Behavioral Research, 35, 21–50.
Dolan, C. V., & Hamaker, E. L. (2001). Investigating Black–White differences inpsychometric IQ: Multi-group confirmatory factor analyses of WISC–R and K–ABCand a critique of the method of correlated vectors. In F. Columbus (Ed.), Advances inpsychology research (Vol. 6, pp. 30–59). Huntington, NY: Nova Science.
Eveleth, P. B., & Tanner, J. M. (1990). Worldwide variation in human growth (2nd ed.).Cambridge, England: Cambridge University Press.
Eyferth, K. (1961). Leistungen verscheidener Gruppen von Besatzungskindern in Ham-
286 RUSHTON AND JENSEN

burg-Wechsler Intelligenztest fur Kinder (HAWIK) [Achievement of children on theHamburg-Wechsler Intelligence Scale for Children]. Archiv fur die gesamte Psy-chologie, 113, 222–241.
Eyferth, K., Brandt, U., & Hawel, W. (1960). Farbige kinder in Deutschland [Coloredchildren in Germany]. Munich: Juventa Verlag.
Eysenck, H. J. (1971). The IQ argument. New York: Library Press.Eysenck, H. J. (1984). The effect of race on human abilities and mental test scores. In
C. R. Reynolds & R. T. Brown (Eds.), Perspectives on bias in mental testing (pp.249–291). New York: Plenum.
Eysenck, H. J. (1991). Race and intelligence: An alternative hypothesis. Mankind Quar-terly, 32, 133–136.
Fahrmeier, E. D. (1975). The effect of school attendance on intellectual development innorthern Nigeria. Child Development, 46, 281–285.
Feuerstein, R. (1980). The dynamic assessment of retarded performers. Glenview, IL:Scott, Foresman.
Fisch, R. O., Bilek, M. K., Deinard, A. S., & Chang, P. N. (1976). Growth, behavioral, andpsychologic measurements of adopted children: The influences of genetic and socio-economic factors in a prospective study. Behavioral Pediatrics, 89, 494–500.
Fisher, R. A. (1918). The correlation between relatives on the supposition of Mendelianinheritance. Transactions of the Royal Society of Edinburgh, 52, 399–433.
Flynn, J. R. (1980). Race, IQ and Jensen. London: Routledge & Kegan Paul.Flynn, J. R. (1984). The mean IQ of Americans: Massive gains 1932 to 1978. Psycho-
logical Bulletin, 95, 29–51.Flynn, J. R. (1987). Massive IQ gains in 14 nations: What IQ tests really measure.
Psychological Bulletin, 101, 171–191.Flynn, J. R. (1999). Searching for justice: The discovery of IQ gains over time. American
Psychologist, 54, 5–20.Frydman, M., & Lynn, R. (1989). The intelligence of Korean children adopted in Belgium.
Personality and Individual Differences, 10, 1323–1326.Galton, F. (1869). Hereditary genius. London: Macmillan.Galton, F. (1883). Inquiries into human faculty and its development. London: Macmillan.Gignac, G. E., Vernon, P. A., & Wickett, J. C. (2003). Factors influencing the relationship
between brain size and intelligence. In H. Nyborg (Ed.), The scientific study ofgeneral intelligence: Tribute to Arthur R. Jensen (pp. 93–106). London: Elsevier.
Glewwe, P., & Jacoby, H. (1992). Estimating the determinants of cognitive achievementin low-income countries. Washington, DC: World Bank.
Gordon, H. L. (1934). Amentia in the East African. Eugenics Review, 25, 223–235.Gordon, R. A. (1997). Everyday life as an intelligence test: Effects of intelligence and
intelligence context. Intelligence, 24, 203–320.Gottfredson, L. S. (1997). Why g matters: The complexity of everyday life. Intelligence,
24, 79–132.Gottfredson, L. S. (2000). Pretending that intelligence doesn’t matter. Cerebrum, 2,
75–96.Gould, S. J. (1996). The mismeasure of man (2nd ed.). New York: Norton.Grieve, K. W., & Viljoen, S. (2000). An exploratory study of the use of the Austin Maze
in South Africa. South African Journal of Psychology, 30, 14–18.Haier, R. J., Chueh, D., Touchette, P., Lott, I., Buchsbaum, M., Macmillan, D., et al.
(1995). Brain size and cerebral glucose metabolic rate in nonspecific mental retar-dation and Down syndrome. Intelligence, 20, 191–210.
Harvey, I., Persaud, R., Ron, M. A., Baker, G., & Murray, R. M. (1994). Volumetric MRImeasurements in bipolars compared with schizophrenics and healthy controls. Psy-chological Medicine, 24, 689–699.
287RACE DIFFERENCES IN COGNITIVE ABILITY

Herrnstein, R. J. (1990). Still an American dilemma. Public Interest, 98, 3–17.Herrnstein, R. J., & Murray, C. (1994). The bell curve. New York: Free Press.Hills, J. R., & Stanley, J. C. (1970). Easier test improves prediction of Black students’
college grades. Journal of Negro Education, 39, 320–324.Ho, K. C., Roessmann, U., Straumfjord, J. V., & Monroe, G. (1980). Analysis of brain
weight: I and II. Archives of Pathology and Laboratory Medicine, 104, 635–645.Hoberman, J. M. (1997). Darwin’s athletes: How sport has damaged Black America and
preserved the myth of race. New York: Houghton Mifflin.Howells, W. W. (1993). Getting here: The story of human evolution. Washington, DC:
Compass Press.Jencks, C., & Phillips, M. (Eds.). (1998). The Black–White test score gap. Washington,
DC: Brookings Institution Press.Jensen, A. R. (1969). How much can we boost IQ and scholastic achievement? Harvard
Educational Review, 39, 1–123.Jensen, A. R. (1973). Educability and group differences. London: Methuen.Jensen, A. R. (1974). Cumulative deficit: A testable hypothesis? Developmental Psychol-
ogy, 10, 996–1019.Jensen, A. R. (1977). Cumulative deficit in IQ of Blacks in the rural South. Developmental
Psychology, 13, 184–191.Jensen, A. R. (1980). Bias in mental testing. New York: Free Press.Jensen, A. R. (1992). Spearman’s hypothesis: Methodology and evidence. Multivariate
Behavioral Research, 27, 225–234.Jensen, A. R. (1993). Spearman’s hypothesis tested with chronometric information pro-
cessing tasks. Intelligence, 17, 47–77.Jensen, A. R. (1994). Psychometric g related to differences in head size. Personality and
Individual Differences, 17, 597–606.Jensen, A. R. (1997). The puzzle of nongenetic variance. In R. J. Sternberg & E. L.
Grigorenko (Eds.), Intelligence, heredity, and environment (pp. 42–88). Cambridge,England: Cambridge University Press.
Jensen, A. R. (1998a). Adoption data and two g-related hypotheses. Intelligence, 25, 1–6.Jensen, A. R. (1998b). The g factor. Westport, CT: Praeger.Jensen, A. R. (2000). Testing: The dilemma of group differences. Psychology, Public
Policy, and Law, 6, 121–127.Jensen, A. R., & Johnson, F. W. (1994). Race and sex differences in head size and IQ.
Intelligence, 18, 309–333.Jensen, A. R., & Reynolds, C. R. (1982). Race, social class and ability patterns on the
WISC–R. Personality and Individual Differences, 3, 423–438.Jensen, A. R., & Whang, P. A. (1994). Speed of accessing arithmetic facts in long-term
memory: A comparison of Chinese-American and Anglo-American children. Con-temporary Educational Psychology, 19, 1–12.
Kamin, L. (1974). The science and politics of IQ. Hillsdale, NJ: Erlbaum.Kendall, I. M., Verster, M. A., & von Mollendorf, J. W. (1988). Test performance of
Blacks in Southern Africa. In S. H. Irvine & J. W. Berry (Eds.), Human abilities incultural context (pp. 299–339). Cambridge, England: Cambridge University Press.
Klitgaard, R. (1986). Elitism and meritocracy in developing countries: Selection policiesfor higher education. Baltimore: Johns Hopkins University Press.
Lakatos, I. (1970). Falsification and the methodology of scientific research programmes.In I. Lakatos & A. Musgrave (Eds.), Criticism and the growth of knowledge (pp.91–195). Cambridge, England: Cambridge University Press.
Lakatos, I. (1978). The methodology of scientific research programs. Cambridge, En-gland: Cambridge University Press.
288 RUSHTON AND JENSEN

Levin, M. (1994). Comment on Minnesota Transracial Adoption Study. Intelligence, 19,13–20.
Levin, M. (1997). Why race matters. Westport, CT: Praeger.Lewontin, R. C., Rose, S., & Kamin, L. J. (1984). Not in our genes. New York: Pantheon.Loehlin, J. C. (2000). Group differences in intelligence. In R. J. Sternberg (Ed.), Hand-
book of intelligence (pp. 176–193). Cambridge, England: Cambridge UniversityPress.
Loehlin, J. C. (2002). The IQ paradox: Resolved? Still an open question. PsychologicalReview, 109, 754–758.
Loehlin, J. C., Lindzey, G., & Spuhler, J. N. (1975). Race differences in intelligence. SanFrancisco: Freeman.
Loehlin, J. C., Vandenberg, S. G., & Osborne, R. T. (1973). Blood group genes andNegro–White differences. Behavioral Genetics, 3, 263–270.
Loury, G. C. (2002). The anatomy of racial inequality. Cambridge, MA: Harvard Uni-versity Press.
Lynn, R. (1977). The intelligence of the Japanese. Bulletin of the British PsychologicalSociety, 30, 69–72.
Lynn, R. (1978). Ethnic and racial differences in intelligence: International comparisons.In R. T. Osborne, C. E. Noble, & N. Weyl (Eds.), Human variation: The biopsy-chology of age, race, and sex (pp. 261–286). New York: Academic Press.
Lynn, R. (1982, May 20). IQ in Japan and the United States shows a growing disparity.Nature, 297, 222–223.
Lynn, R. (1990). The role of nutrition in secular increase in intelligence. Personality andIndividual Differences, 11, 273–285.
Lynn, R. (1991). Race differences in intelligence: A global perspective. Mankind Quar-terly, 31, 255–296.
Lynn, R. (1994). Some reinterpretations of the Minnesota Transracial Adoption Study.Intelligence, 19, 21–27.
Lynn, R. (1996). Racial and ethnic differences in intelligence in the United States on theDifferential Ability Scale. Personality and Individual Differences, 20, 271–273.
Lynn, R. (2002). Skin color and intelligence in African Americans. Population andEnvironment, 23, 365–375.
Lynn, R., & Hattori, K. (1990). The heritability of intelligence in Japan. BehaviorGenetics, 20, 545–546.
Lynn, R., & Holmshaw, M. (1990). Black–White differences in reaction times andintelligence. Social Behavior and Personality, 18, 299–308.
Lynn, R., & Owen, K. (1994). Spearman’s hypothesis and test score differences betweenWhites, Indians, and Blacks in South Africa. Journal of General Psychology, 121,27–36.
Lynn, R., & Vanhanen, T. (2002). IQ and the wealth of nations. Westport, CT: Praeger.MacArthur, R. S. (1968). Some differential abilities of northern Canadian native youth.
International Journal of Psychology, 3, 43–51.Mall, F. P. (1909). On several anatomical characters of the human brain, said to vary
according to race and sex, with special reference to the weight of the frontal lobe.American Journal of Anatomy, 9, 1–32.
Masters, R. (1997). Brain biochemistry and social status: The neurotoxity hypothesis. InE. White (Ed.), Intelligence, political inequality, and public policy (pp. 141–183).Westport, CT: Praeger.
McGue, M., Bouchard, T. J., Jr., Iacono, W. G., & Lykken, D. T. (1993). Behavioralgenetics of cognitive ability: A life-span perspective. In R. Plomin & G. E. McClearn(Eds.), Nature, nurture, and psychology (pp. 59–76). Washington, DC: AmericanPsychological Association.
289RACE DIFFERENCES IN COGNITIVE ABILITY

Mealey, L. (1990). Differential use of reproductive strategies by human groups? Psycho-logical Science, 1, 385–387.
Miele, F. (1995). For whom the bell curve tolls: An interview with [the author of The BellCurve] Charles Murray, on IQ, race, class, Gould, Gardner, and the Clintons. Skeptic,3(2), 34–41.
Miele, F. (2002). Intelligence, race, and genetics: Conversations with Arthur R. Jensen.Boulder, CO: Westview Press.
Miller, E. M. (1994). Intelligence and brain myelination: A hypothesis. Personality andIndividual Differences, 17, 803–832.
Moore, E. G. J. (1986). Family socialization and the IQ test performance of traditionallyand transracially adopted Black children. Developmental Psychology, 22, 317–326.
Morton, S. G. (1849). Observations on the size of the brain in various races and familiesof man. Proceedings of the Academy of Natural Sciences, Philadelphia, 4, 221–224.
Myrdal, G. (1944). An American dilemma. New York: Harper & Row.Naglieri, J. A., & Jensen, A. R. (1987). Comparison of Black–White differences on the
WISC–R and K–ABC: Spearman’s hypothesis. Intelligence, 11, 21–43.Nagoshi, C. T., Johnson, R. C., DeFries, J. C., Wilson, J. R., & Vandenberg, S. G. (1984).
Group differences and first principal-component loadings in the Hawaii Family Studyof Cognition: A test of the generality of “Spearman’s hypothesis.” Personality andIndividual Differences, 5, 751–753.
Nei, M., & Roychoudhury, A. K. (1993). Evolutionary relationships of human populationson a global scale. Molecular Biology and Evolution, 10, 927–943.
Neisser, U. (1997). Never a dull moment. American Psychologist, 52, 79–81.Neisser, U., Boodoo, G., Bouchard, T. J., Jr., Boykin, A. W., Brody, N., Ceci, S. J., et al.
(1996). Intelligence: Knowns and unknowns. American Psychologist, 51, 77–101.Nell, V. (2000). Cross-cultural neuropsychological assessment: Theory and practice.
Mahwah, NJ: Erlbaum.Nisbett, R. E. (1998). Race, genetics, and IQ. In C. Jencks & M. Phillips (Eds.), The
Black–White test score gap (pp. 86–102). Washington, DC: Brookings Institute.Nott, J. C., & Glidden, G. R. (1854). Types of mankind. Philadelphia: Lippincott.Nyborg, H. (1994). Hormones, sex, and society: The science of physicology. Westport,
CT: Praeger.Nyborg, H., & Jensen, A. R. (2000). Black–White differences on various psychometric
tests: Spearman’s hypothesis tested on American Armed Services veterans. Person-ality and Individual Differences, 28, 593–599.
Ogbu, J. U. (2002). Cultural amplifiers of intelligence: IQ and minority status in cross-cultural perspective. In J. M. Fish (Ed.), Race and intelligence: Separating sciencefrom myth (pp. 241–278). Mahwah, NJ: Erlbaum.
Osborne, R. T. (1980). Twins: Black and White. Athens, GA: Foundation for HumanUnderstanding.
Osborne, R. T., & McGurk, F. C. J. (Eds.). (1982). The testing of Negro intelligence: Vol.2. Athens, GA: Foundation for Human Understanding.
Owen, K. (1992). The suitability of Raven’s Standard Progressive Matrices for variousgroups in South Africa. Personality and Individual Differences, 13, 149–159.
Papiernik, E., Cohen, H., Richard, A., de Oca, M. M., & Feingold, J. (1986). Ethnicdifferences in duration of pregnancy. Annals of Human Biology, 13, 259–265.
Parra, E. J., Marcini, A., Akey, J., Martinson, J., Batzer, M. A., Cooper, R., et al. (1998).Estimating African American admixture proportions by use of population specificalleles. American Journal of Human Genetics, 63, 1839–1851.
Pearl, R. (1934, May 11). The weight of the Negro brain. Science, 80, 431–434.Pennington, B. F., Filipek, P. A., Lefly, D., Chhabildas, N., Kennedy, D. N., Simon, J. H.,
290 RUSHTON AND JENSEN

et al. (2000). A twin MRI study of size variations in the human brain. Journal ofCognitive Neuroscience, 12, 223–232.
Peoples, C. E., Fagan, J. F., III, & Drotar, D. (1995). The influence of race on 3-year-oldchildren’s performance on the Stanford–Binet: Fourth edition. Intelligence, 21,69–82.
Platt, J. R. (1964, January 24). Strong inference. Science, 146, 347–353.Plomin, R., & Daniels, D. (1987). Why are children in the same family so different from
one another? Behavioral and Brain Sciences, 10, 1–60.Plomin, R., DeFries, J. C., & Loehlin, J. C. (1977). Genotype–environment interaction
and correlation in the analysis of human behavior. Psychological Bulletin, 84,309–322.
Plomin, R., DeFries, J. C., McClearn, G. E., & McGuffin, P. (2001). Behavioral genetics(4th ed.). New York: Freeman.
Polednak, A. P. (1989). Racial and ethnic differences in disease. Oxford, England: OxfordUniversity Press.
Post, R. H. (1982). Populational differences in visual acuity: A review, with speculativenotes on selection relaxation. Social Biology, 29, 319–343.
Posthuma, D., De Geus, E. J. C., Baare, W. F. C., Pol, H. E. H., Kahn, R. S., & Boomsma,D. I. (2002). The association between brain volume and intelligence is of geneticorigin. Nature Neuroscience, 5, 83–84.
Raven, J. (2000). The Raven’s Progressive Matrices: Change and stability over culture andtime. Cognitive Psychology, 41, 1–48.
Raven, J., Raven, J. C., & Court, J. H. (1998). Manual for Raven’s Standard ProgressiveMatrices (1998 ed.). Oxford, England: Oxford Psychologists Press.
Raven, J., Summers, B., Birchfield, M., Brosier, G., Burciaga, L., Byrkit, B., et al. (1990).Manual for Raven’s Progressive Matrices and Vocabulary Scales—Research supple-ment: No. 3. American and international norms (2nd ed.). Oxford, England: OxfordPsychologists Press.
Redding, R. E. (2001). Sociopolitical diversity in psychology: The case for pluralism.American Psychologist, 56, 205–215.
Ree, M. J., & Carretta, T. R. (1995). Group differences in aptitude factor structure on theASVAB. Educational and Psychological Measurement, 55, 268–277.
Risch, N., Burchard, E., Ziv, E., & Tang, H. (2002). Categorization of humans inbiomedical research: Genes, race, and disease. Genome Biology, 3(7), 1–12.
Roth, P. L., Bevier, C. A., Bobko, P., Switzer, F. S., III, & Tyler, P. (2001). Ethnic groupdifferences in cognitive ability in employment and educational settings: A meta-analysis. Personnel Psychology, 54, 297–330.
Rowe, D. C. (1994). No more than skin deep. American Psychologist, 49, 215–216.Rowe, D. C. (2002). IQ, birth weight, and number of sexual partners in White, African
American, and mixed race adolescents. Population and Environment, 23, 513–524.Rowe, D. C., & Cleveland, H. H. (1996). Academic achievement in Blacks and Whites:
Are the developmental processes similar? Intelligence, 23, 205–228.Rowe, D. C., & Rodgers, J. L. (2002). Expanding variance and the case of historical
changes in IQ means: A critique of Dickens and Flynn (2001). Psychological Review,109, 759–763.
Rowe, D. C., Vazsonyi, A. T., & Flannery, D. J. (1994). No more than skin deep: Ethnicand racial similarity in developmental process. Psychological Review, 101, 396–413.
Rowe, D. C., Vazsonyi, A. T., & Flannery, D. J. (1995). Ethnic and racial similarity indevelopmental process: A study of academic achievement. Psychological Science, 6,33–38.
Rushton, J. P. (1989). Japanese inbreeding depression scores: Predictors of cognitivedifferences between Blacks and Whites. Intelligence, 13, 43–51.
291RACE DIFFERENCES IN COGNITIVE ABILITY

Rushton, J. P. (1991). Mongoloid–Caucasoid differences in brain size from militarysamples. Intelligence, 15, 351–359.
Rushton, J. P. (1992). Cranial capacity related to sex, rank, and race in a stratified randomsample of 6,325 U.S. military personnel. Intelligence, 16, 401–413.
Rushton, J. P. (1993). Corrections to a paper on race and sex differences in brain size andintelligence. Personality and Individual Differences, 15, 229–231.
Rushton, J. P. (1994). Sex and race differences in cranial capacity from InternationalLabour Office data. Intelligence, 19, 281–294.
Rushton, J. P. (1997). Cranial size and IQ in Asian Americans from birth to age seven.Intelligence, 25, 7–20.
Rushton, J. P. (1999). Secular gains in IQ not related to the g factor and inbreedingdepression—unlike Black–White differences: A reply to Flynn. Personality andIndividual Differences, 26, 381–389.
Rushton, J. P. (2000). Race, evolution, and behavior: A life history perspective (3rd ed.).Port Huron, MI: Charles Darwin Research Institute.
Rushton, J. P. (2001). Black–White differences on the g factor in South Africa: A “Jenseneffect” on the Wechsler Intelligence Scale for Children—Revised. Personality andIndividual Differences, 31, 1227–1232.
Rushton, J. P. (2002). Jensen effects and African/Coloured/Indian/White differences onRaven’s Standard Progressive Matrices in South Africa. Personality and IndividualDifferences, 33, 1279–1284.
Rushton, J. P., & Ankney, C. D. (1996). Brain size and cognitive ability: Correlations withage, sex, social class, and race. Psychonomic Bulletin and Review, 3, 21–36.
Rushton, J. P., Brainerd, C. J., & Pressley, M. (1983). Behavioral development andconstruct validity: The principle of aggregation. Psychological Bulletin, 94, 18–38.
Rushton, J. P., & Jensen, A. R. (2003). African–White IQ differences from Zimbabwe onthe Wechsler Intelligence Scale for Children—Revised are mainly on the g factor.Personality and Individual Differences, 34, 177–183.
Rushton, J. P., & Osborne, R. T. (1995). Genetic and environmental contributions tocranial capacity in Black and White adolescents. Intelligence, 20, 1–13.
Rushton, J. P., & Skuy, M. (2000). Performance on Raven’s Matrices by African andWhite university students in South Africa. Intelligence, 28, 251–265.
Rushton, J. P., Skuy, M., & Fridjhon, P. (2002). Jensen effects among African, Indian, andWhite engineering students in South Africa on Raven’s Standard Progressive Matri-ces. Intelligence, 30, 409–423.
Rushton, J. P., Skuy, M., & Fridjhon, P. (2003). Performance on Raven’s AdvancedProgressive Matrices by African, East Indian, and White engineering students inSouth Africa. Intelligence, 31, 123–137.
Scarr, S. (1996). How people make their own environments: Implications for parents andpolicy makers. Psychology, Public Policy, and Law, 2, 204–228.
Scarr, S., & McCartney, K. (1983). How people make their own environments: A theoryof genotype–environment effects. Child Development, 54, 424–435.
Scarr, S., Pakstis, A. J., Katz, S. H., & Barker, W. B. (1977). Absence of a relationshipbetween degree of White ancestry and intellectual skills within a Black population.Human Genetics, 39, 69–86.
Scarr, S., & Weinberg, R. A. (1976). IQ test performance of Black children adopted byWhite families. American Psychologist, 31, 726–739.
Scarr-Salapatek, S. (1971, December 24). Race, social class, and IQ. Science, 174,1285–1295.
Schmidt, F. L., & Hunter, J. E. (1998). The validity and utility of selection methods inpersonnel psychology: Practical and theoretical implications of 85 years of researchfindings. Psychological Bulletin, 124, 262–274.
292 RUSHTON AND JENSEN

Schonemann, P. H. (1992). Extension of Guttman’s result from g to PC1. MultivariateBehavioral Research, 27, 219–224.
Schoenemann, P. T., Budinger, T. F., Sarich, V. M., & Wang, W. S. Y. (2000). Brain sizedoes not predict general cognitive ability within families. Proceedings of the NationalAcademy of Sciences USA, 97, 4932–4937.
Shigehisa, T., & Lynn, R. (1991). Reaction times and intelligence in Japanese children.International Journal of Psychology, 26, 195–202.
Shuey, A. M. (1958). The testing of Negro intelligence. Lynchburg, VA: J. P. Bell.Shuey, A. M. (1966). The testing of Negro intelligence (2nd ed.). New York: Social
Science Press.Simmons, K. (1942). Cranial capacities by both plastic and water techniques with cranial
linear measurements of the Reserve Collection: White and Negro. Human Biology,14, 473–498.
Skuy, M., Gewer, A., Osrin, Y., Khunou, D., Fridjhon, P., & Rushton, J. P. (2002). Effectsof mediated learning experience on Raven’s Matrices scores of African and non-African university students in South Africa. Intelligence, 30, 221–232.
Skuy, M., Hoffenberg, S., Visser, L., & Fridjhon, P. (1990). Temperament and cognitivemodifiability of academically superior Black adolescents in South Africa. Interna-tional Journal of Disability, Development, and Education, 37, 29–44.
Skuy, M., Schutte, E., Fridjhon, P., & O’Carroll, S. (2001). Suitability of publishedneuropsychological test norms for urban African secondary school students in SouthAfrica. Personality and Individual Differences, 30, 1413–1425.
Skuy, M., & Shmukler, D. (1987). Effectiveness of the Learning Potential AssessmentDevice with Indian and Colored adolescents in South Africa. International Journal ofSpecial Education, 12, 131–149.
Snyderman, M., & Rothman, S. (1987). Survey of expert opinion on intelligence andaptitude testing. American Psychologist, 42, 137–144.
Snyderman, M., & Rothman, S. (1988). The IQ controversy, the media, and public policy.New Brunswick, NJ: Transaction Books.
Sowell, T. (1994). Race and culture. New York: Basic Books.Spearman, C. (1927). The abilities of man: Their nature and measurement. New York:
Macmillan.Stanley, J. C., & Porter, A. C. (1967). Correlation of Scholastic Aptitude Test scores with
college grades for Negroes versus Whites. Journal of Educational Measurement, 4,199–218.
Steele, C. M. (1997). A threat in the air: How stereotypes shape intellectual identity andperformance. American Psychologist, 52, 613–629.
Sternberg, R. J. (2000). (Ed.). Handbook of intelligence. Cambridge, England: CambridgeUniversity Press.
Sternberg, R. J., Nokes, C., Geissler, P. W., Prince, R., Okatcha, F., Bundy, D. A., &Grigorenko, E. L. (2001). The relationship between academic and practical intelli-gence: A case study in Kenya. Intelligence, 29, 401–418.
Stringer, C., & McKie, R. (1996). African exodus. London: Cape.Tate, C., & Audette, D. (2001). Theory and research on “race” as a natural kind variable
in psychology. Theory and Psychology, 11, 495–520.te Nijenhuis, J., Voskuijl, O. F., & Schijve, N. B. (2001). Practice and coaching on IQ
tests: Quite a lot of g. International Journal of Selection and Assessment, 9, 302–308.Thompson, P. M., Cannon, T. D., Narr, K. L., Erp, T. V., Poutanen, V. P. Huttunen, M.,
et al. (2001). Genetic influences on brain structure. Nature Neuroscience, 4, 1253–1258.
Tizard, B. (1974, February 1). IQ and race. Nature, 247, 316.
293RACE DIFFERENCES IN COGNITIVE ABILITY

Todd, T. W. (1923). Cranial capacity and linear dimensions, in White and Negro.American Journal of Physical Anthropology, 6, 97–194.
Urbach, P. (1974a). Progress and degeneration in the “IQ debate” (I). British Journal ofthe Philosophy of Science, 25, 99–135.
Urbach, P. (1974b). Progress and degeneration in the “IQ debate” (II). British Journal ofthe Philosophy of Science, 25, 235–259.
Vernon, P. A., Wickett, J. A., Bazana, G., & Stelmack, R. M. (2000). The neuropsychol-ogy and psychophysiology of human intelligence. In R. J. Sternberg (Ed.), Handbookof intelligence (pp. 245–264). Cambridge, England: Cambridge University Press.
Vernon, P. E. (1965). Ability factors and environmental influences. American Psycholo-gist, 20, 723–733.
Vernon, P. E. (1979). Intelligence: Heredity and environment. San Francisco: Freeman.Vernon, P. E. (1982). The abilities and achievements of Orientals in North America. New
York: Academic Press.Vint, F. W. (1934). The brain of the Kenya native. Journal of Anatomy, 48, 216–223.Waldman, I. D., Weinberg, R. A., & Scarr, S. (1994). Racial-group differences in IQ in
the Minnesota Transracial Adoption Study: A reply to Levin and Lynn. Intelligence,19, 29–44.
Watson, J. B. (1924). Behaviorism. Chicago: University of Chicago Press.Weinberg, R. A., Scarr, S., & Waldman, I. D. (1992). The Minnesota Transracial
Adoption Study: A follow-up of IQ test performance at adolescence. Intelligence, 16,117–135.
Wigdor, A. K., & Garner, W. R. (Eds.). (1982). Ability testing: Uses, consequences, andcontroversies. Part 1: Report of the Committee. Part 2: Documentation section.Washington, DC: National Academy Press.
Willerman, L., Naylor, A. F., & Myrianthopoulos, N. C. (1974). Intellectual developmentof children from interracial matings: Performance in infancy and at 4 years. Behav-ioral Genetics, 4, 84–88.
Wilson, E. O. (1978). On human nature. Cambridge, MA: Harvard University Press.Winick, M., Meyer, K. K., & Harris, R. C. (1975, December 19). Malnutrition and
environmental enrichment by early adoption. Science, 190, 1173–1175.Zaaiman, H., van der Flier, H., & Thijs, G. D. (2001). Dynamic testing in selection for an
educational programme: Assessing South African performance on the Raven Pro-gressive Matrices. International Journal of Selection and Assessment, 9, 258–269.
Zindi, F. (1994). Differences in performance. The Psychologist, 7, 549–552.
294 RUSHTON AND JENSEN