Thirteenth Report of the Independent Monitor Racial ...
69
Thirteenth Report of the Independent Monitor Racial Disparities in NYPD Stop, Question, and Frisk Practices: An Analysis of 2013 to 2019 Stop Reports Peter L. Zimroth September 1, 2021 Floyd, et al. v. City of New York Ligon, et al. v. City of New York, et al. Davis, et al. v. City of New York, et al. Case 1:08-cv-01034-AT Document 853-1 Filed 09/01/21 Page 1 of 69
Transcript of Thirteenth Report of the Independent Monitor Racial ...

Thirteenth Report of the Independent Monitor
Racial Disparities in NYPD Stop, Question, and Frisk Practices: An Analysis of 2013 to 2019 Stop Reports
Peter L. Zimroth
September 1, 2021
Floyd, et al. v. City of New York Ligon, et al. v. City of New York, et al. Davis, et al. v. City of New York, et al.
Case 1:08-cv-01034-AT Document 853-1 Filed 09/01/21 Page 1 of 69
ii
MONITOR TEAM
Peter L. Zimroth Monitor
Richard Jerome Deputy Monitor
Anthony A. Braga
Cassandra Chandler Jennifer Eberhardt Demosthenes Long John MacDonald James McCabe
Jane Perlov James Yates
Case 1:08-cv-01034-AT Document 853-1 Filed 09/01/21 Page 2 of 69
iii
TABLE OF CONTENTS
EXECUTIVE SUMMARY .......................................................................................................... 1
I. INTRODUCTION ................................................................................................................. 9
II. DATA AND MEASURES ................................................................................................... 13
III. ESTIMATING RACIAL DISPARITIES IN STOP OUTCOMES ............................. 20
IV. RESULTS ......................................................................................................................... 25
A. FRISK DISPARITIES .............................................................................................................. 25 B. SEARCH DISPARITIES .......................................................................................................... 32 C. SUMMONS DISPARITIES ....................................................................................................... 38 D. ARREST DISPARITIES .......................................................................................................... 44 E. USE OF FORCE DISPARITIES ................................................................................................ 50 F. HIT RATE DISPARITIES ........................................................................................................ 56
V. CONCLUSION .................................................................................................................... 61
Case 1:08-cv-01034-AT Document 853-1 Filed 09/01/21 Page 3 of 69

1
Racial Disparities in NYPD Stop, Question, and Frisk Practices: An Analysis of 2013 to 2019 Stop Reports
EXECUTIVE SUMMARY
This report examines racial disparities in the New York City Police Department’s (NYPD)
stop, question, and frisk (SQF) patterns in New York City (NYC) between the years 2013 and
2019. The Floyd, Ligon, and Davis litigations against the NYPD led to a series of reforms designed
to reduce racial disparities and unlawful actions in their stops of civilians.
In its liability decision in August 2013, the Court ruled that the NYPD’s stop and frisk
practices violated the Fourteenth Amendment. The Court found that the City adopted a “policy of
indirect racial profiling by targeting racially defined groups for stops based on local crime suspect
data. This has resulted in the disproportionate and discriminatory stopping of Blacks and
Hispanics in violation of the Equal Protection Clause.” Floyd v. City of New York, 959 F. Supp.
2d 540, 562 (S.D.N.Y. 2013) (Floyd Liability Opinion). In its Remedial Opinion, the Court
directed the NYPD to revise its policies and training regarding racial profiling “to make clear that
targeting ‘the right people’ for stops, as described in the Liability Opinion, is a form of racial
profiling and violates the Constitution.” Floyd v. City of New York, 959 F. Supp. 2d 668, 680
(S.D.N.Y. 2013)(Remedial Opinion). The NYPD has made those changes in its policies and
training. However, as noted in the Monitor’s prior reports, changes in policy and training are not
meaningful unless those changes are implemented and sustained in the field. To guide the Monitor
Team in its examination of the Department’s compliance with its racial profiling policies and the
Fourteenth Amendment, Professor John MacDonald has used several statistical analyses of
NYPD’s stop and frisk data.
Case 1:08-cv-01034-AT Document 853-1 Filed 09/01/21 Page 4 of 69

2
In the Monitor’s Fifth Report, Dr. MacDonald examined NYPD’s SQF data for the years
2013-2015. The analyses indicated that racial disparities during 2013-15 were trending in the right
direction; most measures showed a diminution of racial disparities, although some did
not. However, that Report drew no conclusion about the NYPD’s constitutional compliance, for
two reasons: first, statistical data over a more extensive period was needed; and second, the
underreporting of stops limited the reliability of analyses based on data that include only reported
stops.
For this report, Dr. MacDonald uses the statistical analyses applied in the Monitor’s Fifth
Report to see whether racial disparities continue, after controlling for other potentially
confounding factors. He also addresses the problem of underreporting by conducting additional
analyses to examine the extent to which undocumented stops might affect the estimates of racial
disparities.
The number of stop reports filed by NYPD officers decreased dramatically between 2013
and 2019. This rapid decline commenced before the Floyd remedial order but accelerated after
the NYPD started to implement the reforms mandated by the Court’s remedial order. As detailed
in the Monitor’s Ninth, Eleventh, and other Reports, substantial changes have been made to the
NYPD’s stop policies, documentation, training, and auditing. The stop form itself was revised and
can now be completed using an electronic form that officers can fill out on their phones, on tablets,
or on a computer at the command. Importantly, during Compstat management accountability
meetings, NYPD executives no longer emphasize increasing the number of stop forms as a key
crime control output, so area commanders are no longer under pressure to have their officers make
stops to show that they are indeed focused on reducing crime in their areas of responsibility.
Case 1:08-cv-01034-AT Document 853-1 Filed 09/01/21 Page 5 of 69

3
The number of Black and Hispanic people subjected to stop encounters dropped
significantly between 2013 and 2019, though the overall share of stops by race and ethnicity
remained largely unchanged. The lack of change in the racial distribution of stops during this time
period, even with an overall reduction in stops, reflects the fact that the number of stops of Whites
and other groups was substantially lower than Hispanics and Blacks. In 2013, for example, the
total number of reported stops of Black and Hispanic subjects was 5.0 and 2.6 times larger than
that of reported stops of White subjects. In 2019, reported stops of Black and Hispanic subjects
were 6.6 and 3.2 times larger than the total number of stops of White subjects. The yearly
reduction in reported stops for Blacks (-11,818) and Hispanics (-6,226) exceeded the average
number of reported stops of Whites per year (4,762).
The reasons for which people were stopped and the locations in which these stops occurred
also remained generally the same across the six years. The analyses also show evidence of a
reduced stability in the locations that have relatively high stops for a given year. These findings
suggest that stop activities are no longer as spatially concentrated as they were in the past, which
may reflect a movement away from using SQF activities as a crime control strategy in relatively
high-crime places.
In this report, multivariate statistical models were used to examine racial disparities in post-
stop outcomes of frisks, searches, summons, arrest, use of force, and the percentage of frisks and
searches that resulted in the recovery of contraband or weapons, or “hit rates.” Three comparisons
were made to test for racially disparate policing in these five stop outcomes: (1) unadjusted
differences in stop outcomes for Black and Hispanic subjects relative to White and other racial
group subjects; (2) adjusted differences in stop outcomes that control for stop contexts; and (3)
doubly robust (DR) adjusted differences in stop outcomes that simultaneously reweight stop
Case 1:08-cv-01034-AT Document 853-1 Filed 09/01/21 Page 6 of 69

4
contexts for White and other subjects to be statistically identical to Blacks and Hispanics, and
control for stop context.
There is substantial evidence suggesting that many NYPD officers did not submit reports
documenting all of their stops of civilians in years 2016 to 2019. These undocumented stops may
undermine the reliability of statistical analyses to identify racially disparate stop report patterns
and practices in NYC. To explore the impact of these possibly missing reports, several different
methods were used to examine the extent to which undocumented stops may impact estimates of
racial disparities in stop outcomes. The first method involved reweighting 2016-2019 stop reports
so they had a similar distribution of characteristics and contexts of stops to those made in 2013, a
year in which NYPD officer stop behaviors were not influenced by the reforms mandated by the
Court. The second method assumed that stops involving frisks were more likely to be documented
and limited the analyses of racial disparities only to the subset of 2016-2019 stop reports that
involved frisks of subjects. The third method used missing stop report estimates generated by
analyses of Civilian Complaint Review Board (CCRB) complaint data, Quality Assurance
Division (QAD) RAND audits, and the recently completed body-worn camera (BWC) randomized
experiment. The missing stop report estimates were used to adjust the stop disparity estimates.
All analytical results are presented and discussed in the report. However, conclusions about
the existence of racial disparities in stop outcome measures were determined by statistically-
significant doubly robust (DR) comparisons (p<.01). Key results of the statistical analyses were:
• The analyses suggest that disparities in frisks of Black and Hispanic stop subjects relative
to frisks of White/Other subjects diminish over time and, after the implementation of the
Court’s remedial order, frisk rates do not differ significantly across the racial groups.
However, when adjustments were made to account for undocumented stops, it appears that
Case 1:08-cv-01034-AT Document 853-1 Filed 09/01/21 Page 7 of 69

5
Black subjects were more likely to be frisked relative to White/Other subjects between
2016 and 2019, with differences on the order of eight to 14 percentage points. Using the
same approach to account for undocumented stops, Hispanic stop subjects were more likely
to be frisked relative to White/Other subjects between 2016 and 2019, with differences on
the order of five to seven percentage points.
• Search rate disparities between Black stop subjects relative to White/Other subjects also
declined over time, with no differences in search rates noted between similarly situated
racial groups after 2013. When undocumented stop rates were considered, however,
Blacks were generally more likely to be searched during stops relative to Whites/Others
between 2016 and 2019. The analyses generally did not find statistically significant
differences in search rates for Hispanic subjects relative to search rates for White and other
subjects between 2013 and 2019 using the various methodological approaches, including
comparisons that considered undocumented stop rates.
• The analyses generally did not find statistically significant differences in summons rates
when Black and Hispanic stop subjects were compared to White/Other stop subjects
between 2013 and 2019 using the different methodological approaches, including
comparisons that considered undocumented stop rates.
• The analyses did not find consistent differences in arrest rates when comparing Blacks and
Hispanics relative to Whites/Others between 2013 and 2019. However, when adjustments
were made to account for undocumented stops, the analyses suggested that Blacks were
Case 1:08-cv-01034-AT Document 853-1 Filed 09/01/21 Page 8 of 69

6
more likely to be arrested when compared to White/Others between 2017 and 2019, with
differences that ranged between six and eight percentage points. The same analyses found
only one year (2018) where undocumented stops could lead to differences in arrest rates
between Hispanic stop subjects and Whites/Others stopped by the police.
• The analyses did not find differences in the use of force rates when comparing Blacks and
Hispanics relative to Whites and other stop subjects between 2014 and 2019. However,
when adjustments were made to account for undocumented stops, the analyses suggested
NYPD officers were more likely to use force during stops of Black subjects relative to
stops of White/Other subjects between 2017 and 2019, with differences on the order of
seven percentage points. This same analysis did not find any use of force rate differences
between Hispanics and White/Other subjects stopped by the police.
• Hit rates for weapons and contraband from searches of White/Other stop subjects were
generally higher than hit rates for Blacks and Hispanics, suggesting a lower threshold for
searching. However, the analyses found that the differences in search hit rates for weapons
and contraband were not statistically significant when Black stop subjects and Hispanic
stop subjects were compared to Whites/Others stopped for similar contexts.
Case 1:08-cv-01034-AT Document 853-1 Filed 09/01/21 Page 9 of 69

7
Consistent with the findings of the Monitor’s Fifth Report, the analyses reveal that racial
disparities between Blacks and Hispanics and similarly situated Whites/Others in frisks, searches,
summonses, arrests, uses of force, and the recovery of a weapon or other contraband diminished
substantially after the Court’s remedial order. These results suggest that the post-Floyd reforms
have helped address 14th Amendment concerns identified by the Court for stops that are recorded.
A second takeaway from these analyses, however, is that one cannot rely only on reported
stops, given the likelihood of significant numbers of unreported stops, and that racial disparities
may still be occurring if undocumented stops are taken into account. The doubly-robust estimation
used in this report, which compares Blacks or Hispanics stopped to White/Other groups stopped
under similar measured contexts, can only construct similarly situated comparisons based on the
availability of accurate recording of stop data. The report provides an estimated range of
unreported stops: at the low end of the estimate, the analyses continued to indicate a lack of racial
disparities; at the high end of the estimate, however, the analysis showed the presence of racial
disparities with respect to frisks, searches and use of force for Blacks and for Whites. As a result,
undocumented stops raise concerns about the ability to draw strong conclusions about compliance
with the 14th Amendment and concerns about Blacks and Hispanics not being treated similarly to
Whites when stopped by the NYPD. This is particularly the case for comparisons of frisks, arrests,
and uses of force for Blacks, as the estimated disparities in stop outcomes increase if one uses a
larger estimate of undocumented stops. Estimates of disparities in stop outcomes for Hispanics
compared to similarly situated White/Other groups appear to be largely unaffected by the different
assumptions about the level of undocumented stops.
The NYPD needs to continue, and further strengthen, its efforts to ensure that its officers
are documenting all civilian stops. Without complete data on stops, the NYPD will not be able to
Case 1:08-cv-01034-AT Document 853-1 Filed 09/01/21 Page 10 of 69

8
demonstrate, and the Federal Monitor will not be able to conclude, that the NYPD is in substantial
compliance with the Court’s remedial order.
Case 1:08-cv-01034-AT Document 853-1 Filed 09/01/21 Page 11 of 69

9
I. INTRODUCTION
The New York City Police Department (NYPD) has been implementing a series of reforms
to its stop, question, and frisk (SQF) practices as mandated in the federal court orders in the Floyd,
et al. v. City of New York, et al., 08 Civ. 1034 (AT), Ligon, et al. v. City of New York, et al., 12-
CV-2274 (AT), and Davis, et al. v. City of New York, et al., 10-CV-00699 (AT), lawsuits. As
documented in previous reports, the mandated reforms include changes to NYPD stop policies,
documentation, training, and auditing; modifications to the processing of civilian complaints and
officer discipline procedures; the adoption of new measures to evaluate organizational
performance; and the establishment and evaluation of a pilot body-worn camera (BWC) program.
The number of stop reports completed by NYPD officers dropped precipitously before the Court’s
2013 decision, decreasing by 72 percent from 685,724 in 2011 to 191,851 in 2013. Since the
Court-ordered reforms, this steep decline continued through 2019, with only 13,459 reported stops
made that year, representing a 98 percent drop from 2011. In this report, racial disparities in NYPD
stops made between 2013 and 2019 are assessed.
Expert analyses indicating significant racial disparities in NYPD stop patterns and practices
were highly influential in shaping Judge Scheindlin’s 2013 decision that the NYPD was engaging
in unconstitutional policing (Fagan, 2010; Gelman, Fagan & Kiss, 2007). As established in the
expert reports to the Court, it is critically important for statistical analyses to control for rival
factors that could explain the observed disparities when assessing the potential for racially
discriminatory treatment. Indeed, it is common for the media and some in the community to
compare the racial distribution of stops to the racial distribution of the community’s residential
population (see ACLU Massachusetts, 2014). However, such a simple comparison would not be
a valid test of racial discrimination in police stops of civilians. Racial bias could be a factor in
Case 1:08-cv-01034-AT Document 853-1 Filed 09/01/21 Page 12 of 69

10
generating observed disparities, but other factors, such as crime, police deployment patterns, and
neighborhood disadvantage, may also contribute to the observed racial disparities in the overall
pattern of police stops (Ridgeway & MacDonald, 2010). This report follows the statistical
analyses developed and applied in the Monitor’s Fifth Report and many other social science papers
(e.g., Knowles, Persico, & Todd, 2001; Anwar & Fang, 2006; Fagan, 2010; MacDonald & Braga,
2019; MacDonald & Fagan, 2019; Neil & Winship, 2019) that compare racial disparities in post-
stop outcomes–frisks, searches, summonses, arrests, uses of force, and “hit rates”–after statistically
controlling for other potentially confounding factors.
Hit rates represent the percentage of searches that turn up weapons or contraband as an
outcome measure.1 If a lower percentage of searched Blacks and Hispanics are found with
contraband or weapons compared to White/Other groups, this provides evidence suggesting that
the police may be applying a lower standard of suspicion to minorities in deciding whether to
conduct a search (Ridgeway & MacDonald, 2010). If one considers stops of civilians as a series
of repeated interactions where the police want to find contraband and suspects want to avoid being
caught with contraband, police officers should improve their search strategies and criminals should
improve on their ability to avoid detection, such that there should be no racial differences in hit
rates from searches if both groups are trying to achieve their goal (Knowles, Persico, & Todd,
2001). Analyses of hit rates in police stops of civilians in a number of locations have found that
searches of Hispanic subjects are less likely to yield contraband, suggesting a lower standard of
suspicion being applied to this group (e.g., Knowles, Persico, & Todd, 2001; Persico & Todd,
2006; Baumgartner et al., 2018). A more recent study using traffic stop data from eight state police
agencies and six municipalities found that search rates were significantly higher for Black and
1 Hit rates can also be calculated as the percentage of frisks that recover weapons or contraband.
Case 1:08-cv-01034-AT Document 853-1 Filed 09/01/21 Page 13 of 69

11
Hispanic drivers relative to White drivers, but that hit rates for contraband were significantly lower
for Hispanic and Black drivers (Pierson et al., 2020).
Several papers, however, suggest that comparing hit rates from searches between races is
not an accurate test of racial discrimination if the context of searches is different between racial
groups (Ayres, 2002; Anwar & Fang, 2006; Engel & Tillyer, 2008; Sanga, 2009). For example,
there may be factors associated with race that explain a greater propensity to search and a lower
hit rate, but that have nothing to do with police officers applying a lower threshold of suspicion.
This is often referred to as omitted variable bias (Neil & Winship, 2019), and indicates that it is
important to have accurate measures of the context of the stop (e.g., suspected crime, location,
time of day, etc.) in comparing racial disparities in hit rates (Ridgeway 2006). Additionally, there
is the possibility that the distribution of weapons and/or contraband carrying differs by race, such
that even if police apply searches in a race-neutral manner, there will be evidence of differences
in the average hit rates of a search.2 This is known as the infra-marginality problem (e.g., see
Simiou, et al., 2017) and can yield inaccurate estimates of racial disparities in hit rates and other
post-arrest outcomes, including frisks, searches, summonses, arrests, and uses of force.
A simple model can explain the basic problem of infra-marginality in an outcome test (hit
rates) of police searches for contraband. Starting with an assumption that the probability of having
contraband is five percent for Blacks and 15 percent for Whites, it is possible for police to appear
racially biased for the average case even if they are race neutral. Assume that carrying contraband
increases the risk of being searched by a factor of two regardless of race. Given that assumption,
2 A race-neutral policy is one that focuses on improving public safety that is unrelated to the race of suspects. For example, a policy that focuses on reducing gun violence should in principle be race-neutral. The racial distribution of outcomes among similarly situated suspects should not change differently by race if police are applying the new policy in a neutral manner.
Case 1:08-cv-01034-AT Document 853-1 Filed 09/01/21 Page 14 of 69

12
even if police applied a race-neutral approach to searches, the rate at which police recover
contraband would suggest race bias, because the hit rate would be 10 percent for Blacks (0.05*2)
and 30 percent for Whites (0.15*2). If, instead, police are racially biased in the decision to search
suspects, and Blacks are three times more likely to be searched than Whites with contraband, the
recovery rate would be 15 percent for Blacks (0.05*3) and 15 percent for Whites (0.15*1),
suggesting no evidence of racial bias. This example violates a key assumption of the standard
outcome test, “that the probability of being guilty is equal among all groups that are searched in
equilibrium” (Knowles et al., 2001; p. 215). For outcomes tests to be a valid test of racial bias,
one has to establish that marginal cases of outcomes from stops and searches are similar between
racial groups.
Given the difficulties associated with addressing omitted (unobserved) variable bias and
infra-marginality, scholars and policymakers alike should be cautious when interpreting the
findings of outcome tests. One approach to addressing these limitations is to compare outcomes
from stops after policy changes have been made by the police, as race-neutral changes should
impact all groups equally (MacDonald & Fagan, 2019). All approaches to assessing whether
racially biased policing occurs suffer from some weaknesses (Ridgeway & MacDonald, 2010; Neil
& Winship, 2019).
The documentation of stops is essential for the NYPD to demonstrate substantial
compliance with the remedial orders. As the NYPD has acknowledged, there is considerable
evidence that their officers have not been documenting all stops of civilians. The NYPD Quality
Assurance Division (QAD) conducts audits designed to identify stop encounters using radio
transmissions to identify instances in which stop reports should have been prepared (labeled
“RAND audits” from audits developed for NYPD by the RAND corporation). The monitor team’s
Case 1:08-cv-01034-AT Document 853-1 Filed 09/01/21 Page 15 of 69

13
review of RAND audits from 2018 and 2019 show that some 36 percent of NYPD stops were not
being documented as required. Similarly, analyses of self-initiated arrests suggest a substantial
share of arrests originated from stops of civilians that did not generate the required stop reports.
The Monitor’s Eleventh Report also found that officers did not complete stop reports in seven
percent of Civilian Complaint Review Board (CCRB) stop-related complaints. Finally, in the
Monitor’s Twelfth Report, the BWC cluster randomized controlled trial reported that BWC
treatment officers submitted 39 percent more stop reports relative to no-camera control officers,
suggesting that BWC officers were more likely to comply with NYPD directives to document all
stops.
Without a full accounting of all stops of civilians, it is not possible to conclude that the
NYPD is compliant with the remedial orders of the Court, as statistical analyses of racial disparities
in stops may be biased by undocumented stop data. Although no conclusions were drawn about
the NYPD’s constitutional compliance, the statistical analyses of NYPD stop reports in the
Monitor’s Fifth Report suggested that most indicators of racial disparities had diminished between
2013 and 2015. However, those analyses did not attempt to adjust racial disparity estimates based
on different measures of undocumented stops. In this report, all statistical analyses of 2016-2019
racial disparity outcome measures are adjusted using three different methods to address the
absence of undocumented stops.
II. DATA AND MEASURES
NYPD stop report data were obtained for years 2013-2019 from open sources.3 The stop
report data contain information on the reason for the reported stop noted by the police officer,
3 See: https://www1.nyc.gov/site/nypd/stats/reports-analysis/stopfrisk.page (Accessed June 30, 2021).
Case 1:08-cv-01034-AT Document 853-1 Filed 09/01/21 Page 16 of 69

14
frisks or searches of individuals if made, and enforcement actions taken. Stop report data also
contain demographic information of the stopped individual, including their age, race, and gender,
and location and other contextual information about the stop. Indicator variables were generated
to measure the race of stopped individuals according to major racial categories of Black, Hispanic,
White, Asian, and Other groups. For the primary analysis, Blacks and Hispanics were contrasted
with White and all other (Asian and Other) racial groups. For every stop report, indicators were
created for the gender (male v. female) and age (less than 10; 10-15; 16-19; 20-24; 25-34; 35-64;
65+) of the stopped individual. To capture the general location of stops, indicators were generated
for the precinct location (N=77 precincts, numbered 1… 123) of each stop report. To measure the
suspected crime that the officer recorded as the reason for a stop, indicator variables were created
for six major categories of violence, weapons, property, drugs, trespass, and quality of life offenses
from approximately 93 different types of crimes noted in the detailed crime/misdemeanor field of
the data. These broad race and crime categories are consistent with prior expert reports (see Fagan,
2010, 2012a, 2012b). To measure stops that are based on a suspect being identified from a radio
call, indicator variables were generated for whether the stop was associated with a radio run or not.
Indicator variables were also created to measure the day of the week (Sunday…Saturday), the time
of day (patrol shift 1, 2, or 3), and the general location (housing, transit, or other) where the stop
occurred.
Five outcome variables were created to measure whether the stop resulted in a frisk, search,
summons, arrest, or use of force. These measures were not mutually exclusive, and indicated
whether (=1) or not (=0) these outcomes occurred during a stop encounter. During stops, NYPD
officers can search subjects in varying situations, including searches incident to arrest, searches
resulting from a frisk, consent searches, and searches when police have probable cause to believe
Case 1:08-cv-01034-AT Document 853-1 Filed 09/01/21 Page 17 of 69

15
a crime has been committed. In this analysis, the stop form captures NYPD officer searches based
on reasonable suspicion and probable cause standards.4 Use of force captures incidents where an
officer reported on the stop report using any force, including impact weapon, drawing /pointing
firearm, physical force, O.C. Spray, and CEW (conducted energy weapon). Search hit rate
measures were generated according to two indicators that measure whether the search resulted in
finding of contraband, or whether the search resulted in the seizure of weapons (all gun types,
knives, or other weapons). The final analytic database to assess racial disparities in individual stop
outcomes consisted of an incident-level SQF file that contained all of these measures of stop
characteristics and contexts over years 2013 to 2019.
Table 1 shows the number of reported stops and the percentage of stops by race for each
year 2013 through 2019. The count of recorded stops dropped by 93 percent between 2013 and
2019, for an average yearly decline of 50 percent. The overall number of stops dropped the most
for Blacks and Hispanics, though they remained more than 80 percent of all individuals stopped
each year. While the number of stops of Blacks and Hispanics dropped precipitously between
2013 and 2019, the racial differences in the share of stops remained unaffected by the downturn.
This is due to the fact that the average yearly change was roughly a decline of 50 percent for all
racial groups.
Table 1. Racial Distribution of Suspects Stopped and in NYPD SQF Reports, 2013-2019 Race 2013 2014 2015 2016 2017 2018 2019 Total Average
Change Black 104449 24319 11950 6498 6595 6241 7981 168033 -11818 (54.4) (53.1) (53.0) (52.4) (56.7) (56.7) (59.3) (54.4) (-49.23) Hispanic 54930 12489 6499 3626 3567 3389 3869 88369 -6226 (28.6) (27.3) (28.8) (29.2) (30.7) (30.8) (28.7) (28.6) (-49.31) White 20820 5467 2514 1270 977 1074 1215 33337 -2469 (10.9) (11.9) (11.1) (10.2) (8.4) (9.8) (9.0) (10.8) (-51.84)
4 The stop report form asks NYPD officers to indicate at least one of the following criteria for conducting a search: “hard object resembling a weapon,” “consent to search,” “admission of weapons possession,” “outline of a weapon,” “search incident to arrest,” and “other (describe below).”
Case 1:08-cv-01034-AT Document 853-1 Filed 09/01/21 Page 18 of 69

16
Asian 7663 2473 1180 775 215 237 309 12852 -982 (4.0) (5.4) (5.2) (6.2) (1.8) (2.2) (2.3) (4.2) (-53.49) Other 2844 739 298 140 0 0 0 4021 -- (1.5) (1.6) (1.3) (1.1) (0.0) (0.0) (0.0) (1.3) -- Unknown 1145 300 122 95 275 67 85 2089 -125 (0.6) (0.7) (0.5) (0.8) (2.4) (0.6) (0.6) (0.7) (-41.8) Total 191851 45787 22563 12404 11629 11008 13459 308701 -21988 (100.0) (100.0) (100.0) (100.0) (100.0) (100.0) (100.0) (100.0) (-49.86)
Note: Raw numbers are in rows and percentages are in parentheses.
Table 2 shows the distribution of six major categories of crime suspected among those
stopped. The yearly distribution of these broad crime categories in stop reports indicates that
suspected property crimes (32%) and weapon offenses (26%) represent over half of the crimes
suspected for individuals stopped each year. The yearly change in property and other categories
between 2016 and 2017 are the result of the change in stop forms, which had fewer categories to
classify as property offenses. Starting in 2016, there is evidence that that the share of stops for
violent suspected crimes increases, suggesting that stops are of a more serious nature. In the
analyses that follow, we assess outcomes within each year so that the year-to-year changes in
suspected crime classifications have no material impact on the disparity analyses.
Table 2. Distribution of Suspected Crimes in NYPD SQF Reports, 2013-2019 Suspected Crimes
2013 2014 2015 2016 2017 2018 2019 Total
Violence 45701 9010 4954 3280 3019 3090 3866 72920 (23.8) (19.7) (22.0) (26.4) (26.0) (28.1) (28.7) (23.6) Weapons 47248 12455 6866 3550 3157 2962 3707 79945 (24.6) (27.2) (30.4) (28.6) (27.1) (26.9) (27.5) (25.9) Property 62699 15631 7113 3665 2752 2831 3604 98295 (32.7) (34.1) (31.5) (29.5) (23.7) (25.7) (26.8) (31.8) Drugs 17428 4131 1731 722 525 448 319 25304 (9.1) (9.0) (7.7) (5.8) (4.5) (4.1) (2.4) (8.2) Trespass 13216 3338 1360 825 957 484 490 20670 (6.9) (7.3) (6.0) (6.7) (8.2) (4.4) (3.6) (6.7) Quality of Life 2865 401 126 84 266 234 337 4313 (1.5) (0.9) (0.6) (0.7) (2.3) (2.1) (2.5) (1.4) Other 2694 821 413 278 953 959 1136 7254 (1.4) (1.8) (1.8) (2.2) (8.2) (8.7) (8.4) (2.3) Total 191851 45787 22563 12404 11629 11008 13459 308701
Case 1:08-cv-01034-AT Document 853-1 Filed 09/01/21 Page 19 of 69

17
(100.0) (100.0) (100.0) (100.0) (100.0) (100.0) (100.0) (100.0) Note: Raw numbers are in rows and percentages are in parentheses.
Figure 1 shows the spatial pattern of stops during 2013-2019 by the frequency of reported
stops per 100 square meters5 in NYC. Figure 1 reveals that although reported stops dropped across
NYC, the spatial distribution of the areas with higher numbers of stops remained generally the
same across the four years. A Spearman rank correlation coefficient6 suggests a modest but
statistically significant (p<.001) correlation between the rank number of stop reports per 100
square meters in 2013 with other years. However, the pattern does suggest that the correlation
diminishes over time (rho=.446, 2014; rho=.356, 2015; rho=.287, 2016; rho=.283, 2017; rho=.289,
2018; rho=.309, 2019), implying a reduced stability in the locations that have relatively high stop
numbers for a given year.7
5 Estimated from kernel density of 973,403 hexagon grids superimposed over a map of New York City. 6 Spearman rank correlation coefficient (rho) measures the direction and strength of the relationship between two ranked (or ordinal) variables, ranging from -1 (perfect negative relationship) to +1 (perfect positive relationship) (see Fieller et al., 1957). 7 A fixed effect analysis that controls for the locations of each stop report (n=973,403 hexagon grids) shows that stops declined significantly each year, and that the year-to-year variation significantly explains the variation in stops (F-test (6,5840412) = 10204.91, p<.0001). This implies that the reduction in stops over these years was not driven by a reduction in a limited number of high stop locations; instead, it appears that stops decreased across the board in almost all locations.
Case 1:08-cv-01034-AT Document 853-1 Filed 09/01/21 Page 20 of 69

18
Figure 1: Stops per 100 Square Meters, NYC
Case 1:08-cv-01034-AT Document 853-1 Filed 09/01/21 Page 21 of 69

19
Over the period 2013 to 2019, the reasons for making stops, the racial distributions of
subjects in stops, and locations of recorded stops remained fairly consistent during the course of a
massive citywide drop in recorded stops. In the following analysis, the impact of the reduction in
reported stop activity on racial disparities in outcomes is assessed. As noted earlier, there is
considerable evidence that NYPD officers are not documenting all of their stops of civilians. For
Case 1:08-cv-01034-AT Document 853-1 Filed 09/01/21 Page 22 of 69

20
this reason, the extent to which failure to document stops (i.e., missing data) impacts the estimates
of racial disparities is assessed for each outcome test.
III. ESTIMATING RACIAL DISPARITIES IN STOP OUTCOMES
To examine racial and ethnic disparities in stop outcomes (frisks, searches, summonses,
arrests, and uses of force) and hit rates (findings of contraband and weapons) and how they change
over time, multivariate logistic regression models were estimated that permit statistically adjusting
for average differences in the stop contexts involving Black, Hispanic, and White/Other civilians.
Specifically, overall racial and ethnic disparities in frisks, searches, summonses, arrests, uses of
force, and the finding of contraband and weapons, not adjusting for any stop context (equal to the
average differences in each group), were compared to the racial and ethnic disparities that remain
after statistically controlling for stop context (e.g., major crime suspected; day of the week; patrol
shift; housing, transit, or other location; gender of person stopped; age of person stopped; whether
the stop was based on a radio run or self-initiated; and precinct location). The disparities that
remained after controlling for stop context were then compared to a sample of stops of White/Other
subjects that were statistically identical on stop features to stops of Black or Hispanic subjects.
This last comparison is referred to as a “doubly robust” estimator (DR). The DR estimation
addresses potential concerns that factors which are correlated with race, such as the suspected
crime and precinct location, are not adequately adjusted for in traditional multivariate regression
models that assume the relationship between race and an outcome is linear after controlling for
other variables (Morgan & Winship, 2015). For example, there may be nonlinear relationships
between race and other factors like suspected crime categories. By relying on the DR estimation,
Case 1:08-cv-01034-AT Document 853-1 Filed 09/01/21 Page 23 of 69

21
we guard against calculating a statistically biased estimate of racial disparity that was generated
from an incorrectly modeled comparison of Blacks and Hispanics with White/Other subjects.8
Three methods were relied on to assess the extent to which undocumented stops may
impact estimates of racial disparities in stop outcomes. First, it was assumed that missing
(undocumented) stops were less of a concern in 2013, as the NYPD put more incentive on officers
to fill out stop reports as part of their effort to show commanders that they were engaged in
proactive policing during that time period. Based on this assumption, the following missing data
algorithm was developed to make the characteristics and contexts of 2016-2019 similar to what
would have been expected if these stops were made in 2013. For each stop in 2016 to 2019, the
features of stops were reweighted using an entropy balancing algorithm so that the reweighted
stops had a similar distribution of features when compared to the 2013 stops. To ensure that the
2016-2019 stops had a similar distribution among racial groups to those stops made in 2013, these
weights were then multiplied with those derived to match Black or Hispanic stops to similarly
situated White/Other stops (Ridgeway et al., 2015). The logic here is that this missing data
algorithm places greater weight for stops reported in locations and for reasons that are similar to
2013. If, for example, there were 10 stops of Black males aged 20-24 for weapons related offenses
in 2013 in Precinct 44 and only 1 in 2016, the stop made in 2016 would be given a weight of 10
in the analysis.
The second approach assumes stops that result in frisks are more likely to result in
subsequent actions that lead to the documentation of the stop. This assumption is based on the fact
8 We rely on entropy balancing, which is a numerical optimization that reweights Whites/Others stopped to be identical to Blacks or Hispanics stopped on the mean, variance, and skew of all observable characteristics aside from race (Hainmueller, 2011). The weights are then included in a regression model so that estimates are doubly robust, meaning that if either the estimates from a regression model or those from the entropy balancing weights are correct, we will have an unbiased estimate of racial disparities in outcomes from stop reports (Wooldridge, 2010; Zhao & Percival, 2015).
Case 1:08-cv-01034-AT Document 853-1 Filed 09/01/21 Page 24 of 69

22
that stops with frisk are more intrusive, last longer and are more likely to result in a search or an
arrest than stops without frisks. Intrusive encounters can also lead to civilian complaints. Officers
are more likely to document encounters that involve additional enforcement action such as frisks,
searches, arrests or uses of force than shorter duration encounters that do not involve any additional
actions, as those encounters are more likely to be discovered by internal auditors or by outside
agencies, such as the CCRB. Following this logic, this missing data method assesses the extent to
which undocumented stops may impact racial disparities in stop outcomes in 2016 to 2019 by
selecting the subset of stops for which a frisk occurred. For stops that result in a search, summons,
arrest, or use of force, we examine disparities with the DR estimator for those that had a frisk
documented.
The third approach assesses the impact of undocumented stops on racial disparities in stop
outcomes between 2016 and 2019 by relying on missing data estimates from RAND audits
conducted by NYPD’s QAD unit, the BWC experiment, and CCRB complaints. Computer-Aided
Dispatch (CAD) data document instances when NYPD officers may have stopped civilians and,
as such, can be used to generate an estimate of the share of undocumented Terry stops that do not
have the required stop form completed. For years 2018-2019, the RAND audits showed that
approximately 36 percent of stops were not documented that should have been. Two other sources
also provide estimates of undocumented stops. The BWC experiment conducted by the monitor9
found that officers were more likely to document a stop when equipped with a camera compared
to officers in control precincts not equipped with cameras. At the same time, summonses and
arrests did not differ between BWC precinct officers and control precinct officers. These findings
9 http://nypdmonitor.org/wp-content/uploads/2020/12/12th-Report.pdf (accessed February 27, 2021).
Case 1:08-cv-01034-AT Document 853-1 Filed 09/01/21 Page 25 of 69
23
suggest that 39 percent of stops should have been documented in the control precincts, but were
not. We rely on this metric as another source for estimating potential underreporting of stops.10
Finally, complaints submitted to the CCRB between 2017 and 2019 suggest that in
approximately seven percent (180/2608) of cases in which a civilian filed a complaint for a stop
that was deemed to have occurred, investigators found a failure to fill out a stop report (see Chart
2, Monitor’s Eleventh Report). This measure of undocumented stops is likely to represent an
underestimate (or “lower bound”) of undocumented stops, as it is likely that cases that rise to the
level of filing a complaint by a civilian are going to be those that are more likely to be documented
by NYPD officers.
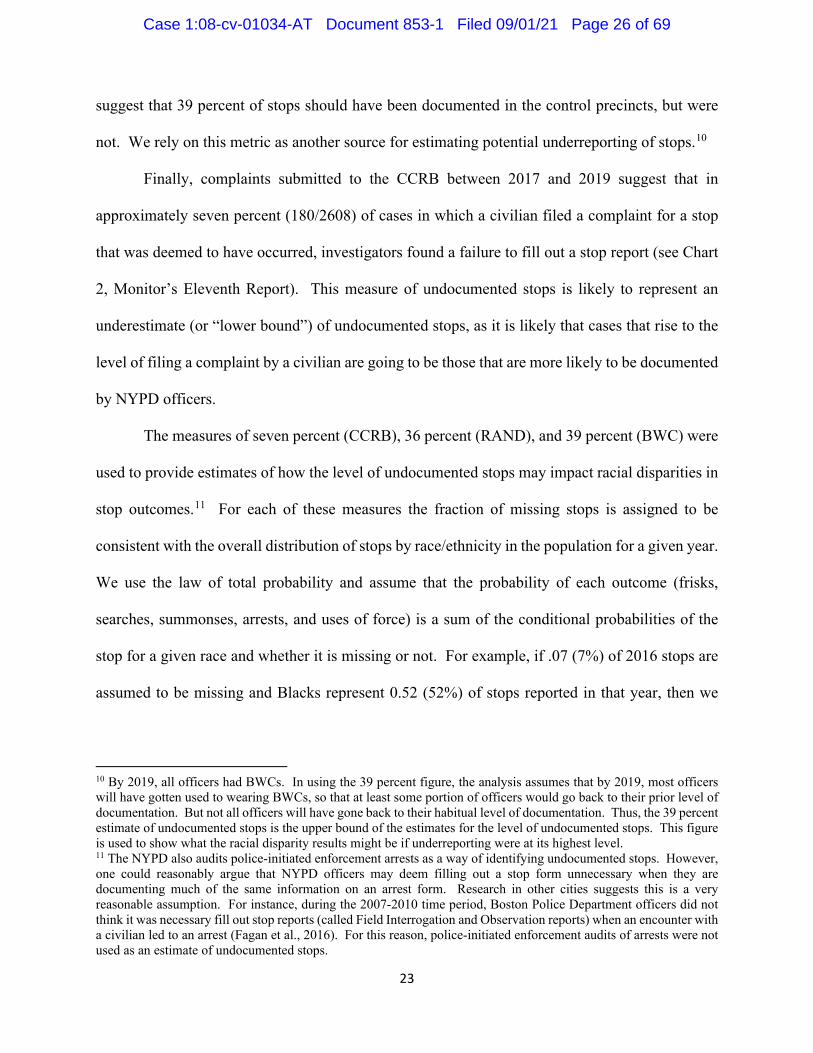
The measures of seven percent (CCRB), 36 percent (RAND), and 39 percent (BWC) were
used to provide estimates of how the level of undocumented stops may impact racial disparities in
stop outcomes.11 For each of these measures the fraction of missing stops is assigned to be
consistent with the overall distribution of stops by race/ethnicity in the population for a given year.
We use the law of total probability and assume that the probability of each outcome (frisks,
searches, summonses, arrests, and uses of force) is a sum of the conditional probabilities of the
stop for a given race and whether it is missing or not. For example, if .07 (7%) of 2016 stops are
assumed to be missing and Blacks represent 0.52 (52%) of stops reported in that year, then we
10 By 2019, all officers had BWCs. In using the 39 percent figure, the analysis assumes that by 2019, most officers will have gotten used to wearing BWCs, so that at least some portion of officers would go back to their prior level of documentation. But not all officers will have gone back to their habitual level of documentation. Thus, the 39 percent estimate of undocumented stops is the upper bound of the estimates for the level of undocumented stops. This figure is used to show what the racial disparity results might be if underreporting were at its highest level. 11 The NYPD also audits police-initiated enforcement arrests as a way of identifying undocumented stops. However, one could reasonably argue that NYPD officers may deem filling out a stop form unnecessary when they are documenting much of the same information on an arrest form. Research in other cities suggests this is a very reasonable assumption. For instance, during the 2007-2010 time period, Boston Police Department officers did not think it was necessary fill out stop reports (called Field Interrogation and Observation reports) when an encounter with a civilian led to an arrest (Fagan et al., 2016). For this reason, police-initiated enforcement audits of arrests were not used as an estimate of undocumented stops.
Case 1:08-cv-01034-AT Document 853-1 Filed 09/01/21 Page 26 of 69

24
multiply those probabilities by the probability of a frisk given someone is Black (.668, or 67%).
Following the law of total probability, we can then add all the marginal probabilities together to
obtain the overall probability (rate) of a given outcome for each racial group.12 This approach
makes the explicit assumption that any group that is a larger share of the stops in a reported year
will have proportionally a higher outcome of frisks, searches, summonses, arrests, and uses of
force among undocumented stops. In other words, the approach using the law of total probability
assumes that undocumented stops for Blacks and Hispanics are more likely to be subject to a frisk,
search, summons, arrest, or use of force than undocumented stops for Whites/Others stopped in
similar contexts.13 The standard errors from the DR estimator are used in calculating the
differences among racial and ethnic groups, so that the impact of undocumented stops is assumed
to be missing at random conditional on variables.
For all outcome tests (frisks, searches, summonses, arrests, uses of force, and hit rates),
comparative results for Black subjects relative to White/Other subjects are presented first, followed
by comparative results for Hispanic subjects relative to White/Other subjects. We interpret p-
values less than 0.01 as a significant effect. We used the lower p-value .01 rather than .05 to
account for multiple outcome tests across years. This more restrictive threshold was used to avoid
“false discoveries”–by chance alone, the application of the p<.05 threshold could lead one to
12 For 2016, the overall probability of frisk given a stopped subject was Black can be written as follows: P(Frisk|Black,Stop) = P(Frisk|Stop,Black,Stop Not Missing)* P(Stop Not Missing|Black,Stop) + P(Frisk|Stop,Black,Stop Missing)* P(Stop Missing|Black,Stop). This is equivalent to 0.668 * 0.93 + .668 *.52 * 0.07 = .645. 13 An analysis was also conducted using a different assumption: that outcomes from undocumented stops are similar to years 2011 or 2012 for Blacks and Hispanics compared to similarly situated Whites/Others. Using that assumption, the total probability will be simply the outcome for a given racial group in 2011 or 2012 times the proportion of estimated missing cases, plus the outcome from the current year (2016, 2017, 2018, or 2019) times the proportion of documented cases. This benchmark means that the average undocumented case in years 2016 to 2019 by race/ethnicity looks like the average case in years 2011 and 2012. The results from this approach (not displayed) show minimal impact on the racial disparity estimates presented.
Case 1:08-cv-01034-AT Document 853-1 Filed 09/01/21 Page 27 of 69

25
falsely reject the null hypothesis of no racial disparity in outcomes in five out of 100 tests.14
Finally, we also note when yearly fluctuations in the numbers of stop reports and estimated counts
of undocumented stops influence the statistical significance of outcome tests. Larger numbers of
cases reduce standard errors around point estimates and, in turn, make it easier to reject null
hypotheses at the established p<.01 level. In these situations, statistically significant results do not
necessarily support substantive conclusions about racial disparities associated with a specific
outcome test in a particular year.
IV. RESULTS
A. Frisk Disparities This section presents the results of the multivariate logistic regression analyses of racial
and ethnic disparities in frisk rates each year during NYPD stops. Table 3 shows the results for
disparities in frisks for Black subjects compared to White/Other subjects, before and after adjusting
for stop context each year. Column 1 shows the unadjusted disparities, or the differences in
averages without controlling for any stop contexts. Column 2 shows disparities after adjusting for
stop context, and Column 3 shows the disparities after doubly robust (DR) comparison. In each
year, Blacks have a higher frisk rate than White/Other racial groups. The rate of frisks for Blacks
stopped by the NYPD ranges from a low of 61.3 percent in 2013 to a high of 71.2 percent in 2015,
compared to 48.7 percent and 57.8 percent for White/Other racial groups. The adjusted disparities
shown in Column 3 indicates that the differences in frisk rates were statistically significant in 2013
and 2014, but were no longer statistically significant from 2015 through 2019.
14 Some have argued that the threshold for the discovery of “new effects” should be p<.005 (Benjamin et al., 2018). Since these analyses are a reproduction of existing findings of racial disparities accepted by the Court, the p<.005 is too high a threshold for rejecting the null hypothesis of no racial disparity between Blacks and Hispanics and White/Others in stop outcomes.
Case 1:08-cv-01034-AT Document 853-1 Filed 09/01/21 Page 28 of 69

26
Table 3. Frisk Rates for Blacks vs. Whites/Others, 2013-2019 (1) (2) (3) Frisk No Controls Controls DR 2013 Black (OR) 1.666** 1.212** 1.248** (0.0213) (0.0213) (0.0350) White/White/Other Mean 0.487 0.487 0.576 Black Mean 0.613 0.613 0.613 Observations 136921 136471 136471 2014 Black (OR) 1.698** 1.157** 1.192** (0.0434) (0.0396) (0.0660) White/Other Mean 0.578 0.578 0.673 Black Mean 0.699 0.699 0.699 Observations 33298 33196 33196 2015 Black (OR) 1.830** 1.207** 1.134 (0.0685) (0.0583) (0.0778) White/Other Mean 0.575 0.575 0.696 Black Mean 0.712 0.713 0.713 Observations 16064 15977 15977 2016 Black (OR) 1.661** 1.185** 1.031 (0.0825) (0.0761) (0.0934) White/Other Mean 0.547 0.547 0.667 Black Mean 0.667 0.668 0.668 Observations 8778 8750 8750 2017 Black (OR) 1.672** 1.188 1.255 (0.0971) (0.0917) (0.153) White/Other Mean 0.491 0.494 0.580 Black Mean 0.618 0.616 0.616 Observations 8062 7335 7335 2018 Black (OR) 1.965** 1.342** 1.023 (0.118) (0.107) (0.115) White/Other Mean 0.456 0.456 0.633 Black Mean 0.623 0.626 0.626 Observations 7619 7031 7031 2019 Black (OR) 1.669** 1.002 1.235 (0.0917) (0.0745) (0.145) White/Other Mean 0.452 0.451 0.545 Black Mean 0.580 0.582 0.582 Observations 9590 8814 8814
Case 1:08-cv-01034-AT Document 853-1 Filed 09/01/21 Page 29 of 69

27
Note: OR=Odds Ratios; standard errors in parentheses; effective sample size from observations is lower than actual observations due to weighting. Estimates in column 2 include major crime suspected; day of the week; patrol shift; housing, transit, or other location; gender of person stopped; age of person stopped; SQF based on radio run; precinct location. DR=doubly robust and includes all control variables and entropy weight. **p < .01
The pattern of frisk disparities after adjusting for similarly-situated stops context is shown
graphically in Figure 2. Figure 2 shows that by 2015, the Black v. White/Other frisk rates are no
longer substantively different, as the 95 percent confidence intervals overlap, and that frisk rates
reflect an average absolute difference of less than 1 to 3.7 percentage points between groups.
Table 4 shows how undocumented stops in 2016-2019 may have potentially impacted
racial disparity estimates in frisks after reweighting the 2016-2019 stop distribution to be similar
to the distribution of 2013 stops (Column 1), or by assuming that undocumented stops occur at
rates similar to those found in investigations of CCRB complaints (7%) (Column 2), RAND audits
(36%) (Column 3), and the BWC experiment (39%) (Column 4). The results indicate that frisk
disparities for Black subjects relative to White/Other subjects were not statistically different from
.5.5
5.6
.65
.7Av
erag
e
2013 2014 2015 2016 2017 2018 2019Frisk
White/Other Black
DR=Doubly Robust Model with 95% Confidence Intervals
Figure 2: Frisk Rates Over Time
Case 1:08-cv-01034-AT Document 853-1 Filed 09/01/21 Page 30 of 69

28
each other after reweighting stops from 2016 to 2019 to be similar to stops made in 2013 (Column
1). Mean frisk differences between the two groups were on the order of 2 to 5 percentage points.
With the one-year exception of 2017, reweighting the 2016-2019 stop distribution by the
undocumented stop rate suggested by the CCRB complaint investigations (7%) did not produce
significant frisk disparities between Black subjects and White/Other subjects. However,
statistically significant frisk disparities are apparent when the RAND (36%) and BWC (39%)
undocumented stop rates are applied. Specifically, the disparity in frisks between Black stop
subjects and White/Other stop subjects moves to a range of 8-14 percentage points if one assumes
that 2016-2019 stops are undocumented at levels found in the RAND audits and BWC experiment
(Columns 3 and 4).
Table 4. Frisk of Blacks vs. Whites/Others Adjusting for Rates of Undocumented Stops, 2016-2019
(1) (2) (3) (4) Frisk 2013 CCRB RAND BWC 2016 White/Other Mean 0.656 0.628 0.470 0.454 Black Mean 0.655 0.645 0.552** 0.543** Observations 8750 2017 White/Other Mean 0.619 0.543 0.392 0.376 Black Mean 0.641 0.597** 0.520** 0.512** Observations 7335 2018 White/Other Mean 0.586 0.594 0.432 0.416 Black Mean 0.631 0.607 0.529** 0.521** Observations 7031 2019 White/Other Mean 0.559 0.511 0.371 0.356 Black Mean 0.600 0.565 0.496** 0.489** Observations 8814
Note: Effective sample size from observations is lower than actual observations due to weighting. Column 1 estimates include: entropy weight for comparability to 2013 stop contexts*entropy weight for White/Other to be similar to Black stops; major crime suspected; day of the week; patrol shift; housing, transit, or other location; gender of person stopped; age of person stopped; SQF based on radio run; precinct location. DR=doubly robust and includes all control variables and entropy weight. **p < .01
Case 1:08-cv-01034-AT Document 853-1 Filed 09/01/21 Page 31 of 69

29
Table 5 shows the results for frisks for Hispanic stop subjects relative to White/Other
subjects. The results show that there are statistically significant disparities in frisk rates over time
when no controls are included in the analysis. However, frisk rate differences between Hispanic
stop subjects and White/Other stop subjects shrink substantially when control variables are
included in the analysis, and the differences are not statistically significant in 2017 and 2019. When
frisk rates for Hispanic subjects are compared to frisk rates for White/Other subjects stopped in
similar contexts (Column 3), Hispanics are more likely to be frisked in 2013 and 2014 (2%-4%
points), but these differences are no longer statistically significant between 2015 and 2019.
Table 5. Frisk Outcomes for Hispanics Compared to Whites/Others, 2013-2019 (1) (2) (3) Frisk No Controls Controls DR 2013 Hispanic (OR) 1.450** 1.117** 1.109** (0.0204) (0.0198) (0.0258) White/Other Mean 0.487 0.562 0.562 Hispanic Mean 0.579 0.580 0.580 Observations 87402 87207 87207 2014 Hispanic (OR) 1.375** 1.095** 1.170** (0.0391) (0.0383) (0.0546) White/Other Mean 0.578 0.627 0.627 Hispanic Mean 0.653 0.653 0.653 Observations 21468 21415 21415 2015 Hispanic (OR) 1.525** 1.161** 1.141 (0.0628) (0.0579) (0.0744) White/Other Mean 0.575 0.652 0.652 Hispanic Mean 0.674 0.674 0.674 Observations 10613 10565 10565 2016 Hispanic (OR) 1.537** 1.200** 1.226 (0.0839) (0.0815) (0.106) White/Other Mean 0.547 0.612 0.612 Hispanic Mean 0.650 0.649 0.649 Observations 5906 5884 5884 2017 Hispanic (OR) 1.761** 1.234 1.203 (0.110) (0.104) (0.144)
Case 1:08-cv-01034-AT Document 853-1 Filed 09/01/21 Page 32 of 69

30
White/Other Mean 0.491 0.601 0.601 Hispanic Mean 0.630 0.633 0.633 Observations 5034 4633 4633 2018 Hispanic (OR) 1.723** 1.280** 1.035 (0.111) (0.110) (0.123) White/Other Mean 0.456 0.588 0.588 Hispanic Mean 0.591 0.595 0.595 Observations 4767 4446 4446 2019 Hispanic (OR) 1.718** 1.225 1.258 (0.103) (0.0964) (0.134) White/Other Mean 0.452 0.540 0.540 Hispanic Mean 0.587 0.582 0.582 Observations 5478 5076 5076
Note: OR=Odds Ratio; standard errors in parentheses; effective sample size from observations is lower than actual observations due to weighting. Estimates in column 2 include major crime suspected; day of the week; patrol shift; housing, transit, or other location; gender of person stopped; age of person stopped; SQF based on radio run; precinct location. DR=doubly robust and includes all control variables and entropy weight. **p < .01
Figure 3 shows the frisk rates from the DR estimates with their 95 percent confidence
intervals between Hispanics and White/Other groups. The results make it clear that the disparities
that existed from 2013 to 2014 shrink over time, even as the overall frisk rates increase in 2015
and subsequently decline through 2019.
Case 1:08-cv-01034-AT Document 853-1 Filed 09/01/21 Page 33 of 69

31
Table 6 shows the results for frisk outcomes for Hispanic subjects when compared to
similarly situated White/Other subjects after adjusting 2016-2019 stops contexts to be similar to
stop contexts that occurred in 2013, as well as comparisons of frisks assuming that undocumented
stops occur at rates reported from CCRB complaints, RAND audits, and the BWC experiment.
The results indicate that frisk disparities for Hispanic subjects relative to White/Other subjects
were not statistically different from each other after reweighting stops from 2016 to 2019 to be
similar to stops made in 2013 (Column 1). Nor were the disparities statistically significant after
reweighting the 2016-2019 stop distribution by the undocumented stop rate suggested by the
CCRB complaints (7%) (Column 2). The results from the estimates of the disparities for Hispanics
compared to White/Other subjects did show disparities in frisk rates when accounting for
undocumented stop rates at levels found in RAND audits and the BWC experiment in three out of
four years (Columns 3 and 4).
Table 6: Frisk of Hispanics vs. Whites/Others Adjusting for
.5.5
5.6
.65
.7Av
erag
e
2013 2014 2015 2016 2017 2018 2019Frisk
White/Other Hispanic
DR=Doubly Robust Model with 95% Confidence Intervals
Figure 3: Frisk Rates Over Time
Case 1:08-cv-01034-AT Document 853-1 Filed 09/01/21 Page 34 of 69

32
Rates of Undocumented Stops, 2016-2019 (1) (2) (3) (4) Frisk 2013 CCRB RAND BWC 2016 White/Other Mean 0.598 0.578 0.432 0.417 Hispanic Mean 0.634 0.617 0.484** 0.470** Observations 5884 2017 White/Other Mean 0.572 0.563 0.406 0.390 Hispanic Mean 0.630 0.603 0.476** 0.463** Observations 4633 2018 White/Other Mean 0.523 0.552 0.402 0.386 Hispanic Mean 0.555 0.566 0.447 0.435 Observations 4446 2019 White/Other Mean 0.511 0.506 0.367 0.352 Hispanic Mean 0.553 0.553 0.434** 0.421** Observations 5076
Note: Effective sample size from observations is lower than actual observations due to weighting. Column 1 estimates include: entropy weight for comparability to 2013 stop contexts*entropy weight for White/Other to be similar to Hispanic stops; major crime suspected; day of the week; patrol shift; housing, transit, or other location; gender of person stopped; age of person stopped; SQF based on radio run; precinct location. DR=doubly robust and includes all control variables and entropy weight. **p < .01
B. Search Disparities
Table 7 shows the comparative results for search rates for Black stop subjects relative to
White/Other stop subjects. In 2013 to 2015, Black stop subjects had a slightly lower search rate
when compared to similarly situated White/Other stop subjects. The adjusted differences were on
the order of 0.5 to 1.9 percentage points.15 In 2016 to 2019, after adjusting for stop contexts, the
disparities in searches switches direction and indicates that Black stop subjects were slightly more
likely to be searched. However, across the entire time period, search rates do not appear to be
significantly different between Black subjects and White/Other subjects stopped in similar
contexts.
Table 7. Search Rates for Blacks ss. Whites/Others, 2013-2019
15 The statistically significant differences (p<.01) for DR adjusted search outcomes in 2013 is a result of the number of observations being substantially larger.
Case 1:08-cv-01034-AT Document 853-1 Filed 09/01/21 Page 35 of 69

33
(1) (2) (3) Search No Controls Controls DR 2013 Black (OR) 0.953 0.939 0.882** (0.0207) (0.0246) (0.0344) White/Other Mean 0.0960 0.0959 0.103 Black Mean 0.0919 0.0920 0.092 Observations 136921 136471 136471 2014 Black (OR) 1.099** 0.958 0.865 (0.0388) (0.0415) (0.0588) White/Other Mean 0.140 0.140 0.171 Black Mean 0.151 0.152 0.152 Observations 33298 33196 33196 2015 Black (OR) 1.178** 1.032 0.975 (0.0578) (0.0616) (0.0927) White/Other Mean 0.157 0.156 0.185 Black Mean 0.179 0.180 0.180 Observations 16064 15977 15977 2016 Black (OR) 0.984 0.988 1.087 (0.0568) (0.0694) (0.115) White/Other Mean 0.232 0.232 0.216 Black Mean 0.229 0.230 0.230 Observations 8778 8723 8723 2017 Black (OR) 0.935 1.072 0.995 (0.0572) (0.0820) (0.130) White/Other Mean 0.337 0.346 0.334 Black Mean 0.322 0.336 0.336 Observations 8062 7335 7335 2018 Black (OR) 1.006 1.232** 1.218 (0.0641) (0.0972) (0.165) White/Other Mean 0.321 0.334 0.302 Black Mean 0.323 0.336 0.336 Observations 7619 7027 7027 2019 Black (OR) 0.889 1.059 1.153 (0.0500) (0.0719) (0.131) White/Other Mean 0.385 0.391 0.347 Black Mean 0.358 0.375 0.375 Observations 9590 8814 8814
Note: OR=Odds Ratio; standard errors in parentheses; effective sample size from observations is lower than actual observations due to weighting. All estimates include major crime suspected; day of the week; patrol shift; housing,
Case 1:08-cv-01034-AT Document 853-1 Filed 09/01/21 Page 36 of 69
34
transit, or other location; gender of person stopped; age of person stopped; SQF based on radio run; precinct location. DR=doubly robust and includes all control variables and entropy weight. **p < .01
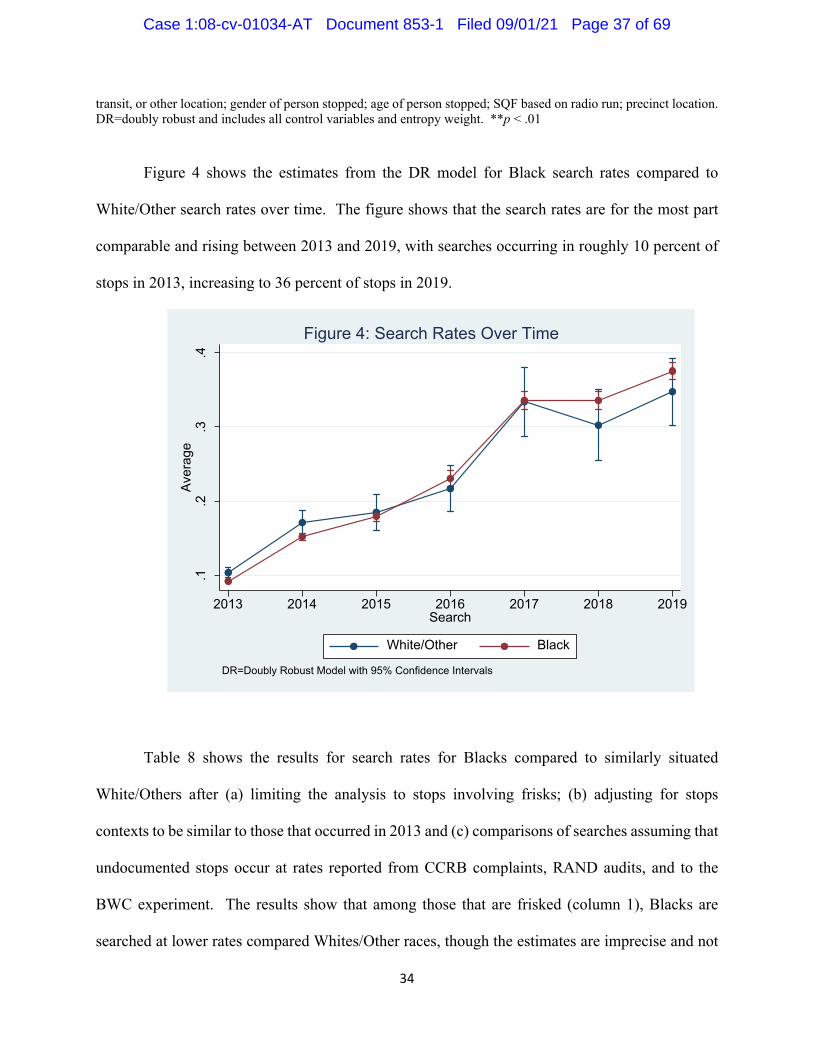
Figure 4 shows the estimates from the DR model for Black search rates compared to
White/Other search rates over time. The figure shows that the search rates are for the most part
comparable and rising between 2013 and 2019, with searches occurring in roughly 10 percent of
stops in 2013, increasing to 36 percent of stops in 2019.
Table 8 shows the results for search rates for Blacks compared to similarly situated
White/Others after (a) limiting the analysis to stops involving frisks; (b) adjusting for stops
contexts to be similar to those that occurred in 2013 and (c) comparisons of searches assuming that
undocumented stops occur at rates reported from CCRB complaints, RAND audits, and to the
BWC experiment. The results show that among those that are frisked (column 1), Blacks are
searched at lower rates compared Whites/Other races, though the estimates are imprecise and not
.1.2
.3.4
Aver
age
2013 2014 2015 2016 2017 2018 2019Search
White/Other Black
DR=Doubly Robust Model with 95% Confidence Intervals
Figure 4: Search Rates Over Time
Case 1:08-cv-01034-AT Document 853-1 Filed 09/01/21 Page 37 of 69

35
statistically significant in any year. For the analysis of cases adjusted for contexts similar to 2013,
the estimates show Blacks have higher search rates in three out of four years, though the estimates
are not statistically significant. When one assumes undocumented rates at thresholds seen in
RAND audits and BWC experiment (but not the CCRB estimate), the disparities in search rates
between Blacks and Whites/Others grow substantially as the level of assumed undocumented stops
increases, to approximately a 5-9 percentage point (absolute) higher rate of searches for Blacks.
Table 8. Search of Blacks vs. Whites/Others Adjusting for Rates of Undocumented Stops, 2016-2019
(1) (2) (3) (4) (5) Search Frisk 2013 CCRB RAND BWC 2016 White/Other Mean 0.340 0.215 0.203 0.152 0.147 Black Mean 0.297 0.237 0.222 0.190 0.187 Observations 5554 8723 2017 White/Other Mean 0.436 0.365 0.313 0.226 0.217 Black Mean 0.386 0.332 0.326 0.284 0.279 Observations 4350 7335 2018 White/Other Mean 0.470 0.314 0.284 0.206 0.198 Black Mean 0.394 0.357 0.325 0.284** 0.279** Observations 4185 7027 2019 White/Other Mean 0.525 0.326 0.326 0.236 0.227 Black Mean 0.444 0.408 0.365 0.320** 0.315** Observations 4929 8814
Note: Effective sample size from observations is lower than actual observations due to weighting. Column 1 and 2 estimates include: entropy weight for comparability to 2013 stop contexts*entropy weight for White/Other to be similar to Black stops; major crime suspected; day of the week; patrol shift; housing, transit, or other location; gender of person stopped; age of person stopped; SQF based on radio run; precinct location. DR=doubly robust and includes all control variables and entropy weight. **p < .01
Table 9 shows the results for search rates for Hispanic stop subjects compared to
White/Other stop subjects. Between 2013 and 2019, Hispanic stop subjects had similar search
rates when compared to similarly situated stop subjects from White/Other racial groups. The
adjusted differences are on the order of 0 to 1 percentage point difference, suggesting that search
rates are similar for Hispanics compared to Whites/Others in similar documented stop contexts.
Case 1:08-cv-01034-AT Document 853-1 Filed 09/01/21 Page 38 of 69

36
Table 9. Search Rates for Hispanics vs. Whites/Others, 2013-2019 (1) (2) (3) Search No Controls Controls DR 2013 Hispanic (OR) 1.082** 0.933 0.935 (0.0254) (0.0251) (0.0325) White/Other Mean 0.096 0.110 0.110 Hispanic Mean 0.103 0.103 0.103 Observations 87402 87207 87207 2014 Hispanic (OR) 1.426** 1.036 1.005 (0.0543) (0.0462) (0.0643) White/Other Mean 0.140 0.188 0.188 Hispanic Mean 0.188 0.188 0.188 Observations 21468 21352 21352 2015 Hispanic (OR) 1.501** 1.247** 1.294** (0.0786) (0.0763) (0.109) White/Other Mean 0.157 0.181 0.181 Hispanic Mean 0.218 0.219 0.219 Observations 10613 10549 10549 2016 Hispanic (OR) 1.158 1.013 1.069 (0.0723) (0.0758) (0.104) White/Other Mean 0.232 0.249 0.249 Hispanic Mean 0.259 0.262 0.262 Observations 5906 5836 5836 2017 Hispanic (OR) 1.093 1.122 0.955 (0.0715) (0.0933) (0.127) White/Other Mean 0.337 0.373 0.373 Hispanic Mean 0.357 0.366 0.366 Observations 5034 4628 4628 2018 Hispanic (OR) 1.172 1.220 1.252 (0.0796) (0.103) (0.146) White/Other Mean 0.321 0.324 0.324 Hispanic Mean 0.357 0.367 0.367 Observations 4767 4446 4446 2019 Hispanic (OR) 1.023 1.170 1.128 (0.0623) (0.0852) (0.118) White/Other Mean 0.385 0.379 0.379 Hispanic Mean 0.391 0.405 0.405 Observations 5478 5076 5076
Case 1:08-cv-01034-AT Document 853-1 Filed 09/01/21 Page 39 of 69

37
Note: OR=Odds Ratio; standard errors in parentheses; effective sample size from observations is lower than actual observations due to weighting. Estimates in column 2 include major crime suspected; day of the week; patrol shift; housing, transit, or other location; gender of person stopped; age of person stopped; SQF based on radio run; precinct location. DR=doubly robust and includes all control variables and entropy weight. **p < .01
Figure 5 shows the search rates for Hispanic stop subjects compared to White/Other stop
subjects over time taken from the DR estimates. The search rates are, for the most part, comparable
between Hispanics and Whites/Others and rising between 2013 and 2019, from 10 percent of stops
in 2013 to 39 percent of stops in 2019.
Table 10 shows the results for estimating Hispanic compared to White/Other racial groups
on disparities in searches among those (a) that are frisked, (b) assuming stops occur in similar
contexts to 2013, and (c) assuming undocumented stops occur at rates similar to CCRB, RAND,
or BWC estimates. In most cases, the search rates are slightly lower for Hispanics. In 2018 and
2019, however, the search rates are marginally higher (4 to 6 percentage points absolute difference)
.1.2
.3.4
Ave
rage
2013 2014 2015 2016 2017 2018 2019Search
White/Other Hispanic
DR=Doubly Robust Model with 95% Confidence Intervals
Figure 5: Search Rates Over Time
Case 1:08-cv-01034-AT Document 853-1 Filed 09/01/21 Page 40 of 69

38
for Hispanics when the rate of undocumented stops is assumed to be at levels found in RAND and
BWC audits. For 2018, the search rate disparities may be substantially impacted by the level of
undocumented stops.
Table 10. Search Rates Hispanic vs. White/Other Adjusting for Rates of Undocumented Stops, 2016-2019
(1) (2) (3) (4) (5) Search Frisk 2013 CCRB RAND BWC 2016 White/Other Mean 0.341 0.272 0.233 0.174 0.168 Hispanic Mean 0.337 0.282 0.247 0.193 0.188 Observations 3563 5836 2017 White/Other Mean 0.438 0.411 0.349 0.252 0.242 Hispanic Mean 0.405 0.376 0.348 0.275 0.268 Observations 2725 4628 2018 White/Other Mean 0.470 0.376 0.305 0.222 0.213 Hispanic Mean 0.434 0.400 0.350 0.276** 0.269** Observations 2464 4446 2019 White/Other Mean 0.525 0.381 0.355 0.257 0.247 Hispanic Mean 0.474 0.419 0.385 0.301** 0.293** Observations 2758 5076
Note: Effective sample size from observations is lower than actual observations due to weighting. Column 1 and 2 estimates include: entropy weight for comparability to 2013 stop contexts*entropy weight for White/Other to be similar to Hispanic stops; major crime suspected; day of the week; patrol shift; housing, transit, or other location; gender of person stopped; age of person stopped; SQF based on radio run; precinct location. DR=doubly robust and includes all control variables and entropy weight. **p < .01
C. Summons Disparities
Table 11 shows the results from a comparison of disparities in summons rates issued to
Black stop subjects as compared to White/Other stop subjects. In 2013, the results show that Black
stop subjects were significantly less likely to receive a summons relative to White/Other stop
subjects, with an adjusted summons rate for Blacks that was 0.6 percentage points lower. In
general, the year-to-year patterns between 2014 and 2019 show that the disparities in summons
rates are small and usually not significantly different between Blacks and Whites/Others who were
stopped overall or after adjusting for similar stop contexts. However, in 2019, the DR adjustment
Case 1:08-cv-01034-AT Document 853-1 Filed 09/01/21 Page 41 of 69

39
suggests that Black subjects were 1.4 percentage points more likely to receive a summons during
a stop relative to similarly situated White/Other subjects.
Table 11. Summons Rates for Blacks vs. Whites/Others, 2013-2019 (1) (2) (3) Summons No Controls Controls DR 2013 Black (OR) 0.877** 0.859** 0.834** (0.0298) (0.0366) (0.0556) White/Other Mean 0.037 0.037 0.039 Black Mean 0.033 0.033 0.033 Observations 136921 136471 136471 2014 Black (OR) 1.039 0.882 1.118 (0.0831) (0.0879) (0.145) White/Other Mean 0.024 0.024 0.023 Black Mean 0.025 0.025 0.025 Observations 33298 32796 32796 2015 Black (OR) 1.142 0.968 1.045 (0.133) (0.137) (0.226) White/Other Mean 0.023 0.025 0.029 Black Mean 0.027 0.030 0.030 Observations 16064 14506 14506 2016 Black (OR) 1.389 0.920 1.402 (0.218) (0.171) (0.297) White/Other Mean 0.022 0.026 0.026 Black Mean 0.031 0.035 0.035 Observations 8778 7617 7617 2017 Black (OR) 0.983 0.707 0.586 (0.157) (0.142) (0.162) White/Other Mean 0.034 0.041 0.059 Black Mean 0.033 0.037 0.037 Observations 8062 6660 6660 2018 Black (OR) 1.178 0.890 1.212 (0.230) (0.211) (0.323) White/Other Mean 0.023 0.032 0.028 Black Mean 0.027 0.033 0.033 Observations 7619 5658 5658 2019 Black (OR) 1.524 1.393 2.491** (0.294) (0.332) (0.584)
Case 1:08-cv-01034-AT Document 853-1 Filed 09/01/21 Page 42 of 69

40
White/Other Mean 0.019 0.025 0.020 Black Mean 0.029 0.034 0.034 Observations 9590 7675 7675
Note: OR=Odds Ratio; standard errors in parentheses; effective sample size from observations is lower than actual observations due to weighting. Estimates in column 2 include major crime suspected; day of the week; patrol shift; housing, transit, or other location; gender of person stopped; age of person stopped; SQF based on radio run; precinct location. DR=doubly robust and includes all control variables and entropy weight. **p < .01
Figure 6 shows the visualization of the year-to-year differences in summons rates between
Blacks and White/Other subjects stopped under similar contexts. The results show that 2019 is
the only year in which the summons rate was significantly higher for Blacks compared to
Whites/Others stopped in the same context.
Table 12 shows the results for estimating Black compared to White/Other racial groups on
disparities in summons rates among (a) those that are frisked, (b) assuming stops occur in similar
contexts to 2013, and (c) assuming undocumented stops occur at rates similar to CCRB, RAND,
or BWC estimates. The results show that among those that are frisked, summons rates are not
0.0
2.0
4.0
6.0
8Av
erag
e
2013 2014 2015 2016 2017 2018 2019Summons
White/Other Black
DR=Doubly Robust Model with 95% Confidence Intervals
Figure 6. Summons Rates Over Time
Case 1:08-cv-01034-AT Document 853-1 Filed 09/01/21 Page 43 of 69

41
significantly different between Black and White/Other groups, and that disparities appear to be
largely unaffected by assumptions about undocumented stops.
Table 12. Summons Rates for Blacks vs. Whites/Others Given Frisk, or Adjusting for Rate of Undocumented Stops, 2016-2019
(1) (2) (3) (4) (5) Summons Frisk 2013 CCRB RAND BWC 2016 White/Other Mean 0.036 0.020 0.022 0.016 0.016 Black Mean 0.045 0.035 0.030 0.026 0.025 Observations 4872 7617 2017 White/Other Mean 0.064 0.042 0.051 0.037 0.035 Black Mean 0.050 0.038 0.033 0.029 0.029 Observations 3810 6660 2018 White/Other Mean 0.058 0.020 0.022 0.016 0.015 Black Mean 0.043 0.032 0.027 0.023 0.023 Observations 3302 5658 2019 White/Other Mean 0.037 0.021 0.017 0.012 0.012 Black Mean 0.046 0.042 0.030 0.026 0.026 Observations 4093 7675
Note: Effective sample size from observations is lower than actual observations due to weighting. Column 2 estimates include: entropy weight for comparability to 2013 stop contexts*entropy weight for White/Other to be similar to Black stops; major crime suspected; day of the week; patrol shift; housing, transit, or other location; gender of person stopped; age of person stopped; SQF based on radio run; precinct location. DR=doubly robust and includes all control variables and entropy weight. **p < .01
Table 13 shows the results from a comparison of disparities in summons rates over time
between Hispanic stop subjects and White/Other stop subjects. The results show adjusted
summons rates for Hispanics were not significantly different than summons rates for White/Other
groups stopped in similar contexts. The differences that exist are on the order of less than 1
percentage point.
Table 13. Summons Rates for Hispanics vs. Whites/Others, 2013-2019 (1) (2) (3) Summons No Controls Controls DR 2013 Hispanic (OR) 1.098 1.048 0.995 (0.0398) (0.0432) (0.0563) White/Other Mean 0.0375 0.0413 0.0413
Case 1:08-cv-01034-AT Document 853-1 Filed 09/01/21 Page 44 of 69

42
Hispanic Mean 0.0411 0.0411 0.0411 Observations 87402 87207 87207 2014 Hispanic (OR) 1.291** 1.168 1.085 (0.111) (0.116) (0.134) White/Other Mean 0.0242 0.0303 0.0303 Hispanic Mean 0.0310 0.0327 0.0327 Observations 21468 20329 20329 2015 Hispanic (OR) 1.074 0.946 0.840 (0.139) (0.145) (0.180) White/Other Mean 0.0238 0.0366 0.0366 Hispanic Mean 0.0255 0.0293 0.0293 Observations 10613 9349 9349 2016 Hispanic (OR) 1.353 1.138 1.066 (0.230) (0.227) (0.268) White/Other Mean 0.0228 0.0373 0.0373 Hispanic Mean 0.0306 0.0384 0.0384 Observations 5906 4753 4753 2017 Hispanic (OR) 1.012 0.916 0.823 (0.173) (0.199) (0.229) White/Other Mean 0.0341 0.0524 0.0524 Hispanic Mean 0.0345 0.0427 0.0427 Observations 5034 3758 3758 2018 Hispanic (OR) 1.148 0.810 0.849 (0.239) (0.212) (0.232) White/Other Mean 0.0232 0.0450 0.0450 Hispanic Mean 0.0266 0.0348 0.0348 Observations 4767 3306 3306 2019 Hispanic (OR) 1.212 1.026 1.062 (0.255) (0.275) (0.305) White/Other Mean 0.0193 0.0371 0.0371 Hispanic Mean 0.0233 0.0354 0.0354 Observations 5478 3154 3154
Note: OR=Odds Ratio; standard errors in parentheses; effective sample size from observations is lower than actual observations due to weighting. All estimates include major crime suspected; day of the week; patrol shift; housing, transit, or other location; gender of person stopped; age of person stopped; SQF based on radio run; precinct location. DR=doubly robust and includes all control variables and entropy weight. **p < .01 Figure 7 shows that summons rates between Hispanics and Whites/Others stopped in
similar contexts are statistically indistinguishable from each other over time.
Case 1:08-cv-01034-AT Document 853-1 Filed 09/01/21 Page 45 of 69
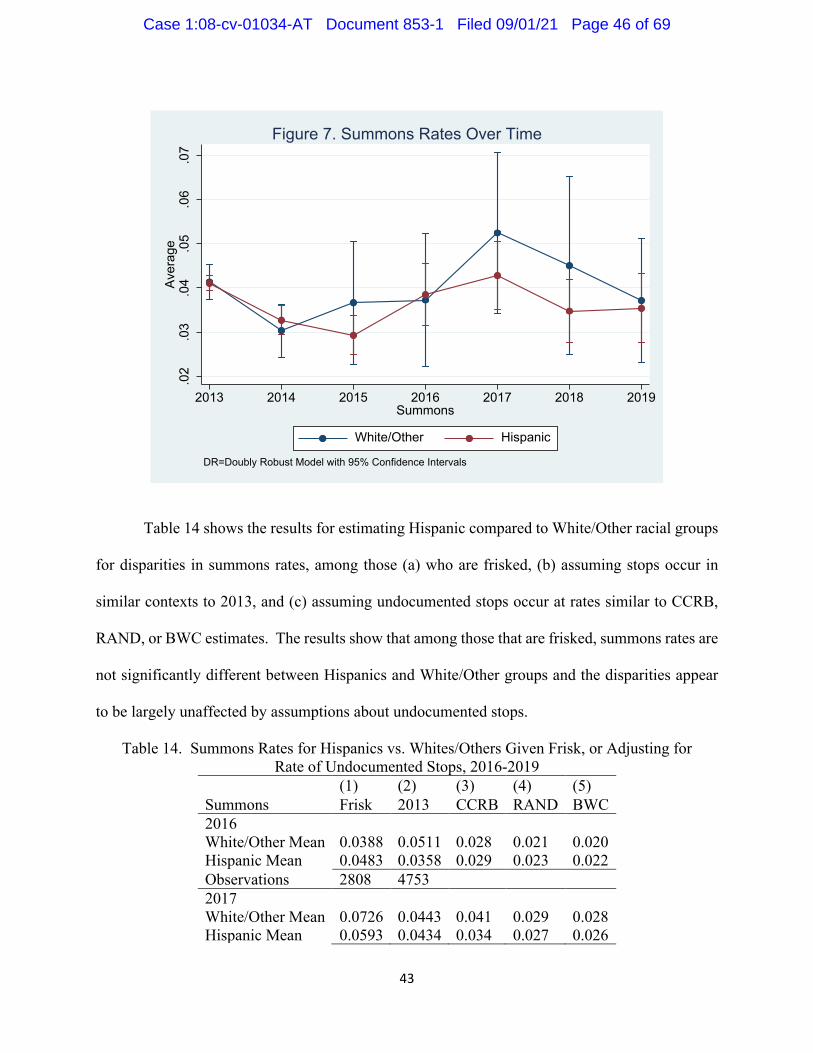
43
Table 14 shows the results for estimating Hispanic compared to White/Other racial groups
for disparities in summons rates, among those (a) who are frisked, (b) assuming stops occur in
similar contexts to 2013, and (c) assuming undocumented stops occur at rates similar to CCRB,
RAND, or BWC estimates. The results show that among those that are frisked, summons rates are
not significantly different between Hispanics and White/Other groups and the disparities appear
to be largely unaffected by assumptions about undocumented stops.
Table 14. Summons Rates for Hispanics vs. Whites/Others Given Frisk, or Adjusting for Rate of Undocumented Stops, 2016-2019
(1) (2) (3) (4) (5) Summons Frisk 2013 CCRB RAND BWC 2016 White/Other Mean 0.0388 0.0511 0.028 0.021 0.020 Hispanic Mean 0.0483 0.0358 0.029 0.023 0.022 Observations 2808 4753 2017 White/Other Mean 0.0726 0.0443 0.041 0.029 0.028 Hispanic Mean 0.0593 0.0434 0.034 0.027 0.026
.02
.03
.04
.05
.06
.07
Aver
age
2013 2014 2015 2016 2017 2018 2019Summons
White/Other Hispanic
DR=Doubly Robust Model with 95% Confidence Intervals
Figure 7. Summons Rates Over Time
Case 1:08-cv-01034-AT Document 853-1 Filed 09/01/21 Page 46 of 69

44
Observations 1959 3758 2018 White/Other Mean 0.0714 0.0338 0.034 0.025 0.024 Hispanic Mean 0.0439 0.0452 0.026 0.021 0.020 Observations 1682 3306 2019 White/Other Mean 0.0444 0.0472 0.023 0.016 0.016 Hispanic Mean 0.0515 0.0425 0.022 0.017 0.017 Observations 1701 3154
Note: Effective sample size from observations is lower than actual observations due to weighting. Column 1 estimates include: entropy weight for comparability to 2013 stop contexts*entropy weight for White/Other to be similar to Hispanic stops; major crime suspected; day of the week; patrol shift; housing, transit, or other location; gender of person stopped; age of person stopped; SQF based on radio run; precinct location. DR=doubly robust and includes all control variables and entropy weight. **p < .01
D. Arrest Disparities
Table 15 shows the results for disparities in arrests for Blacks compared to Whites/Others
before and after adjusting for stop context each year. The rate of arrest for Blacks stopped by the
NYPD ranges from a low of 7.3 percent in 2013 to a high of 31.3 percent in 2019, and is similar
to the rate for Whites/Others in unadjusted and adjusted comparisons. The one exception is 2018,
when the arrest rate for Blacks appears to be 7.6 percentage points higher than for similarly situated
White/Other groups.
Table 15. Arrest Rates for Blacks, 2013-2019
(1) (2) (3) Arrest No Controls Controls DR 2013 Black (OR) 0.892** 1.008 0.928 (0.0210) (0.0291) (0.0416) White/Other Mean 0.0815 0.0816 0.0790 Black Mean 0.0733 0.0734 0.0734 Observations 136921 136471 136471 2014 Black (OR) 1.158** 0.954 0.950 (0.0427) (0.0461) (0.0740) White/Other Mean 0.125 0.125 0.147 Black Mean 0.142 0.142 0.142 Observations 33298 33138 33138 2015 Black (OR) 1.292** 1.067 0.886
Case 1:08-cv-01034-AT Document 853-1 Filed 09/01/21 Page 47 of 69

45
(0.0670) (0.0697) (0.0973) White/Other Mean 0.134 0.134 0.183 Black Mean 0.167 0.167 0.167 Observations 16064 15977 15977 2016 Black (OR) 1.077 1.061 1.009 (0.0666) (0.0835) (0.119) White/Other Mean 0.189 0.189 0.200 Black Mean 0.201 0.202 0.202 Observations 8778 8723 8723 2017 Black (OR) 0.921 1.137 1.199 (0.0582) (0.0917) (0.162) White/Other Mean 0.299 0.313 0.265 Black Mean 0.282 0.297 0.297 Observations 8062 7315 7315 2018 Black (OR) 1.024 1.335** 1.623** (0.0686) (0.110) (0.204) White/Other Mean 0.269 0.282 0.214 Black Mean 0.274 0.290 0.290 Observations 7619 7027 7027 2019 Black (OR) 0.944 1.215** 1.137 (0.0551) (0.0856) (0.136) White/Other Mean 0.326 0.333 0.309 Black Mean 0.313 0.334 0.334 Observations 9590 8814 8814
Note: OR=Odds Ratio; standard errors in parentheses; effective sample size from observations is lower than actual observations due to weighting. Estimates in column 2 include major crime suspected; day of the week; patrol shift; housing, transit, or other location; gender of person stopped; age of person stopped; SQF based on radio run; precinct location. DR=doubly robust and includes all control variables and entropy weight. **p < .01
Figure 8 shows the year-to-year adjusted Black arrest rate compared to the White/Other
arrest rate, and indicates that 2018 is the only year with a visual disparity in arrest rates.
Case 1:08-cv-01034-AT Document 853-1 Filed 09/01/21 Page 48 of 69

46
Table 16 shows the results for disparities in arrest rates between Blacks and White/Other
groups for stops with frisks, adjusted for 2013 contexts, as well as different assumptions about
undocumented stops. The results show that in 2017 to 2019, as the rate of undocumented stops is
assumed to be larger, the disparity in arrest rates grows. The results suggest that undocumented
stops may have a consequence on racial disparities in arrests among those stopped by the NYPD.
Table 16. Arrest Rates for Blacks vs. Whites/Others Given Frisk or Adjusting for Rate of Undocumented Stops, 2016-2019
(1) (2) (2) (3) (4) Arrest Frisk 2013 CCRB RAND BWC 2016 White/Other Mean 0.228 0.298 0.188 0.141 0.136 Black Mean 0.217 0.240 0.194 0.166 0.163 Observations 5536 8723 2017 White/Other Mean 0.323 0.267 0.247 0.178 0.171 Black Mean 0.289 0.276 0.287 0.250** 0.246** Observations 4340 7315 2018 White/Other Mean 0.308 0.276 0.201 0.146 0.140
0.1
.2.3
.4Av
erag
e
2013 2014 2015 2016 2017 2018 2019Arrest
White/Other Black
DR=Doubly Robust Model with 95% Confidence Intervals
Figure 8: Arrest Rates Over Time
Case 1:08-cv-01034-AT Document 853-1 Filed 09/01/21 Page 49 of 69

47
Black Mean 0.292 0.289 0.281 0.245** 0.241** Observations 4185 7027 2019 White/Other Mean 0.369 0.284 0.290 0.210 0.202 Black Mean 0.327 0.318 0.325 0.285** 0.281** Observations 4922 8814
Note: Effective sample size from observations is lower than actual observations due to weighting. Column 1 estimates include: entropy weight for comparability to 2013 stop contexts*entropy weight for White/Other to be similar to Black stops; major crime suspected; day of the week; patrol shift; housing, transit, or other location; gender of person stopped; age of person stopped; SQF based on radio run; precinct location. DR=doubly robust and includes all control variables and entropy weight. **p < .01 Table 17 shows the results from an analysis of disparities in arrest rates between Hispanics
and White/Other groups. In general, the rates of arrest are similar between groups, with the
exception of 2015 (2.9 percentage point higher) and 2018, where there appears to be a 6.8
percentage point higher rate of arrest for Hispanics compared to White/Other groups stopped in
similar contexts.
Table 17. Arrest Rates for Hispanics, 2013-2019 (1) (2) (3) Arrest No Controls Controls DR 2013 Hispanic (OR) 1.165** 0.949 1.000 (0.0292) (0.0274) (0.0373) White/Other Mean 0.0815 0.0937 0.0937 Hispanic Mean 0.0936 0.0936 0.0936 Observations 87402 87207 87207 2014 Hispanic (OR) 1.608** 1.036 1.039 (0.0632) (0.0513) (0.0725) White/Other Mean 0.125 0.184 0.184 Hispanic Mean 0.187 0.187 0.187 Observations 21468 21387 21387 2015 Hispanic (OR) 1.809** 1.272** 1.268** (0.0990) (0.0852) (0.114) White/Other Mean 0.134 0.191 0.191 Hispanic Mean 0.219 0.220 0.220 Observations 10613 10523 10523 2016 Hispanic (OR) 1.433** 1.206 1.218 (0.0943) (0.0990) (0.131) White/Other Mean 0.189 0.223 0.223
Case 1:08-cv-01034-AT Document 853-1 Filed 09/01/21 Page 50 of 69

48
Hispanic Mean 0.250 0.252 0.252 Observations 5906 5854 5854 2017 Hispanic (OR) 1.130 1.236 1.086 (0.0760) (0.108) (0.157) White/Other Mean 0.299 0.322 0.322 Hispanic Mean 0.325 0.338 0.338 Observations 5034 4624 4624 2018 Hispanic (OR) 1.193 1.320** 1.606** (0.0851) (0.118) (0.189) White/Other Mean 0.269 0.240 0.240 Hispanic Mean 0.305 0.318 0.318 Observations 4767 4430 4430 2019 Hispanic (OR) 1.030 1.257** 1.091 (0.0651) (0.0956) (0.131) White/Other Mean 0.326 0.328 0.328 Hispanic Mean 0.332 0.348 0.348 Observations 5478 5067 5067
Note: OR=Odds Ratio; standard errors in parentheses; effective sample size from observations is lower than actual observations due to weighting. Estimates in column 2 include major crime suspected; day of the week; patrol shift; housing, transit, or other location; gender of person stopped; age of person stopped; SQF based on radio run; precinct location. DR=doubly robust and includes all control variables and entropy weight. **p < .01
Figure 9 shows estimates from the DR model of arrest rates between Hispanics and
White/Others stopped in similar contexts. In general, arrest rates rise over time between 2013 and
2019. A significant but small disparity occurs in 2015, and a significant but larger disparity occurs
in 2018 with a higher rate of arrest for Hispanics.
Case 1:08-cv-01034-AT Document 853-1 Filed 09/01/21 Page 51 of 69

49
Table 18 shows the results for arrest disparities between Hispanics and Whites/Others (a)
for stops with frisks, (b) adjusted for 2013 contexts, and (c) after adjusting for the assumed rate of
undocumented stops. For 2018, the rate of undocumented stops could increase estimated
disparities in arrest rates for Hispanics compared to similarly situated Whites/Others, although the
estimated disparities do not appear to be statistically significant in 2019.
Table 18. Arrest Rates for Hispanics vs. Whites/Others Given Frisk or Adjusting for Rate of Undocumented Stops, 2016-2019
(1) (2) (3) (4) (5) Arrest Frisk 2013 CCRB RAND BWC 2016 White/Other Mean 0.230 0.277 0.210 0.157 0.151 Hispanic Mean 0.293 0.288 0.238 0.187 0.181 Observations 3561 5854 2017 White/Other Mean 0.323 0.366 0.301 0.217 0.208 Hispanic Mean 0.322 0.332 0.321 0.254 0.247 Observations 2735 4624 2018 White/Other Mean 0.315 0.331 0.224 0.163 0.157
.1.2
.3.4
Aver
age
2013 2014 2015 2016 2017 2018 2019Arrest
White/Other Hispanic
DR=Doubly Robust Model With 95% Confidence Intervals
Figure 9: Arrest Rates Over Time
Case 1:08-cv-01034-AT Document 853-1 Filed 09/01/21 Page 52 of 69

50
Hispanic Mean 0.325 0.336 0.302** 0.239** 0.232** Observations 2437 4430 2019 White/Other Mean 0.368 0.349 0.308 0.223 0.214 Hispanic Mean 0.347 0.347 0.331 0.259 0.252 Observations 2752 5067
Note: Effective sample size from observations is lower than actual observations due to weighting. Column 1 estimates include: entropy weight for comparability to 2013 stop contexts*entropy weight for White/Other to be similar to Black or Hispanic stops; major crime suspected; day of the week; patrol shift; housing, transit, or other location; gender of person stopped; age of person stopped; SQF based on radio run; precinct location. DR=doubly robust and includes all control variables and entropy weight. **p < .01
E. Use of Force Disparities Table 19 shows the results from an analysis of disparities in use of force rates between
Blacks and White/Other groups. In general, the use of force rates are higher for Blacks compared
to Whites/Others stopped in similar contexts, with the exception of 2015 when they are lower, and
the adjusted disparity is on average around 2-3 percentage points, which is not statistically
significant in all years aside from 2013, when the total volume of recorded stops was substantially
higher.
Table 19. Use of Force Rates for Blacks, 2013-2019 (1) (2) (3) Force No Controls Controls DR 2013 Black (OR) 1.280** 1.238** 1.187** (0.0246) (0.0289) (0.0429) White/Other Mean 0.119 0.119 0.129 Black Mean 0.147 0.147 0.147 Observations 136921 136471 136471 2014 Black (OR) 1.331** 1.125** 1.116 (0.0432) (0.0455) (0.0723) White/Other Mean 0.165 0.166 0.193 Black Mean 0.209 0.209 0.209 Observations 33298 33196 33196 2015 Black (OR) 1.531** 1.049 0.899 (0.0666) (0.0554) (0.0727) White/Other Mean 0.206 0.206 0.303 Black Mean 0.285 0.284 0.284 Observations 16064 15977 15977
Case 1:08-cv-01034-AT Document 853-1 Filed 09/01/21 Page 53 of 69

51
2016 Black (OR) 1.860** 1.268** 1.225 (0.118) (0.0966) (0.131) White/Other Mean 0.161 0.162 0.231 Black Mean 0.263 0.263 0.263 Observations 8778 8723 8723 2017 Black (OR) 1.174 1.090 1.174 (0.0851) (0.0948) (0.160) White/Other Mean 0.194 0.196 0.205 Black Mean 0.220 0.223 0.223 Observations 8062 7335 7335 2018 Black (OR) 1.026 1.059 1.218 (0.0745) (0.0931) (0.163) White/Other Mean 0.213 0.215 0.196 Black Mean 0.217 0.222 0.222 Observations 7619 7031 7031 2019 Black (OR) 1.068 1.038 1.188 (0.0719) (0.0829) (0.144) White/Other Mean 0.206 0.212 0.200 Black Mean 0.217 0.222 0.222 Observations 9590 8814 8814
Note: OR=Odds Ratio; standard errors in parentheses; effective sample size from observations is lower than actual observations due to weighting. Estimates in column 2 include major crime suspected; day of the week; patrol shift; housing, transit, or other location; gender of person stopped; age of person stopped; SQF based on radio run; precinct location. DR=doubly robust and includes all control variables and entropy weight. **p < .01
Case 1:08-cv-01034-AT Document 853-1 Filed 09/01/21 Page 54 of 69

52
Figure 10 shows estimates from the DR model of use of force rates between Blacks and
Whites/Others stopped in similar contexts. The graph shows that use of force rates increase as the
number of total stops recorded dropped from 2013 to 2015, suggesting that recorded stops are on
average more serious in nature in 2014 and 2015 than in 2013. Figure 10 also shows that the
adjusted disparities in use of force rates have overlapping confidence intervals, with the exception
of 2013, meaning that 95 percent of the time one cannot rule out that there was no difference in
use of force between Blacks and Whites/Others stopped in similar context.
Table 20 shows the results for use of force disparities between Blacks and White/Others
(a) who were frisked, (b) adjusted for 2013 contexts, and (c) after adjusting for the assumed rate
of undocumented stops. For all years 2016 to 2019, the rate of undocumented stops at levels
comparable to RAND and BWC estimates (but not CCRB estimates) could increase disparities in
use of force rates for Blacks compared to similarly situated Whites/Others.
.1.1
5.2
.25
.3.3
5Av
erag
e
2013 2014 2015 2016 2017 2018 2019Force
White/Other Black
DR=Doubly Robust Model With 95% Confidence Intervals
Figure 10: Use of Force Over Time
Case 1:08-cv-01034-AT Document 853-1 Filed 09/01/21 Page 55 of 69

53
Table 20. Use of Force Rates for Blacks Adjusting for Rate of Undocumented Stops, 2016-2019
(1) (2) (3) (4) (5) Force Frisk 2013 CCRB RAND BWC 2016 White/Other Mean 0.224 0.187 0.217 0.162 0.157 Black Mean 0.319 0.281 0.254 0.217** 0.213** Observations 5554 8723 2017 White/Other Mean 0.292 0.211 0.192 0.138 0.133 Black Mean 0.274 0.241 0.216 0.188 0.185** Observations 4348 7335 2018 White/Other Mean 0.333 0.227 0.184 0.134 0.128 Black Mean 0.262 0.218 0.215 0.187** 0.185** Observations 4178 7031 2019 White/Other Mean 0.306 0.201 0.187 0.136 0.130 Black Mean 0.268 0.232 0.216 0.189** 0.187** Observations 4929 8814
Note: Effective sample size from observations is lower than actual observations due to weighting. Column 2 estimates include: entropy weight for comparability to 2013 stop contexts*entropy weight for White/Other to be similar to Black stops; major crime suspected; day of the week; patrol shift; housing, transit, or other location; gender of person stopped; age of person stopped; SQF based on radio run; precinct location. DR=doubly robust and includes all control variables and entropy weight. **p < .01
Table 21 shows the results from an analysis of disparities in use of force rates between
Hispanics and Whites/Others. In general, the adjusted rates of use of force are similar between
groups, reflecting differences of less than 2 percentage points. For 2013, the difference is
statistically significant because the overall number of recorded stops is substantially higher, so the
estimated difference of 1.3 percentage points is statistically significant, even though it is in the
same range as other estimates of differences of 0.5 to 2 percentage points.
Table 21. Use of Force Rates for Hispanics, 2013-2019 (1) (2) (3) Force No Controls Controls DR 2013 Hispanic (OR) 1.468** 1.100** 1.099** (0.0303) (0.0263) (0.0356) White/Other Mean 0.119 0.153 0.153 Hispanic Mean 0.166 0.166 0.166
Case 1:08-cv-01034-AT Document 853-1 Filed 09/01/21 Page 56 of 69

54
Observations 87402 87207 87207 2014 Hispanic (OR) 1.665** 1.127** 1.156 (0.0585) (0.0469) (0.0714) White/Other Mean 0.165 0.223 0.223 Hispanic Mean 0.248 0.248 0.248 Observations 21468 21415 21415 2015 Hispanic (OR) 1.650** 1.171** 1.019 (0.0777) (0.0643) (0.0788) White/Other Mean 0.206 0.296 0.296 Hispanic Mean 0.300 0.301 0.301 Observations 10613 10565 10565 2016 Hispanic (OR) 1.631** 1.130 1.103 (0.113) (0.0925) (0.115) White/Other Mean 0.161 0.224 0.224 Hispanic Mean 0.238 0.239 0.239 Observations 5906 5875 5875 2017 Hispanic (OR) 1.048 1.130 1.071 (0.0819) (0.109) (0.160) White/Other Mean 0.194 0.198 0.198 Hispanic Mean 0.201 0.206 0.206 Observations 5034 4621 4621 2018 Hispanic (OR) 0.957 0.953 1.009 (0.0750) (0.0925) (0.130) White/Other Mean 0.213 0.211 0.211 Hispanic Mean 0.205 0.211 0.211 Observations 4767 4446 4446 2019 Hispanic (OR) 0.936 0.873 0.875 (0.0690) (0.0766) (0.107) White/Other Mean 0.206 0.222 0.222 Hispanic Mean 0.196 0.200 0.200 Observations 5478 5076 5076
Note: OR=Odds Ratio; standard errors in parentheses; effective sample size from observations is lower than actual observations due to weighting. Estimates in column 2 include major crime suspected; day of the week; patrol shift; housing, transit, or other location; gender of person stopped; age of person stopped; SQF based on radio run; precinct location. DR=doubly robust and includes all control variables and entropy weight. **p < .01
Figure 11 shows estimates from the DR model of use of force rates between Hispanics and
White/Others stopped in similar contexts. The graph shows that estimated use of force rates rise
between 2013 and 2015 and then subsequently decline. Figure 11 shows that the adjusted
Case 1:08-cv-01034-AT Document 853-1 Filed 09/01/21 Page 57 of 69

55
disparities in use of force rates have overlapping confidence intervals for every year other than
2013, meaning that one cannot rule out that 95 percent of the time, there is no difference in use of
force rates between Hispanics and Whites/Others stopped in similar contexts.
Table 22 shows the results for use of force disparities between Hispanics and
Whites/Others (a) who are frisked, (b) adjusted for 2013 contexts, and (c) after adjusting for the
assumed rate of undocumented stops. The rates of assumed undocumented stops have minimal
effect on disparities in use of force rates for Hispanics compared to similarly situated
Whites/Others.
Table 22. Use of Force Rates for Hispanics Adjusting for Rate of Undocumented Stops, 2016-2019
(1) (2) (3) (4) (5) Force Frisk 2013 CCRB RAND BWC 2016 White/Other Mean 0.224 0.202 0.210 0.157 0.152
.15
.2.2
5.3
.35
Aver
age
2013 2014 2015 2016 2017 2018 2019Force
White/Other Hispanic
DR=Doubly Robust Model
Figure 11: Use of Force Over Time
Case 1:08-cv-01034-AT Document 853-1 Filed 09/01/21 Page 58 of 69

56
Hispanic Mean 0.309 0.258 0.227 0.178 0.173 Observations 3583 5875 2017 White/Other Mean 0.293 0.233 0.185 0.133 0.128 Hispanic Mean 0.238 0.208 0.196 0.155 0.150 Observations 2736 4621 2018 White/Other Mean 0.337 0.197 0.198 0.144 0.139 Hispanic Mean 0.264 0.193 0.201 0.159 0.154 Observations 2458 4446 2019 White/Other Mean 0.307 0.229 0.208 0.151 0.145 Hispanic Mean 0.244 0.178 0.190 0.149 0.145 Observations 2756 5076
Note: Effective sample size from observations is lower than actual observations due to weighting. Column 2 estimates include: entropy weight for comparability to 2013 stop contexts*entropy weight for White/Other to be similar to Black or Hispanic stops; major crime suspected; day of the week; patrol shift; housing, transit, or other location; gender of person stopped; age of person stopped; SQF based on radio run; precinct location. DR=doubly robust and includes all control variables and entropy weight. **p < .01
F. Hit Rate Disparities Table 23 shows the disparities for Black subjects compared to White/Other subjects
stopped in similar contexts on frisks and searches that led to the finding of contraband or weapons
(hit rates). A finding of a substantially lower hit rate for Black stop subjects relative to White/Other
stop subjects would suggest a concerning racial disparity, as this indicates the threshold for
searching someone was lower for Blacks.
The hit rates for contraband for Blacks compared to Whites/Others stopped under similar
contexts is higher or lower in different years, but these differences achieve statistical significance
only in 2018 and show a higher hit rate for Blacks. In general, the results indicate that yearly
contraband hit rates for Blacks relative to White/Others are similar.
Table 23. DR Hit Rates for Blacks Compared to Whites/Others, 2013-2019 Frisk Search (1) (2) (3) (4) Contraband Weapon Contraband Weapons
2013 Black (OR) 0.986 0.619** 1.087 0.840 (0.0923) (0.0475) (0.129) (0.0842)
Case 1:08-cv-01034-AT Document 853-1 Filed 09/01/21 Page 59 of 69

57
White/Other Mean 0.028 0.051 0.131 0.188 Black Mean 0.027 0.026 0.141 0.133 Observations 79575 79575 12658 12684 2014 Black (OR) 0.887 0.599** 0.962 0.919 (0.123) (0.0888) (0.151) (0.151) White/Other Mean 0.045 0.066 0.146 0.192 Black Mean 0.042 0.037 0.155 0.134 Observations 21977 21977 4891 4888 2015 Black (OR) 0.754 0.596** 0.736 0.698 (0.122) (0.107) (0.146) (0.135) White/Other Mean 0.065 0.095 0.180 0.270 Black Mean 0.053 0.059 0.168 0.192 Observations 10653 10626 2714 2743 2016 Black (OR) 1.606 0.666 1.215 0.626 (0.355) (0.124) (0.267) (0.139) White/Other Mean 0.045 0.101 0.134 0.271 Black Mean 0.073 0.073 0.189 0.201 Observations 5231 5424 1931 1917 2017 Black (OR) 1.059 0.969 0.829 0.686 (0.181) (0.204) (0.141) (0.143) White/Other Mean 0.212 0.152 0.415 0.285 Black Mean 0.193 0.131 0.370 0.226 Observations 4305 4224 2475 2420 2018 Black (OR) 2.008** 2.101** 1.420 1.666 (0.386) (0.490) (0.272) (0.402) White/Other Mean 0.120 0.079 0.301 0.170 Black Mean 0.209 0.139 0.380 0.239 Observations 4174 4065 2350 2292 2019 Black (OR) 1.181 1.362 0.824 0.818 (0.217) (0.320) (0.141) (0.173) White/Other Mean 0.172 0.105 0.382 0.251 Black Mean 0.206 0.147 0.355 0.234 Observations 4922 4861 3326 3232
Note: OR=Odds Ratios; standard errors in parentheses; effective sample size from observations is lower than actual observations due to weighting. DR=doubly robust and includes all control variables and entropy weight. Control variables include major crime suspected; day of the week; patrol shift; housing, transit, or other location; gender of person stopped; age of person stopped; SQF based on radio run; precinct location.
Case 1:08-cv-01034-AT Document 853-1 Filed 09/01/21 Page 60 of 69

58
The hit rates for weapons shows that Blacks subjected to frisks or searches in similar
contexts as Whites/Others had lower hit rates from 2013 to 2017. The marginal differences are on
the order of 2.5 to 3.6 percentage points for frisks and are statistically significant at the p<.01 level
for years 2013 to 2015, but show a reversal in 2018 and 2019, when the hit rate for weapons after
a frisk was higher for Blacks than for Whites/Others.
Figure 12 shows the visualization of the estimates by year for the hit rates for weapons for
Blacks compared to White/Other groups searched under similar contexts. Hit rates are on average
lower for weapons for Blacks, with the exception of 2018 when they are higher, and 2019, when
the results show no difference. While the p-value for the disparities in hit rates for weapons does
not reach the p<.01 level of statistical significance, this graph shows that the earlier years
disfavored Blacks and the 95 percent confidence intervals do not overlap.
.1.1
5.2
.25
.3.3
5Av
erag
e
2013 2014 2015 2016 2017 2018 2019Weapons
White/Other Black
DR=Doubly Robust Model With 95% Confidence Interval
Figure 12: Weapons Black vs. White/Other Over Time
Case 1:08-cv-01034-AT Document 853-1 Filed 09/01/21 Page 61 of 69

59
Table 24 shows the hit rates for contraband and weapons for Hispanics compared to
White/Others subjected to frisks and searches. For Hispanics, the hit rates for contraband for frisks
and searches are nearly identical to White/Other groups in all years, with the exception of 2018
when the hit rates for Hispanics are significantly higher. When differences exist, they are less than
2 percentage points and one cannot reject the possibility of zero difference in 1 out of 100 times
by chance alone. The hit rates for weapons for Hispanics appears to be on average lower by 1 to
7 percentage points compared to similarly situated White/Other groups, with the exception of
2018, when they are noticeably higher.
Table 24. DR Hit Rates for Hispanics Compared to Whites/Others Frisk Search (1) (2) (3) (4) Contraband Weapons Contraband Weapons
2013 Hispanic (OR) 0.976 0.819** 1.037 0.934 (0.0807) (0.0591) (0.115) (0.0898) Other 0.042 0.045 0.164 0.161 Hispanic 0.039 0.034 0.166 0.147 Observations 47433 47549 8733 8756 2014 Hispanic (OR) 0.943 0.825 0.974 1.084 (0.113) (0.122) (0.147) (0.186) Other 0.061 0.072 0.163 0.180 Hispanic 0.056 0.057 0.158 0.156 13119 13063 3511 3519 2015 Hispanic (OR) 1.031 0.970 0.996 0.915 (0.158) (0.155) (0.189) (0.177) Other 0.081 0.083 0.214 0.222 Hispanic 0.081 0.078 0.213 0.193 6385 6436 1929 1954 2016 Hispanic (OR) 1.247 0.662 1.210 0.558 (0.271) (0.125) (0.250) (0.138) Other 0.073 0.123 0.162 0.257 Hispanic 0.085 0.090 0.188 0.213 3288 3393 1393 1389 2017 Hispanic (OR) 1.128 1.067 1.231 1.324
Case 1:08-cv-01034-AT Document 853-1 Filed 09/01/21 Page 62 of 69

60
(0.230) (0.261) (0.214) (0.307) Other 0.216 0.154 0.428 0.230 Hispanic 0.222 0.159 0.423 0.251 2689 2636 1644 1637 2018 Hispanic (OR) 1.642** 2.637** 1.084 2.119** (0.313) (0.583) (0.209) (0.454) Other 0.155 0.075 0.358 0.143 Hispanic 0.217 0.148 0.389 0.226 2425 2294 1570 1508 2019 Hispanic (OR) 0.870 0.924 0.718 0.641 (0.162) (0.196) (0.120) (0.131) Other 0.247 0.165 0.406 0.276 Hispanic 0.219 0.153 0.339 0.206 2707 2655 2020 1969
Note: OR=Odds Ratio; standard errors in parentheses; effective sample size from observations is lower than actual observations due to weighting. DR=doubly robust and includes all control variables and entropy weight. Control variables include major crime suspected; day of the week; patrol shift; housing, transit, or other location; gender of person stopped; age of person stopped; SQF based on radio run; precinct location. **p < .01
The trends in hit rates for weapons for Hispanics compared to Whites/Others searched are
also evident from a review of Figure 13, and shows that Hispanics for all but two years of 2017
and 2018 have lower hit rates for weapons. In 2018, Hispanics compared to White/Others
searched have a significantly higher hit rate for weapons, a disparity that is significant at
the p<.01 level. In 2019, Hispanics compared to White/Others searched have a lower hit rate for
weapons, a difference that is not significant at the p<.01 level, but large enough that it is
significant at the p<.05 level.
Case 1:08-cv-01034-AT Document 853-1 Filed 09/01/21 Page 63 of 69

61
Because of the relatively small number of searches, the differences in hit rates are not
estimated with sufficient precision to rule out the possibility that for the majority of years there are
no actual differences in the hit rates for contraband and weapons. However, the generally lower
hit rates for weapons when stops involve frisks or searches for Black and Hispanic subjects relative
to White/Other subjects suggest this outcome should continue to be monitored closely, as less
productive searches suggest that officers’ decisions to search Black and Hispanic suspects might
be generated by racial bias.
V. CONCLUSION
The number of stop reports filed by NYPD officers decreased dramatically between 2013
and 2019. This rapid decline commenced before the Floyd remedial order but accelerated after
the NYPD started to implement the reforms mandated by the remedial order. As detailed in the
.1.1
5.2
.25
.3Av
erag
e
2013 2014 2015 2016 2017 2018 2019Weapons
White/Other Hispanic
DR=Doubly Robust Model with 95% Confidence Interval
Figure 13: Weapons Hispanic vs. White/Other Over Time
Case 1:08-cv-01034-AT Document 853-1 Filed 09/01/21 Page 64 of 69

62
Monitor’s Ninth, Eleventh, and other Reports, the NYPD has made substantial changes to its stop
policies, documentation, training, and auditing. The stop form itself was revised and can now be
completed using an electronic form that officers can fill out on their phones, on tablets, or on a
computer at the command. Importantly, during Compstat management accountability meetings,
NYPD executives no longer emphasize increasing the numbers of stops as a key crime control
output, so area commanders are no longer under pressure to have their officers make stops to show
that they are indeed focused on reducing crime in their areas of responsibility.
The number of Blacks and Hispanics subjected to stop encounters dropped significantly
between 2013 and 2019, though the overall share of stops by race and ethnicity remained largely
unchanged. The analyses also show evidence of a reduced stability in the locations that have
relatively high stops for a given year. These findings suggest that stop activities are no longer as
spatially concentrated as they were in the past, which may reflect a movement away from using
SQF activities as a crime control strategy in relatively high-crime places.
Racial disparities in frisk, search, summons, arrest, use of force, and the recovery of a
weapon or other contraband diminished over the study time period. These results suggest that the
post-Floyd reforms have helped address 14th Amendment concerns identified by the Court for
stops that are recorded. Although the DR estimation used in this report compares Blacks or
Hispanics stopped to White/Other groups stopped under similar measured contexts, this approach
can only construct similarly situated comparisons based on the availability of accurate recording
of stop data. As a result, undocumented stops raise concerns about the ability to draw strong
conclusions about compliance with the 14th Amendment and concerns about Blacks and Hispanics
being treated similarly to Whites/Others when stopped by the NYPD. This is particularly the case
for comparisons of frisks, arrests, and uses of force for Blacks. Estimates of disparities in stop
Case 1:08-cv-01034-AT Document 853-1 Filed 09/01/21 Page 65 of 69

63
outcomes for Hispanics compared to similarly situated White/Other groups appears to be largely
unaffected by the different assumptions about the level of undocumented stops.
The NYPD has acknowledged the undocumented stops issue and, via the reforms mandated
by the Court’s remedial order, implemented a number of review mechanisms that have provided
insights on the size of the undocumented stop problem. In addition to the ongoing monitor audits
of stop reports, the NYPD mechanisms include QAD RAND and police-initiated enforcement
audits of events that require stop reports, supervisory review of stop reports and BWC videos,
periodic RISKS (Remediation of Identified Situations Key to Success) reviews of command
performance, and CCRB complaint reviews for missing stop reports. It is important to note that
the citywide adoption of BWCs along with the NYPD’s other efforts may have generated
additional stop report documentation, as officers generated 13,459 stop reports in 2019, a 22
percent increase over the 11,008 stop reports submitted in 2018. Nevertheless, as shown in the
Monitor’s Eleventh Report, all reviews and auditing mechanisms suggest undocumented stops
remain a problem for the NYPD.
This report attempts to understand whether the potential inclusion of undocumented stops
affects the analyses of compliance with the remedial order based on the documented stops. The
results of these analyses raise concerns that racial disparities in stops made by NYPD officers may
persist. It is important for the NYPD to strengthen its efforts to ensure that officers document all
of their stops. Without complete stop data, it will not be possible to conduct valid and reliable
statistical analyses that can appraise whether the NYPD is in substantial compliance with the
Court’s remedial order.
Case 1:08-cv-01034-AT Document 853-1 Filed 09/01/21 Page 66 of 69

64
REFERENCES ACLU of Massachusetts. (2014). Black, Brown, and Targeted: A Report on Boston Police Department Street Encounters from 2007–2010. Boston, MA: ACLU of Massachusetts. Anwar, S., & Fang, H. (2006). An alternative test of racial prejudice in motor vehicle searches:
Theory and evidence. American Economic Review, 96, 127-151. Ayres, I. (2002). Outcome tests of racial disparities in police practices. Justice Research and
Policy, 4, 131-142.
Baumgartner, F.R., Epp, D. A., & Shoub, K. (2018). Suspect citizens: What 20 million traffic stops tell us about policing and race. Cambridge University Press.
Benjamin, D.J., Berger, J. O., Johannesson, M., Nosek, B.A., Wagenmakers, E.J., Berk, R., & Johnson, V.E. (2018). Redefine statistical significance. Nature Human Behaviour, 2(1), 6-10. Benjamini, Y., & Hochberg, Y. (1995). Controlling for false discovery rate: A practical and
powerful approach to multiple testing. Journal of the Royal Statistical Society, Series B, 57, 289-300.
Berk, R., & MacDonald, J.M. (2008). Overdispersion and Poisson regression. Journal of
Quantitative Criminology, 24, 269-284. Braga, A.A., & Weisburd, D. (2010). Policing problem places: Crime hot spots and
effective prevention. New York: Oxford University Press. Engel, R., & Tillyer, R. (2008). Searching for equilibrium: The tenuous nature of the outcome
test. Justice Quarterly, 25, 54-71. Eterno, J., & Silverman, E. (2012). The crime numbers game: Management by manipulation.
Boca Raton, Florida: CRC Press. Fagan, J. (2010). Expert report in David Floyd et al. v. City of New York et al., U.S. District
Court for the Southern District of New York, 08 Civ. 01034 (SAS). Fagan, J. (2012a). Second supplemental report, Floyd v. City of New York, 08 Civ 01034 ( SAS). Fagan, J. (2012b). Expert report in Davis v. City of New York, 08 Civ 01034( SAS). Fagan, J., Braga, A., Brunson, R., & Pattavina, A. (2016). Stops and stares: Street stops, surveillance and race in the new policing. Fordham Urban Law Journal, 42, 621-696.
Fagan, J., & Davies, G. (2000). Street stops and broken windows: Terry, race, and disorder in New York City. Fordham Urban Law Journal, 28, 457-504.
Case 1:08-cv-01034-AT Document 853-1 Filed 09/01/21 Page 67 of 69

65
Fagan, J., Zimring, F., & Kim, J. (1998). Declining homicide in New York City: A tale of two trends. Journal of Criminal Law and Criminology, 88, 1277-1324.
Fieller, E., Hartley, H., & Pearson, E. S. (1957). “Tests for rank correlation coefficients.”
Biometrika. 44 (3–4): 470–481. Gelman, A., Fagan, J., & Kiss, A. (2007). An analysis of the New York City Police
Department’s “stop-and-frisk” policy in the context of claims of racial bias. Journal of the American Statistical Association, 102, 813-823.
Hainmueller, J. (2011). Entropy balancing for causal effects: A multivariate reweighting method
to produce balanced samples in observational studies. Political Analysis 20, 25-46. Knowles, J., Persico, N., & Todd, P. (2001). Racial bias in motor vehicle searches: Theory and
evidence. Journal of Political Economy, 109, 203 – 229. MacDonald, J., & Braga, A.A. (2019). Did post-Floyd reforms reduce racial disparities in
NYPD stop, question, and frisk practices? An exploratory analysis using external and internal benchmarks. Justice Quarterly, 36(5), 954-983.
MacDonald, J.M., & Fagan, J. (2019, May). Using shifts in deployment and operations to test for racial bias in police stops. AEA Papers and Proceedings (Vol. 109, pp. 148-51). Morgan, S.L., & Winship, C. (2015). Counterfactuals and causal inference. Cambridge
University Press. Persico, N., & Todd, P. (2006). Generalizing the hit rates test for racial bias in law enforcement,
with an application to vehicle searches in Wichita. The Economic Journal, 116, 351- 367.
Pierson, E., Simoiu, C., Overgoor, J., Corbett-Davies, S., Jenson, D., Shoemaker, A., ... & Goel, S. (2020). A large-scale analysis of racial disparities in police stops across the United States. Nature Human Behaviour, 4(7), 736-745.
Powell, Z., Meitl, M.B., & Worrall, J. (2017). Police consent decrees and section 1983 civil
rights litigation. Criminology & Public Policy, 16, 575 – 605. Ridgeway, G. (2006). Assessing the effect of race bias in post-traffic stop outcomes using
propensity scores. Journal of quantitative criminology, 22(1), 1-29. Ridgeway, G. (2007). Analysis of racial disparities in the New York Police Department’s stop,
question, and frisk practices. Santa Monica, CA: RAND Corporation. Ridgeway, G., & MacDonald, J. (2009). Doubly robust internal benchmarking and false
discovery rates for detecting racial bias in police stops. Journal of the American Statistical Association, 104, 661–668.
Case 1:08-cv-01034-AT Document 853-1 Filed 09/01/21 Page 68 of 69

66
Ridgeway, G., & MacDonald, J. (2010). Methods for assessing racially biased policing. S.
Rice & M. White (Eds.), Race, ethnicity, and police: New and essential readings (pp. 180-205). New York: New York University Press.
Ridgeway, G., Kovalchik, S.A., Griffin, B. A., & Kabeto, M.U. (2015). Propensity score
analysis with survey weighted data. Journal of Causal Inference, 3(2), 237-249. Spitzer, E. (1999). New York City Police Department’s “stop and frisk” practices: A report to
the people of the State of New York from the Office of the Attorney General. Albany, New York: New York State Attorney General’s Office.
Wooldridge, J.M. (2010). Econometric analysis of cross section and panel data. Cambridge,
Massachusetts: MIT Press. Zhao, Q., & Percival, D. (2015). Primal-dual covariate balance and minimal double robustness
via entropy balancing. arXiv preprint arXiv:1501.03571.
Case 1:08-cv-01034-AT Document 853-1 Filed 09/01/21 Page 69 of 69