Third Quarter Financial Results Fiscal Year 2016 …...2015/Q3 Actual 2016/Q3 Actual (Billions of...
26
©SEIKO EPSON CORPORATION 2017. All rights reserved. Third Quarter Financial Results Fiscal Year 2016 (Ending March 2017) January 31, 2017
Transcript of Third Quarter Financial Results Fiscal Year 2016 …...2015/Q3 Actual 2016/Q3 Actual (Billions of...

©SEIKO EPSON CORPORATION 2017. All rights reserved.
Third Quarter Financial ResultsFiscal Year 2016
(Ending March 2017)
January 31, 2017
1
Disclaimer regarding forward-looking statements
Note regarding business profit
The foregoing statements regarding future results reflect the Companyʼs expectations based on information available at the time of announcement. The information contains certain forward-looking statements that are subject to known and unknown risks and uncertainties that could cause actual results to differ materially from those expressed or implied by such statements. Such risks and uncertainties include, but are not limited to, the competitive environment, market trends, general economic conditions, technological changes, exchange rate fluctuations and our ability to continue to timely introduce new products and services.
Numerical values presented hereinNumbers are rounded down to the unit indicated. Percentages are rounded off to one decimal place.
Business profit is calculated by deducting cost of sales and SGA expenses from revenue.Although not defined in the statement of consolidated comprehensive income, this indicator is very similar to the concept of operating income under J-GAAP. Epson will present this information as a reference, as the Company believes users of financial statements will find it useful when evaluating Epson's financial performance.

2
1) FY2016 Q3 Financial Results
2) FY2016 Financial Outlook
3
First 9Months % First 9
Months% Amount %
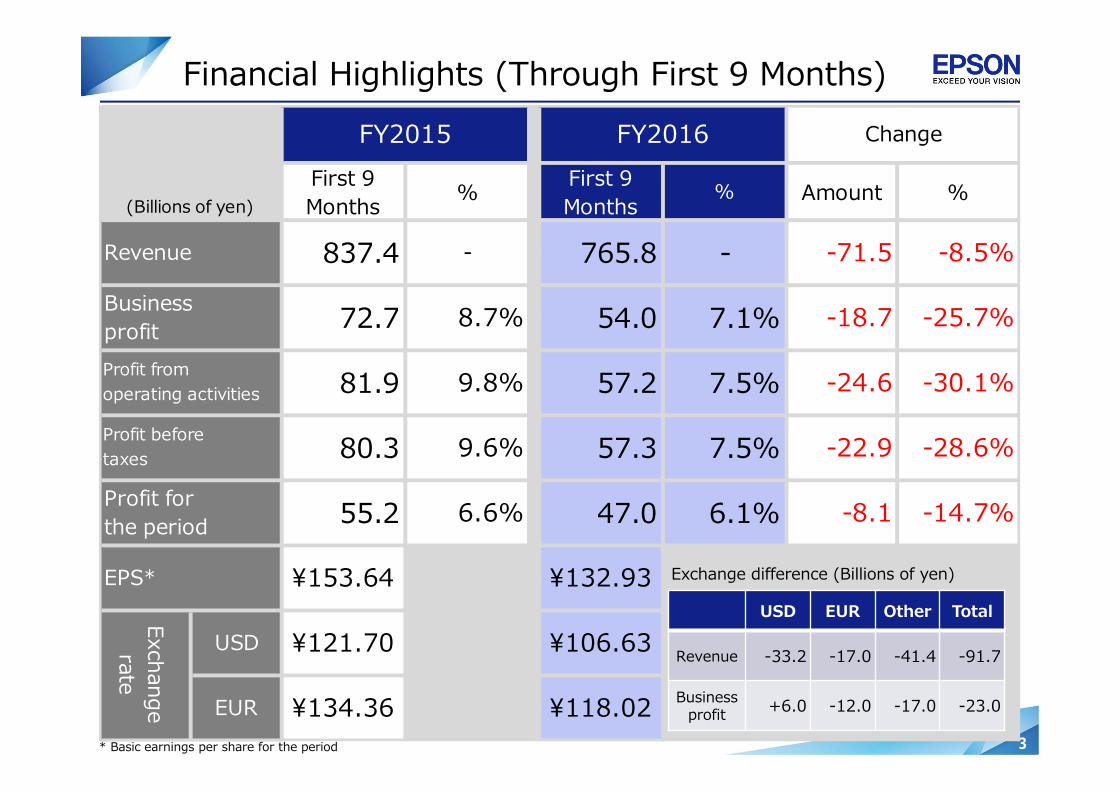
EPS* ¥153.64 ¥132.93
Exchangerate
USD ¥121.70 ¥106.63
EUR ¥134.36 ¥118.02
-18.7 -25.7%
Profit fromoperating activities 57.2 7.5%
Businessprofit 72.7 8.7% 54.0 7.1%
-30.1%
Change
Revenue 837.4 - 765.8 - -71.5 -8.5%
(Billions of yen)
FY2015 FY2016
Profit forthe period 47.0 6.1%
Profit beforetaxes 57.3 7.5%
81.9 9.8% -24.6
-28.6%
55.2 6.6% -8.1 -14.7%
80.3 9.6% -22.9
Financial Highlights (Through First 9 Months)
Exchange difference (Billions of yen)
USD EUR Other Total
Revenue -33.2 -17.0 -41.4 -91.7
Business profit +6.0 -12.0 -17.0 -23.0
* Basic earnings per share for the period
4
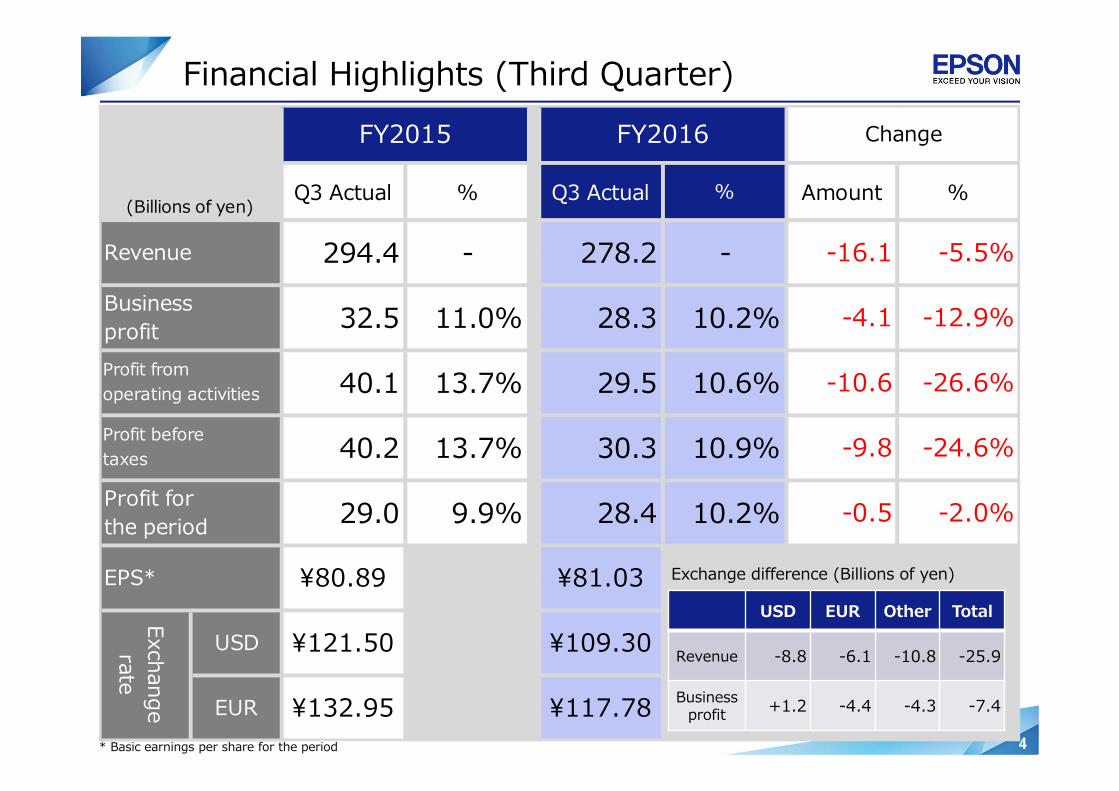
Financial Highlights (Third Quarter)
Q3 Actual % Q3 Actual % Amount %
¥81.03
Exchangerate
¥121.50 ¥109.30
¥132.95 ¥117.78
USD
EUR
EPS* ¥80.89
-26.6%
Profit beforetaxes 13.7% -24.6%
Profit forthe period 9.9% -2.0%29.0
Change
- -5.5%
Businessprofit 11.0% -12.9%
294.4 278.2(Billions of yen)
FY2015 FY2016
- -16.1
32.5 28.3 10.2%
Revenue
10.2% -0.528.4
10.6% -10.6
40.2 30.3 10.9%
-4.1
-9.8
40.1 29.5Profit fromoperating activities 13.7%
Exchange difference (Billions of yen)
USD EUR Other Total
Revenue -8.8 -6.1 -10.8 -25.9
Business profit +1.2 -4.4 -4.3 -7.4
* Basic earnings per share for the period
5
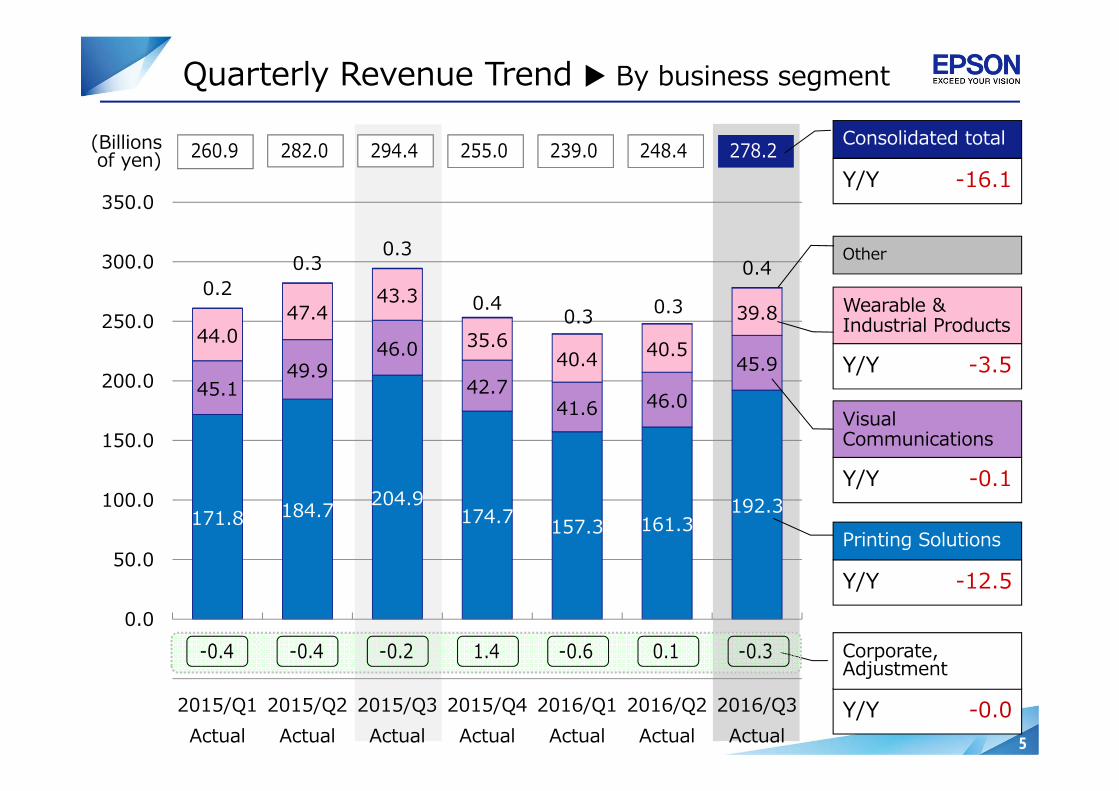
171.8 184.7 204.9174.7 157.3 161.3
192.3
45.149.9
46.0
42.741.6 46.0
45.944.0
47.4 43.3
35.6 40.4 40.5
39.8 0.2
0.30.3
0.4 0.3 0.3
0.4
0.0
50.0
100.0
150.0
200.0
250.0
300.0
350.0
2015/Q1Actual
2015/Q2Actual
2015/Q3Actual
2015/Q4Actual
2016/Q1Actual
2016/Q2Actual
2016/Q3Actual
Quarterly Revenue Trend By business segment
(Billionsof yen)
Y/Y -12.5
Y/Y -0.1
Y/Y -3.5
Y/Y -16.1
Consolidated total
Y/Y -0.0
Corporate,Adjustment
Other
Wearable & Industrial Products
Visual Communications
Printing Solutions
-0.4 -0.4 -0.2 1.4 -0.6 0.1 -0.3
260.9 282.0 294.4 255.0 239.0 248.4 278.2
6
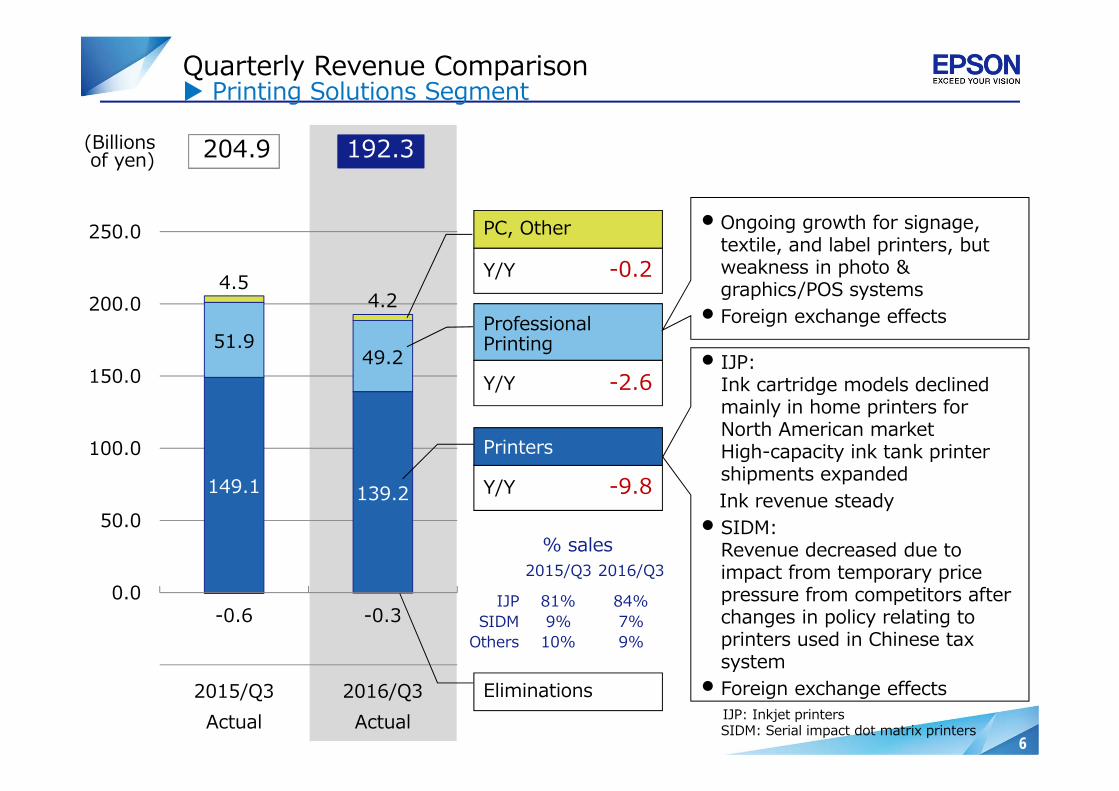
Quarterly Revenue Comparison Printing Solutions Segment
IJP: Inkjet printersSIDM: Serial impact dot matrix printers
(Billionsof yen)
149.1 139.2
51.949.2
4.54.2
-0.6 -0.30.0
50.0
100.0
150.0
200.0
250.0
2015/Q3Actual
2016/Q3Actual
Y/Y -9.8
Y/Y -2.6
Y/Y -0.2
Eliminations
% sales
Printers
Professional Printing
PC, Other
204.9 192.3
2015/Q3 2016/Q3
IJP 81% 84%SIDM 9% 7%
Others 10% 9%
• Ongoing growth for signage, textile, and label printers, but weakness in photo & graphics/POS systems
• Foreign exchange effects
• IJP:Ink cartridge models declinedmainly in home printers for North American market High-capacity ink tank printer shipments expandedInk revenue steady
• SIDM:Revenue decreased due to impact from temporary price pressure from competitors after changes in policy relating to printers used in Chinese tax system
• Foreign exchange effects
7
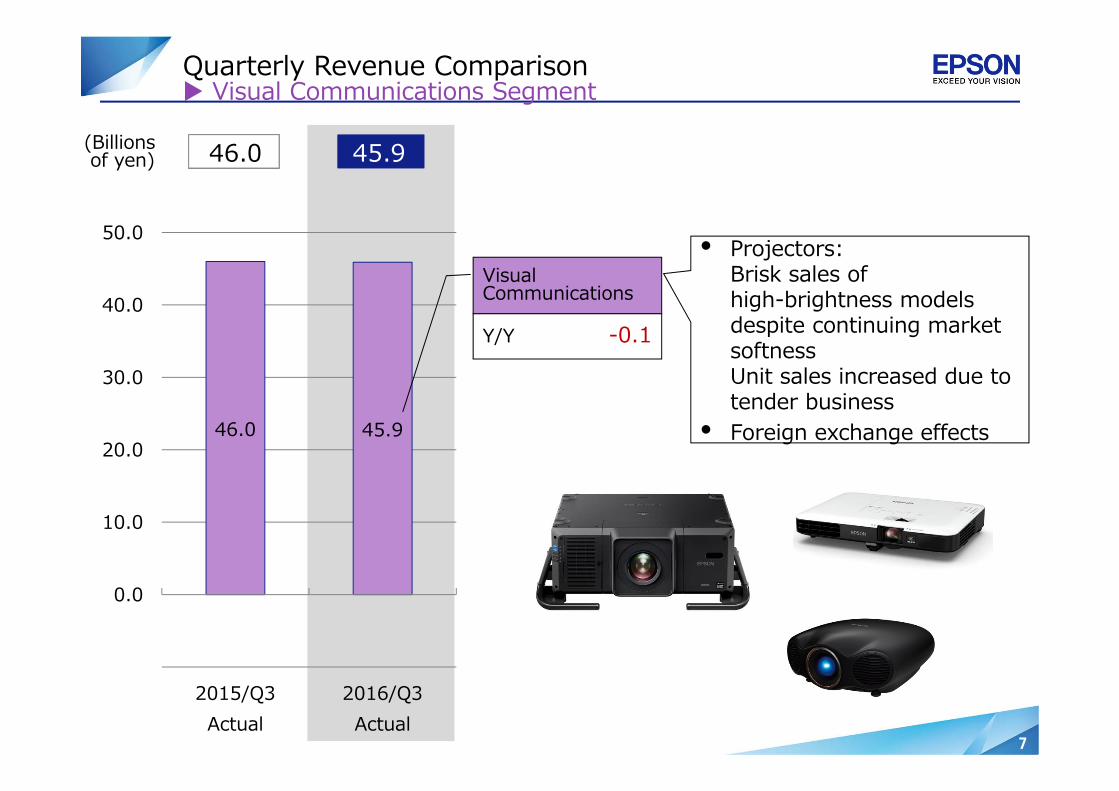
46.0 45.9
0.0
10.0
20.0
30.0
40.0
50.0
2015/Q3Actual
2016/Q3Actual
Visual Communications
46.0 45.9(Billionsof yen)
Quarterly Revenue Comparison Visual Communications Segment
Y/Y -0.1
• Projectors:Brisk sales of high-brightness modelsdespite continuing market softnessUnit sales increased due to tender business
• Foreign exchange effects
8
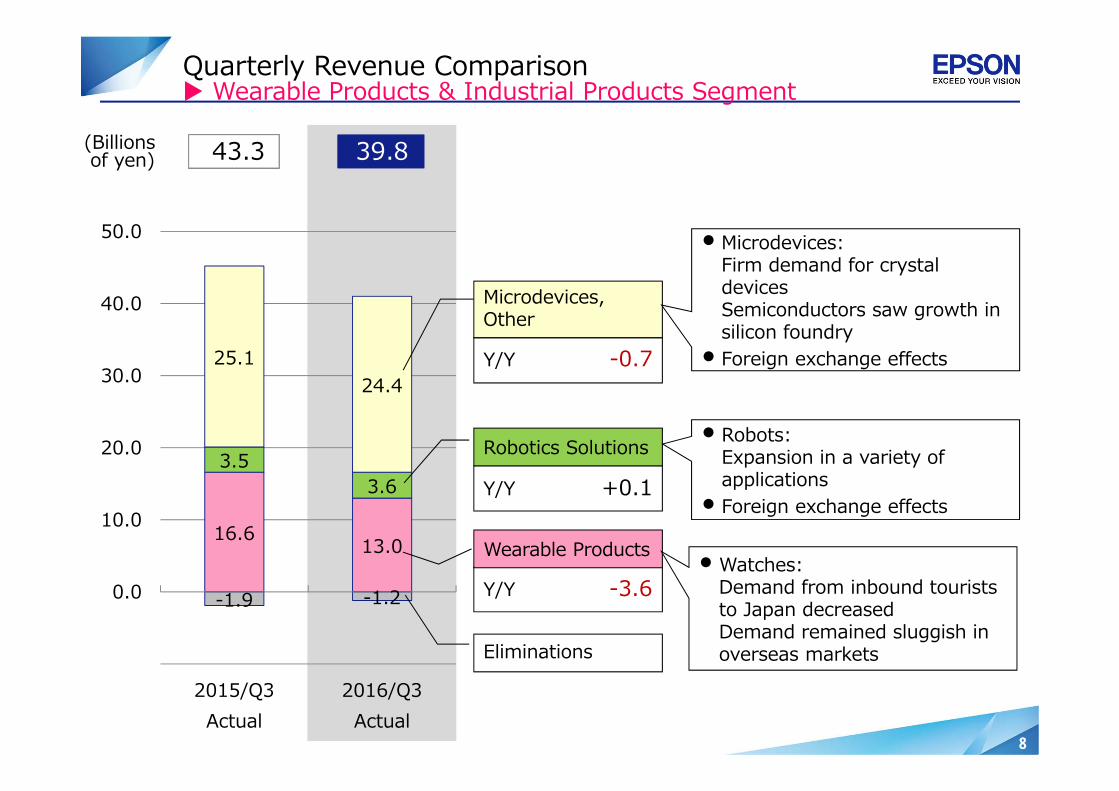
Quarterly Revenue Comparison Wearable Products & Industrial Products Segment
16.6 13.0
3.53.6
25.124.4
-1.9 -1.20.0
10.0
20.0
30.0
40.0
50.0
2015/Q3Actual
2016/Q3Actual
(Billionsof yen)
Y/Y -3.6
Y/Y +0.1
Y/Y -0.7
Eliminations
Microdevices,Other
Robotics Solutions
Wearable Products
43.3 39.8
• Microdevices:Firm demand for crystaldevices Semiconductors saw growth insilicon foundry
• Foreign exchange effects
• Watches:Demand from inbound tourists to Japan decreasedDemand remained sluggish in overseas markets
• Robots:Expansion in a variety of applications
• Foreign exchange effects

9
Quarterly Selling, General and Administrative Expenses
24.9 24.0 24.6 24.7 23.6 22.7 23.9
12.4 13.5 13.3 13.8 12.5 13.7 13.4
6.8 7.8 8.9 8.76.2 6.7 7.7
4.0 5.5 6.0 6.94.0 4.8 5.4
24.627.6 27.6 26.2
23.6 23.726.0
28.0% 27.9% 27.4%
31.6%29.4%
28.9%27.6%
0.0
10.0
20.0
30.0
40.0
50.0
60.0
70.0
80.0
90.0
100.0
2015/Q1 2015/Q2 2015/Q3 2015/Q4 2016/Q1 2016/Q2 2016/Q3
80.572.9 78.5 80.6 76.670.1(Billionsof yen)
(% revenue)
Y/Y -1.6
Y/Y -0.5
Y/Y -1.2
Y/Y -0.6
Y/Y -3.9
Y/Y +0.1
Consolidated total
Research &Development
Salaries & Wages
Sales Promotions
Advertising
Other
71.9
10
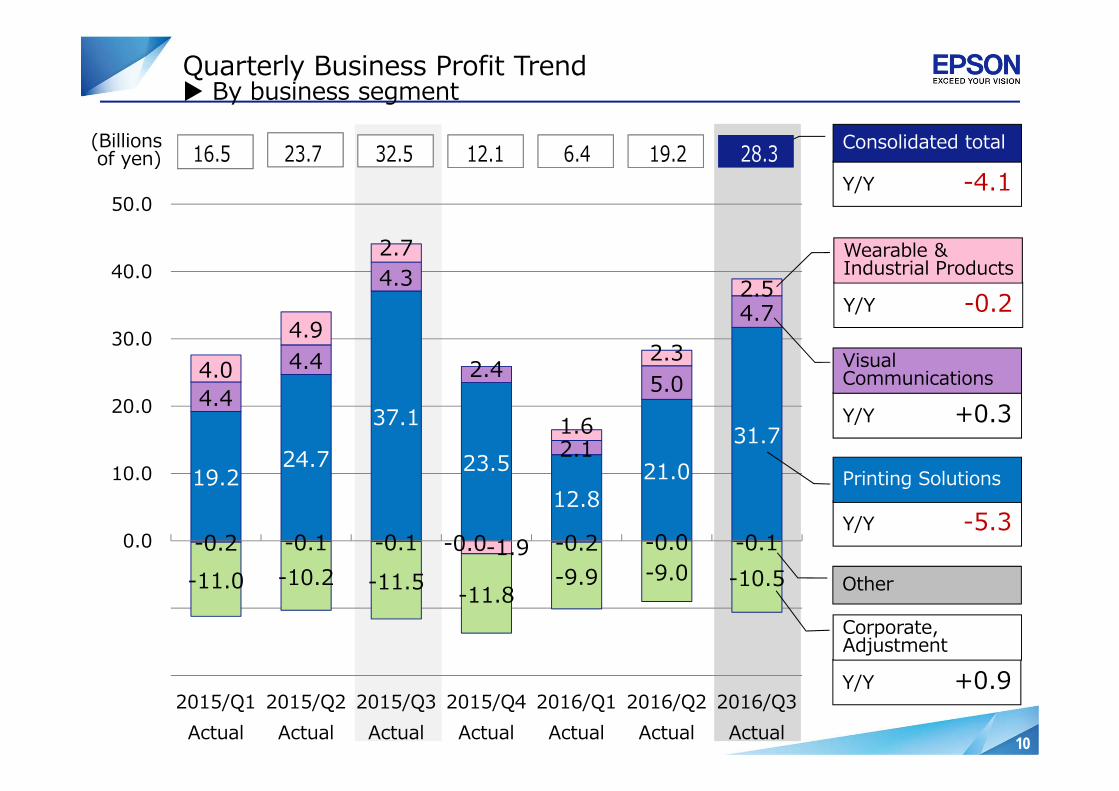
Quarterly Business Profit Trend By business segment
(Billionsof yen)
19.224.7
37.1
23.512.8
21.031.7
4.44.4
4.3
2.4
2.1
5.0
4.7
4.0
4.9
2.7
-1.9
1.6
2.3
2.5
-0.2 -0.1 -0.1 -0.0 -0.2 -0.0 -0.1 -11.0 -10.2 -11.5 -11.8
-9.9 -9.0 -10.50.0
10.0
20.0
30.0
40.0
50.0
2015/Q1Actual
2015/Q2Actual
2015/Q3Actual
2015/Q4Actual
2016/Q1Actual
2016/Q2Actual
2016/Q3Actual
Y/Y +0.3
Y/Y -5.3
Y/Y -4.1
Y/Y -0.2
Y/Y +0.9
Consolidated total
Corporate,Adjustment
Other
Printing Solutions
Wearable & Industrial Products
Visual Communications
16.5 23.7 32.5 12.1 6.4 19.2 28.3
11
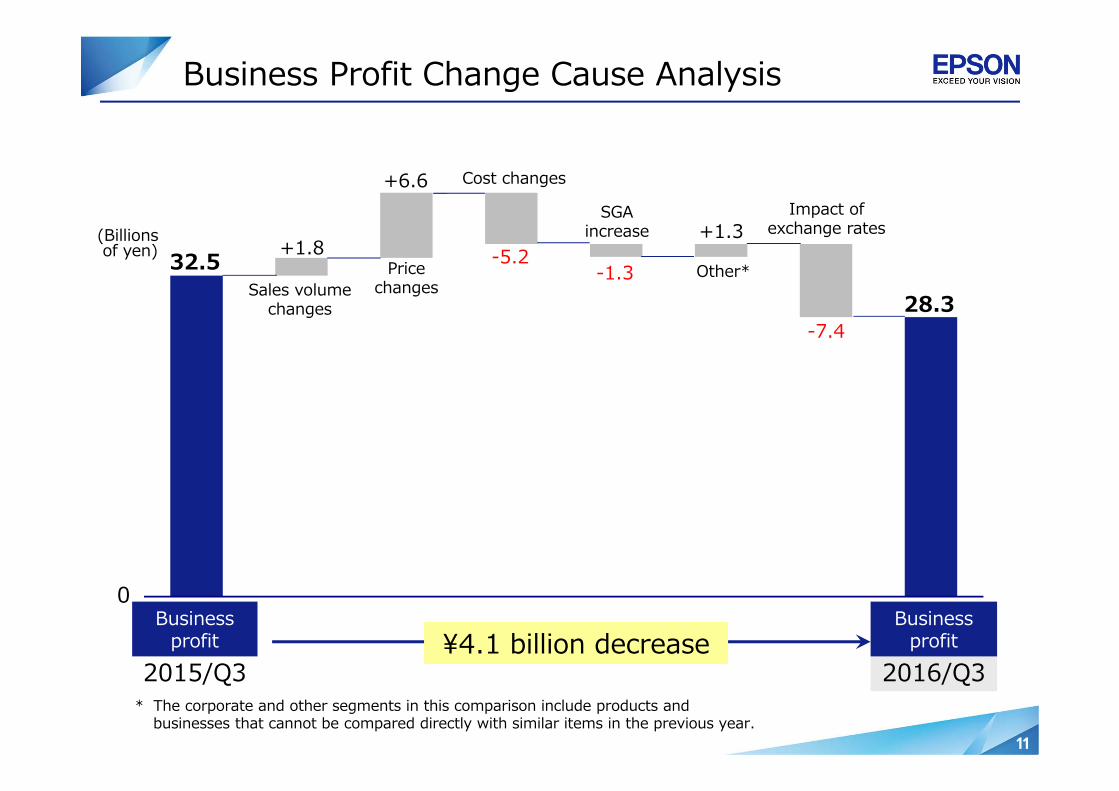
Business Profit Change Cause Analysis
28.3-7.4
+1.8-1.3
+6.6
+1.3-5.232.5
(Billionsof yen)
2015/Q3 2016/Q3¥4.1 billion decrease
Business profit
Business profit
* The corporate and other segments in this comparison include products and businesses that cannot be compared directly with similar items in the previous year.
0
Impact of exchange rates
Sales volume changes
Pricechanges
Cost changes
SGA increase
Other*

12
Statements of Financial Position
908.8 1,006.2 1,002.2 941.3 984.4
0.0
500.0
1,000.0
End of March 2014 End of March 2015 End of Dec. 2015 End of March 2016 End of Dec. 2016
181.5 220.4 222.8 201.6 213.4
0.0
100.0
200.0
End of March 2014 End of March 2015 End of Dec. 2015 End of March 2016 End of Dec. 2016
Total assets
Inventories
(Billions of yen)

13
Statements of Financial Position
220.5 185.9 155.6 141.7 140.6
24.3%18.5% 15.5% 15.1% 14.3%
0.0
200.0
400.0
End of March 2014 End of March 2015 End of Dec. 2015 End of March 2016 End of Dec. 2016
362.3 494.3 518.6 467.8 488.4
39.9% 49.1% 51.7% 49.7% 49.6%
0.0
200.0
400.0
600.0
End of March 2014 End of March 2015 End of Dec. 2015 End of March 2016 End of Dec. 2016
Interest-bearing liabilities & ratio of interest-bearing liabilities
Equity & equity ratio attributable to owners of the parent company
*Interest-bearing liabilities: Includes lease obligations
(Billions of yen)
14
1) FY2016 Q3 Financial Results
2) FY2016 Financial Outlook
15
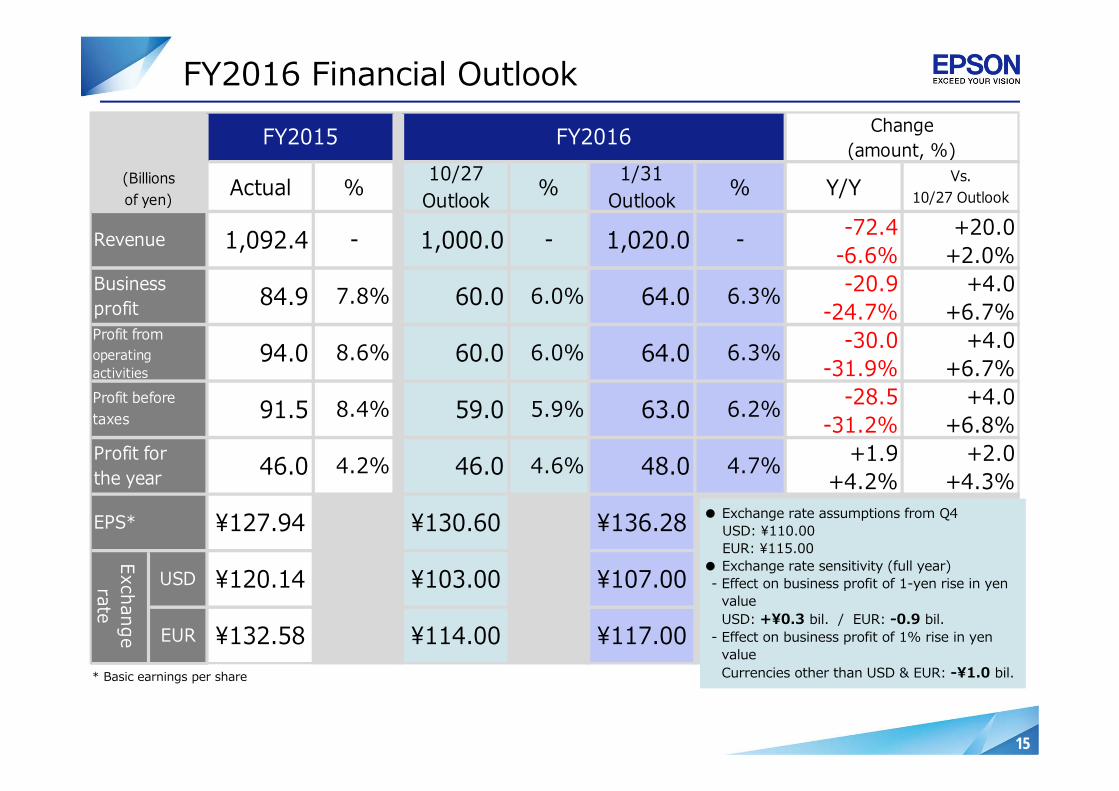
Actual % 10/27Outlook % 1/31
Outlook % Y/Y Vs.10/27 Outlook
-72.4 +20.0-6.6% +2.0%-20.9 +4.0
-24.7% +6.7%-30.0 +4.0
-31.9% +6.7%-28.5 +4.0
-31.2% +6.8%+1.9 +2.0
+4.2% +4.3%
(Billionsof yen)
FY2015 FY2016
Revenue 1,092.4 - 1,000.0 - 1,020.0 -
5.9%
46.0 4.6%
64.0
EPS*
Exchangerate
USD
EUR
Profit beforetaxes
Profit forthe year
Profit fromoperatingactivities
6.0% 64.094.0 8.6%
91.5 8.4%
46.0 4.2%
Change(amount, %)
59.0
60.0 6.3%
6.3%
¥127.94
¥120.14
¥132.58
¥130.60
¥103.00
¥114.00
¥136.28
¥107.00
¥117.00
63.0 6.2%
48.0 4.7%
Businessprofit 84.9 7.8% 60.0 6.0%
FY2016 Financial Outlook
● Exchange rate assumptions from Q4USD: ¥110.00EUR: ¥115.00
● Exchange rate sensitivity (full year)- Effect on business profit of 1-yen rise in yen
valueUSD: +¥0.3 bil. / EUR: -0.9 bil.
- Effect on business profit of 1% rise in yen valueCurrencies other than USD & EUR: -¥1.0 bil.* Basic earnings per share
16
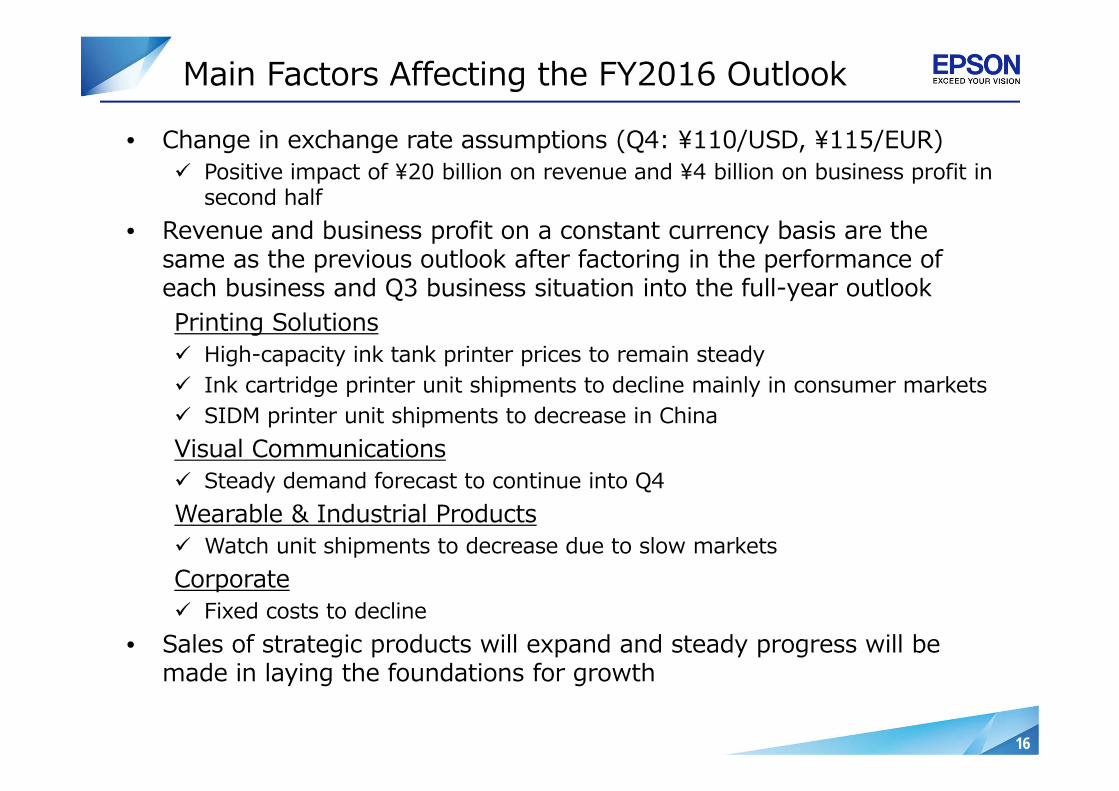
Main Factors Affecting the FY2016 Outlook
• Change in exchange rate assumptions (Q4: ¥110/USD, ¥115/EUR) Positive impact of ¥20 billion on revenue and ¥4 billion on business profit in
second half• Revenue and business profit on a constant currency basis are the
same as the previous outlook after factoring in the performance of each business and Q3 business situation into the full-year outlookPrinting Solutions High-capacity ink tank printer prices to remain steady Ink cartridge printer unit shipments to decline mainly in consumer markets SIDM printer unit shipments to decrease in ChinaVisual Communications Steady demand forecast to continue into Q4Wearable & Industrial Products Watch unit shipments to decrease due to slow marketsCorporate Fixed costs to decline
• Sales of strategic products will expand and steady progress will be made in laying the foundations for growth
17
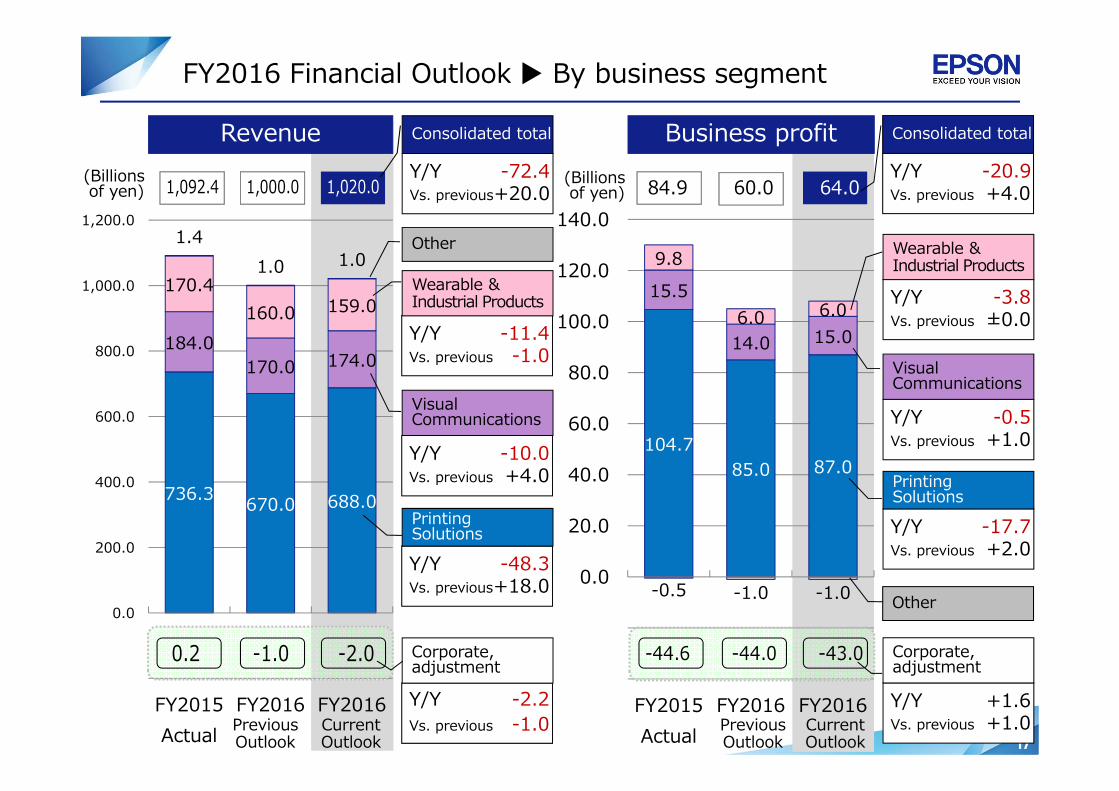
FY2016 Financial Outlook By business segment
Revenue Business profit
736.3 670.0 688.0
184.0170.0 174.0
170.4160.0 159.0
1.41.0 1.0
0.0
200.0
400.0
600.0
800.0
1,000.0
1,200.0
FY2015Actual
FY2016 FY2016
104.785.0 87.0
15.5
14.0 15.0
9.8
6.0 6.0
-0.5 -1.0 -1.00.0
20.0
40.0
60.0
80.0
100.0
120.0
140.0
FY2015Actual
FY2016 FY2016
1,092.4 1,000.0 1,020.0(Billionsof yen)
(Billionsof yen)
0.2 -1.0 -2.0
84.9 60.0 64.0
-44.6 -44.0 -43.0
PreviousOutlook
CurrentOutlook
PreviousOutlook
CurrentOutlook
Y/Y -10.0Vs. previous +4.0
Y/Y -11.4Vs. previous -1.0
Y/Y -2.2Vs. previous -1.0
Y/Y -48.3Vs. previous+18.0
Y/Y -72.4Vs. previous+20.0
Consolidated total
Other
Wearable & Industrial Products
Visual Communications
Printing Solutions
Corporate,adjustment
Y/Y -0.5Vs. previous +1.0
Y/Y -3.8Vs. previous ±0.0
Y/Y +1.6Vs. previous +1.0
Y/Y -17.7Vs. previous +2.0
Y/Y -20.9Vs. previous +4.0
Consolidated total
Other
Wearable & Industrial Products
Visual Communications
Printing Solutions
Corporate,adjustment
18
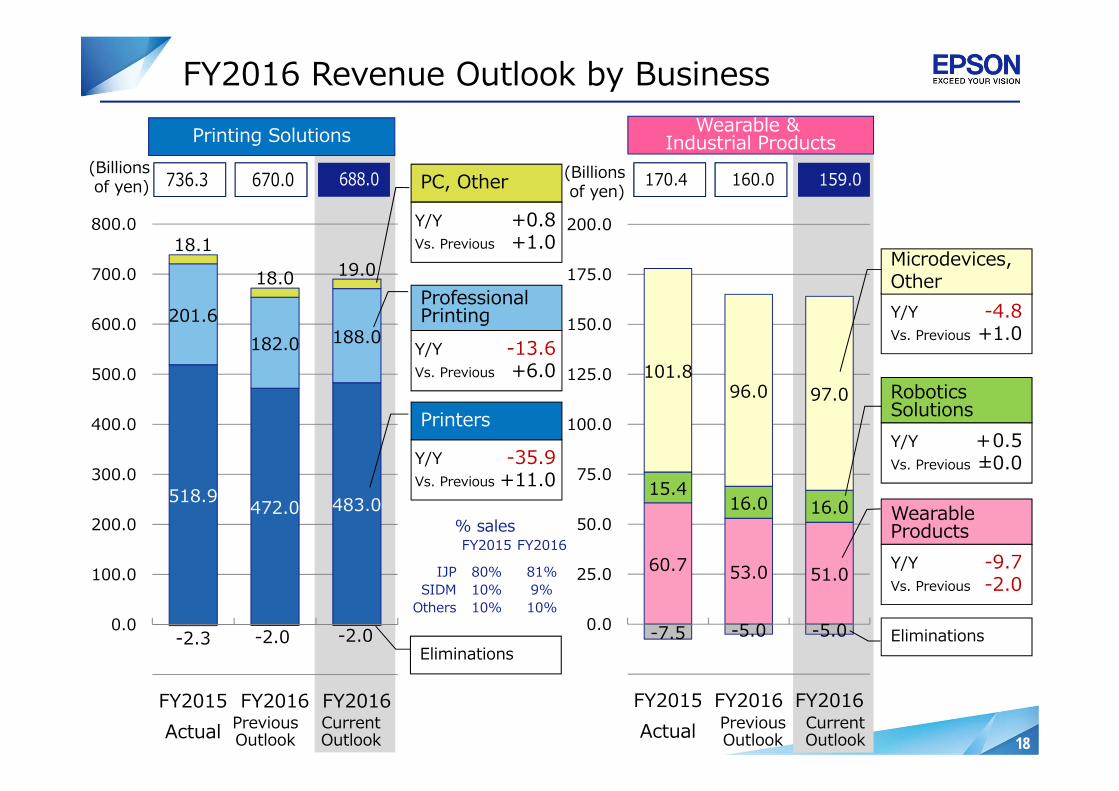
FY2016 Revenue Outlook by BusinessPrinting Solutions Wearable &
Industrial Products(Billionsof yen)
(Billionsof yen)
518.9 472.0 483.0
201.6182.0 188.0
18.1
18.0 19.0
-2.3 -2.0 -2.00.0
100.0
200.0
300.0
400.0
500.0
600.0
700.0
800.0
FY2015Actual
FY2016 FY2016PreviousOutlook
CurrentOutlook
PreviousOutlook
CurrentOutlook
60.7 53.0 51.0
15.416.0 16.0
101.896.0 97.0
-7.5 -5.0 -5.00.0
25.0
50.0
75.0
100.0
125.0
150.0
175.0
200.0
FY2015Actual
FY2016 FY2016
736.3 670.0 688.0 170.4 160.0 159.0
Y/Y -35.9Vs. Previous +11.0
Y/Y -13.6Vs. Previous +6.0
Y/Y +0.8Vs. Previous +1.0
Printers
PC, Other
Professional Printing
Eliminations
Y/Y -9.7Vs. Previous -2.0
Y/Y +0.5Vs. Previous ±0.0
Y/Y -4.8Vs. Previous +1.0
Eliminations
Microdevices,Other
Robotics Solutions
Wearable Products
FY2015 FY2016
IJP 80% 81%SIDM 10% 9%
Others 10% 10%
% sales

19
43.1 37.8 45.4
69.4 77.0
39.3 40.7 44.4 45.3 47.0
0.0
50.0
FY2012 FY2013 FY2014 FY2015 FY2016
Capital expendituresDepreciation and amortization
49.9 48.8 47.8 53.1 56.0
0.0
50.0
FY2012 FY2013 FY2014 FY2015 FY2016
Research & Development
Outlook for R&D Costs, Capital Expenditure andDepreciation and Amortization Expenses
Capex breakdown by segment
FY2015Actual
FY2016Outlook
Printing Solutions 36.6 43.0 Visual Communications 10.7 11.0 Wearable & Industrial Products 10.2 11.0 Other, Corporate 11.7 12.0
IFRSActual
IFRSActual
J-GAAPActual
IFRSActual
IFRSOutlook
(Billionsof yen)
IFRSActual
IFRSActual
J-GAAPActual
IFRSOutlook
IFRSActual
(Billionsof yen)
20
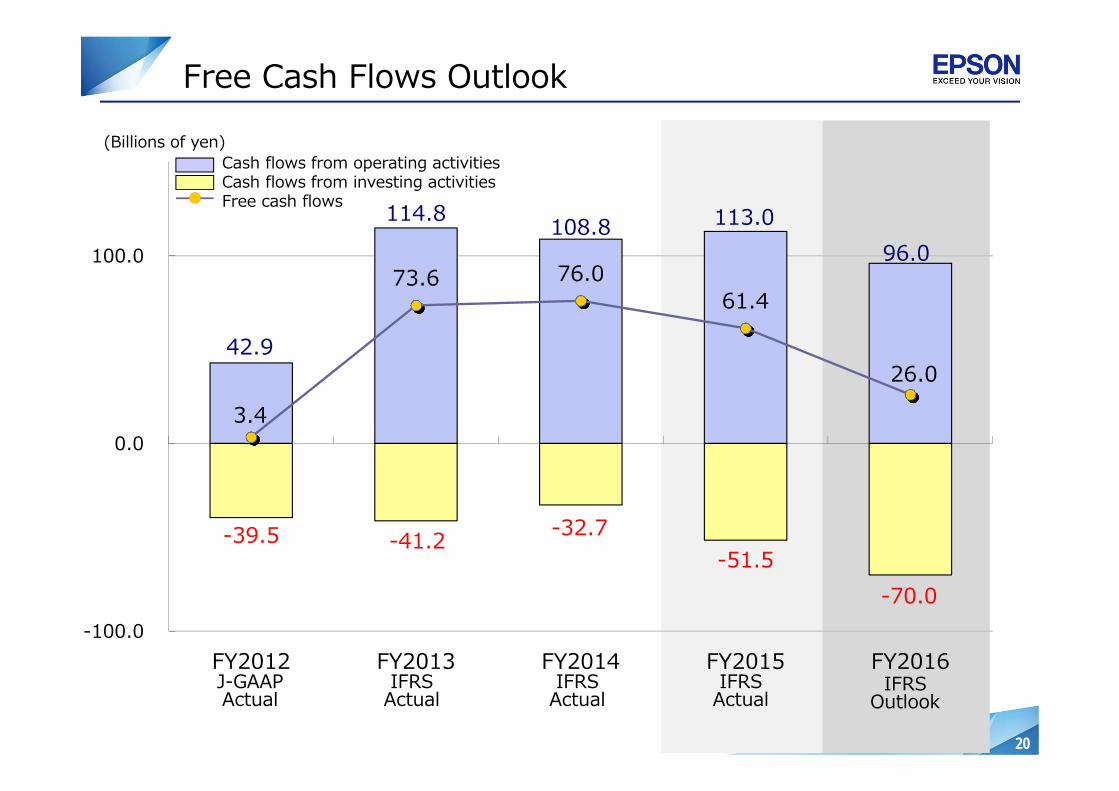
42.9
114.8 108.8 113.0 96.0
-39.5 -41.2 -32.7 -51.5
-70.0
3.4
73.6 76.061.4
26.0
-100.0
0.0
100.0
FY2012 FY2013 FY2014 FY2015 FY2016
Free Cash Flows Outlook(Billions of yen)
Cash flows from operating activitiesCash flows from investing activitiesFree cash flows
IFRSActual
IFRSActual
J-GAAPActual
IFRSActual
IFRSOutlook

21
2.3
10.4 10.6 8.76.62.5 8.9 9.3 7.8 6.3
-4.0
27.7 26.3
9.510.0
-30.0
-20.0
-10.0
0.0
10.0
20.0
30.0
FY2012 FY2013 FY2014 FY2015 FY2016
ROA:
ROS:
ROE:
(%)
Main Management Indicators
[J-GAAP]: Ordinary income/ total assets (avg. balance) [IFRS] Business profit/ total assets (avg. balance)
[J-GAAP]: Operating income/ net sales[IFRS]: Business profit/ revenue
[J-GAAP]: Net income/ shareholdersʼ equity (avg. balance)[IFRS]: Profit for the period attributable to owners of the parent company/
Equity attributable to owners of the parent company (avg. balance)
IFRSActual
IFRSActual
J-GAAPActual
IFRSActual
IFRSOutlook

22
Reference

23
Major Business Indicators
Category FY2015Actual
FY20161/31
Outlook
3-yearcumulative
(FY2016-18 business plan)
Operating CF 113.0 96.0 Approx.
330.0
FCF 61.4 26.0 Approx.120.0
Capitalexpenditure 69.4 77.0 Approx.
210.0
R&D costs 53.1 56.0 Invest aggressively
Exchange rate
FY2015Actual
FY20161/31
OutlookFY2016-18
business plan
USD ¥120.14 ¥107.00 ¥115.00
EUR ¥132.58 ¥117.00 ¥125.00
FY2015Actual
FY20161/31
Outlook
FY2018Targets
Printing Solutions
Revenue 736.3 688.0 805.0
Business profit 104.7 87.0 -
Visual Communications
Revenue 184.0 174.0 200.0
Business profit 15.5 15.0 -
Wearable & Industrial Products
Revenue 170.4 159.0 195.0
Business profit 9.8 6.0 -
Other Revenue 1.4 1.0 0.0
Business profit -0.5 -1.0 -
Corporate,Adjustment Revenue 0.2 -2.0 0.0
Business profit -44.6 -43.0 -
Consolidated total Revenue 1,092.4 1,020.0 1,200.0
Business profit 84.9 64.0 96.0
ROS 7.8% 6.3% 8%
ROE 9.5% 10.0% Sustain at at least 10%
(Billions of yen) (Billions of yen)

24
Main Product Sales TrendsFY2015 result (vs. FY2014) and FY2016 result/ forecast (vs. FY2015)
Product FY2015Full year
FY2016Q1
FY2016Q2
FY2016Q3
FY2016Full year(outlook)
IJP
Volume +1% +8% +5% +2% +7%
Office/ high-capacity ink tank as % of total unit sales
Approx. 20%/Approx. 35% - - - Approx. 20%/
Approx. 40%
ASP + low single-digit % Around -10% - mid 10% - low single-digit % - high single-digit %
Revenue + low single-digit % - low single-digit % - low teen % Flat YoY Flat YoY
IJP ink
Volume (packs) 0% -3% -7% -2% -
ASP + mid-single-digit % - low single-digit % - high single-digit % - low single-digit % -
Revenue + mid-single-digit % - mid-single-digit % - mid-teen % - mid-single-digit % - high single-digit %
SIDM printers
Volume -6% +19% +10% -13% +3%
ASP + low single-digit % - mid 20% - mid 20% - mid teen % - low 20%
Revenue - low single-digit % Around -10% - high teen % - high 20% - high 10%
Projec-tors
Volume +2% +9% +8% +7% +6%
ASP + low single-digit % - mid-teen % - mid-teen % - high single-digit % - low teen %
Revenue + mid-single-digit % - high single-digit % - high single-digit % Flat YoY - mid-single-digit %
ASP (average selling prices) and sales amounts after conversion to yen
The indicators in this document are based on values tracked internally by Epson.