THIRD QUARTER AND NINE MONTHS ENDED SEPTEMBER 30, 2018 CONSOLIDATED ... - Concha y … ·...
15
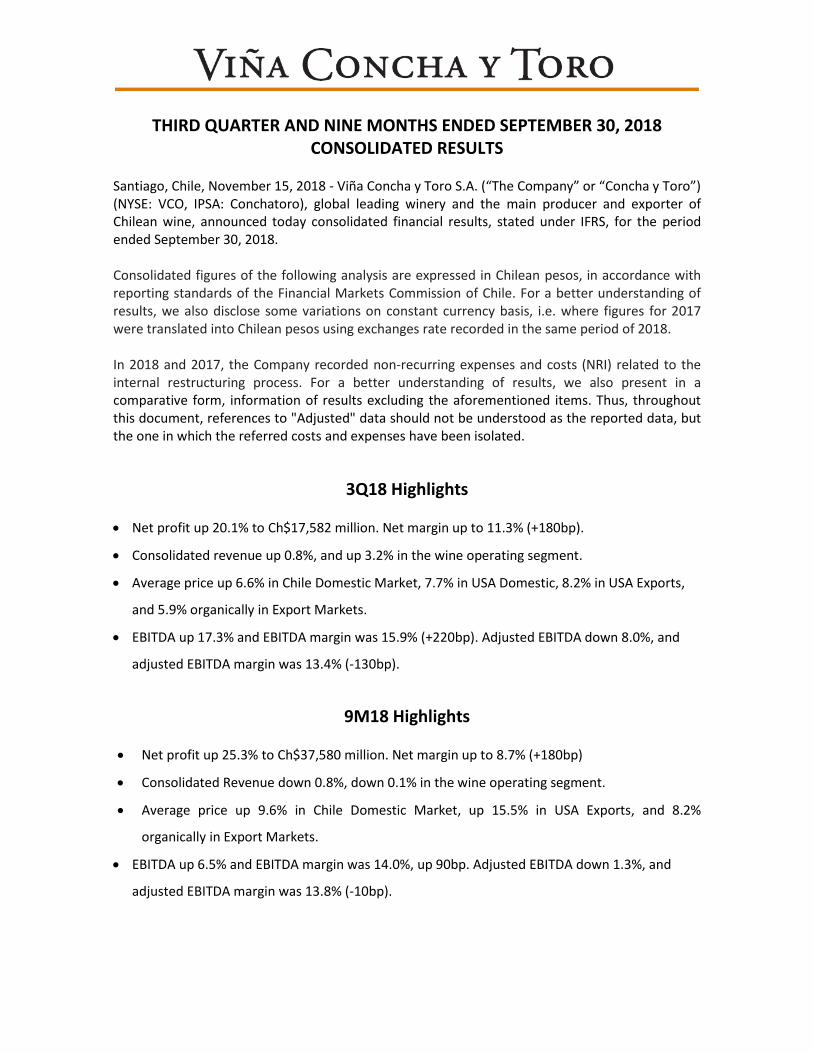
THIRD QUARTER AND NINE MONTHS ENDED SEPTEMBER 30, 2018 CONSOLIDATED RESULTS Santiago, Chile, November 15, 2018 - Viña Concha y Toro S.A. (“The Company” or “Concha y Toro”) (NYSE: VCO, IPSA: Conchatoro), global leading winery and the main producer and exporter of Chilean wine, announced today consolidated financial results, stated under IFRS, for the period ended September 30, 2018. Consolidated figures of the following analysis are expressed in Chilean pesos, in accordance with reporting standards of the Financial Markets Commission of Chile. For a better understanding of results, we also disclose some variations on constant currency basis, i.e. where figures for 2017 were translated into Chilean pesos using exchanges rate recorded in the same period of 2018. In 2018 and 2017, the Company recorded non-recurring expenses and costs (NRI) related to the internal restructuring process. For a better understanding of results, we also present in a comparative form, information of results excluding the aforementioned items. Thus, throughout this document, references to "Adjusted" data should not be understood as the reported data, but the one in which the referred costs and expenses have been isolated. 3Q18 Highlights Net profit up 20.1% to Ch$17,582 million. Net margin up to 11.3% (+180bp). Consolidated revenue up 0.8%, and up 3.2% in the wine operating segment. Average price up 6.6% in Chile Domestic Market, 7.7% in USA Domestic, 8.2% in USA Exports, and 5.9% organically in Export Markets. EBITDA up 17.3% and EBITDA margin was 15.9% (+220bp). Adjusted EBITDA down 8.0%, and adjusted EBITDA margin was 13.4% (-130bp). 9M18 Highlights Net profit up 25.3% to Ch$37,580 million. Net margin up to 8.7% (+180bp) Consolidated Revenue down 0.8%, down 0.1% in the wine operating segment. Average price up 9.6% in Chile Domestic Market, up 15.5% in USA Exports, and 8.2% organically in Export Markets. EBITDA up 6.5% and EBITDA margin was 14.0%, up 90bp. Adjusted EBITDA down 1.3%, and adjusted EBITDA margin was 13.8% (-10bp).
Transcript of THIRD QUARTER AND NINE MONTHS ENDED SEPTEMBER 30, 2018 CONSOLIDATED ... - Concha y … ·...
THIRD QUARTER AND NINE MONTHS ENDED SEPTEMBER 30, 2018 CONSOLIDATED RESULTS
Santiago, Chile, November 15, 2018 - Viña Concha y Toro S.A. (“The Company” or “Concha y Toro”) (NYSE: VCO, IPSA: Conchatoro), global leading winery and the main producer and exporter of Chilean wine, announced today consolidated financial results, stated under IFRS, for the period ended September 30, 2018. Consolidated figures of the following analysis are expressed in Chilean pesos, in accordance with reporting standards of the Financial Markets Commission of Chile. For a better understanding of results, we also disclose some variations on constant currency basis, i.e. where figures for 2017 were translated into Chilean pesos using exchanges rate recorded in the same period of 2018. In 2018 and 2017, the Company recorded non-recurring expenses and costs (NRI) related to the internal restructuring process. For a better understanding of results, we also present in a comparative form, information of results excluding the aforementioned items. Thus, throughout this document, references to "Adjusted" data should not be understood as the reported data, but the one in which the referred costs and expenses have been isolated.
3Q18 Highlights
Net profit up 20.1% to Ch$17,582 million. Net margin up to 11.3% (+180bp).
Consolidated revenue up 0.8%, and up 3.2% in the wine operating segment.
Average price up 6.6% in Chile Domestic Market, 7.7% in USA Domestic, 8.2% in USA Exports,
and 5.9% organically in Export Markets.
EBITDA up 17.3% and EBITDA margin was 15.9% (+220bp). Adjusted EBITDA down 8.0%, and
adjusted EBITDA margin was 13.4% (-130bp).
9M18 Highlights
Net profit up 25.3% to Ch$37,580 million. Net margin up to 8.7% (+180bp)
Consolidated Revenue down 0.8%, down 0.1% in the wine operating segment.
Average price up 9.6% in Chile Domestic Market, up 15.5% in USA Exports, and 8.2%
organically in Export Markets.
EBITDA up 6.5% and EBITDA margin was 14.0%, up 90bp. Adjusted EBITDA down 1.3%, and
adjusted EBITDA margin was 13.8% (-10bp).
2
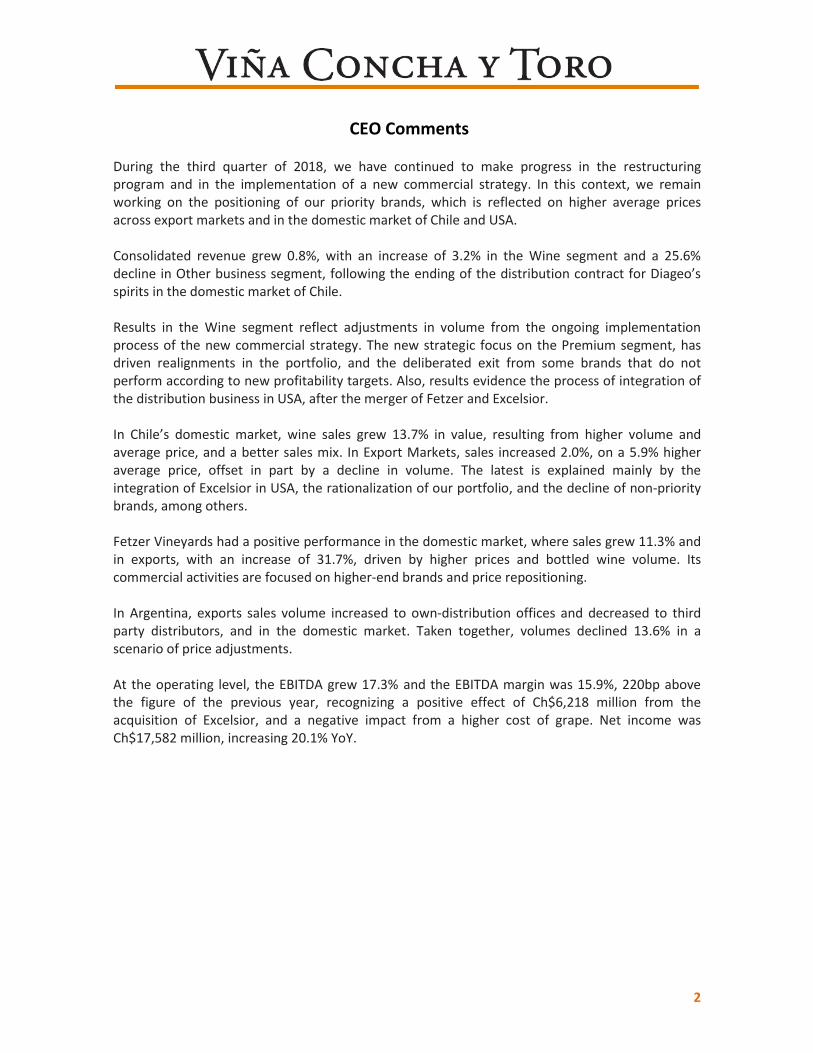
CEO Comments
During the third quarter of 2018, we have continued to make progress in the restructuring program and in the implementation of a new commercial strategy. In this context, we remain working on the positioning of our priority brands, which is reflected on higher average prices across export markets and in the domestic market of Chile and USA. Consolidated revenue grew 0.8%, with an increase of 3.2% in the Wine segment and a 25.6% decline in Other business segment, following the ending of the distribution contract for Diageo’s spirits in the domestic market of Chile. Results in the Wine segment reflect adjustments in volume from the ongoing implementation process of the new commercial strategy. The new strategic focus on the Premium segment, has driven realignments in the portfolio, and the deliberated exit from some brands that do not perform according to new profitability targets. Also, results evidence the process of integration of the distribution business in USA, after the merger of Fetzer and Excelsior. In Chile’s domestic market, wine sales grew 13.7% in value, resulting from higher volume and average price, and a better sales mix. In Export Markets, sales increased 2.0%, on a 5.9% higher average price, offset in part by a decline in volume. The latest is explained mainly by the integration of Excelsior in USA, the rationalization of our portfolio, and the decline of non-priority brands, among others. Fetzer Vineyards had a positive performance in the domestic market, where sales grew 11.3% and in exports, with an increase of 31.7%, driven by higher prices and bottled wine volume. Its commercial activities are focused on higher-end brands and price repositioning. In Argentina, exports sales volume increased to own-distribution offices and decreased to third party distributors, and in the domestic market. Taken together, volumes declined 13.6% in a scenario of price adjustments. At the operating level, the EBITDA grew 17.3% and the EBITDA margin was 15.9%, 220bp above the figure of the previous year, recognizing a positive effect of Ch$6,218 million from the acquisition of Excelsior, and a negative impact from a higher cost of grape. Net income was Ch$17,582 million, increasing 20.1% YoY.
3
Third Quarter 2018 Results
1. Revenue
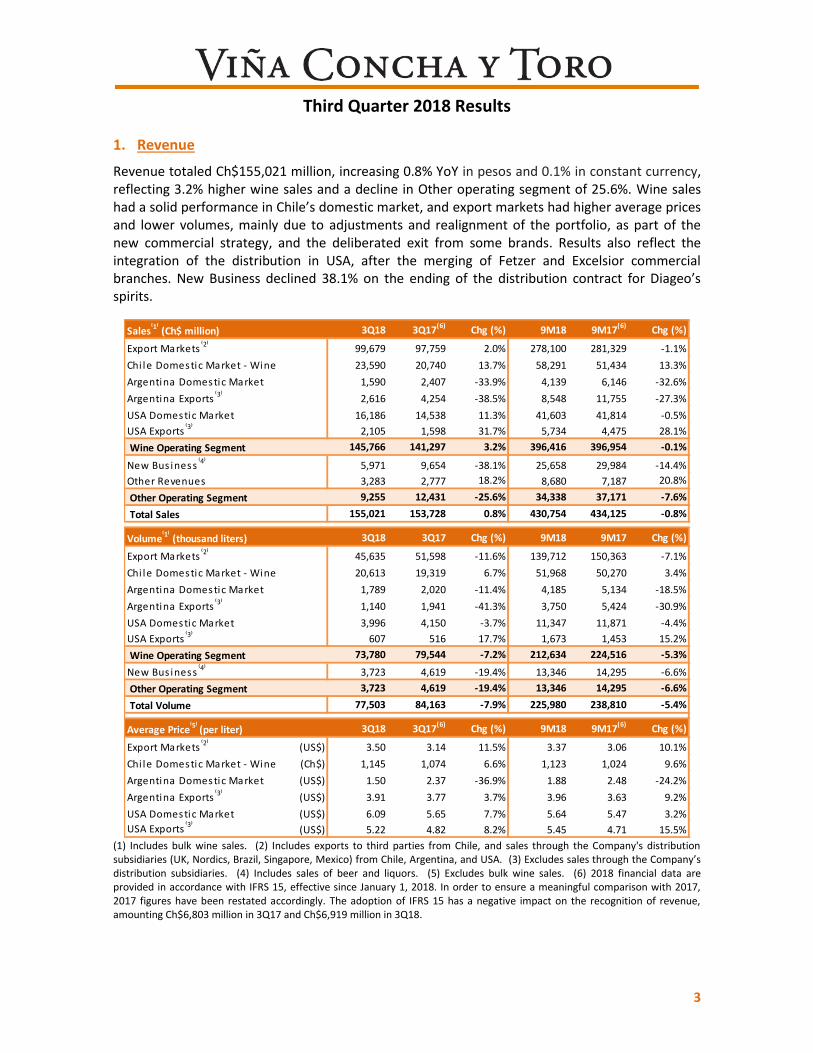
Revenue totaled Ch$155,021 million, increasing 0.8% YoY in pesos and 0.1% in constant currency, reflecting 3.2% higher wine sales and a decline in Other operating segment of 25.6%. Wine sales had a solid performance in Chile’s domestic market, and export markets had higher average prices and lower volumes, mainly due to adjustments and realignment of the portfolio, as part of the new commercial strategy, and the deliberated exit from some brands. Results also reflect the integration of the distribution in USA, after the merging of Fetzer and Excelsior commercial branches. New Business declined 38.1% on the ending of the distribution contract for Diageo’s spirits.
(1) Includes bulk wine sales. (2) Includes exports to third parties from Chile, and sales through the Company's distribution subsidiaries (UK, Nordics, Brazil, Singapore, Mexico) from Chile, Argentina, and USA. (3) Excludes sales through the Company’s distribution subsidiaries. (4) Includes sales of beer and liquors. (5) Excludes bulk wine sales. (6) 2018 financial data are provided in accordance with IFRS 15, effective since January 1, 2018. In order to ensure a meaningful comparison with 2017, 2017 figures have been restated accordingly. The adoption of IFRS 15 has a negative impact on the recognition of revenue, amounting Ch$6,803 million in 3Q17 and Ch$6,919 million in 3Q18.
3Q18 3Q17(6)
Chg (%) 9M18 9M17(6)
Chg (%)
99,679 97,759 2.0% 278,100 281,329 -1.1%
23,590 20,740 13.7% 58,291 51,434 13.3%
1,590 2,407 -33.9% 4,139 6,146 -32.6%
2,616 4,254 -38.5% 8,548 11,755 -27.3%
16,186 14,538 11.3% 41,603 41,814 -0.5%
2,105 1,598 31.7% 5,734 4,475 28.1%
145,766 141,297 3.2% 396,416 396,954 -0.1%
5,971 9,654 -38.1% 25,658 29,984 -14.4%
3,283 2,777 18.2% 8,680 7,187 20.8%
9,255 12,431 -25.6% 34,338 37,171 -7.6%
155,021 153,728 0.8% 430,754 434,125 -0.8%
3Q18 3Q17 Chg (%) 9M18 9M17 Chg (%)
45,635 51,598 -11.6% 139,712 150,363 -7.1%
20,613 19,319 6.7% 51,968 50,270 3.4%
1,789 2,020 -11.4% 4,185 5,134 -18.5%
1,140 1,941 -41.3% 3,750 5,424 -30.9%
3,996 4,150 -3.7% 11,347 11,871 -4.4%
607 516 17.7% 1,673 1,453 15.2%
73,780 79,544 -7.2% 212,634 224,516 -5.3%
3,723 4,619 -19.4% 13,346 14,295 -6.6%
3,723 4,619 -19.4% 13,346 14,295 -6.6%
77,503 84,163 -7.9% 225,980 238,810 -5.4%
3Q18 3Q17(6) Chg (%) 9M18 9M17(6) Chg (%)
Export Markets ⁽2⁾ (US$) 3.50 3.14 11.5% 3.37 3.06 10.1%
Chi le Domestic Market - Wine (Ch$) 1,145 1,074 6.6% 1,123 1,024 9.6%
Argentina Domestic Market (US$) 1.50 2.37 -36.9% 1.88 2.48 -24.2%
Argentina Exports ⁽3⁾ (US$) 3.91 3.77 3.7% 3.96 3.63 9.2%
USA Domestic Market (US$) 6.09 5.65 7.7% 5.64 5.47 3.2%
USA Exports⁽3⁾
(US$) 5.22 4.82 8.2% 5.45 4.71 15.5%
Average Price⁽5⁾ (per liter)
USA Exports⁽3⁾
Wine Operating Segment
New Bus iness⁽4⁾
Other Operating Segment
Total Volume
Export Markets ⁽2⁾
Chi le Domestic Market - Wine
Argentina Domestic Market
Argentina Exports ⁽3⁾
USA Domestic Market
New Bus iness⁽4⁾
Other Revenues
Other Operating Segment
Total Sales
Volume⁽1⁾ (thousand liters)
Argentina Domestic Market
Argentina Exports⁽3⁾
USA Domestic Market
USA Exports⁽3⁾
Wine Operating Segment
Sales⁽1⁾ (Ch$ million)
Export Markets ⁽2⁾
Chi le Domestic Market - Wine
4
1.1. Wine Operating Segment
1.1.1. Export Markets
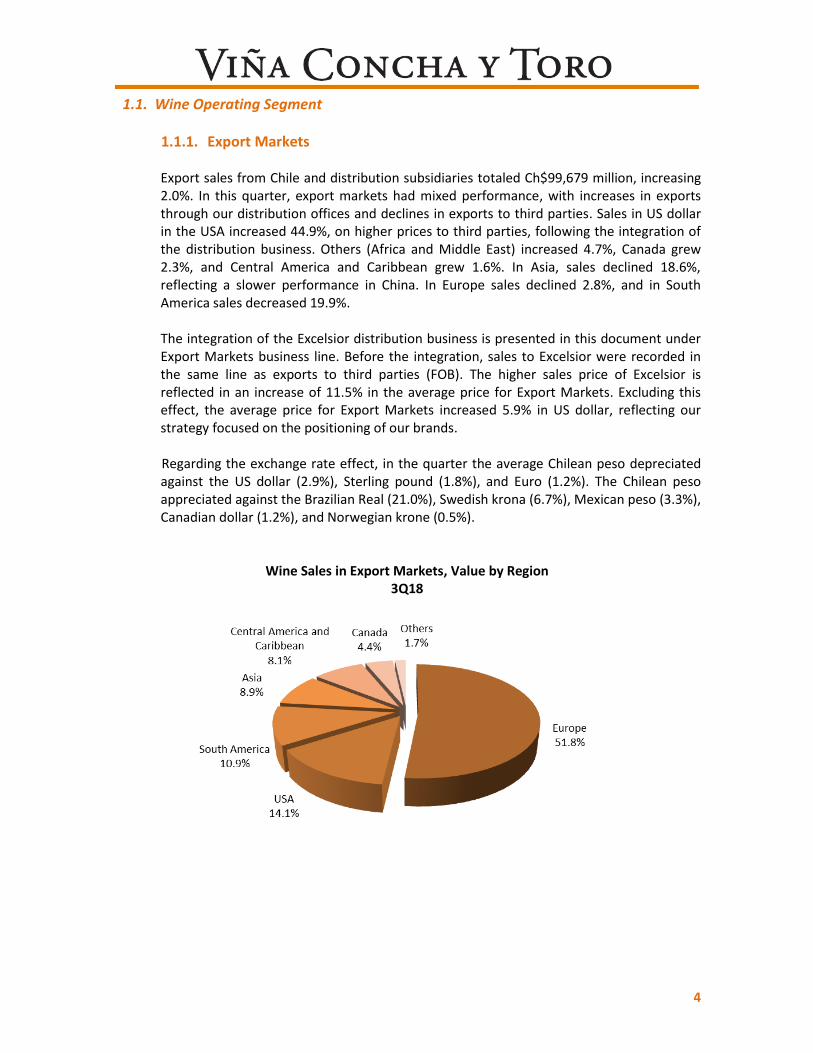
Export sales from Chile and distribution subsidiaries totaled Ch$99,679 million, increasing 2.0%. In this quarter, export markets had mixed performance, with increases in exports through our distribution offices and declines in exports to third parties. Sales in US dollar in the USA increased 44.9%, on higher prices to third parties, following the integration of the distribution business. Others (Africa and Middle East) increased 4.7%, Canada grew 2.3%, and Central America and Caribbean grew 1.6%. In Asia, sales declined 18.6%, reflecting a slower performance in China. In Europe sales declined 2.8%, and in South America sales decreased 19.9%.
The integration of the Excelsior distribution business is presented in this document under Export Markets business line. Before the integration, sales to Excelsior were recorded in the same line as exports to third parties (FOB). The higher sales price of Excelsior is reflected in an increase of 11.5% in the average price for Export Markets. Excluding this effect, the average price for Export Markets increased 5.9% in US dollar, reflecting our strategy focused on the positioning of our brands. Regarding the exchange rate effect, in the quarter the average Chilean peso depreciated against the US dollar (2.9%), Sterling pound (1.8%), and Euro (1.2%). The Chilean peso appreciated against the Brazilian Real (21.0%), Swedish krona (6.7%), Mexican peso (3.3%), Canadian dollar (1.2%), and Norwegian krone (0.5%).
Wine Sales in Export Markets, Value by Region 3Q18
5
1.1.2. Chile Domestic Market – Wine Sales grew 13.7%, totaling Ch$23,590 million as a result of higher average price (+6.6%) and higher volume (+6.7%). Premium volume grew 17.1% in line with the trend seen in the past quarters, while Non-Premium volume increased 5.8%, with a higher average price. Sales in the domestic market were driven by Casillero del Diablo brand, with an increase of 19.2% in volume and 25.8% in sales.
1.1.3. Argentina
Total exports from Argentina, comprising direct exports and exports through distribution subsidiaries declined 12.2%, as result of 38.5% lower direct exports, offset in part by 38.0% higher exports to our distribution subsidiaries. In the quarter, exports’ average price increased 3.7% in US dollar. In the domestic market, sales declined 33.9%, on currency movements (average CLP/ARS down 45% YoY) and lower volume. This reflects a scenario of price increases, a special focus on key markets, and the exit from lower-end, less-profitable products.
1.1.4. USA (Fetzer Vineyards & Excelsior)
In Fetzer Vineyards, the domestic sales increased 11.3%, driven by higher prices and higher bottled volume. In terms of volume, a decline of 3.7% reflected the absence of bulk wine sales, while bottled wine volume increased 3.4%. Sales of Bulk wine are sporadic sales and are not a focus of the business. Average price for bottled wine increased 7.7%, to US$6.1 per liter. Fetzer Vineyards’ direct exports increased 31.7% and exports to distribution offices declined 28.5%, reflecting changes from the new commercial strategy, and the exit from lower-end, less-profitable products. Average prices increased 8.2%, to US$5.2 per liter.
1.2. Other Operating Segment
Other operating segment decreased 25.6% in the quarter, on lower revenues at the New Business segment. Liquors sales declined 71.7%, reflecting the end of the distribution agreement with Diageo. This was partly offset by higher revenues of Premium beer, such as Miller (+31.8), Kross (+26.0%), and the recently launched Estrella Damm.
6
2. Cost of Sales
Cost of sales increased 1.5% to Ch$104,075 million, and in terms of percentage of sales was 67.1%, 40bp higher than in the same quarter in 2017. This is explained largely by the increase in the cost of grape in Chile, which arrived to historically high levels in 2018, and higher, transitory costs related to the closure of a productive plant in Santiago in October. This was partly offset by lower dry costs. In the quarter, the Company recognized extraordinary costs of Ch$846 million related to the ongoing restructuring process1. The figure was Ch$499 million in 3Q17.
3. Selling, General and Administrative Expenses (SG&A)
Selling, general and administrative expenses (distribution costs and administrative expenses) were Ch$39,033 million in the quarter, up 7.1% when compared to the previous year. The SG&A/sales ratio was 25.2%, 160bp above the previous year, reflecting the impact of lower volumes and effects of the integration of the distribution business in USA from July 2018. In 3Q18 and 3Q17 the Company recognized extraordinary restructuring expenses (consultancy fees and severance payments) for Ch$1,483 million and Ch$1,037 million, respectively. Excluding these expenses, the adjusted SG&A totaled Ch$37,550 million, an increase of 6.0%. Adjusted SG&A/sales was 24.2%, 120bp above the adjusted figure of 23.0% in 3Q17. 1
4. Other Income and Expense
Other income net of Other expense totaled Ch$5,544 million in 3Q18, higher than the figure of Ch$160 million in 3Q17. This largely reflects gains of Ch$6,218 million from the revaluation of investments, in the context of the purchase of the remaining 50% stake of Excelsior in July of 2018.
5. Operating Profit Profit from operating activities was Ch$17,457 million, increasing 17.2% on a reported basis and 13.9% on a constant currency basis. The operating margin was 11.3%, with an increase of 160bp reflecting higher Other Income, which was offset in part by higher wine costs and lower volume. Excluding NRI, 3Q18 adjusted profit from operating activities reached Ch$13,568 million, 17.4% below the adjusted figure in 3Q17. Adjusted operating margin was 8.8% in 3Q18, 190bp below the figure in 3Q17. This reflects mainly the impact of a higher cost of wine, as the 2018 vintage grape price reached historically high levels, also due to lower exports volume as consequence of the rationalization of our brand portfolio, the integration of Excelsior in USA, and fewer working days in September 2018, which impacted shipments.
1 In order to facilitate analysis, in page 14 an Adjusted Income Statement is provided. Adjustments comprise
restructuring costs and expenses, and other non-recurring expenses (NRI).
7
6. EBITDA EBITDA (profit from operating activities plus depreciation and amortization expenses) increased 17.3% to Ch$24,626 million in 3Q18. EBITDA margin was 15.9%, 220bp above the figure in 3Q17. Excluding NRI, adjusted EBITDA reached Ch$20,737 million, 8.0% below the adjusted figure in 3Q17. Adjusted EBITDA margin was 13.4% in 3Q18 (-130 bp).
7. Non-Operating Profit In 3Q18, the Non-operating profit was Ch$1,606 million, which compares to a gain of Ch$4,112 million in 3Q17. This is mainly explained by lower exchange differences of Ch$2,182 million in the quarter, compared with Ch$3,791 million in 3Q17. Financial costs, net of financial income and adjustment units, increased 17.9% to Ch$3,047 million, reflecting an increase of financial debt during 2017, and debt placement in January 2018, whose proceeds are been used to refinance debt during 2018.
8. Income Tax Expense For the period, Income tax expense was Ch$1,368 million, lower than the figure of Ch$4,407 million in 3Q17, on lower taxes in USA and Argentina.
9. Profit and Earnings per Share (EPS) Profit attributable to owners of parent increased 20.1%, totaling Ch$17,582 million. Net margin rose to 11.3% in 3Q18, from 9.5% in 3Q17 (+180bp). Based on 747,005,982 weighted average shares, Viña Concha y Toro’s earnings per share totaled
Ch$23.54, 20.1% above the Ch$19.60 per share recorded in the same period of the previous year
.
8
9M18 Results 1. Revenue
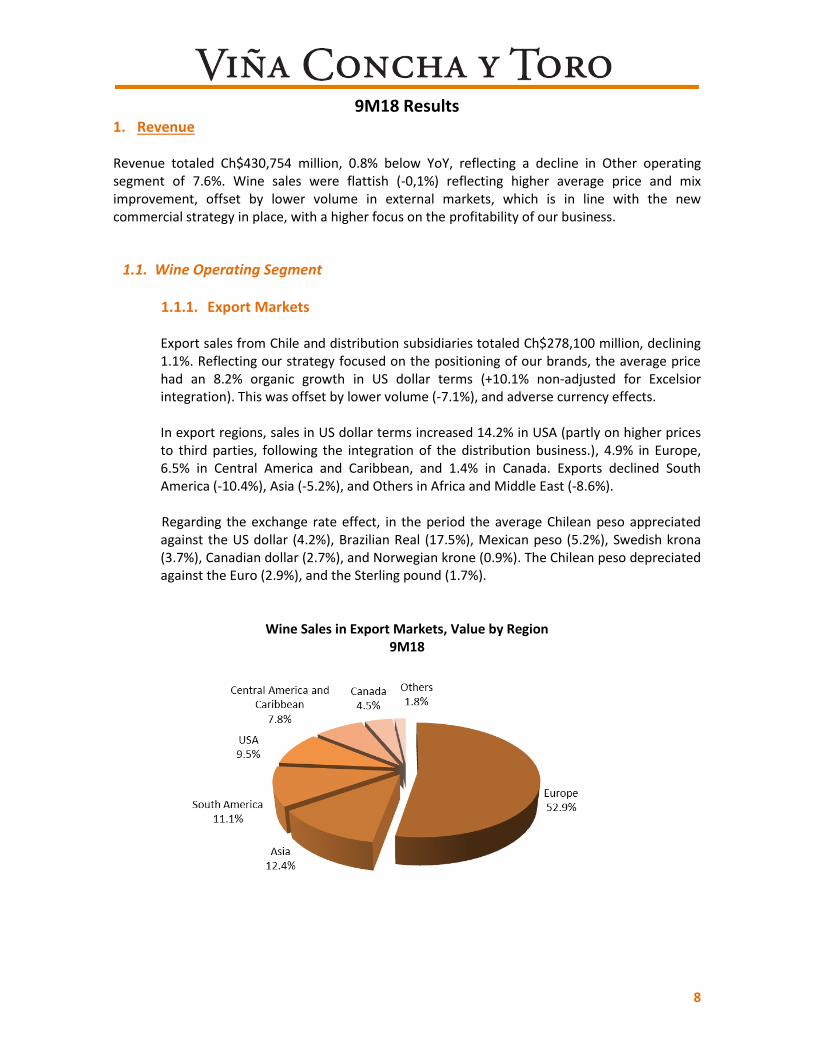
Revenue totaled Ch$430,754 million, 0.8% below YoY, reflecting a decline in Other operating segment of 7.6%. Wine sales were flattish (-0,1%) reflecting higher average price and mix improvement, offset by lower volume in external markets, which is in line with the new commercial strategy in place, with a higher focus on the profitability of our business.
1.1. Wine Operating Segment
1.1.1. Export Markets
Export sales from Chile and distribution subsidiaries totaled Ch$278,100 million, declining 1.1%. Reflecting our strategy focused on the positioning of our brands, the average price had an 8.2% organic growth in US dollar terms (+10.1% non-adjusted for Excelsior integration). This was offset by lower volume (-7.1%), and adverse currency effects. In export regions, sales in US dollar terms increased 14.2% in USA (partly on higher prices to third parties, following the integration of the distribution business.), 4.9% in Europe, 6.5% in Central America and Caribbean, and 1.4% in Canada. Exports declined South America (-10.4%), Asia (-5.2%), and Others in Africa and Middle East (-8.6%). Regarding the exchange rate effect, in the period the average Chilean peso appreciated against the US dollar (4.2%), Brazilian Real (17.5%), Mexican peso (5.2%), Swedish krona (3.7%), Canadian dollar (2.7%), and Norwegian krone (0.9%). The Chilean peso depreciated against the Euro (2.9%), and the Sterling pound (1.7%).
Wine Sales in Export Markets, Value by Region 9M18
9
1.1.2. Chile Domestic Market – Wine Sales increased 13.3%, totaling Ch$58,291 million, from higher average price (+9.6%) and higher volume (+3.4%). Premium volume grew 12.5%, while Non-Premium volume increased 2.6%, with a higher average price. The domestic market was driven by Casillero del Diablo brand.
1.1.3. Argentina
Sales from the Argentine operation (excluding shipments to distribution subsidiaries) totaled Ch$12,687 million, down 29.1%. Total exports from Argentina, comprising direct exports and exports through distribution subsidiaries decreased 11.3%, as result of a decline of 27.3% in direct exports, offset in part by 13.0% higher exports to our distribution subsidiaries. In the period, exports’ average price increased 9.2% in US dollar. In the domestic market, sales declined 32.6%, on currency movements and lower volume. This reflects a scenario of price increases, a special focus on key markets, and the exit from lower-end, less-profitable products.
1.1.4. USA (Fetzer Vineyards)
Sales in the domestic market of Fetzer Vineyards declined 0.5%, mainly reflecting a 4.4% decrease in volume, given the absence of bulk wine sales in 2018. This was partly offset by higher prices (+3.2% to US$5.6 per liter). Fetzer Vineyards’ direct exports increased 28.1% and exports to distribution offices declined 10.9%, reflecting the new commercial strategy, and the exit from lower-end, less-profitable products. Average prices increased in exports (+15.5%, to US$5.5 per liter).
1.2. Other Operating Segment
Other operating segment decreased 7.6% in the period, on lower revenues at the New Business segment. Liquors sales declined 30.5%, reflecting the end of the distribution agreement with Diageo. This was partly offset by higher revenues of Premium beer, such as Miller, Kross, and the recently launched Estrella Damm.
10
2. Cost of Sales
Cost of sales was Ch$290,955 million, 0.1% below the figure of the previous year. The cost of sales as a percentage of sales was 67.5%, 50bp higher than in the same period of 2017, reflecting an increased cost of wine. In the period, the Company recognized extraordinary costs for Ch$1,435 million related to the ongoing restructuring process2. The figure was Ch$1,133 million in 9M17.
3. Selling, General and Administrative Expenses (SG&A)
Selling, general and administrative expenses (distribution costs and administrative expenses) were Ch$103,576 million in the period, similar level of the previous year. As a percentage of sales, SG&A was 24.0% in the period, 20bp above the figure of 9M17, reflecting the impact of lower volumes and the integration of the distribution business in USA from July 2018. In 9M18 and 9M17 the Company recognized extraordinary restructuring expenses (consultancy fees and severance payments) for Ch$3,584 million and Ch$2,455 million, respectively. Excluding these expenses, adjusted SG&A totaled Ch$99,992 million, a decrease of 1.1%. Adjusted SG&A/sales was 23.2%, 10bp below the adjusted figure in 9M17. 1
4. Other Income and Expense
Other income net of Other expense totaled Ch$5,582 million in 9M18, higher than the figure of Ch$110 million in 9M17. This largely reflects gains of Ch$6,218 million from the revaluation of investments, in the context of the purchase of the remaining 50% stake of Excelsior in July.
5. Operating Profit Profit from operating activities increased 5.7% to Ch$41,805 million in the period, resulting from higher Other Income. The operating margin was 9.7% in 9M18, 60bps above the figure of 9M17. Excluding NRI, adjusted profit from operating activities was Ch$40,981 million, decreasing 5.0% from the adjusted figure in 9M17, largely reflecting higher a cost of wine and lower volume. Adjusted operating margin was 9.5% in 9M18, 40bp below the figure in 9M17.
2 In order to facilitate analysis, in page 14 an Adjusted Income Statement is provided. Adjustments comprise
restructuring costs and expenses, and other non-recurring expenses (NRI).
11
6. EBITDA EBITDA (profit from operating activities plus depreciation and amortization expenses) was Ch$60,108 million in 9M18, 6.5% above the figure of 9M17. EBITDA margin was 14.0%, 90bp above the figure in 9M17. Excluding NRI, adjusted EBITDA was Ch$59,285 million, 1.3% below the adjusted figure in 9M17. Adjusted EBITDA margin was 13.8% in 9M18, 10bp below the figure in 9M17.
7. Non-Operating Profit In 9M18, Non-operating profit was Ch$4,057 million, higher than the figure of of Ch$334 million in 9M17. This is mainly explained by higher exchange differences of Ch$10,079 million in the period, compared with Ch$5,064 million in 9M17, reflecting gains from our hedging strategy in Argentina. Financial costs net of financial income and adjustment units, increased 15.4% to Ch$8,571 million in the period, reflecting an increase of financial debt during 2017, and a debt placement in January 2018, whose proceeds are been used to refinance debt during 2018.
8. Income Tax Expense For the period, Income tax expense was Ch$7,894 million, 19.9% lower than the figure of Ch$9,859 million in 9M17, on lower taxes in USA and Argentina.
9. Profit and Earnings per Share (EPS) Profit attributable to owners of parent increased 25.3%, totaling Ch$37,580 million. Net margin rose to 8.7% in 9M18, from 6.9% in 9M17 (+180 bp). Based on 747,005,982 weighted average shares, Viña Concha y Toro’s earnings per share totaled Ch$50.31, 32.6% above the Ch$40.14 per share recorded in the same period of the previous year.
12
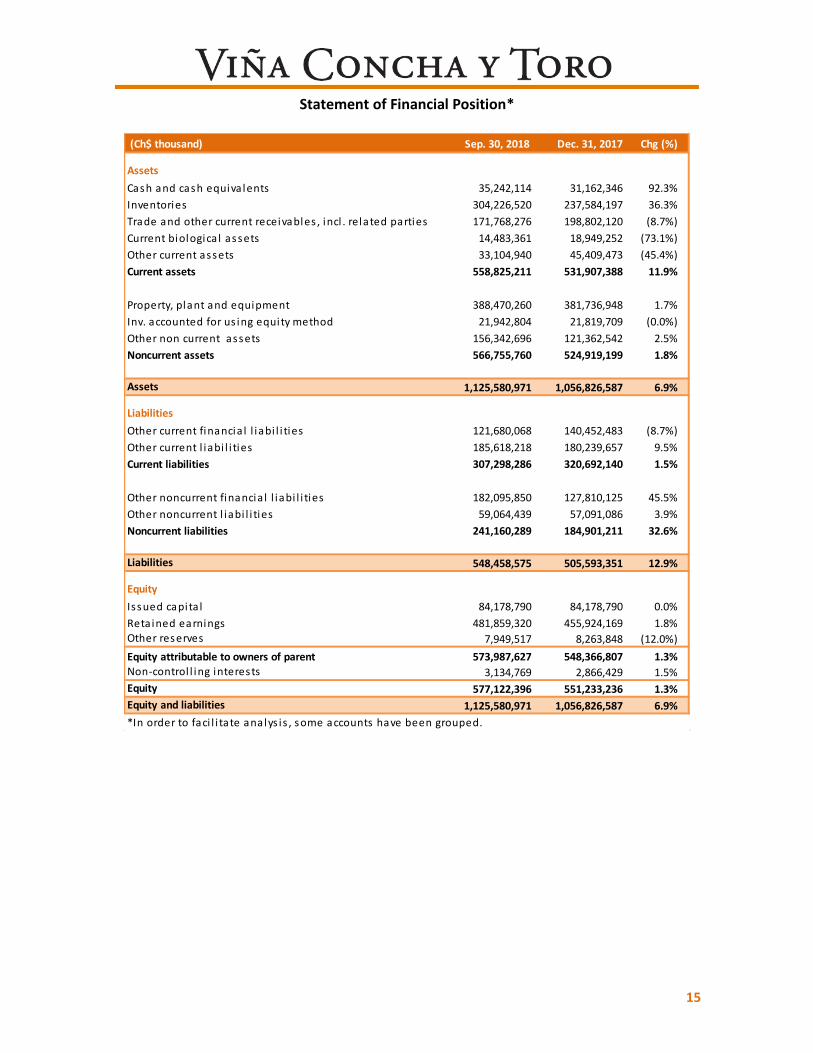
Statement of Financial Position as of September 30, 2018
Assets As of September 30, 2018, Viña Concha y Toro’s assets totaled Ch$1,125,581 million, 6.9% above the figure as of December 31, 2017. Liabilities As of September 30, 2018, Net financial debt amounted Ch$253,070 million, increasing Ch$22,412 million, 9.7% when compared to the figure as of December 31, 2017. This reflects seasonality in the operating cash flow and a debt placement in January 2018. Net Financial Debt is calculated as Other current financial liabilities + Other non-current financial liabilities - Cash and cash equivalents - Derivatives. * * * * * About Viña Concha y Toro Founded in 1883, Viña Concha y Toro is the leading Latin American wine maker, and a one of the world’s largest wine company. It holds around 11,000 hectares of vineyards in Chile, Argentina, and United States, and its wine portfolio includes iconic brands, such as Don Melchor and Almaviva, its flagship brand Casillero del Diablo, Trivento from Argentina, and Fetzer and Bonterra brands from California.
Forward Looking Statements This press release may contain certain forward-looking statements within the meaning of Section 27A of the Securities Act of 1933, as amended, and Section 21E of the Securities Exchange Act of 1934, as amended. With respect to the financial condition, results of operations and business of the Company and certain plans and objectives of the Company with respect to these items. Forward-looking statements may be identified by the use of words such as "anticipate", "continue", "estimate", "expect", "intend", "may", "believe" and similar expressions. By their nature, forward-looking statements involve risk and uncertainty because they relate to events and depend on circumstances that occur in the future. There is a number of factors that could cause results and developments to differ materially from those expressed or implied by these forward-looking statements. These factors include: levels of consumer spending in major economies, changes in consumer tastes and preferences, the levels of marketing and promotional expenditures by the Company and its competitors, raw materials costs, future exchange and interest rates, as well as other risk factors referred in the Company's filings with the Securities and Exchange Commission.
13
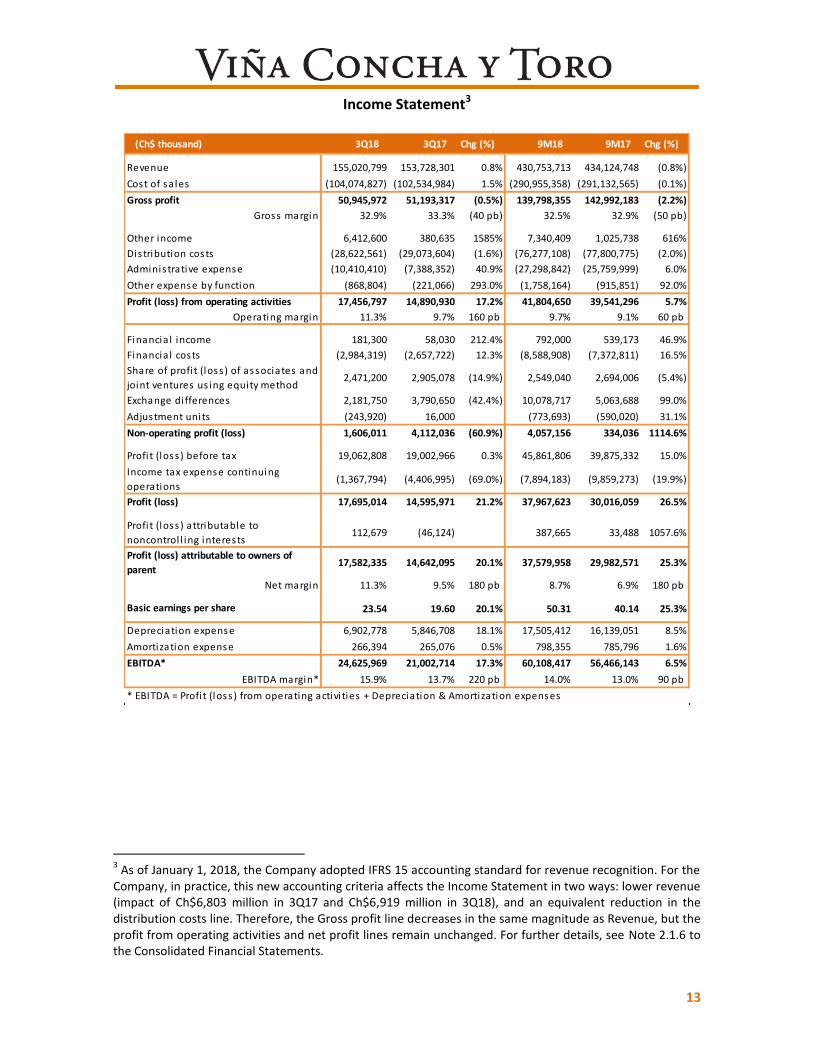
Income Statement3
3 As of January 1, 2018, the Company adopted IFRS 15 accounting standard for revenue recognition. For the
Company, in practice, this new accounting criteria affects the Income Statement in two ways: lower revenue (impact of Ch$6,803 million in 3Q17 and Ch$6,919 million in 3Q18), and an equivalent reduction in the distribution costs line. Therefore, the Gross profit line decreases in the same magnitude as Revenue, but the profit from operating activities and net profit lines remain unchanged. For further details, see Note 2.1.6 to the Consolidated Financial Statements.
(Ch$ thousand) 3Q18 3Q17 Chg (%) 9M18 9M17 Chg (%)
Revenue 155,020,799 153,728,301 0.8% 430,753,713 434,124,748 (0.8%)
Cost of sa les (104,074,827) (102,534,984) 1.5% (290,955,358) (291,132,565) (0.1%)
Gross profit 50,945,972 51,193,317 (0.5%) 139,798,355 142,992,183 (2.2%)
Gross margin 32.9% 33.3% (40 pb) 32.5% 32.9% (50 pb)
Other income 6,412,600 380,635 1585% 7,340,409 1,025,738 616%
Distribution costs (28,622,561) (29,073,604) (1.6%) (76,277,108) (77,800,775) (2.0%)
Adminis trative expense (10,410,410) (7,388,352) 40.9% (27,298,842) (25,759,999) 6.0%
Other expense by function (868,804) (221,066) 293.0% (1,758,164) (915,851) 92.0%
Profit (loss) from operating activities 17,456,797 14,890,930 17.2% 41,804,650 39,541,296 5.7%
Operating margin 11.3% 9.7% 160 pb 9.7% 9.1% 60 pb
Financia l income 181,300 58,030 212.4% 792,000 539,173 46.9%
Financia l costs (2,984,319) (2,657,722) 12.3% (8,588,908) (7,372,811) 16.5%
Share of profi t (loss ) of associates and
joint ventures us ing equity method 2,471,200 2,905,078 (14.9%) 2,549,040 2,694,006 (5.4%)
Exchange di fferences 2,181,750 3,790,650 (42.4%) 10,078,717 5,063,688 99.0%
Adjustment units (243,920) 16,000 (773,693) (590,020) 31.1%
Non-operating profit (loss) 1,606,011 4,112,036 (60.9%) 4,057,156 334,036 1114.6%
Profi t (loss ) before tax 19,062,808 19,002,966 0.3% 45,861,806 39,875,332 15.0%
Income tax expense continuing
operations(1,367,794) (4,406,995) (69.0%) (7,894,183) (9,859,273) (19.9%)
Profit (loss) 17,695,014 14,595,971 21.2% 37,967,623 30,016,059 26.5%
Profi t (loss ) attributable to
noncontrol l ing interests112,679 (46,124) 387,665 33,488 1057.6%
Profit (loss) attributable to owners of
parent17,582,335 14,642,095 20.1% 37,579,958 29,982,571 25.3%
Net margin 11.3% 9.5% 180 pb 8.7% 6.9% 180 pb
Basic earnings per share 23.54 19.60 20.1% 50.31 40.14 25.3%
Depreciation expense 6,902,778 5,846,708 18.1% 17,505,412 16,139,051 8.5%
Amortization expense 266,394 265,076 0.5% 798,355 785,796 1.6%
EBITDA* 24,625,969 21,002,714 17.3% 60,108,417 56,466,143 6.5%
EBITDA margin* 15.9% 13.7% 220 pb 14.0% 13.0% 90 pb
* EBITDA = Profi t (loss ) from operating activi ties + Depreciation & Amortization expenses
14
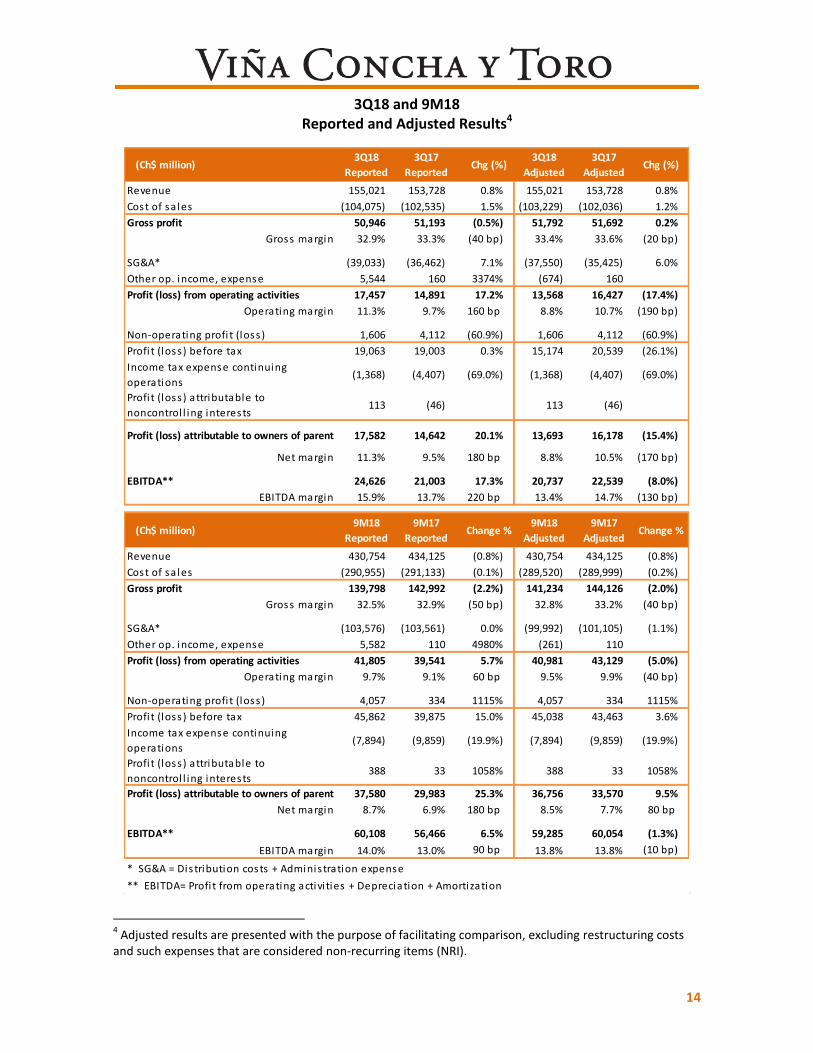
3Q18 and 9M18 Reported and Adjusted Results4
4 Adjusted results are presented with the purpose of facilitating comparison, excluding restructuring costs
and such expenses that are considered non-recurring items (NRI).
Revenue 155,021 153,728 0.8% 155,021 153,728 0.8%
Cost of sa les (104,075) (102,535) 1.5% (103,229) (102,036) 1.2%
Gross profit 50,946 51,193 (0.5%) 51,792 51,692 0.2%
Gross margin 32.9% 33.3% (40 bp) 33.4% 33.6% (20 bp)
SG&A* (39,033) (36,462) 7.1% (37,550) (35,425) 6.0%
Other op. income, expense 5,544 160 3374% (674) 160
Profit (loss) from operating activities 17,457 14,891 17.2% 13,568 16,427 (17.4%)
Operating margin 11.3% 9.7% 160 bp 8.8% 10.7% (190 bp)
Non-operating profi t (loss ) 1,606 4,112 (60.9%) 1,606 4,112 (60.9%)
Profi t (loss ) before tax 19,063 19,003 0.3% 15,174 20,539 (26.1%)
Income tax expense continuing
operations(1,368) (4,407) (69.0%) (1,368) (4,407) (69.0%)
Profi t (loss ) attributable to
noncontrol l ing interests113 (46) 113 (46)
Profit (loss) attributable to owners of parent 17,582 14,642 20.1% 13,693 16,178 (15.4%)
Net margin 11.3% 9.5% 180 bp 8.8% 10.5% (170 bp)
EBITDA** 24,626 21,003 17.3% 20,737 22,539 (8.0%)
EBITDA margin 15.9% 13.7% 220 bp 13.4% 14.7% (130 bp)
Revenue 430,754 434,125 (0.8%) 430,754 434,125 (0.8%)
Cost of sa les (290,955) (291,133) (0.1%) (289,520) (289,999) (0.2%)
Gross profit 139,798 142,992 (2.2%) 141,234 144,126 (2.0%)
Gross margin 32.5% 32.9% (50 bp) 32.8% 33.2% (40 bp)
SG&A* (103,576) (103,561) 0.0% (99,992) (101,105) (1.1%)
Other op. income, expense 5,582 110 4980% (261) 110
Profit (loss) from operating activities 41,805 39,541 5.7% 40,981 43,129 (5.0%)
Operating margin 9.7% 9.1% 60 bp 9.5% 9.9% (40 bp)
Non-operating profi t (loss ) 4,057 334 1115% 4,057 334 1115%
Profi t (loss ) before tax 45,862 39,875 15.0% 45,038 43,463 3.6%
Income tax expense continuing
operations(7,894) (9,859) (19.9%) (7,894) (9,859) (19.9%)
Profi t (loss ) attributable to
noncontrol l ing interests388 33 1058% 388 33 1058%
Profit (loss) attributable to owners of parent 37,580 29,983 25.3% 36,756 33,570 9.5%
Net margin 8.7% 6.9% 180 bp 8.5% 7.7% 80 bp
EBITDA** 60,108 56,466 6.5% 59,285 60,054 (1.3%)
EBITDA margin 14.0% 13.0% 90 bp 13.8% 13.8% (10 bp)
* SG&A = Dis tribution costs + Adminis tration expense
** EBITDA= Profi t from operating activi ties + Depreciation + Amortization
Chg (%)3Q18
Adjusted
3Q17
AdjustedChg (%)
9M18
Adjusted
9M17
AdjustedChange %
(Ch$ million)3Q18
Reported
3Q17
Reported
(Ch$ million)9M18
Reported
9M17
ReportedChange %
15
Statement of Financial Position*
(Ch$ thousand) Sep. 30, 2018 Dec. 31, 2017 Chg (%)
Assets
Cash and cash equiva lents 35,242,114 31,162,346 92.3%
Inventories 304,226,520 237,584,197 36.3%
Trade and other current receivables , incl . related parties 171,768,276 198,802,120 (8.7%)
Current biologica l assets 14,483,361 18,949,252 (73.1%)
Other current assets 33,104,940 45,409,473 (45.4%)
Current assets 558,825,211 531,907,388 11.9%
Property, plant and equipment 388,470,260 381,736,948 1.7%
Inv. accounted for us ing equity method 21,942,804 21,819,709 (0.0%)
Other non current assets 156,342,696 121,362,542 2.5%
Noncurrent assets 566,755,760 524,919,199 1.8%
Assets 1,125,580,971 1,056,826,587 6.9%
Liabilities
Other current financia l l iabi l i ties 121,680,068 140,452,483 (8.7%)
Other current l iabi l i ties 185,618,218 180,239,657 9.5%
Current liabilities 307,298,286 320,692,140 1.5%
Other noncurrent financia l l iabi l i ties 182,095,850 127,810,125 45.5%
Other noncurrent l iabi l i ties 59,064,439 57,091,086 3.9%
Noncurrent liabilities 241,160,289 184,901,211 32.6%
Liabilities 548,458,575 505,593,351 12.9%
Equity
Is sued capita l 84,178,790 84,178,790 0.0%
Retained earnings 481,859,320 455,924,169 1.8%Other reserves 7,949,517 8,263,848 (12.0%)
Equity attributable to owners of parent 573,987,627 548,366,807 1.3%Non-control l ing interests 3,134,769 2,866,429 1.5%
Equity 577,122,396 551,233,236 1.3%
Equity and liabilities 1,125,580,971 1,056,826,587 6.9%
*In order to faci l i tate analys is , some accounts have been grouped.