Consolidated Financial Results for the Nine Months Ended ......Business in Japan (Reference: Page...
18
Company name: Kao Corporation Tokyo Stock Exchange in Japan Stock code: 4452 (URL: http://www.kao.com/global/en/investor-relations/library/results/) Representative: Michitaka Sawada, President and CEO Contact person: Mitsuhiro Watanabe, Vice President, Investor Relations E-mail: [email protected] Scheduled starting date of the dividend payments: - Supplementary documents of the financial results: Yes Financial results information meeting: Yes (for institutional investors and analysts) (Millions of yen, except per share amounts) (Amounts less than one million yen are rounded) 1. Consolidated financial results for the nine months ended September 30, 2017 (from January 1, 2017 to September 30, 2017) (1) Consolidated operating results (Percentages indicate year-on-year changes) % % Net sales 2.4 (0.9) Operating income 5.0 12.7 Income before income taxes 8.2 10.5 Net income 11.6 19.4 Net income attributable to owners of the parent 11.7 18.1 Comprehensive income 158.4 (33.2) Basic earnings per share (Yen) Diluted earnings per share (Yen) (2) Consolidated financial position Total assets Total equity Equity attributable to owners of the parent 2. Dividends Annual cash dividends per share (Yen) 1st quarter end 2nd quarter end 3rd quarter end Fiscal year end Total Note: Revisions to the cash dividends forecasts most recently announced: None 1,379.37 53.8% 50.8% 1,338,309 691,463 679,842 1,357,105 742,138 730,136 Note: In the three months ended March 31, 2017, the Kao Group adopted IFRS 15, “Revenue from Contracts with Customers” and its amendments early in tandem with a revision of its sales system for the Consumer Products Business in Japan (Reference: Page 13, “Changes in Accounting Policies” in "Notes to Condensed Consolidated Financial Statements"). Net sales growth adjusted for the impact of these changes and excluding the effect of currency translation would have been 6.0%. 1,080,250 137,791 Year ending December 31, 2017 - - 48.00 94.00 54.00 108.00 - 54.00 - Ratio of equity attributable to owners of the parent to total assets Equity attributable to owners of the parent per share (Yen) 86,357 97,222 96,423 102,649 195.64 195.50 39,719 137,362 Consolidated Financial Results for the Nine Months Ended September 30, 2017 [IFRS] 1,055,089 131,202 126,970 (Forecast) September 30, 2017 December 31, 2016 Nine months ended September 30, 2016 Nine months ended September 30, 2017 87,085 1,481.73 Year ended December 31, 2016 Year ending December 31, 2017 October 30, 2017 172.25 172.08 46.00
Transcript of Consolidated Financial Results for the Nine Months Ended ......Business in Japan (Reference: Page...

Company name: Kao Corporation Tokyo Stock Exchange in JapanStock code: 4452 (URL: http://www.kao.com/global/en/investor-relations/library/results/)Representative: Michitaka Sawada, President and CEOContact person: Mitsuhiro Watanabe, Vice President, Investor Relations E-mail: [email protected] Scheduled starting date of the dividend payments: -Supplementary documents of the financial results: YesFinancial results information meeting: Yes (for institutional investors and analysts)
(Millions of yen, except per share amounts)(Amounts less than one million yen are rounded)
1. Consolidated financial results for the nine months ended September 30, 2017(from January 1, 2017 to September 30, 2017)
(1)Consolidated operating results(Percentages indicate year-on-year changes)
% %
Net sales 2.4 (0.9)Operating income 5.0 12.7 Income before income taxes 8.2 10.5 Net income 11.6 19.4 Net income attributable to owners of the parent 11.7 18.1 Comprehensive income 158.4 (33.2)Basic earnings per share (Yen)Diluted earnings per share (Yen)
(2)Consolidated financial position
Total assetsTotal equityEquity attributable to owners of the parent
2. Dividends
Annual cash dividends per share (Yen)1st quarter end2nd quarter end3rd quarter endFiscal year endTotal
Note: Revisions to the cash dividends forecasts most recently announced: None
1,379.37
53.8% 50.8%
1,338,309 691,463 679,842
1,357,105 742,138 730,136
Note: In the three months ended March 31, 2017, the Kao Group adopted IFRS 15, “Revenue from Contracts withCustomers” and its amendments early in tandem with a revision of its sales system for the Consumer ProductsBusiness in Japan (Reference: Page 13, “Changes in Accounting Policies” in "Notes to Condensed ConsolidatedFinancial Statements"). Net sales growth adjusted for the impact of these changes and excluding the effect ofcurrency translation would have been 6.0%.
1,080,250 137,791
Year endingDecember 31, 2017
-
- 48.00 94.00
54.00 108.00
- 54.00
-
Ratio of equity attributable to owners of the parent to total assetsEquity attributable to owners of the parent per share (Yen)
86,357 97,222 96,423
102,649 195.64 195.50
39,719
137,362
Consolidated Financial Results for the Nine Months Ended September 30, 2017 [IFRS]
1,055,089 131,202 126,970
(Forecast)
September 30, 2017 December 31, 2016
Nine months ended September 30, 2016
Nine months ended September 30, 2017
87,085
1,481.73
Year endedDecember 31, 2016
Year endingDecember 31, 2017
October 30, 2017
172.25 172.08
46.00

Nine Months Ended September 30, 2017
3.(from January 1, 2017 to December 31, 2017)
(Millions of yen, except per share amounts)(Percentages indicate year-on-year changes)
% %
Net sales 0.1 0.9 Operating income 1.1 7.8 Income before income taxes 6.3 8.5 Net income attributable to owners of the parent 4.0 9.0 Basic earnings per share (Yen) - -
Notes:1)
2) Revisions to the consolidated operating results forecasts most recently announced: None
4. Others
(1)
(2)Changes in accounting policies and changes in accounting estimates1) Changes in accounting principles required by IFRS: None2)
3) Changes in accounting estimates: None
(3)Number of issued shares outstanding at the end of the periods (ordinary shares)
Number of issued shares including treasury sharesNumber of treasury shares
Notice regarding execution of quarterly review procedures
Explanation regarding the appropriate use of forecast of operating results and other special items
Year ending
Forecast of consolidated operating results for the year ending December 31, 2017
Six months ending
This quarterly financial results report is exempt from quarterly review.
Forward-looking statements such as earnings forecasts and other projections contained in this release are based oninformation available at the time of disclosure and assumptions that management believes to be reasonable, and do notconstitute guarantees of future performance. Actual results may differ materially from expectations due to variousfactors.
Please refer to page 6, "Qualitative Information on Financial Results for the Nine Months Ended September 30, 2017 -(2) Description of Information on Outlook, Including Forecast of Consolidated Results" for the suppositions that form theassumptions for earnings forecasts and cautions concerning the use of earnings forecasts.
In the fiscal year ending December 31, 2017, the Kao Group adopted IFRS 15, “Revenue from Contractswith Customers” and its amendments early in tandem with a revision of its sales system for the ConsumerProducts Business in Japan. As a result, certain items formerly treated as expenses are accounted for asreductions of net sales.Calculating net sales for the previous year using the same standard, growth rates in the forecast ofconsolidated business results would be 5.3%.
June 30, 2017 December 31, 2017
199,000
Changes in significant subsidiaries during the period (changes in specified subsidiaries resulting in change in scopeof consolidation): None
September 30, 2017 September 30, 2016Nine months ended
September 30, 2017 December 31, 2016
1,470,000 200,000
Weighted average number of shares outstanding during the period
138,000 280.06
700,000 82,000 82,000 52,000 105.49
501,348,223
495,000,0002,241,116
492,854,195
11,137,654
Changes in accounting principles due to reasons other than 1): YesFor details, please refer to page 13, "Changes in Accounting Policies” in "Notes to Condensed ConsolidatedFinancial Statements"
504,000,000
Nine months ended

1
Nine Months Ended September 30, 2017
Qualitative Information on Financial Results for the Nine Months Ended September 30,
2017
(1) Description of Operating Results
In the three months ended March 31, 2017, the Kao Group adopted IFRS 15, “Revenue from Contracts with
Customers” and its amendments early in tandem with a revision of its sales system for the Consumer
Products Business in Japan (Reference: Page 13, “Changes in Accounting Policies” in “Notes to Condensed
Consolidated Financial Statements”). To facilitate comparison, growth adjusted for the impact of these
changes and excluding the effect of currency translation is presented as “like-for-like” below.
(Billions of yen, except operating margin and per share amounts)
Nine months ended September 30 2017 2016 Growth
Net sales 1,080.2 1,055.1 2.4% Like-for-like: 6.0%
Operating income 137.8 131.2 5.0% Operating margin (%) 12.8 12.4 - Income before income taxes 137.4 127.0 8.2% Net income 97.2 87.1 11.6% Net income attributable to owners of the parent 96.4 86.4 11.7% Basic earnings per share (Yen) 195.64 172.25 13.6%
During the nine months ended September 30, 2017, according to retail store sales data, the household and
personal care products market in Japan, a key market for the Kao Group, shrank 1% on a value basis
compared with the same period a year earlier. However, according to data on consumer purchasing that
includes the e-commerce channel, the market grew 3%. Consumer purchase prices increased 1%. The
cosmetics market in Japan including the e-commerce channel was flat, excluding inbound demand (demand
from visitors to Japan).
Net sales increased 2.4% compared with the same period a year earlier to 1,080.2 billion yen. On a
like-for-like basis, net sales increased 6.0%. Sales of skin care products, sanitary products in Japan and Asia
and the Chemical Business increased substantially.
As for profits, due to more effective deployment of expenses and other factors in addition to the effect of
increased sales in the Human Health Care Business, operating income was 137.8 billion yen, an increase of
6.6 billion yen compared with the same period a year earlier, and income before income taxes was 137.4
billion yen, an increase of 10.4 billion yen. Net income was 97.2 billion yen, an increase of 10.1 billion yen.
Kao Corporation retired 9.0 million treasury shares on March 1, 2017.

2
Nine Months Ended September 30, 2017
The main exchange rates used for translating the financial statement items (income and expenses) of
foreign subsidiaries and associates were as shown below. First quarter
Jan. – Mar. Second quarter
Apr. – Jun. Third quarter Jul. – Sep.
Yen/U.S. dollar 113.71 (115.31) 111.13 (108.05) 110.97 (102.38) Yen/Euro 121.13 (127.15) 122.28 (122.05) 130.35 (114.24) Yen/Chinese yuan 16.50 (17.63) 16.19 (16.55) 16.63 (15.36)
Note: Figures in parentheses represent the exchange rates for the same period a year earlier. Summary of Segment Information
Consolidated Results by Segment
425.6 441.6 (3.6) 1.0 35.4 37.0 (1.6) 8.3 8.4
213.0 193.3 10.2 15.8 28.5 18.2 10.4 13.4 9.4
239.6 244.7 (2.1) 2.1 51.0 53.5 (2.5) 21.3 21.9
878.3 879.6 (0.2) 4.5 114.9 108.6 6.3 13.1 12.3
229.1 201.9 13.5 11.8 21.5 21.8 (0.3) 9.4 10.8
1,107.4 1,081.5 2.4 5.9 136.4 130.4 6.0 - -
Elimination and Reconciliation (27.1) (26.4) - - 1.3 0.8 0.6 - -
1,080.2 1,055.1 2.4 6.0 137.8 131.2 6.6 12.8 12.4 Consolidated
Growth%
Net sales
Consumer ProductsBusiness
Chemical Business
Beauty CareBusinessHuman Health CareBusinessFabric and Home CareBusiness
(Billions of yen)Operating margin (%)
2017 2016
Total
Operating income
Change2017 2016 2017 2016Like-
for-like%Nine months ended September 30

3
Nine Months Ended September 30, 2017
Consolidated Net Sales Composition
Note: Figures for the Consumer Products Business present sales to external customers and figures for the Chemical Business include sales to the Consumer Products Business in addition to external customers. To facilitate comparison, sales for the same period a year earlier are restated using the same method. Sales by geographic region are classified based on the location of the sales recognized.
Net sales to foreign customers were 37.5% of net sales compared with 34.4% for the same period a year
earlier.
(Billions of yen)Japan Asia Americas Europe Consolidated
2017 138.7 16.1 1.8 12.0 168.6
2016 153.3 13.6 1.8 12.0 180.7
Growth % (9.5) 18.1 2.4 0.3 (6.7)
Like-for-like % (2.8) 28.6 (1.0) 2.3 (0.1)
2017 146.2 23.5 55.0 32.3 257.0
2016 148.1 25.3 52.1 35.4 260.9
Growth % (1.3) (7.2) 5.5 (8.6) (1.5)
Like-for-like % 3.0 7.1 3.5 (10.3) 1.7
2017 284.9 39.6 56.8 44.3 425.6
2016 301.4 39.0 53.9 47.3 441.6
Growth % (5.5) 1.6 5.4 (6.4) (3.6)
Like-for-like % 0.0 14.6 3.4 (7.1) 1.0
2017 140.9 72.1 0.0 - 213.0
2016 132.9 60.4 - - 193.3
Growth % 6.0 19.3 - - 10.2
Like-for-like % 10.1 28.2 - - 15.8
2017 209.4 28.8 1.5 - 239.6
2016 211.7 31.7 1.3 - 244.7
Growth % (1.1) (9.3) 16.0 - (2.1)
Like-for-like % 2.4 (0.4) 12.1 - 2.1
2017 635.2 140.4 58.3 44.3 878.3
2016 646.1 131.1 55.2 47.3 879.6
Growth % (1.7) 7.2 5.7 (6.4) (0.2)
Like-for-like % 2.9 17.2 3.6 (7.1) 4.5
2017 91.2 50.6 39.4 47.9 229.1
2016 87.3 42.7 32.4 39.5 201.9
Growth % 4.5 18.6 21.6 21.2 13.5
Like-for-like % 4.5 15.4 18.9 18.0 11.8
2017 (23.4) (2.4) (0.1) (1.2) (27.1)
2016 (23.1) (2.2) (0.0) (1.1) (26.4)
2017 703.0 188.6 97.6 91.0 1,080.2
2016 710.2 171.5 87.5 85.8 1,055.1
Growth % (1.0) 10.0 11.6 6.1 2.4
Like-for-like % 3.2 16.9 9.3 4.3 6.0
Consumer ProductsBusiness
Chemical Business
Elimination of intersegment
Consolidated
Nine months ended September 30
Cosmetics
Skin care/hair careproducts
Beauty CareBusiness
Human Health CareBusiness
Fabric and Home CareBusiness

4
Nine Months Ended September 30, 2017
Consumer Products Business
Sales decreased 0.2% compared with the same period a year earlier to 878.3 billion yen. On a like-for-like
basis, sales increased 4.5%.
In Japan, sales decreased 1.7% to 635.2 billion yen. On a like-for-like basis, sales increased 2.9%. The Kao
Group made efforts that included launching numerous high-value-added products and enhancing
proposal-oriented sales activities amid 3% growth in the market including the e-commerce channel.
In Asia, sales increased 7.2% to 140.4 billion yen, with strong growth centered on China, Indonesia and
elsewhere. On a like-for-like basis, sales increased 17.2%.
In the Americas, sales increased 5.7% to 58.3 billion yen. On a like-for-like basis, sales increased 3.6%. In
Europe, sales decreased 6.4% to 44.3 billion yen. On a like-for-like basis, sales decreased 7.1%.
Operating income increased 6.3 billion yen compared with the same period a year earlier to 114.9 billion yen
due to the effect of increased sales in the Human Health Care Business.
Note: The Kao Group’s Consumer Products Business consists of the Beauty Care Business, the Human Health Care Business, and the Fabric and Home Care Business.
Beauty Care Business
Sales decreased 3.6% compared with the same period a year earlier to 425.6 billion yen. On a like-for-like
basis, sales increased 1.0%.
Sales of cosmetics decreased 6.7% to 168.6 billion yen. On a like-for-like basis, sales decreased 0.1%. In
Japan, sales decreased due in part to a decline in sales related to inbound demand, which had increased in
the previous year, and to the effect of the different timing of launches of improved products compared with
the previous year. Outside Japan, on the other hand, sales grew strongly as the Kao Group stepped up its
operations in Asia.
Major reforms of the cosmetics business are progressing steadily. SOFINA iP is being rolled out across sales
channels in Japan, receiving a positive reception from many consumers, and performed well in Asia as well
as in Japan. Sales of the global brand KANEBO grew steadily in Japan and Asia, and a rollout in Europe
began.
Sales of skin care and hair care products decreased 1.5% to 257.0 billion yen. On a like-for-like basis, sales
increased 1.7%. Among skin care products, sales of Bioré facial cleanser grew steadily, with good
performance in Japan, Asia and the Americas, and a rollout in Europe. In addition, sales were strong for
Curél derma care products in Japan and Asia. On the other hand, sales of hair care products decreased due
to the impact of intensifying competition, despite the launch of premium products.

5
Nine Months Ended September 30, 2017
Operating income decreased 1.6 billion yen compared with the same period a year earlier to 35.4 billion yen.
Human Health Care Business
Sales increased 10.2% compared with the same period a year earlier to 213.0 billion yen. On a like-for-like
basis, sales increased 15.8%.
Sales of sanitary products increased. Sales of Merries baby diapers grew steadily. In Japan, sales increased
in the domestic market and cross-border e-commerce for the Chinese market is also growing substantially.
In China, sales grew due in part to initial shipments following a distribution channel change as part of
structural reforms that have been underway since 2016 and to increased shipments for e-commerce. In
Indonesia, sales of locally produced products targeting the middle-class consumer segment grew steadily.
Sales of personal health products increased. Sales of oral care products increased, with the launch of a new
product and steady sales of high-performance products. Sales of MegRhythm Steam Eye Mask grew steadily
with an increase in new users in Japan, despite a decrease in inbound demand.
Operating income increased 10.4 billion yen compared with the same period a year earlier to 28.5 billion yen,
mainly due to the effect of increased sales in Japan and Asia.
Fabric and Home Care Business
Sales decreased 2.1% compared with the same period a year earlier to 239.6 billion yen. On a like-for-like
basis, sales increased 2.1%.
In Japan, sales of fabric care products increased on a like-for-like basis. Sales of laundry detergents were
nearly flat due to the severe market environment, despite the launch of improved Attack Neo Antibacterial
EX W Power amid rising consumer awareness of bacteria. Sales of fabric softeners were firm. Sales of home
care products grew steadily with consumer acceptance of high-value-added products.
In a severe competitive environment in Asia, sales on a like-for-like basis nearly recovered to the level of the
same period a year earlier.
Operating income decreased 2.5 billion yen compared with the same period a year earlier to 51.0 billion yen
due to factors including the effects of higher raw material prices and decreased sales in Asia.

6
Nine Months Ended September 30, 2017
Chemical Business
Sales increased 13.5% compared with the same period a year earlier to 229.1 billion yen. On a like-for-like
basis, sales increased 11.8%.
Sales of oleo chemicals increased due to factors including efforts to adjust selling prices globally in line with
rising raw material prices. Sales of performance chemicals increased with market conditions in
infrastructure-related fields in Japan on a recovery track, in addition to an increase in automobile production
volume in Japan, China and elsewhere. Sales of specialty chemicals increased steadily with growth in
demand for information material-related products amid a recovery trend among customer industries. To
expedite the development of water-based pigment inkjet ink that contributes to the mitigation of
environmental impact and to accelerate the global expansion of such business, the Kao Group acquired
companies in the United States and Europe and made them consolidated subsidiaries as of July 2016 for the
company in the United States and as of April 2017 for the company in Europe.
Operating income decreased 0.3 billion yen compared with the same period a year earlier to 21.5 billion yen
due to the impact of sharp fluctuations in prices of natural fats and oils used as raw materials, despite the
growth in sales.
(2) Description of Information on Outlook, Including Forecast of Consolidated Results
The Kao Group Mid-term Plan “K20,” which covers the four years to fiscal 2020, started from the three
months ended March 31, 2017. The Kao Group aims to achieve its targets by steadily executing the
strategies incorporated in the plan, one by one.
There is no change from the forecast of consolidated operating results for the year ending December 31,
2017 that was announced on July 27, 2017.
The main exchange rates used in the forecast of consolidated results are 110 yen per U.S. dollar, 123 yen
per euro and 16.8 yen per Chinese yuan.
(Remainder of page intentionally left blank.)

7
Nine Months Ended September 30, 2017
Condensed Consolidated Statement of Financial Position(Millions of yen)
September 30, 2017 December 31, 2016
AssetsCurrent assets
Cash and cash equivalents 292,430 303,026 Trade and other receivables 196,324 208,459 Inventories 183,094 165,200 Other financial assets 13,996 13,038 Income tax receivables 4,570 1,462 Other current assets 19,752 23,812
Subtotal 710,166 714,997 Non-current assets held for sale 147 344 Total current assets 710,313 715,341
Non-current assetsProperty, plant and equipment 389,160 370,835 Goodwill 138,653 137,783 Intangible assets 15,190 14,689
5,905 4,701 Other financial assets 26,628 25,473 Deferred tax assets 53,158 50,939 Other non-current assets 18,098 18,548 Total non-current assets 646,792 622,968
Total assets 1,357,105 1,338,309
Investments accounted for using the equity method

8
Nine Months Ended September 30, 2017
Condensed Consolidated Statement of Financial Position(Millions of yen)
September 30, 2017 December 31, 2016
Liabilities and equityLiabilities
Current liabilitiesTrade and other payables 217,791 216,893 Bonds and borrowings 25,259 30,289 Other financial liabilities 5,037 8,164 Income tax payables 25,206 32,621 Provisions 3,600 11,370 Contract liabilities 17,255 ‐
Other current liabilities 100,335 131,112 Total current liabilities 394,483 430,449
Non-current liabilitiesBonds and borrowings 95,336 90,357 Other financial liabilities 10,214 11,666 Retirement benefit liabilities 95,164 94,773 Provisions 13,928 13,809 Deferred tax liabilities 599 528 Other non-current liabilities 5,243 5,264 Total non-current liabilities 220,484 216,397
Total liabilities 614,967 646,846
EquityShare capital 85,424 85,424 Capital surplus 107,897 107,648 Treasury shares (9,674) (57,124)Other components of equity (16,550) (21,821)Retained earnings 563,039 565,715 Equity attributable to owners of the parent 730,136 679,842 Non-controlling interests 12,002 11,621 Total equity 742,138 691,463
Total liabilities and equity 1,357,105 1,338,309

9
Nine Months Ended September 30, 2017
Condensed Consolidated Statement of Income(Millions of yen)
Nine months ended Nine months ended September 30, 2017 September 30, 2016
Net sales 1 1,080,250 1,055,089 Cost of sales (610,066) (463,123)Gross profit 470,184 591,966
Selling, general and administrative expenses 2 (333,841) (461,461)Other operating income 10,492 9,978 Other operating expenses (9,044) (9,281)Operating income 1 137,791 131,202
Financial income 1,011 1,007 Financial expenses (3,083) (6,766)
1,643 1,527 Income before income taxes 137,362 126,970
Income taxes (40,140) (39,885)Net income 97,222 87,085
Attributable to:Owners of the parent 96,423 86,357 Non-controlling interests 799 728 Net income 97,222 87,085
Earnings per shareBasic (Yen) 195.64 172.25 Diluted (Yen) 195.50 172.08
Notes
Share of profit in investments accounted for using the equity method

10
Nine Months Ended September 30, 2017
Condensed Consolidated Statement of Comprehensive Income(Millions of yen)
Nine months ended Nine months ended September 30, 2017 September 30, 2016
Net income 97,222 87,085
Other comprehensive income
Items that will not be reclassified to profit or loss:
817 (1,367)29 (468)
291 (131)Total of items that will not be reclassified to profit or loss 1,137 (1,966)
Items that may be reclassified subsequently to profit or loss:Exchange differences on translation of foreign operations 4,305 (45,356)
(15) (44)
4,290 (45,400)
Other comprehensive income, net of taxes 5,427 (47,366)Comprehensive income 102,649 39,719
Attributable to:Owners of the parent 101,848 40,456 Non-controlling interests 801 (737)Comprehensive income 102,649 39,719
Share of other comprehensive income of investments accounted for using the equity methodTotal of items that may be reclassified subsequently to profit or loss
Net gain (loss) on revaluation of financial assets measured at fair value through other comprehensive income Remeasurements of defined benefit plans Share of other comprehensive income of investments accounted for using the equity method
11
Nine Months Ended September 30, 2017
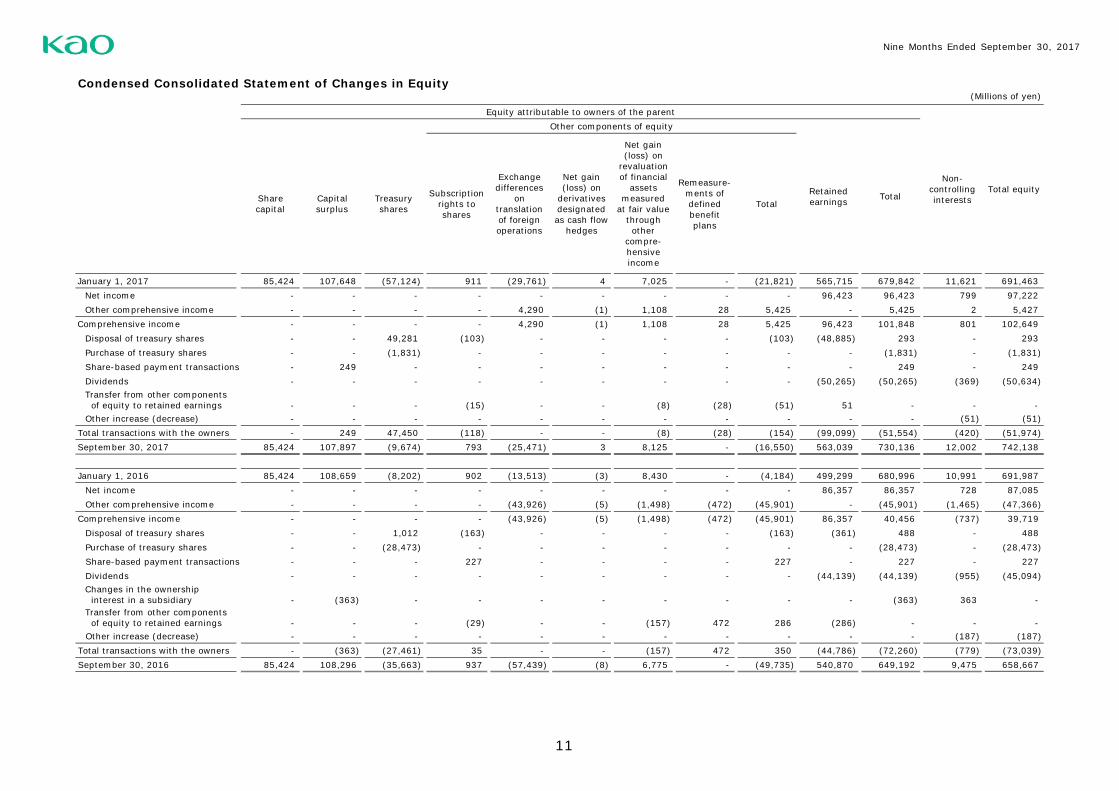
Condensed Consolidated Statement of Changes in Equity(Millions of yen)
N
Sharecapital
Capitalsurplus
Treasuryshares
Subscriptionrights toshares
Exchangedifferences
ontranslationof foreignoperations
Net gain(loss) on
derivativesdesignatedas cash flow
hedges
Net gain(loss) on
revaluationof financial
assetsmeasured
at fair valuethroughother
compre-hensiveincome
Remeasure-ments ofdefinedbenefitplans
Total
January 1, 2017 85,424 107,648 (57,124) 911 (29,761) 4 7,025 - (21,821) 565,715 679,842 11,621 691,463 Net income - - - - - - - - - 96,423 96,423 799 97,222 Other comprehensive income - - - - 4,290 (1) 1,108 28 5,425 - 5,425 2 5,427
Comprehensive income - - - - 4,290 (1) 1,108 28 5,425 96,423 101,848 801 102,649 Disposal of treasury shares - - 49,281 (103) - - - - (103) (48,885) 293 - 293 Purchase of treasury shares - - (1,831) - - - - - - - (1,831) - (1,831)Share-based payment transactions - 249 - - - - - - - - 249 - 249 Dividends - - - - - - - - - (50,265) (50,265) (369) (50,634)
- - - (15) - - (8) (28) (51) 51 - - - Other increase (decrease) - - - - - - - - - - - (51) (51)
Total transactions with the owners - 249 47,450 (118) - - (8) (28) (154) (99,099) (51,554) (420) (51,974)September 30, 2017 85,424 107,897 (9,674) 793 (25,471) 3 8,125 - (16,550) 563,039 730,136 12,002 742,138
January 1, 2016 85,424 108,659 (8,202) 902 (13,513) (3) 8,430 - (4,184) 499,299 680,996 10,991 691,987 Net income - - - - - - - - - 86,357 86,357 728 87,085 Other comprehensive income - - - - (43,926) (5) (1,498) (472) (45,901) - (45,901) (1,465) (47,366)
Comprehensive income - - - - (43,926) (5) (1,498) (472) (45,901) 86,357 40,456 (737) 39,719 Disposal of treasury shares - - 1,012 (163) - - - - (163) (361) 488 - 488 Purchase of treasury shares - - (28,473) - - - - - - - (28,473) - (28,473)Share-based payment transactions - - - 227 - - - - 227 - 227 - 227 Dividends - - - - - - - - - (44,139) (44,139) (955) (45,094)
- (363) - - - - - - - - (363) 363 -
- - - (29) - - (157) 472 286 (286) - - - Other increase (decrease) - - - - - - - - - - - (187) (187)
Total transactions with the owners - (363) (27,461) 35 - - (157) 472 350 (44,786) (72,260) (779) (73,039)September 30, 2016 85,424 108,296 (35,663) 937 (57,439) (8) 6,775 - (49,735) 540,870 649,192 9,475 658,667
Transfer from other components of equity to retained earnings
Changes in the ownership interest in a subsidiaryTransfer from other components of equity to retained earnings
Total equity
Equity attributable to owners of the parentOther components of equity
Non-controllinginterests
Retainedearnings Total
12
Nine Months Ended September 30, 2017
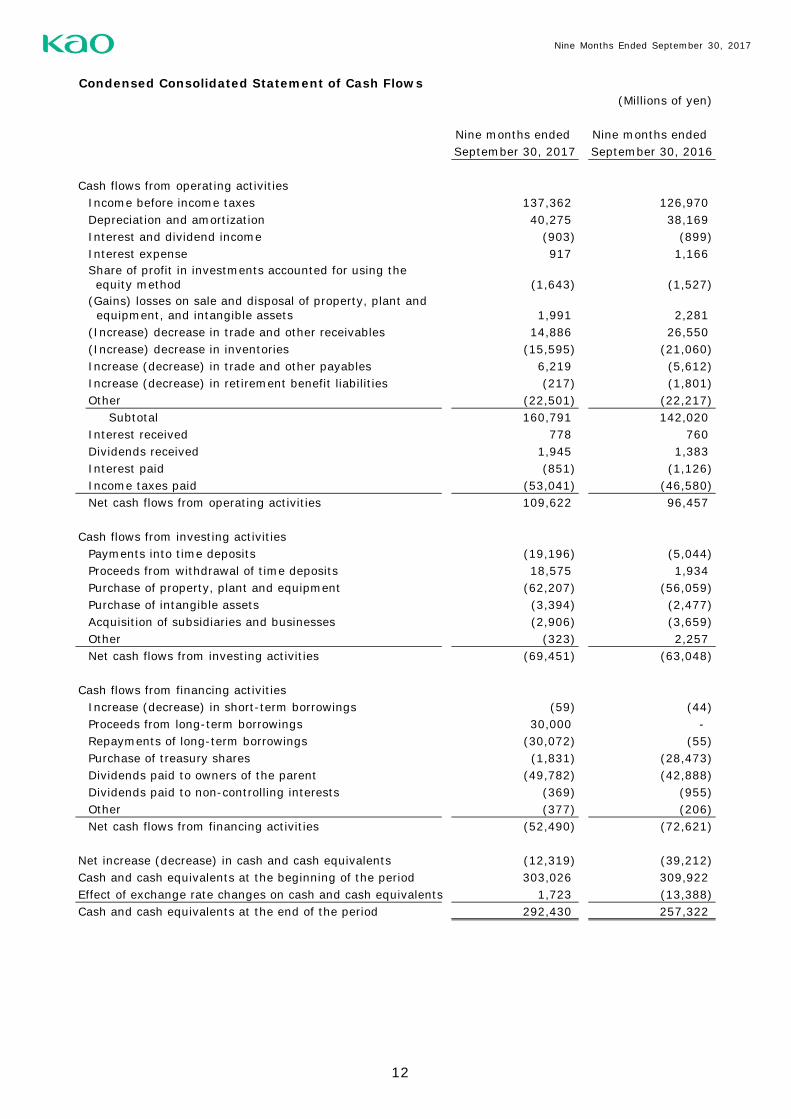
Condensed Consolidated Statement of Cash Flows(Millions of yen)
Nine months ended Nine months ended September 30, 2017 September 30, 2016
Cash flows from operating activitiesIncome before income taxes 137,362 126,970 Depreciation and amortization 40,275 38,169 Interest and dividend income (903) (899)Interest expense 917 1,166
(1,643) (1,527)
1,991 2,281 (Increase) decrease in trade and other receivables 14,886 26,550 (Increase) decrease in inventories (15,595) (21,060)Increase (decrease) in trade and other payables 6,219 (5,612)Increase (decrease) in retirement benefit liabilities (217) (1,801)Other (22,501) (22,217)
Subtotal 160,791 142,020 Interest received 778 760 Dividends received 1,945 1,383 Interest paid (851) (1,126)Income taxes paid (53,041) (46,580)Net cash flows from operating activities 109,622 96,457
Cash flows from investing activitiesPayments into time deposits (19,196) (5,044)Proceeds from withdrawal of time deposits 18,575 1,934 Purchase of property, plant and equipment (62,207) (56,059)Purchase of intangible assets (3,394) (2,477)Acquisition of subsidiaries and businesses (2,906) (3,659)Other (323) 2,257 Net cash flows from investing activities (69,451) (63,048)
Cash flows from financing activitiesIncrease (decrease) in short-term borrowings (59) (44)Proceeds from long-term borrowings 30,000 - Repayments of long-term borrowings (30,072) (55)Purchase of treasury shares (1,831) (28,473)Dividends paid to owners of the parent (49,782) (42,888)Dividends paid to non-controlling interests (369) (955)Other (377) (206)Net cash flows from financing activities (52,490) (72,621)
Net increase (decrease) in cash and cash equivalents (12,319) (39,212)Cash and cash equivalents at the beginning of the period 303,026 309,922 Effect of exchange rate changes on cash and cash equivalents 1,723 (13,388)Cash and cash equivalents at the end of the period 292,430 257,322
Share of profit in investments accounted for using the equity method(Gains) losses on sale and disposal of property, plant and equipment, and intangible assets

13
Nine Months Ended September 30, 2017
Notes to Condensed Consolidated Financial Statements
Changes in Accounting Policies Early Adoption of IFRS 15 “Revenue from Contracts with Customers” and its amendments
In the three months ended March 31, 2017, the Kao Group early adopted IFRS 15 “Revenue from Contracts
with Customers” (issued in May 2014) and “Clarifications to IFRS 15” (issued in April 2016) (together,
hereinafter “IFRS 15”). As a transitional measure upon the early adoption of IFRS 15, the Kao Group applies
this Standard retrospectively with the cumulative effect of initially applying this Standard recognized at the
date of initial application.
In accordance with the adoption of IFRS 15, revenue is recognized based on the following five-step model.
Step 1: Identify the contract with a customer
Step 2: Identify the performance obligations in the contract
Step 3: Determine the transaction price
Step 4: Allocate the transaction price to the performance obligations in the contract
Step 5: Recognize revenue when the entity satisfies a performance obligation
The Kao Group sells consumer products including cosmetics, skin care products, hair care products, sanitary
products and fabric care products, as well as chemical products including fatty alcohols and surfactants. For
sales of such products, because the customer obtains control over the products upon delivery, the
performance obligation is judged to have been satisfied and revenue is therefore recognized upon delivery
of the products. Revenue is measured at the consideration promised in a contract with a customer, less
discounts, rebates, returned products and other items.
Based on the above five-step model, as a result of identification of performance obligations under contracts
with customers, the portion of sales promotion and other expenses that is consideration paid by the Kao
Group to customers, which had previously been accounted for as selling, general and administrative
expenses, is accounted for as reductions of net sales from the three months ended March 31, 2017. In
addition, freight/warehouse expenses, employee benefits and other expenses necessary for satisfying
performance obligations that had previously been accounted for as selling, general and administrative
expenses are accounted for as cost of sales from the three months ended March 31, 2017.
As a result, compared with the application of the former accounting standard, net sales decreased by 32,238
million yen, selling, general and administrative expenses decreased by 126,524 million yen, and cost of
sales increased by 94,286 million yen on the condensed consolidated statement of income for the nine
months ended September 30, 2017. These changes had no effect on operating income and net income.
In addition, with the application of IFRS 15, liabilities for returned products, which were previously included
in “Provisions” under current liabilities, and refund liabilities for rebates and other payments and advances
received from customers, which had previously been included in “Other current liabilities,” are presented as
“Contract liabilities.”

14
Nine Months Ended September 30, 2017
As a result, compared with the application of the former accounting standard, as of the beginning and end
of the nine months ended September 30, 2017, “Provisions” under current liabilities decreased by 3,965
million yen and 2,854 million yen, respectively, and “Other current liabilities” decreased by 12,582 million
yen and 14,401 million yen, respectively, on the condensed consolidated statement of financial position.
1. Segment Information
(1) Summary of reportable segments
Major products by reportable segment are as follows:
Cosmetics Counseling cosmetics, Self-selection cosmetics
Skin care products Soaps, Facial cleansers, Body cleansers
Hair care products Shampoos, Conditioners, Hair styling agents, Hair coloring agents
Food and beverage products Beverages
Sanitary products Sanitary napkins, Baby diapers
Personal health products Bath additives, Oral care products, Men's products, Thermo products
Fabric care products Laundry detergents, Fabric treatments
Home care products Kitchen cleaning products, House cleaning products, Paper cleaning products, Commercial-use products
Oleo chemicals Fatty alcohols, Fatty amines, Fatty acids, Glycerin, Commercial-use edible fats and oils
Performance chemicals Surfactants, Plastics additives, Superplasticizers for concrete admixtures
Specialty chemicals Toner and toner binder for copiers and printers, Ink and colorants for inkjet printers, Fragrances and aroma chemicals
Chemical Business
Reportable Segments Major Products
Consumer Products Business
Beauty Care Business
Human Health Care Business
Fabric and Home Care Business

15
Nine Months Ended September 30, 2017
(2) Sales and results of reportable segments
Sales and Results of Reportable Segments(Millions of yen)
Nine months ended September 30, 2017
Beauty CareBusiness
Human HealthCare Business
Fabric andHome CareBusiness
Subtotal
Net salesSales to customers 425,618 213,040 239,627 878,285 201,965 1,080,250 - 1,080,250 Intersegment sales and transfers2 - - - - 27,147 27,147 (27,147) - Total net sales 425,618 213,040 239,627 878,285 229,112 1,107,397 (27,147) 1,080,250
Operating income (loss) 35,377 28,544 50,981 114,902 21,548 136,450 1,341 137,791 % of net sales 8.3 13.4 21.3 13.1 9.4 - - 12.8 Financial income 1,011 Financial expenses (3,083)Share of profit in investments accounted for using the equity method 1,643
Income before income taxes 137,362
Notes:1. The operating income reconciliation of 1,341 million yen includes corporate expenses not allocated to reportable segments, as well as elimination of intersegment inventory transactions.2. Intersegment sales and transfers are mainly calculated based on market price and manufacturing cost.
(Millions of yen)Nine months ended September 30, 2016
Beauty CareBusiness
Human HealthCare Business
Fabric andHome CareBusiness
Subtotal
Net salesSales to customers 441,638 193,301 244,686 879,625 175,464 1,055,089 - 1,055,089 Intersegment sales and transfers2 - - - - 26,440 26,440 (26,440) - Total net sales 441,638 193,301 244,686 879,625 201,904 1,081,529 (26,440) 1,055,089
Operating income (loss) 36,955 18,176 53,494 108,625 21,824 130,449 753 131,202 % of net sales 8.4 9.4 21.9 12.3 10.8 - - 12.4 Financial income 1,007 Financial expenses (6,766)Share of profit in investments accounted for using the equity method 1,527
Income before income taxes 126,970
Notes:1. The operating income reconciliation of 753 million yen includes corporate expenses not allocated to reportable segments, as well as elimination of intersegment inventory transactions.2. Intersegment sales and transfers are mainly calculated based on market price and manufacturing cost.
Consumer Products BusinessChemicalBusiness Total Reconciliations1 Consolidated
Reportable Segments
Total Reconciliations1 Consolidated
Reportable Segments
ChemicalBusiness
Consumer Products Business

16
Nine Months Ended September 30, 2017
2. Selling, General and Administrative Expenses
The breakdown of selling, general and administrative expenses is as follows:
The note “Changes in Accounting Policies” in “Notes to Condensed Consolidated Financial Statements”
presents the impact on selling, general and administrative expenses resulting from the adoption of IFRS 15.
As a transitional measure upon the adoption of IFRS 15, the Kao Group applies this Standard retrospectively
with the cumulative effect of initially applying this Standard recognized at the date of initial application and
thus has not adjusted the amounts for the comparative period. Expenses of 13,103 million yen, 86 million
yen, 17,548 million yen and 1,501 million yen previously included in “Freight/warehouse,” “Advertising,”
“Sales promotion” and “Other,” respectively, are accounted for as reductions of net sales. Expenses of
32,610 million yen, 1,952 million yen, 39,091 million yen, 2,118 million yen, 72 million yen and 18,443
million yen previously included in “Freight/warehouse,” “Sales promotion,” “Employee benefits,”
“Depreciation,” “Amortization” and “Other,” respectively, are accounted for as cost of sales. As a result,
compared with the application of the former accounting standard, selling, general and administrative
expenses decreased by 126,524 million yen.
Furthermore, as an additional item other than the adoption of IFRS 15 impacting selling, general and
administrative expenses, the Kao Group revised its sales system for the Consumer Products Business in
Japan in the three months ended March 31, 2017. Expenses of 1,474 million yen and 14,202 million yen
previously included in “Sales promotion” and “Other,” respectively, are accounted for as reductions of net
sales. As a result, selling, general and administrative expenses decreased by 15,676 million yen.
Changes in significant subsidiaries during this quarterly period: None
Note regarding Assumption of Going Concern:None
(Millions of yen)
Nine months ended Nine months ended September 30, 2017 September 30, 2016
Freight/warehouse 74 42,254 Advertising 64,907 69,323 Sales promotion 42,502 58,581 Employee benefits 110,081 142,312 Depreciation 6,656 8,318 Amortization 3,533 4,955 Research and development 42,550 40,028 Other 63,538 95,690
Total 333,841 461,461