Third Quarter 2016 / Office Market Report San Diego Diego Office...1artnerThip. erforNance....
6
Partnership. Performance. avisonyoung.com Market Overview The San Diego office market continued to make steady gains as of the third quarter of 2016. Vacancy is gradually getting tighter, while rent increases have not slowed down. The market is supported by diverse industries and desirable geography while benefitting from strong demand for space by healthcare innovators, independent research institutes and sectors that work closely with the local military. The San Diego County unemployment rate, as of the third quarter of 2016 dropped to 5.0% from 5.1% one year earlier. Vacancy was 10.3% at the end of the third quarter of 2016, down from 11.5% at the same point in 2015. While vacancy is tighter year-over- year post-recession, vacancy in the third quarter is also down from the previous quarter. Rental increases are not expected to slow, even as new construction is introduced. Office space is spending less time on the market, and fewer months vacant. The rental rate average for all classes reached $2.64 psf FSG at Q3 2016, up from Q3 2015, when rents were at $2.53 psf FSG. The highest rents were in the Central Coast submarket at $3.26 psf FSG with the next highest in the Downtown submarket at $2.55 psf FSG, followed by the North County Coastal area at $2.52 psf FSG. In the past 12-month period, San Diego County recorded a net absorption of positive 1,186,023 sf. Third Quarter 2016 / Office Market Report San Diego Market Facts 5.0% San Diego County Unemployment Rate As Of August 2016 371,695 SF Positive Net Absorption Current Quarter Positive 884,637 SF Year-To-Date 10.3% Total Vacancy Rate Up From 10.7% In Q2 2016 $2.64 PSF Asking Rental Rate Weighted Average San Diego Office Vacancy Tightens, As Rents Surge Ahead
Transcript of Third Quarter 2016 / Office Market Report San Diego Diego Office...1artnerThip. erforNance....

Partnership. Performance. avisonyoung.com
Market Overview
The San Diego office market continued to make steady gains as of the third quarter of 2016. Vacancy is gradually getting tighter, while rent increases have not slowed down. The market is supported by diverse industries and desirable geography while benefitting from strong demand for space by healthcare innovators, independent research institutes and sectors that work closely with the local military. The San Diego County unemployment rate, as of the third quarter of 2016 dropped to 5.0% from 5.1% one year earlier.Vacancy was 10.3% at the end of the third quarter of 2016, down from 11.5% at the same point in 2015.
While vacancy is tighter year-over-year post-recession, vacancy in the third quarter is also down from the previous quarter. Rental increases are not expected to slow, even as new construction is introduced. Office space is spending less time on the market, and fewer months vacant. The rental rate average for all classes reached $2.64 psf FSG at Q3 2016, up from Q3 2015, when rents were at $2.53 psf FSG. The highest rents were in the Central Coast submarket at $3.26 psf FSG with the next highest in the Downtown submarket at $2.55 psf FSG, followed by the North County Coastal area at $2.52 psf FSG. In the past 12-month period, San Diego County recorded a net absorption of positive 1,186,023 sf.
Third Quarter 2016 / Office Market Report
San Diego
Market Facts
5.0%San Diego County
Unemployment RateAs Of August 2016
371,695 SFPositive Net Absorption
Current Quarter
Positive 884,637 SFYear-To-Date
10.3%Total Vacancy Rate
Up From 10.7% In Q2 2016
$2.64 PSFAsking Rental RateWeighted Average
San Diego Office Vacancy Tightens,
As Rents Surge Ahead

Partnership. Performance. avisonyoung.com
Third Quarter 2016 / Office Market Report San Diego
SalesSales volume for the past twelve months has reached $2.6 billion, down moderately from the previous twelve months which reached $3.1 billion. This total includes local portions of larger portfolio sales. Class A inventory has increased in trading volume during the past twelve months, while Class B experienced a retraction after being heavily favored in 2015. The average sale price per square foot is up over the past twelve months, to $240 psf, from the previous twelve months of $212 psf.
Investment Sale401 Mile of Cars Way National City
The largest investment sale during the third quarter was Sorrento Gateway, a two-building life science campus in Sorrento Mesa, purchased by Kilroy Realty Corporation for $355 psf. In total, the buildings were approximately 56% occupied by a single tenant at the time of sale. The next largest deal was South Bay Corporate Center, at 401 Mile of Cars Way in National City, purchased by Bosa Development Corporation, for $225 psf. The building was 77% leased to multiple tenants. Another significant sale consisted of three properties at multiple locations; Bernardo Regency Centre and Foremost Professional Plaza, both in Rancho Bernardo, and Three Governor Park, in Governor Park. The multi-tenant portfolio was 90% leased, and sold to Omninet Capital for $209 psf.
ConstructionThe San Diego office market had ten investment-grade office projects under construction at the third quarter of 2016, including life science projects.
These projects amount to more than 1,382,213 sf of new inventory that will be delivered throughout 2016 and 2017, approximately 83% of which is already pre-committed, with the remainder currently on the market. All new office construction is currently located in the Central Coast and North County areas. The three largest projects reflect the growing needs of the life science sector in the Central Coast area of San Diego.
Transaction Volume
by Property Sector
San Diego County
In total there is nearly one million square feet of space under construction with designated lab buildout to accommodate life science companies. The Rancho Santa Fe market saw the completion of Palma De La Reina, a 20,461 square foot multi-tenant office building, constructed without tenant pre-commitments. There is currently nearly 15 million square feet of proposed office development on record in the county, which is an increase of more than 60% from the same time in the previous year.
Construction3420 Carmel Mountain RoadDel Mar Heights
Partnership. Performance. avisonyoung.com
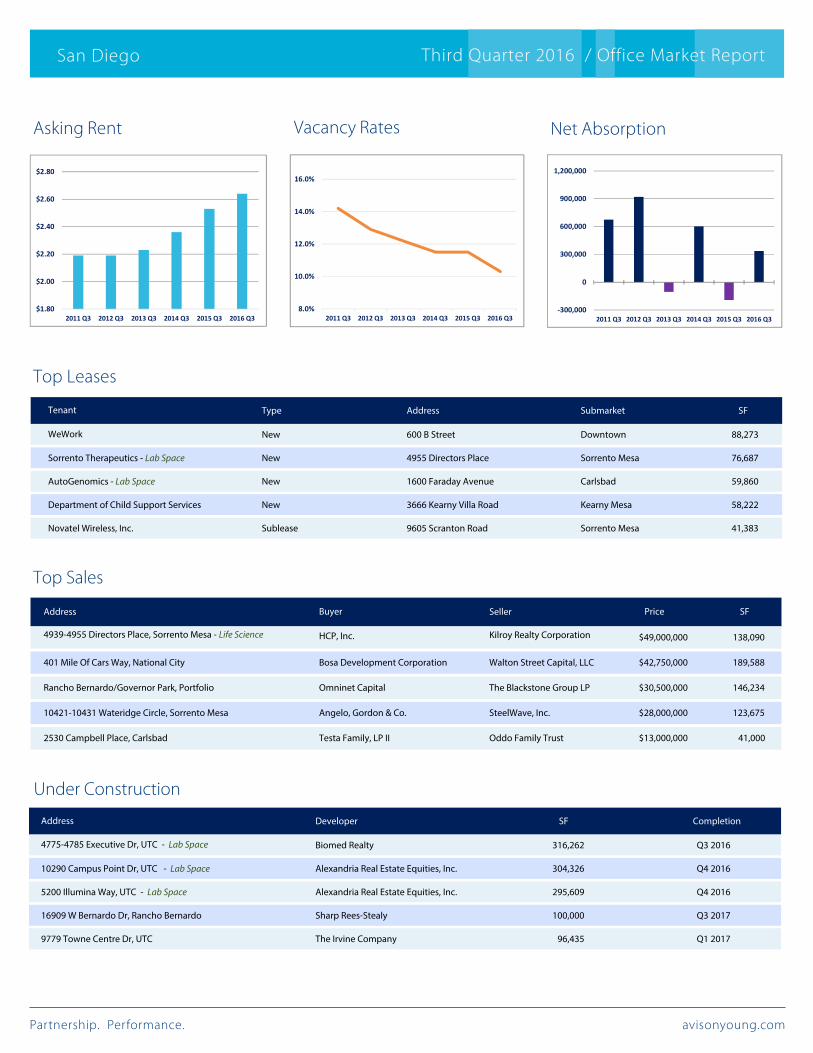
Top Leases
Top Sales
Under Construction
Asking Rent Vacancy Rates Net Absorption
San Diego Third Quarter 2016 / Office Market Report
Buyer Price SFAddress
4939-4955 Directors Place, Sorrento Mesa - Life Science HCP, Inc.
Seller
Kilroy Realty Corporation $49,000,000 138,090
401 Mile Of Cars Way, National City Bosa Development Corporation Walton Street Capital, LLC $42,750,000 189,588
Rancho Bernardo/Governor Park, Portfolio Omninet Capital The Blackstone Group LP $30,500,000 146,234
10421-10431 Wateridge Circle, Sorrento Mesa Angelo, Gordon & Co. SteelWave, Inc. $28,000,000 123,675
2530 Campbell Place, Carlsbad Testa Family, LP II Oddo Family Trust $13,000,000 41,000
Developer SF CompletionAddress
4775-4785 Executive Dr, UTC - Lab Space Biomed Realty 316,262 Q3 2016
10290 Campus Point Dr, UTC - Lab Space Alexandria Real Estate Equities, Inc. 304,326 Q4 2016
5200 Illumina Way, UTC - Lab Space Alexandria Real Estate Equities, Inc. 295,609 Q4 2016
16909 W Bernardo Dr, Rancho Bernardo Sharp Rees-Stealy 100,000 Q3 2017
9779 Towne Centre Dr, UTC The Irvine Company 96,435 Q1 2017
Type Address Submarket SFTenant
WeWork New 600 B Street Downtown 88,273
Sorrento Therapeutics - Lab Space New 4955 Directors Place Sorrento Mesa 76,687
AutoGenomics - Lab Space New 1600 Faraday Avenue Carlsbad 59,860
Department of Child Support Services New 3666 Kearny Villa Road Kearny Mesa 58,222
Novatel Wireless, Inc. Sublease 9605 Scranton Road Sorrento Mesa 41,383
‐300,000
0
300,000
600,000
900,000
1,200,000
2011 Q3 2012 Q3 2013 Q3 2014 Q3 2015 Q3 2016 Q3
$1.80
$2.00
$2.20
$2.40
$2.60
$2.80
2011 Q3 2012 Q3 2013 Q3 2014 Q3 2015 Q3 2016 Q3
8.0%
10.0%
12.0%
14.0%
16.0%
2011 Q3 2012 Q3 2013 Q3 2014 Q3 2015 Q3 2016 Q3
Partnership. Performance. avisonyoung.com
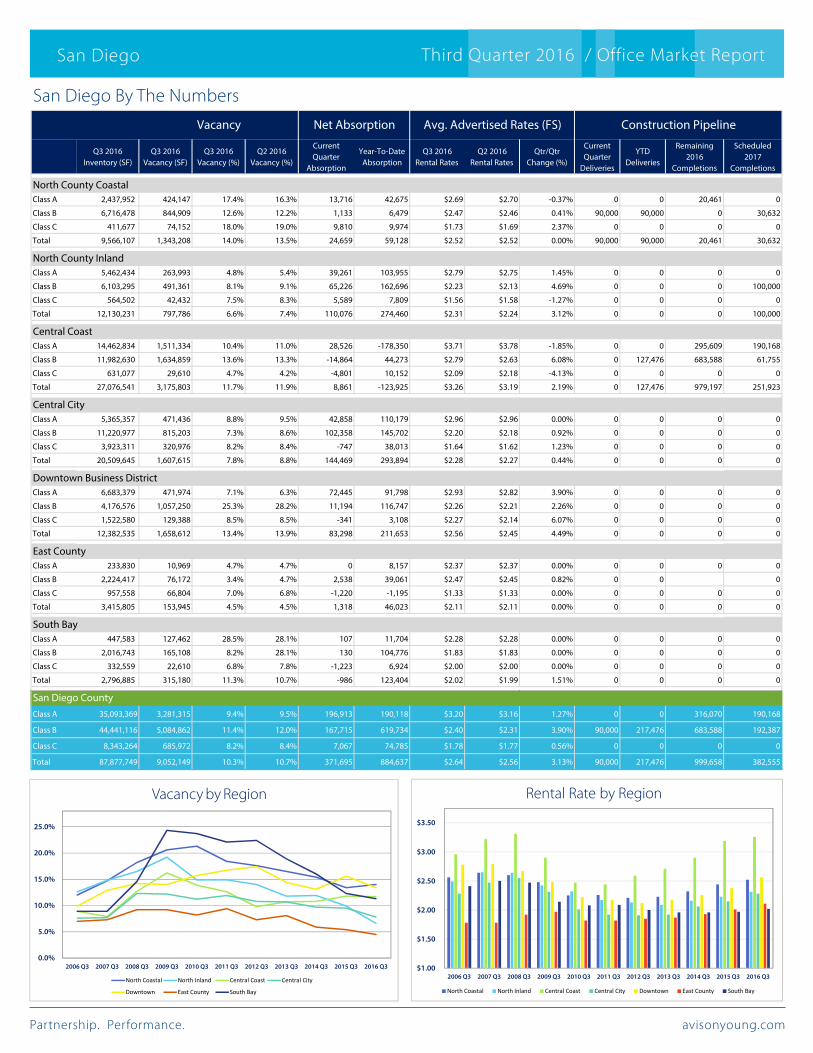
San Diego By The Numbers
San Diego Third Quarter 2016 / Office Market Report
Q3 2016 Inventory (SF)
Q3 2016 Vacancy (SF)
Q3 2016 Vacancy (%)
Q2 2016 Vacancy (%)
Current Quarter
Absorption
Year-To-Date Absorption
Q3 2016 Rental Rates
Q2 2016 Rental Rates
Qtr/Qtr Change (%)
Current Quarter
Deliveries
YTD Deliveries
Remaining 2016
Completions
Scheduled 2017
Completions
North County CoastalClass A 2,437,952 424,147 17.4% 16.3% 13,716 42,675 $2.69 $2.70 -0.37% 0 0 20,461 0
6,716,478 844,909 12.6% 12.2% 1,133 6,479 $2.47 $2.46 0.41% 90,000 90,000 0 30,632
411,677 74,152 18.0% 19.0% 9,810 9,974 $1.73 $1.69 2.37% 0 0 0 0
Class B
Class C
Total 9,566,107 1,343,208 14.0% 13.5% 24,659 59,128 $2.52 $2.52 0.00% 90,000 90,000 20,461 30,632
North County InlandClass A 5,462,434 263,993 4.8% 5.4% 39,261 103,955 $2.79 $2.75 1.45% 0 0 0 0
6,103,295 491,361 8.1% 9.1% 65,226 162,696 $2.23 $2.13 4.69% 0 0 0 100,000
564,502 42,432 7.5% 8.3% 5,589 7,809 $1.56 $1.58 -1.27% 0 0 0 0
Class B
Class C
Total 12,130,231 797,786 6.6% 7.4% 110,076 274,460 $2.31 $2.24 3.12% 0 0 0 100,000
Central CoastClass A 14,462,834 1,511,334 10.4% 11.0% 28,526 -178,350 $3.71 $3.78 -1.85% 0 0 295,609 190,168
Class B 11,982,630 1,634,859 13.6% 13.3% -14,864 44,273 $2.79 $2.63 6.08% 0 127,476 683,588 61,755
Class C 631,077 29,610 4.7% 4.2% -4,801 10,152 $2.09 $2.18 -4.13% 0 0 0 0
Total 27,076,541 3,175,803 11.7% 11.9% 8,861 -123,925 $3.26 $3.19 2.19% 0 127,476 979,197 251,923
Central CityClass A 5,365,357 471,436 8.8% 9.5% 42,858 110,179 $2.96 $2.96 0.00% 0 0 0 0
Class B 11,220,977 815,203 7.3% 8.6% 102,358 145,702 $2.20 $2.18 0.92% 0 0 0 0
Class C 3,923,311 320,976 8.2% 8.4% -747 38,013 $1.64 $1.62 1.23% 0 0 0 0
Total 20,509,645 1,607,615 7.8% 8.8% 144,469 293,894 $2.28 $2.27 0.44% 0 0 0 0
Downtown Business DistrictClass A 6,683,379 471,974 7.1% 6.3% 72,445 91,798 $2.93 $2.82 3.90% 0 0 0 0
4,176,576 1,057,250 25.3% 28.2% 11,194 116,747 $2.26 $2.21 2.26% 0 0 0 0
1,522,580 129,388 8.5% 8.5% -341 3,108 $2.27 $2.14 6.07% 0 0 0 0
Class B
Class C
Total 12,382,535 1,658,612 13.4% 13.9% 83,298 211,653 $2.56 $2.45 4.49% 0 0 0 0
East CountyClass A 233,830 10,969 4.7% 4.7% 0 8,157 $2.37 $2.37 0.00% 0 0 0 0
Class B 2,224,417 76,172 3.4% 4.7% 2,538 39,061 $2.47 $2.45 0.82% 0 0 0
Class C 957,558 66,804 7.0% 6.8% -1,220 -1,195 $1.33 $1.33 0.00% 0 0 0 0
Total 3,415,805 153,945 4.5% 4.5% 1,318 46,023 $2.11 $2.11 0.00% 0 0 0 0
South BayClass A 447,583 127,462 28.5% 28.1% 107 11,704 $2.28 $2.28 0.00% 0 0 0 0
Class B 2,016,743 165,108 8.2% 28.1% 130 104,776 $1.83 $1.83 0.00% 0 0 0 0
Class C 332,559 22,610 6.8% 7.8% -1,223 6,924 $2.00 $2.00 0.00% 0 0 0 0
Total 2,796,885 315,180 11.3% 10.7% -986 123,404 $2.02 $1.99 1.51% 0 0 0 0
San Diego County Class A 35,093,369 3,281,315 9.4% 9.5% 196,913 190,118 $3.20 $3.16 1.27% 0 0 316,070 190,168
Class B 44,441,116 5,084,862 11.4% 12.0% 167,715 619,734 $2.40 $2.31 3.90% 90,000 217,476 683,588 192,387
Class C 8,343,264 685,972 8.2% 8.4% 7,067 74,785 $1.78 $1.77 0.56% 0 0 0 0
Total 87,877,749 9,052,149 10.3% 10.7% 371,695 884,637 $2.64 $2.56 3.13% 90,000 217,476 999,658 382,555
Vacancy Net Absorption Avg. Advertised Rates (FS) Construction Pipeline
0.0%
5.0%
10.0%
15.0%
20.0%
25.0%
2006 Q3 2007 Q3 2008 Q3 2009 Q3 2010 Q3 2011 Q3 2012 Q3 2013 Q3 2014 Q3 2015 Q3 2016 Q3
Vacancy by Region
North Inland Central CoastNorth Coastal Central City
Downtown East County South Bay
$1.00
$1.50
$2.00
$2.50
$3.00
$3.50
Rental Rate by Region
2006 Q3 2007 Q3 2008 Q3 2009 Q3 2010 Q3 2011 Q3 2012 Q3 2013 Q3 2014 Q3 2015 Q3 2016 Q3
North Coastal North Inland Central Coast Central City Downtown East County South Bay
Partnership. Performance. avisonyoung.com
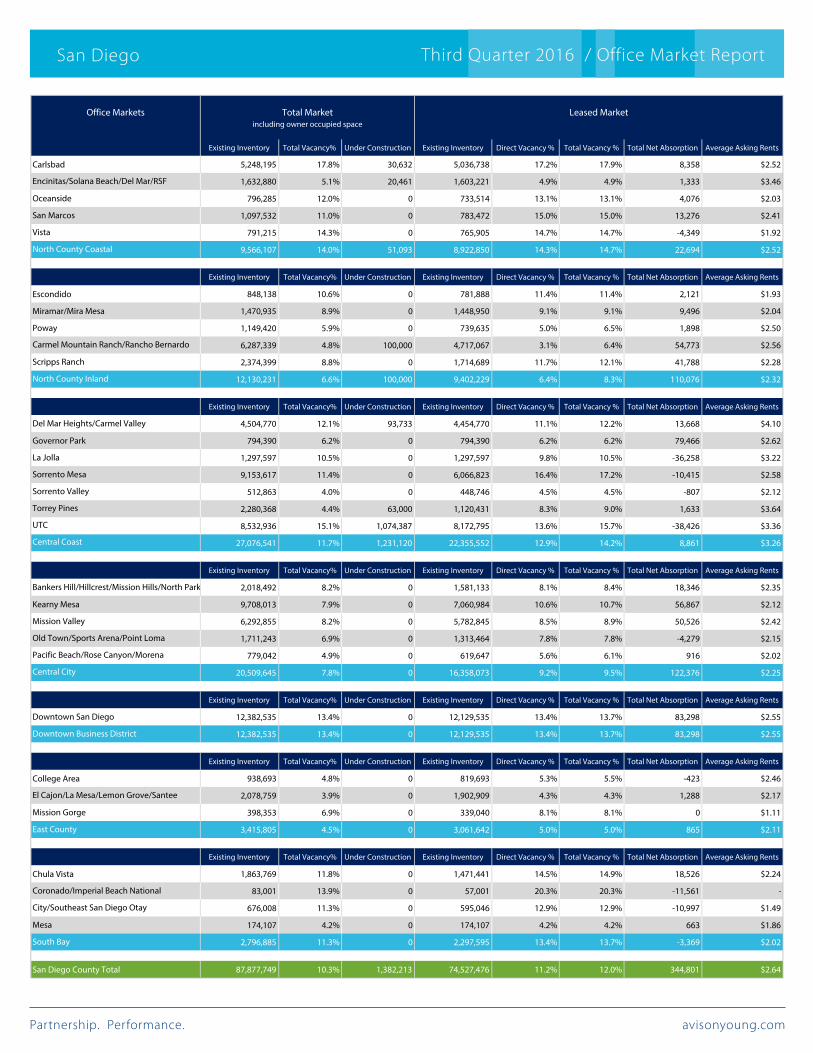
San Diego Third Quarter 2016 / Office Market Report
Office Markets
Existing Inventory Total Vacancy% Under Construction Existing Inventory Direct Vacancy % Total Vacancy % Total Net Absorption Average Asking Rents
5,248,195 17.8% 30,632 5,036,738 17.2% 17.9% 8,358 $2.52
1,632,880 5.1% 20,461 1,603,221 4.9% 4.9% 1,333 $3.46
796,285 12.0% 0 733,514 13.1% 13.1% 4,076 $2.03
1,097,532 11.0% 0 783,472 15.0% 15.0% 13,276 $2.41
791,215 14.3% 0 765,905 14.7% 14.7% -4,349 $1.92
Carlsbad
Encinitas/Solana Beach/Del Mar/RSF
Oceanside
San Marcos
Vista
North County Coastal 9,566,107 14.0% 51,093 8,922,850 14.3% 14.7% 22,694 $2.52
Existing Inventory Total Vacancy% Under Construction Existing Inventory Direct Vacancy % Total Vacancy % Total Net Absorption Average Asking Rents
848,138 10.6% 0 781,888 11.4% 11.4% 2,121 $1.93
1,470,935 8.9% 0 1,448,950 9.1% 9.1% 9,496 $2.04
1,149,420 5.9% 0 739,635 5.0% 6.5% 1,898 $2.50
6,287,339 4.8% 100,000 4,717,067 3.1% 6.4% 54,773 $2.56
2,374,399 8.8% 0 1,714,689 11.7% 12.1% 41,788 $2.28
Escondido
Miramar/Mira Mesa
Poway
Carmel Mountain Ranch/Rancho Bernardo
Scripps Ranch
North County Inland 12,130,231 6.6% 100,000 9,402,229 6.4% 8.3% 110,076 $2.32
Existing Inventory Total Vacancy% Under Construction Existing Inventory Direct Vacancy % Total Vacancy % Total Net Absorption Average Asking Rents
4,504,770 12.1% 93,733 4,454,770 11.1% 12.2% 13,668 $4.10
794,390 6.2% 0 794,390 6.2% 6.2% 79,466 $2.62
1,297,597 10.5% 0 1,297,597 9.8% 10.5% -36,258 $3.22
9,153,617 11.4% 0 6,066,823 16.4% 17.2% -10,415 $2.58
512,863 4.0% 0 448,746 4.5% 4.5% -807 $2.12
2,280,368 4.4% 63,000 1,120,431 8.3% 9.0% 1,633 $3.64
8,532,936 15.1% 1,074,387 8,172,795 13.6% 15.7% -38,426 $3.36
Del Mar Heights/Carmel Valley
Governor Park
La Jolla
Sorrento Mesa
Sorrento Valley
Torrey Pines
UTC
Central Coast 27,076,541 11.7% 1,231,120 22,355,552 12.9% 14.2% 8,861 $3.26
Existing Inventory Total Vacancy% Under Construction Existing Inventory Direct Vacancy % Total Vacancy % Total Net Absorption Average Asking Rents
2,018,492 8.2% 0 1,581,133 8.1% 8.4% 18,346 $2.35
9,708,013 7.9% 0 7,060,984 10.6% 10.7% 56,867 $2.12
6,292,855 8.2% 0 5,782,845 8.5% 8.9% 50,526 $2.42
1,711,243 6.9% 0 1,313,464 7.8% 7.8% -4,279 $2.15
779,042 4.9% 0 619,647 5.6% 6.1% 916 $2.02
Bankers Hill/Hillcrest/Mission Hills/North Park
Kearny Mesa
Mission Valley
Old Town/Sports Arena/Point Loma
Pacific Beach/Rose Canyon/Morena
Central City 20,509,645 7.8% 0 16,358,073 9.2% 9.5% 122,376 $2.25
Existing Inventory Total Vacancy% Under Construction Existing Inventory Direct Vacancy % Total Vacancy % Total Net Absorption Average Asking Rents
12,382,535 13.4% 0 12,129,535 13.4% 13.7% 83,298 $2.55Downtown San Diego
Downtown Business District 12,382,535 13.4% 0 12,129,535 13.4% 13.7% 83,298 $2.55
Existing Inventory Total Vacancy% Under Construction Existing Inventory Direct Vacancy % Total Vacancy % Total Net Absorption Average Asking Rents
938,693 4.8% 0 819,693 5.3% 5.5% -423 $2.46
2,078,759 3.9% 0 1,902,909 4.3% 4.3% 1,288 $2.17
398,353 6.9% 0 339,040 8.1% 8.1% 0 $1.11
College Area
El Cajon/La Mesa/Lemon Grove/Santee
Mission Gorge
East County 3,415,805 4.5% 0 3,061,642 5.0% 5.0% 865 $2.11
Existing Inventory Total Vacancy% Under Construction Existing Inventory Direct Vacancy % Total Vacancy % Total Net Absorption Average Asking Rents
1,863,769 11.8% 0 1,471,441 14.5% 14.9% 18,526 $2.24
83,001 13.9% 0 57,001 20.3% 20.3% -11,561 -
676,008 11.3% 0 595,046 12.9% 12.9% -10,997 $1.49
174,107 4.2% 0 174,107 4.2% 4.2% 663 $1.86
Chula Vista
Coronado/Imperial Beach National
City/Southeast San Diego Otay
Mesa
South Bay 2,796,885 11.3% 0 2,297,595 13.4% 13.7% -3,369 $2.02
San Diego County Total 87,877,749 10.3% 1,382,213 74,527,476 11.2% 12.0% 344,801 $2.64
Total Marketincluding owner occupied space
Leased Market
avisonyoung.com
© 2016 Avison Young - Southern California, Ltd. All rights reserved. E. & O.E.: The information contained herein was obtained from sources which we deem reliable and, while thought to be correct, is not guaranteed by Avison Young.
213.935.7435
Regional Managing Director: Chris Cooper - Corporate 555 S Flower St, Ste 3200 Los Angeles, CA [email protected]
Contact Information - Southern California, United States
213.935.7430 323.851.6666 310.899.1800
Los Angeles - Downtown 555 S Flower St, Ste 3200Los Angeles, CA 90071 Primary Contact: Ted [email protected]
Los Angeles - North6711 Forest Lawn DrLos Angeles, CA 90068 Primary Contact: Mark Evanoff [email protected]
Los Angeles - West10940 Wilshire Blvd, Ste 2100 Los Angeles, CA 90024 Primary Contact: Jonathan Larsen [email protected]
Los Angeles - Santa Monica 301 Arizona Ave, Ste 303 Santa Monica, CA 90401 Primary Contact: Randy [email protected]
San Diego - La Jolla4225 Executive Sq, Ste 600 La Jolla, CA 92037Primary Contact: Jerry Keeney [email protected]
858.201.7077
Orange County - Irvine 2030 Main Street, Ste 150 Irvine, CA 92614Primary Contact: Stan Yoshihara [email protected] 858.201.7072
Report Prepared By:Amber Jagers - Research Manager 4225 Executive Sq, Ste 600La Jolla, CA [email protected]
213.471.1069
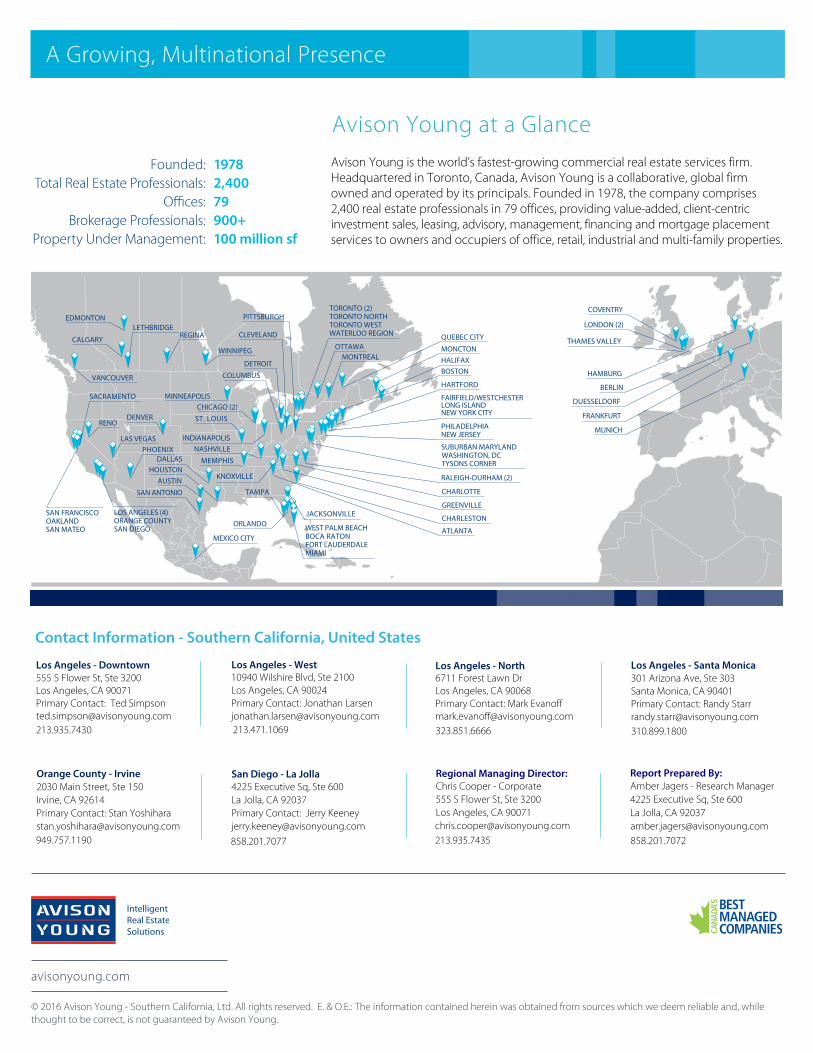
A Growing, Multinational Presence
Avison Young is the world’s fastest-growing commercial real estate services firm. Headquartered in Toronto, Canada, Avison Young is a collaborative, global firm owned and operated by its principals. Founded in 1978, the company comprises 2,400 real estate professionals in 79 offices, providing value-added, client-centric investment sales, leasing, advisory, management, financing and mortgage placement services to owners and occupiers of office, retail, industrial and multi-family properties.
Avison Young at a Glance
GREENVILLE
ATLANTA
EDMONTON
CALGARY
MINNEAPOLISCHICAGO (2)
DETROIT
COLUMBUS
CHARLOTTE
BOSTONHALIFAXMONCTONOTTAWA
MONTREAL
QUEBEC CITYCLEVELAND
PITTSBURGH
LAS VEGAS
RENO
INDIANAPOLIS
SACRAMENTO
LOS ANGELES (4)ORANGE COUNTYSAN DIEGO
TORONTO (2)TORONTO NORTHTORONTO WESTWATERLOO REGION
RALEIGH-DURHAM (2)
PHILADELPHIANEW JERSEY
SUBURBAN MARYLANDWASHINGTON, DCTYSONS CORNER
FAIRFIELD/WESTCHESTER LONG ISLANDNEW YORK CITY
SAN FRANCISCOOAKLANDSAN MATEO
DENVER
WINNIPEG
REGINA
CHARLESTON
HAMBURG
LONDON (2)
THAMES VALLEY
FRANKFURT
MUNICH
DUESSELDORF
BERLIN
NASHVILLE
KNOXVILLE
ST. LOUIS
MEMPHIS
HARTFORD
MEXICO CITY
COVENTRY
TAMPA
ORLANDO
DALLASHOUSTON
AUSTIN
SAN ANTONIO
PHOENIX
VANCOUVER
LETHBRIDGE
WEST PALM BEACH BOCA RATON
JACKSONVILLE
FORT LAUDERDALEMIAMI
Founded: 1978 Total Real Estate Professionals: 2,400
Offices: 79Brokerage Professionals: 900+
Property Under Management: 100 million sf